Abstract
In order to seek the value-added utilization method of sewage sludge and develop low-cost and high-efficient adsorbents, a hydrochar was prepared by the co-hydrothermal carbonization of sewage sludge and citric acid and then characterized. The differences in Pb(II) adsorption performance between the citric acid–sewage sludge hydrochars (AHC) and the hydrochar prepared solely from sewage sludge (SSHC) were also investigated. When citric acid dose ratio (mass ratio of citric acid to dry sewage sludge) is 0.1, the obtained hydrohcar (AHC0.1) has the highest specific surface area (59.95 m2·g−1), the most abundant oxygen-containing functional groups, the lowest pHpzc (5.43), and the highest equilibrium adsorption capacity for Pb(II). The maximum adsorption capacity of AHC0.1 for Pb(II) is 60.88 mg·g−1 (298 K), which is approximately 1.3 times that of SSHC. The potential mechanisms can be electrostatic attraction, co-precipitation, complexation, and cation-π interaction. It was demonstrated that by incorporating citric acid into the hydrothermal carbonization, resource utilization of sewage sludge can be accomplished effectively.
1. Introduction
Sewage sludge output in China rises in lockstep with the sewage treatment capacity. In 2020, the national sludge output reached 52.92 million tons [1]. Sewage sludge typically has a high moisture content, low density, poor dewaterability, and contains a considerable amount of harmful compounds such as organic pollutants, heavy metals. and pathogenic microorganisms [2,3], making its treatment and disposal troublesome under the stringent environmental regulations and relatively low subsidies [4]. As a result, the conventional sewage sludge treatment and disposal technologies are not effective and efficient enough to deal with the dilemma. Landfilling and soil utilization may result in the secondary pollution from organic contaminants and heavy metals, potentially exacerbating the already severe soil contamination in China [5]. Bio-chemical treatments, for example anaerobic digestion, have some drawbacks, such as the lengthy treatment cycle, limited treatment efficiency, and poor operational stability. Traditional thermal treatments such as incineration, pyrolysis, and gasification can recover the heat from sewage sludge, but the feedstock needs pre-drying. Recently, many novel drying methods, like roof solar drying methods [6] and chemical-assisted drying methods [7], have been developed, which can solve the problem of high energy consumption of the conventional thermal drying methods. However, the traditional thermal treatments are still not without drawbacks such as high complexity of the system, high construction cost, and the release of secondary environmental pollutants (NOx, SOx, dioxins, etc.) [8].
Recently, the hydrothermal carbonization has been considered to be a technology that can realize the reduction, harmless treatment, and resource utilization of sewage sludge effectively and efficiently. Hydrothermal carbonization of sewage sludge is typically conducted under 180~260 °C and spontaneous pressure (usually saturated pressure) without the need for pre-drying of its feedstock, resulting in relatively lower energy consumption compared with traditional thermal treatments [9,10,11]. Heavy metals could be enriched and stabilized in solid products during the hydrothermal carbonization of sewage sludge, and contaminants are released less, making it more ecologically benign [9].
The end products are mostly solid carbonaceous solids (hydrochar), organic-rich liquids (process water), and a little amount of gas (mainly CO2). The multiphase distribution of the products facilitates the comprehensive utilization of sewage sludge. The process water can be anaerobically digested for biogas production [12]. As for hydrochar, it has been widely studied and applied to energy recovery [13], water purification [5], and soil remediation [10,14]. Among them, the utilization of sewage sludge derived hydrochar as adsorbents for water remediation might be more competitive, profitable, and suitable for the volarization of sewage sludge.
Water pollution caused by heavy metals(especially Pb, Cr, Cd, etc.) has become a prominent challenge. Numerous treatment methods have been investigated and applied for heavy metal removal from wastewater, including adsorption, membrane methods (ultra-, nano-, micro-filtration, reverse osmosis, and electrodialysis), chemical method (precipitation, coagulation, and flocculation and flotation), ion exchange, electrochemical methods, photocatalytic methods, and coupled methods like adsorptional photocatalysis [15,16,17,18]. Compared with the others, adsorption has the advantages of easy operation, low cost, and high removal efficiency. Developing highly efficient and cost-effective adsorbents has attracted much attention and research interest, especially carbonaceous adsorbents prepared through thermo-chemical transformation of biowastes.
It has been reported that sewage sludge-based hydrochars (SSHC) are rich in surface functional groups and various minerals, which makes it suitable for the preparation of highly-efficient and low-cost adsorbents for heavy metal removal from water. The abundant oxygen-containing groups and nitrogen-containing groups in SSHC [19,20] (derived from the proteins, lignocelluloses, lipids, and other organics in sewage sludge) can coordinate or complex with heavy metal ions in the water. Heavy metal ions in aqueous solution can be also eliminated by precipitation with minerals like phosphates and silicates in SSHC. However, SSHC is of relatively poor pore structure, with a specific surface area of 6.3–17.3 m2·g−1 [19,20,21], which results in relatively few exposed adsorption sites and thus severely restricted adsorption performance. Thus, the additional activation was commonly adopted and the significant improvement was achieved [8,21], but the energy consumption greatly increased. In-situ modification seems more energy-saving and cost-effective.
Researchers have tried to incorporate additives into the hydrothermal carbonization of biomass and solid waste in order to increase carbonization degree, promote the etching of biomass, and or enhance ash removal. Hydrochloric acid, sulfuric acid, and phosphoric acid, as well as zinc chloride and aluminum chloride, are the most frequently used additives [22,23,24]. However, it is difficult to promote these technologies due to the corrosiveness of additives and the environmental issues associated with the use of inorganic acids and salts (highly salty and acidic wastewater discharge, etc.), even though the adsorption performance of the obtained hydrochars has been improved.
Citric acid is a readily available, environmentally friendly, and inexpensive organic acid that is frequently used as a cross-linking agent. As an additive into the hydrothermal carbonization of sewage sludge and other solid wastes, citric acid has been studied for improving the combustion performance of the products [25] and enhancing the recovery of phosphorus [26]. It has been found that citric acid, like the inorganic strong acids, can promote the hydrolysis and carbonization of biomass and the dissolution of ash during hydrothermal carbonization [25,27,28], as well as to enhance the cross-linking and stacking of carbon structures [29]. Its addition into the hydrothermal carbonization of sewage sludge can probably increase the specific surface area and surface functional groups of the produced hydrochar at the same time, which benefits its application as adsorbents.
Thus, in this study, the hydrochars were prepared through the co-hydrothermal carbonization of sewage sludge and citric acid and applied to eliminate Pb(II) from aqueous solution. The main objective of this study was to provide some insight into the effect of citric acid addition in the hydrothermal carbonization of sewage sludge on the adsorbents-related physicochemical properties and the heavy metal adsorption performance of the produced hydrochars. For this purpose, the specific tasks of this research were to: (1) characterize the produced hydrochars by elemental analysis, proximate analysis, diffuse reflectance Fourier transform infrared spectroscopy (DRIFT), X-ray photoelectron spectroscopy (XPS), pHpzc titration, Boehm titration, X-ray diffraction spectroscopy (XRD), N2 adsorption/desorption isotherms, scanning electron microscopy (SEM), and thermogravimetric analysis(TGA); (2) investigate and compare the adsorption of Pb(II) onto the hydrochars by batch experiments; and (3) acquire the further insight into the potential adsorption mechanism.
2. Materials and Methods
2.1. Materials and Reagents
The sewage sludge (SS) was collected from a domestic wastewater treatment plant in Nanjing, with its water content of 83.4%. The chemical reagents used, including citric acid monohydrate (C6H8O7·H2O), lead nitrate (Pb(NO3)2), potassium nitrate(KNO3), nitric acid (HNO3), and sodium hydroxide(NaOH), were all analytically pure and purchased from Sinopharm chemical reagent Shanghai Co.,Ltd(Shanghai, China).
2.2. Preparation of SS-Derived Hydrochars
In the quartz liner of a 100-mL autoclave (TGYF-0.1L, Zhengzhou Taiyuan, Zhengzhou, China), 40 g of SS with an 85% water content was modulated, and citric acid (CA) was added at dose ratios (dose ratio (Dm) = citric acid/SS dry weight) of 0.005 to 0.5. The autoclave was flushed with nitrogen gas (100 mL·min−1) for 10 min and then sealed with the inner gauge pressure maintaining 1.0 MPa. Then, the mixture was heated at 180 °C for 2 h. After allowing the reactor to cool naturally to the ambient temperature, the product was filtered and the filter residue was agitated for 24 h at 250 rpm in 500 mL of deionized water. The citric acid-sludge hydrothermal carbon (AHC) was obtained after drying at 105 °C for 8 h and then grinding through a 100 mesh screen, and the AHC prepared at a certain citric acid dose ratio (Dm) was denoted as AHCDm, for example, when Dm = 0.1, the produced hydrochar can be referred to as AHC0.1. In the same manner as AHC, SSHC was produced solely from sewage sludge.
2.3. Characterization
The C, H, N, and S contents of the feedstock (dry SS) and the SS-derived hydrochars (including SSHC, AHC0.1, and AHC0.5) were determined using an elemental analyzer (Vario EL III, Elementar, Langenselbold, Hesse, Germany) and O content was calculated by difference, and the proximate analysis was carried out according to GB/T 28731-2012 “Proximate analysis method for solid biomass fuels”. DRIFT analysis (Nicolet iS50, Thermo Scientific, Waltham, MA, USA) was performed on SS and the SS-derived hydrochars, the scanning range: 4000 to 650 cm−1, the vertical axis was Kubelka–Munk. The mineral composition of the produced hydrochars was determined using XRD (Ultima IV, Rigaku, Tokyo, Japan) with the following operational parameters: Cu-Kα radiation, 40 KV/40 mA, 2θ = 5~90°, scanning speed = 2°/min. And X’pert Highscore Plus software (Malvern Panalytical) was used for XRD spectra analysis. The X-ray photoelectron spectroscopy (Nexsa, Thermo Scientific, Waltham, MA, USA) was applied to conduct the surface elemental analysis on the SS-derived hydrochars. The high-resolution spectra were calibrated by resetting the binding energy of C1s as 284.8 eV and de-convoluted using Avantage (Thermo Scientific). The surface area, pore volume, and pore size distribution of the hydrochars were characterized by Tristar II 3020 (Micromeritics Instruments, Norcross, GA, USA). For the hydrochars, pHpzc was determined by the IT method described in Fiol’s study [30], and a Boehm titration was also performed [31]. Thermogravimetric analysis was conducted from 0 to 900 °C with a heating speed of 10 °C/min, under nitrogen atmosphere (N2 flow was 30 mL/min). Scanning electron microscopy was done using Regulus 8100 (Hitachi, Tokyo, Japan). The AHC0.1 after adsorption of Pb(II) (Pb@AHC0.1) was also characterized by XRD, DRIFT, and XPS for the adsorption mechanism study.
2.4. Adsorption Experiment
2.4.1. Effects of Dm
The equilibrium adsorption experiments of Pb(II) by SS-derived hydrohcars prepared under different Dm (citric acid dose ratio in the AHC preparation) were conducted. For each experiment, 0.1 g of hydrochar was dosed into a 100 mg·L−1 Pb(II) solution of which pH had been adjusted to 4 using 0.1 M HNO3 solution and 0.1 M NaOH solution. The mixtures were shaken at 250 rpm and 298 K for 8 h in a thermostatic shaker.
2.4.2. Effects of Adsorption Parameters
The adsorption of Pb(II) by SSHC, AHC0.1 and AHC0.5 was studied in terms of initial pH (1–8100 mg/L), reaction time (15–480 min), initial concentration of Pb(II) solution (100–500 mg·L−1) and temperature (25–55 °C). The volume of adsorbates and the dosage of hydrochars were set as 50 mL and 0.1 g, respectively, for all of the experiments After the adsorbed solution was filtered through a 0.45-μm membrane, the residual concentration of Pb(II) (Ct, mg·L−1) was determined by ICP-OES, and the adsorbed amount and removal rate was hence calculated by Equations (1) and (2). Visual MINTEQ 3.0 was used to determine the Pb(II) ionic species distribution.
2.4.3. Ion Exchange
SS-derived hydrochars contain a large amount of metal cations, mainly K+, Na+, Ca2+, Mg2+, Al3+, and Fe3+, their release into the solution in the adsorption process of Pb(II) can be caused by dissolution of salts, ion exchange with Pb(II) and H+. Hence, in order to assess the influence of phenomenological ion exchange on Pb(II) removal by AHC0.1, the effect of dissolution and H+ should be deducted. Thus, AHC0.1 was added at the same dosage ratio of 0.1 g/50 mL to the Pb(II) solution (solution α: 100 mg·L−1, pH was tuned by 0.1 M HNO3) and nitric acid solution at the same pH (solution β), shaken at 250 rpm and 298 K for 24 h. Then the difference of the change in the total amount of cation charge per unit mass of AHC0.1 (including H+, K+, Na+, Mg2+, Ca2+, Al3+, and Fe3+, but not Pb(II)) before and after agitation between solution α and solution β, which is named as Δqoc, can be regarded as the result of ion exchange of them with Pb(II). The definition of Δqoc is presented in Equations (2) and (3). The concentration of the metal cationic ions and H+ in the solutions before and after agitation can be determined by ICP-OES and a pH meter, respectively.
2.5. Statistical Analysis
Adsorbed amount (qt, mg·g−1) was calculated by the following equation:
where: C0 is the concentration of Pb(II) before adsorption, mg·L−1; V is the volume of adsorbate solution, L; M is the dosage of hydrothermal carbon, g.
The Equations (2) and (3) was used to calculate Δqoc.
And the definition of the ion exchange ratio (IER) is given as follow:
where: “i” represents cationic ions including H+, K+, Na+, Mg2+, Ca2+, Al3+, and Fe3+; Ii is the charge of the certain cationic ion; Citα and Citβ are the concentration of the certain cation after agitation in solution α and solution β respectively, mmol/L; Ci0α and Ci0β are the concentration of the certain cation in solution α and β before agitation, mmol/L, and they are considered as 0 here. Vα and Vβ are the volume of solution α and β, here Vα = Vβ = 50 mL; Mα and Mβ are the mass of AHC0.1 dosed into solution α and solution β, respectively, Mα = Mβ = 0.1 g here; qePb stands for the equilibrium adsorption amount of Pb, mmol/L. IER was used to assess the contribution of phenomenological ion exchange to the Pb(II) adsorption.
The pseudo-first-order and pseudo-second-order models were used for the adsorption kinetics fitting, and their non-linear forms are shown in Equations (5) and (6) [32].
where: qe is the equilibrium adsorption uptake of adsorbate, mg·g−1; qt is the adsorption uptake of adsorbate at time t, mg·g−1; K1 is the pseudo-first-order adsorption kinetic constant, and K2 is the pseudo-second-order adsorption kinetic constant. Non-linear regression was used to determine the coefficients.
Langmuir isotherm and Freundlich isotherm were used to simulate the adsorption isotherm of Pb(II) by SSHC and AHC0.1 in this study. Their linear forms are presented as follows [33]:
where: qe is the equilibrium adsorption capacity, mg·g−1; qmax represents the theoretical maximum adsorption capacity, mg·g−1. KF stands for Freundlich constant, while KL is Langmuir constant. The linear regression was applied for the parameter determination.
BET isotherm model, as a multilayer adsorption isotherm model, was also considered to simulate the data of Pb(II) adsorption by AHC0.1 and SSHC [34,35]:
where Cs stands for monolayer saturation concentration, mg·L−1, CBET denotes BET constants, L·mg−1, qs represents isotherm saturation capacity, mg·g−1.
Adsorption thermodynamic parameters include Gibbs free energy change (ΔG, J·mol−1), enthalpy change (ΔH, J·mol−1), and entropy change (ΔS, J·mol−1·L−1), and they follow the following equations:
Since it was proved that the adsorption of SSHC and AHC0.1 fitted Langmuir model well, then [36]:
where: T is the adsorption temperature, K; K is the equilibrium constant; R is the ideal gas constant, 8.314 J·mol−1·K−1; KL, L·mol−1; Cr is the reference concentration, which is regarded as 1 mol·L−1; γe is the ionic strength at adsorption equilibrium (the ion concentration is low, γe ≈ 1), that is, take the value: K = KL. The thermodynamic parameters can be obtained by plotting ln(K) against 1/T followed by linear fitting.
3. Results and Discussion
3.1. Characterization of SS-Derived Hydrochars
3.1.1. Ultimate and Proximate Analysis
Ultimate analysis and proximate analysis of SS and the SS-derived hydrochars are listed in Table 1. The mass contents of C, H, O, N, and S in SS are 26.53%, 6.47%, 17.42%, 4.72%, and 0.72%, respectively, and drastically decrease by 26.69%, 50.08%, 41.85%, 66.53%, and 33.3%, individually, after the hydrothermal carbonization of SS, indicating the decomposition of massive organics from the solid phase into liquid and gas phase. SS has a H/C of 2.93 and an O/C of 0.49, respectively. The H/C and O/C values of SSHC (1.99 and 0.39, respectively) are significantly lower than those of SS, indicating that hydrothermal carbonization can enhance SS’s aromaticity and hydrophobicity. The proximate analysis reveals that hydrothermal carbonization could reduce the volatile content of SS (from 50.19% to 29.11%) but increase its fixed carbon content and ash content.

Table 1.
Ultimate analysis and proximate analysis of SS and SS-derived hydrochars.
The addition of citric acid has an great influence on the elemental contents of AHC0.1 and AHC0.5 relative to SSHC, and this influence varies with the citric acid dose ratio. AHC0.5 (21.65%) has the largest C content among the hydrochars, while the C content of AHC0.1 (18.64%) is 4.16% lower than that of SSHC (19.45%). The H contents of AHC0.1 and AHC0.5 are 7.43% and 13.93% lower than SSHC, respectively. It is worth noting that the H/C value of AHC0.1 (1.92) and AHC0.5 (1.54) are both lower than that of SSHC (1.99), suggesting that the addition of citric acid can increase the carbonization degree of the products. The O/C value of SSHC, AHC0.1, and AHC0.5 are 0.39, 0.48, and 0.32, respectively, indicating that when Dm = 0.1, the hydrophilicity and the oxygen-containing functional groups quantity of the obtained hydrochar (AHC0.1) are higher than those of SSHC and AHC0.5. Additionally, it is shown in proximate analysis that AHC0.1 and AHC0.5 have lower ash contents than SSHC, suggesting that citric acid might actually etch the ash content.
3.1.2. DRIFT and Boehm Titration
Figure 1 illustrates the DRIFT spectra of SS and the SS-derived hydrochars. The broad and blunt absorption peak near 3274 cm−1 is attributed to the stretching vibration of −OH and −NH [37,38]. The absorption peak between 3000 to 2800 cm−1 is related to the −CH3 and −CH2− groups in the saturated hydrocarbon chain. The peak at 1668 cm−1 [39] and 1645 cm−1 are caused by the stretching vibration of C=O in the carboxylic acid or amide I bands [40,41]. The absorption peaks at 1539 and 1558 cm−1 indicate the bending vibration of N−H in the amide II band (protein source) [41]. The absorption peaks at 1608 and 1454 cm−1 are the C=C stretching vibration peaks in the aromatic ring [40,42]; The peak located at 1157 cm−1 corresponds to glycoside C−O−C [40,42]. The absorption peak at 1057 cm−1 is related to C−O−R (ether) or Si−O [42]. The peaks at 810 and 698 cm−1 can be ascribed to the out-of-plane CH bending vibration peak or the vibration absorption peak of N−H in pyrrole and pyridine [42].
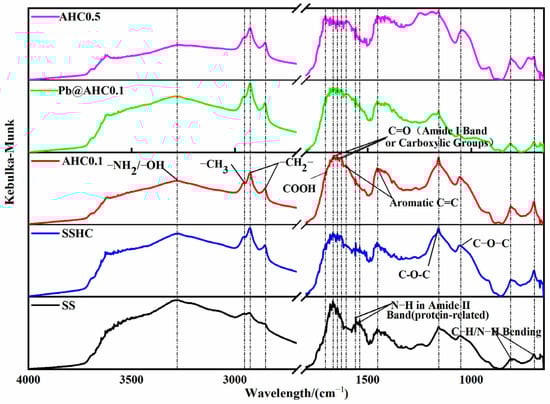
Figure 1.
DRIFT spectra of SS, SS-derived hydrochars, and Pb@AHC0.1.
As the citric acid dose ratio increases, the peak intensity of the amide II band (1539 cm−1 and 1558 cm−1) reduces dramatically, whereas the absorption peak intensities of −NH/−OH (3274 cm−1) and saturated hydrocarbon chains (3000–2800 cm−1) decline. The intensities of the aromatic ring and nitrogen-containing heterocyclic ring (1608, 1454, 810, and 698 cm−1) slightly increase with citric acid dosage, indicating that the addition of citric acid might enhance the hydrolysis of proteins and promote the dehydration, deamination, and aromatization, thereby enhancing the aromaticity and carbonization degree of the produced hydrochar, which complies with the elemental analysis results.
In order to quantitatively analyze the influence of citric acid addition on the surface functional groups on the produced hydrochars, the Boehm titration method was employed. The results are shown in Table 2. In comparison with SSHC, AHC0.1 contains slightly more phenolic hydroxyl groups and has significantly higher content of lactone and carboxyl groups, and in the end its total amount of surface O-containing functional groups (1550 ueq·g−1) is also significantly higher. Additionally, the total amount of O-containing functional groups on the surface of AHC0.5 (660 ueq·g−1) is lower than that of SSHC. The results of Boehm titration are consistent with the interpretation of the elemental analysis. The pHpzc of AHC0.1 is 5.34 (seen in Table 2), which is lower than that of SSHC and AHC0.5, confirming that the number of O-containing functional groups on the surface is strongly related to pHpzc [43].
Table 2.
Content of oxygen-containing groups and pHpzc of SS-derived hydrochars.
3.1.3. XPS Analysis
The deconvolution results of C1s XPS spectra of SS-derived hydrochars are presented in Figure 2, in which C1, C2, C3, and C4 represent C−C, C−O/C−N, C=O, and O−C=O, respectively [14,44], and their relative contents are summarized in Table 3. The relative content of O−C=O on the surface AHC0.1 (9.56%) is significantly higher than that of AHC0.5 (6.22%) and SSHC (5.57%), which complies with the sequence of the content of lactone and carboxyl groups determined by Boehm titration. AHC0.5’s relative content of C−C (82.03%) is much higher than that of AHC0.1 (76.55%) and SSHC (74.91%), while its relative content of C−N/C−O is significantly lower than that of AHC0.1 and SSHC, implying the deamination and dehydration might be drastically enhanced in the preparation of AHC0.5.
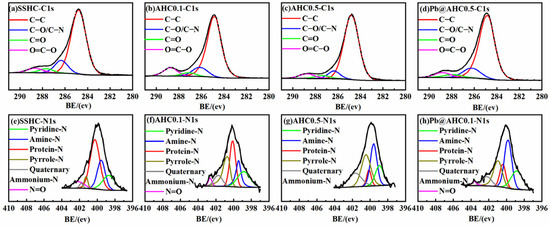
Figure 2.
C1s and N1s XPS spectra of SS-derived hydrochars and Pb@AHC0.1.
Table 3.
Deconvolution results of C1s and N1s spectra.
The N1s fine spectra of SSHC, AHC0.1, and AHC0.5 are deconvoluted as N1(pyridine-N), N2(amine-N), N3(protein-N), N4(pyrrole-N), N5(quaternary ammonium-N), and N6(N=O) [13,43] and presented in Figure 2e–g and Table 3. With the increase of citric acid dosage, the relative contents of protein-N and N=O decrease, while the relative contents of pyrrole-N and quaternary ammonium-N change inversely, indicating that citric acid boosts the hydrolysis of protein and the formation of nitrogen-containing heterocycles, which agrees with the weakening amide band II in DRIFT’s findings.
3.1.4. SEM
SEM was applied to study the morphology evolution from sewage sludge to hydrochars. As depicted in Figure 3a, dry sewage sludge can be regarded as clustered aggregates with smooth surface and few pores. Compared with dry sewage sludge, SSHC exhibits a much rougher surface with more pores, which might be caused by the release of some volatile contents. This also indicates that hydrothermal carbonization can develop pore structure. In comparison with SSHC, AHC0.1 and AHC0.5 display more fragments, flakes, and sphere-like microparticles adhered to them. It can be deduced that addition of citric acid can promote the degradation of macro-organics and increase the carbonization degree. However, the effect of citric acid addition on the pore characteristics need quantitative analysis through N2 adsorption/desorption isotherms.
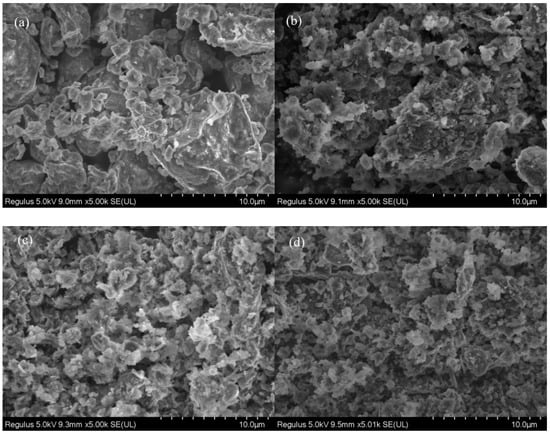
Figure 3.
SEM image of dry sewage sludge (a), SSHC (b), AHC0.1 (c), and AHC0.5 (d).
3.1.5. Nitrogen Adsorption/Desorption
Specific surface area (SSA), total pore volume and average pore size of SS-derived hydrochars are summarized in Table 4, and the N2 adsorption/desorption isotherm plots and the pore size distribution curves are shown in Figure 4. The N2 adsorption/desorption isotherm plots can be classified as type IV isotherm with H3 hysteresis loop [45], which indicates slit mesopores. The specific surface area of AHC0.1 is 59.95 m2·g−1, which is the largest among the SS-derived hydrochars and 31.67% higher than that of SSHC (45.53 m2·g−1), but the total pore volume values of AHC0.1 and SSHC are almost the same. The pores sizes of SSHC and AHC0.1 mainly fall within the range from 2 to 50 nm (seen in Figure 4), making them typically mesoporous materials. The average pore size and peak pore size of AHC0.1 are smaller than SSHC, which accounts for its higher value of specific surface area, implying citric acid can promote the formation of small pores at its dose ratio of 0.1. As for AHC0.5, its specific surface area and total pore volume are the poorest, the reason behind which might be the blockage of pores by macromolecular hydrophobic organics (like humic substances or Maillard products) generated.
Table 4.
Pore characteristics of SS-derived hydrochars.
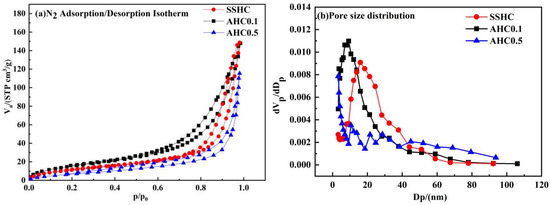
Figure 4.
N2 adsorption/desorption isotherm plots (a) and pore size distribution curves (b).
3.1.6. XRD Analysis
The XRD spectra of SSHC, AHC0.1, and AHC0.5 are shown in Figure 5a–c. They contain basically the same minerals, mainly quartz, aluminum phosphate (AlPO4), muscovites ((Na0.98Ca0.02) (Al1.02Si2.98O8), Na1.96Ca0.04Si5.96Al2.04O16.00 and Na0.986 (Al1.005Si2.995O8)), feldspars ((K0.94Na0.06) (AlSi3O8) and K0.94Na0.06Al0.95Si3.05O8), etc.. Although based on the XRD characterization results, the incorporation of citric acid had no obvious effect on the mineral components of the SS-derived hydrochar, but can effectively reduce its ash contents according to the proximate analysis. Pb(II) could be removed during the adsorption process through co-precipitation with these phosphates and silicates in these SS-derived hydrochars.
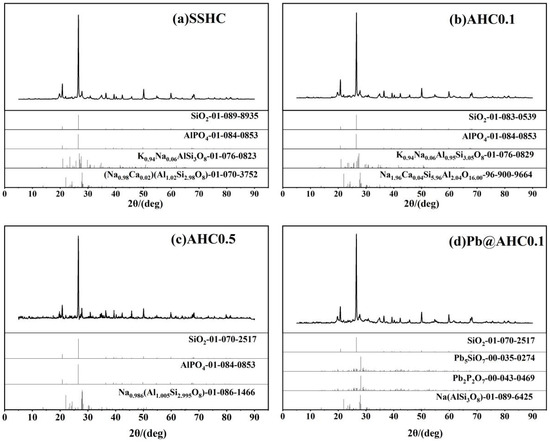
Figure 5.
XRD patterns of SS-derived hydrochars and Pb@AHC0.1.
3.1.7. TG/DTG
TG under N2 atmosphere was conducted and DTG curves were also considered for thermal properties of the hydrochars. The DTG curves can be divided as four weight loss regions. The first interval (region I) ranges from 0 to 200 °C and can typically be ascribed to the release of free water, bound water, and low-boiling-point organic compounds. Mass loss in the temperature interval of 200–400 °C(region II) can be attributed to the degradation of susceptible matters, including organic acids, alkyl moiety, and carbohydrates [46]. Region III ranges from 400 to 600 °C, of which weight loss resulted from the decomposition of aromatic compounds. And the transformation of inorganics occurred in the temperature interval of 600–800 °C (region IV). Apparently, the peak temperature in the DTG curve of SS is much lower than that of SSHC, with its DTG peak intensity much higher than that of hydrochars, indicating that hydrothermal carbonization can improve thermal stability. As seen in Figure 6b, the intensity of DTG peaks decrease with citric acid dose ratio in region I, demonstrating that citric acid can enhance the degradation of susceptible organics in hydrothermal carbonization of sewage sludge. And the region III can be further subdivided into two intervals. In the range of 400–500 °C, the DTG peak intensity of AHC0.1 is the highest while the others are almost the same, but in the range of 500–600 °C, the DTG peak intensity of AHC0.5 is higher than those of the others. The interpretation can be that AHC0.1 contains more “fragile” aromatic compounds than SSHC and AHC0.5, which is the precursor to the “recalcitrant” aromatic compounds that exist abundantly in AHC0.5, proving that enhanced aromatization are obtained with increasing citric acid, which is in accordance with the elemental analysis results and proximate analysis results(seen in Table 1).
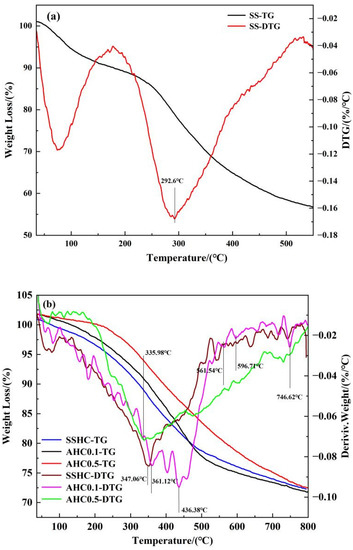
Figure 6.
TG/DTG curves of SS (a) SSHC, AHC0.1, and AHC0.5 (b).
On the whole, the addition of citric acid improved the thermal and chemical stability of the produced hydrochars. The hydrochars are supposed to be relatively stable when temperature is under 200 °C, which makes them suitable for adsorption application under normal circumstances.
3.2. Adsorption Study
3.2.1. Effect of Dose Ratio of Citric Acid
As illustrated in Figure 7, as the citric acid dose ratio increases from 0 to 0.1, the equilibrium adsorbed amount of Pb(II) on the SS-derived hydrochars also increase from 32.47 to 49.86 mg·g−1. Subsequently, the adsorbed amount decreases with the citric acid dose ratio (when it is larger than 0.1). The abrupt fall at the citric acid dose ratio of 0.5 might be caused by the reduction of adsorptive sites due to the decreased specific surface area (seen in Table 4), O-containing/N-containing groups (seen in Table 2 and Table 3) and inorganics (seen in Table 1). AHC0.1 prevails the others in the adsorption of Pb(II), which is primarily due to its higher contents of O-containing functional groups and higher value of specific surface area.
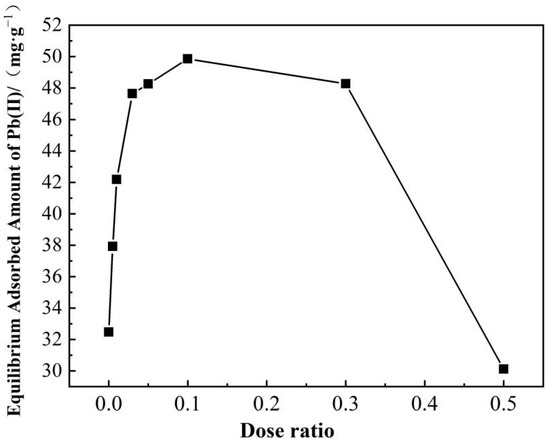
Figure 7.
Effects of dose ratio of citric acid on the adsorption of Pb(II) onto AHCs.
3.2.2. Effect of Initial pH
The effect of initial pH on the adsorption of Pb(II) by AHC0.1 and SSHC was studied and illustrated in Figure 8a. The adsorbed amount of Pb(II) onto SSHC gradually increased as the increasing initial pH, and reached the maximum at a pH of 8. The equilibrium uptake of Pb(II) by AHC0.1 increases rapidly as the initial pH increases from 1 to 4, but remains relatively stable within the pH range of 4–8 with a range value of only 0.31 mg·g−1. Most importantly, when the pH is between 3 and 6, AHC0.1 outperforms SSHC in terms of Pb(II) adsorption.
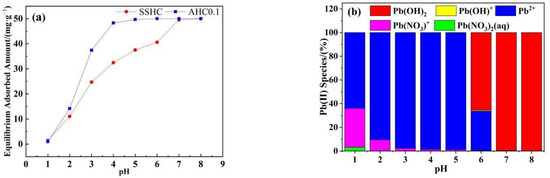
Figure 8.
Effects of initial pH on Pb(II) adsorption (a) and Pb species under different pH (b).
It has been reported that the pH of the solution can affect the surface charge of adsorbent, the degree of ionization and the species of adsorbate ions, which have an important impact on the adsorption process [47]. SSHC and AHC0.1 have pHpzc values of 6.07 and 5.34, respectively (seen in Table 2). The Pb(II) species at each initial pH calculated by Visual MINTEQ is shown in Figure 6b. When the pH of the solution is lower than the pHpzc of the adsorbent (AHC0.1 and SSHC) (pH ≤ 5), the surface of the adsorbent becomes protonated, and the main species of Pb(II) in the solution are Pb2+ and Pb(NO3)+,there is electrostatic repulsion between them hindering the adsorption. As the initial pH of the solution increases gradually, the repulsion between the adsorbent and Pb(II) weakens, allowing for the enhanced adsorption. When the pH of the solution exceeds the pHpzc of the adsorbent, the adsorbent’s surface de-protonates, and the predominant Pb species are Pb(OH)2, Pb2+, and Pb(OH)+, then the electrostatic attraction promotes the adsorption.
3.2.3. Adsorption Kinetics
Pseudo-first-order model and pseudo-second order model were applied for the model-fitting of adsorption kinetics of Pb(II) by SSHC and AHC0.1 to the experimental data with the results depicted in Figure 9 and model parameters summarized in Table 5. In spite of that, both models fit the kinetics well with R2 values higher than 0.98, but the pseudo-first-order model provides the best fit for both SSHC (R2 = 0.998) and AHC0.1 (R2 = 0.999), implying that the adsorption of Pb(II) by SSHC and AHC0.1 could be chemical processes [48]. AHC0.1 prevails SSHC in terms of adsorption rate of Pb(II) at the very early stage of the adsorption for its higher value of K2, denoting the adsorption sites on SSHC are more available to Pb(II). Furthermore, the qe of AHC0.1 (48.48 mg·g−1) is higher than that of SSHC (33.03 mg·g−1), which indicates that there are more adsorption sites for Pb(II) on AHC0.1. The results coincide with the larger specific area and richer O-containing functional groups of AHC0.1.
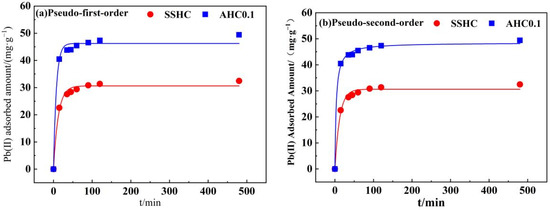
Figure 9.
Non-linear fitting of Pseudo-first-order model (a) and Pseudo-second-order model (b).
Table 5.
Adsorption kinetics parameters of Pb(II) onto SSHC and AHC0.1.
3.2.4. Adsorption Isotherms
The adsorption isotherms of Pb(II) by AHC0.1 and SSHC were simulated using Langmuir and Freundlich models. The fitting results are exhibited in Figure 8 and the model parameters are listed in Table 6. Langmuir adsorption isotherm was developed based on the assumption that adsorption occur on the homogeneous surface without interaction between the adsorbate ions. Freundlich adsorption isotherm was used to describe the multi-layer adsorption on heterogeneous surface.
Table 6.
Adsorption isotherms parameters of Pb(II) onto SSHC and AHC0.1.
According to the fitting results presented in Figure 10 and Table 6, the Langmuir model fits the experimental data significantly better than Freundlich model. However, the BET model cannot converge to all the adsorption data, so the adsorption of Pb(II) onto AHC0.1 and SSHC was supposed to be monolayer. Hence, the adsorption is less likely to be governed by physisorption [34]. Considering the result of the mechanism study mentioned below, the adsorption process is prone to be governed by chemisorption, but physisorption also exists.
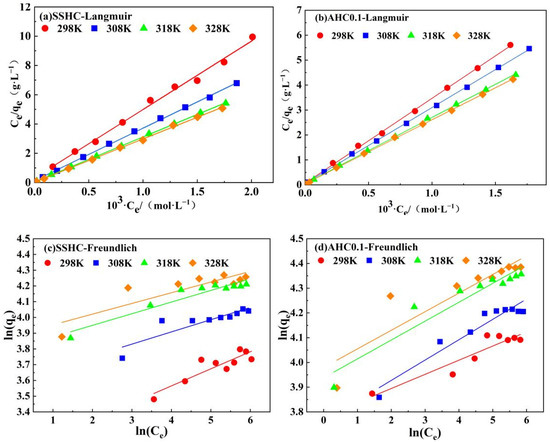
Figure 10.
Linear fitting of experimental data using Langmuir model and Freundlich model.
It is evident that AHC0.1′s affinity to Pb(II) at 298 K is stronger than that of SSHC for its higher value of KL (Langmuir constant). Moreover, AHC0.1’s qmax (maximum adsorption capacity) of Pb(II) (60.88 mg·g−1, at 298 K) is also about 30% higher than that of SSHC (44.34 mg·g−1, at 298 K). Besides, the adsorption of Pb(II) onto SSHC and AHC0.1 can be regarded as endothermic process because all the values of KL and qmax increase with adsorption temperature.
Although the specific surface area of AHC0.1 is relatively low (59.95 m2·g−1), but its maximum adsorption capacity of Pb(II) (60.88 mg·g−1) is superior or at least comparable to the majority of sewage sludge derived hydrochars, sewage sludge biochars and some hydrochars derived from other biomass (listed in Table 7), which might benefit from the rich O-containing/N-containing functional groups and inorganics (silicates and phosphates) in AHC0.1.
Table 7.
Comparison of maximum adsorption capacity of Pb(II) onto various adsorbents.
3.2.5. Adsorption Thermodynamics
As depicted in Figure 11, ln(K) is linearly well-related with 1/T. The thermodynamic parameters are summarized in Table 8. For the adsorption of Pb(II) by AHC0.1 and SSHC, there exists: ΔG < 0, ΔH > 0, ΔS > 0, and |TΔS| > ΔH, indicating that their adsorption of Pb(II) are spontaneous endothermic processes driven by entropy change. However, the adsorption enthalpy increase of SSHC is much higher than that of AHC0.1, which can be attributed to the lower absorbed heat for Pb(II) diffusion and the higher adsorption heat release in the adsorption of Pb(II) by AHC0.1 compared with SSHC due to its higher surface area and richer O-containing functional groups.
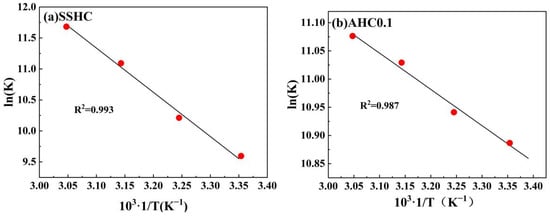
Figure 11.
Linear regressions of van’t Hoff plot.
Table 8.
Parameters of adsorption thermodynamics.
3.3. Adsorption Mechanism
As demonstrated in Figure 12, IER is in the range of 77.89% to 97.96% when the initial pH is between 2 and 6, indicating that the cation release (phenomenological ion exchange) contributes the most to the removal of Pb(II) by AHC0.1, and δCaICa accounts for the largest proportion in Δqoc (ΣδiIi), and δMgIMg takes second place, denoting that the migration of Ca2+ and Mg2+ might play an important role. The released divalent and trivalent metal cations (Me) should mainly originate from complexes like −COO-Me or -Ar-O-Me and/or from phosphate/silicate precipitates.
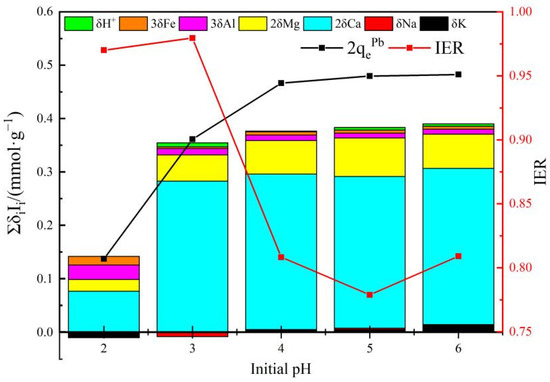
Figure 12.
Phenomenological ion exchange in the adsorption of Pb(II) by AHC0.1.
When pH = 2, the adsorbed amount of Pb(II) is rather low, and the selectivity of exchanged cation decreased, manifested by the lowest proportion of δCaICa in Δqoc within the whole pH range of 2–6, perhaps resulted from the dominated regeneration process caused by high concentration of H+ and the strong electrostatic repulsion [55]. And the value of IER is extremely close to 1 here, indicating that the phenomenological ion exchange domains, the fundamental mechanism might be co-precipitation/complexation with high bonding strength and cation-π interaction which is irrespective of pH change.
The value of Δqoc and the adsorbed amount of Pb(II) increase with initial pH, but the IER decreases, which can be interpreted by the weakening electrostatic repulsion and the preferentially enlarged exposure of aromatic C=C/C=N to Pb(II) which are potential adsorptive sites but non-essentially related to the phenomenological ion exchange.
Pb5SiO7 and Pb2P2O7 generated in the adsorption of Pb(II) by AHC0.1 were determined by XRD characterization (seen in Figure 5d), indicating that co-precipitation might play a significant role in the adsorption process. As illustrated in the DRIFT spectra of AHC0.1 and Pb@AHC0.1 (presented in Figure 1c,d), after the adsorption, the stretching vibration peak at 1057 cm−1 assigned to C−O−C migrated to 1061 cm−1 and its relative peak intensity significantly reduced; moreover, the out-of-plane C−H/N−H bending vibrational peak also significantly decreased. After AHC0.1 adsorbed Pb(II), the binding energy values of C=O (in carboxylates or aldehydes) and C−O/C−N increased by 0.69 and 0.12 eV, respectively, as depicted in Figure 2 and Table 3. Furthermore, the binding energy values of amine-N, protein-N, pyrrole-N, and −N=O also increased by 0.95, 1.00, 0.85, and 0.99 eV.
The DRIFT and XPS results indicate that O-containing groups(including C−O−C, C−O, and C=O), N-containing functional groups(including pyrrolic groups, −NH−, −NH2, and N=O) and aromatic groups play important part in the adsorption of Pb(II) by AHC0.1. Specifically, as depicted in Figure 13, C−O and C=O can adsorb Pb2+ by complexation or coordination; C−O−C, −NH−, −NH2, and N=O can coordinate with Pb2+, and aromatic groups and pyrrolic groups can adsorb Pb2+ through cation-π interaction. In summary, the adsorption of Pb(II) by AHC0.1 is widely influenced by complexation, precipitation, cation-π interaction, and electrostatic interaction.
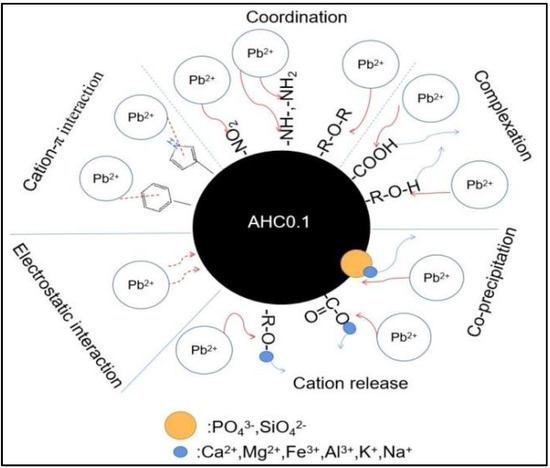
Figure 13.
Schematic of Pb(II) adsorption mechanism by AHC0.1.
4. Conclusions
A cost-effective adsorbent for Pb(II) was prepared by hydrothermal carbonization using sewage sludge and inexpensive citric acid as feedstock. The introduction of citric acid into the preparation of sewage sludge-derived hydrochar can effectively develop its pore structure, increase its surface functional groups, and improve its thermal and chemical stability. Demonstrated by the result of adsorption experiments, AHC0.1 has great adsorption ability for its fast adsorption kinetics and maximum adsorption capacity of 60.88 mg·g−1, which is competitive to other adsorbents. AHC0.1 adsorbs and removes Pb(II) mainly through its phenomenological ion exchange with other metal cations especially Ca2+ and Mg2+. Further, the adsorption can be mainly attributed to co-precipitation, complexation, cation-π interaction, and electrostatic interaction. Due to the low-cost feedstock, the facile production, and the significant potential of the produced hydrochar as adsorbents for heavy metal removal, the joint hydrothermal carbonization of citric acid and sewage sludge can achieve the value-added utilization of sewage sludge as adsorbents.
Author Contributions
Y.H.: Conceptualization, Investigation, Data curation, Writing-Original draft preparation; D.S.: Conceptualization, Supervision, Funding Acquisition, Writing-Review and Editing; Z.W.: Supervision, Funding acquisition, Writing-Review and Editing. All authors have read and agreed to the published version of the manuscript.
Funding
This study is financially supported by Department of Ecology and Environment of Jiangsu Province (ProjectNo.7603000097), the scientific research fund of Guizhou Minzu University (GZMUZK[2021]YB13) and the scientific research platform of Guizhou Minzu University (GZMUGCZX[2021]02).
Institutional Review Board Statement
Not applicable.
Informed Consent Statement
Not applicable.
Data Availability Statement
Not applicable.
Acknowledgments
This study is financially supported by Department of Ecology and Environment of Jiangsu Province (ProjectNo.7603000097), the scientific research fund of Guizhou Minzu University (GZMUZK[2021]YB13) and the scientific research platform of Guizhou Minzu University (GZMUGCZX[2021]02).
Conflicts of Interest
The authors declare no conflict of interest.
References
- Gao, N.; Li, Z.; Quan, C.; Miskolczi, N.; Egedy, A. A new method combining hydrothermal carbonization and mechanical compression in-situ for sewage sludge dewatering: Bench-scale verification. J. Anal. Appl. Pyrol. 2019, 139, 187–195. [Google Scholar] [CrossRef]
- Wang, Y.; Yu, Y.; Huang, H.; Yu, C.; Fang, H.; Zhou, C.; Yin, X.; Chen, W.; Guo, X. Efficient conversion of sewage sludge into hydrochar by microwave-assisted hydrothermal carbonization. Sci. Total Environ. 2022, 803, 149874. [Google Scholar] [CrossRef]
- Gao, N.; Kamran, K.; Quan, C.; Williams, P.T. Thermochemical conversion of sewage sludge: A critical review. Prog. Energy Combust. 2020, 79, 100843. [Google Scholar] [CrossRef]
- Feng, L.; Luo, J.; Chen, Y. Dilemma of Sewage Sludge Treatment and Disposal in China. Environ. Sci. Technol. 2015, 49, 4781–4782. [Google Scholar] [CrossRef] [PubMed]
- Niinipuu, M.; Latham, K.G.; Boily, J.; Bergknut, M.; Jansson, S. The impact of hydrothermal carbonization on the surface functionalities of wet waste materials for water treatment applications. Environ. Sci. Pollut. R 2020, 27, 24369–24379. [Google Scholar] [CrossRef] [PubMed]
- Wang, P.; Mohammed, D.; Zhou, P.; Lou, Z.; Qian, P.; Zhou, Q. Roof solar drying processes for sewage sludge within sandwich-like chamber bed. Renew. Energy 2019, 136, 1071–1081. [Google Scholar] [CrossRef]
- Danish, M.; Jing, H.; Pin, Z.; Ziyang, L.; Pansheng, Q. A new drying kinetic model for sewage sludge drying in presence of CaO and NaClO. Appl. Therm. Eng. 2016, 106, 141–152. [Google Scholar] [CrossRef]
- Liu, T.; Li, Y.; Peng, N.; Lang, Q.; Xia, Y.; Gai, C.; Zheng, Q.; Liu, Z. Heteroatoms doped porous carbon derived from hydrothermally treated sewage sludge: Structural characterization and environmental application. J. Environ. Manag. 2017, 197, 151–158. [Google Scholar] [CrossRef]
- Wang, L.; Chang, Y.; Li, A. Hydrothermal carbonization for energy-efficient processing of sewage sludge: A review. Renew. Sustain. Energy Rev. 2019, 108, 423–440. [Google Scholar] [CrossRef]
- Tasca, A.L.; Puccini, M.; Gori, R.; Corsi, I.; Galletti, A.M.R.; Vitolo, S. Hydrothermal carbonization of sewage sludge: A critical analysis of process severity, hydrochar properties and environmental implications. Waste Manag. 2019, 93, 1–13. [Google Scholar] [CrossRef]
- Shen, Y. A review on hydrothermal carbonization of biomass and plastic wastes to energy products. Biomass Bioenergy 2020, 134, 105479. [Google Scholar] [CrossRef]
- Merzari, F.; Langone, M.; Andreottola, G.; Fiori, L. Methane production from process water of sewage sludge hydrothermal carbonization. A review. Valorising sludge through hydrothermal carbonization. Crit. Rev. Env. Sci. Tec. 2019, 49, 947–988. [Google Scholar] [CrossRef]
- Wang, R.; Wang, C.; Zhao, Z.; Jia, J.; Jin, Q. Energy recovery from high-ash municipal sewage sludge by hydrothermal carbonization: Fuel characteristics of biosolid products. Energy 2019, 186, 115848. [Google Scholar] [CrossRef]
- Ren, J.; Wang, F.; Zhai, Y.; Zhu, Y.; Peng, C.; Wang, T.; Li, C.; Zeng, G. Effect of sewage sludge hydrochar on soil properties and Cd immobilization in a contaminated soil. Chemosphere 2017, 189, 627–633. [Google Scholar] [CrossRef] [PubMed]
- Sharma, G.; Kumar, A.; Naushad, M.; Thakur, B.; Vo, D.N.; Gao, B.; Al-Kahtani, A.A.; Stadler, F.J. Adsorptional-photocatalytic removal of fast sulphon black dye by using chitin-cl-poly(itaconic acid-co-acrylamide)/zirconium tungstate nanocomposite hydrogel. J. Hazard. Mater. 2021, 416, 125714. [Google Scholar] [CrossRef] [PubMed]
- Sharma, G.; Pathania, D.; Naushad, M.; Kothiyal, N.C. Fabrication, characterization and antimicrobial activity of polyaniline Th(IV) tungstomolybdophosphate nanocomposite material: Efficient removal of toxic metal ions from water. Chem. Eng. J. 2014, 251, 413–421. [Google Scholar] [CrossRef]
- Qasem, N.A.A.; Mohammed, R.H.; Lawal, D.U. Removal of heavy metal ions from wastewater: A comprehensive and critical review. NPJ Clean Water 2021, 4, 36. [Google Scholar] [CrossRef]
- Fu, F.; Wang, Q. Removal of heavy metal ions from wastewaters: A review. J. Environ. Manag. 2011, 92, 407–418. [Google Scholar] [CrossRef]
- Zhang, J.; Lin, Q.; Zhao, X. The Hydrochar Characters of Municipal Sewage Sludge Under Different Hydrothermal Temperatures and Durations. J. Integr. Agr. 2014, 13, 471–482. [Google Scholar] [CrossRef]
- Wang, C.; Zhu, W.; Fan, X. Char derived from sewage sludge of hydrothermal carbonization and supercritical water gasification: Comparison of the properties of two chars. Waste Manag. 2021, 123, 88–96. [Google Scholar] [CrossRef]
- Khoshbouy, R.; Takahashi, F.; Yoshikawa, K. Preparation of high surface area sludge-based activated hydrochar via hydrothermal carbonization and application in the removal of basic dye. Environ. Res. 2019, 175, 457–467. [Google Scholar] [CrossRef]
- Qian, W.; Luo, X.; Wang, X.; Guo, M.; Li, B. Removal of methylene blue from aqueous solution by modified bamboo hydrochar. Ecotox. Environ. Safe 2018, 157, 300–306. [Google Scholar] [CrossRef] [PubMed]
- Li, Y.; Meas, A.; Shan, S.; Yang, R.; Gai, X.; Wang, H.; Tsend, N. Hydrochars from bamboo sawdust through acid assisted and two-stage hydrothermal carbonization for removal of two organics from aqueous solution. Bioresour. Technol. 2018, 261, 257–264. [Google Scholar] [CrossRef] [PubMed]
- Li, F.; Zimmerman, A.R.; Hu, X.; Gao, B. Removal of aqueous Cr(VI) by Zn- and Al-modified hydrochar. Chemosphere 2020, 260, 127610. [Google Scholar] [CrossRef] [PubMed]
- Lei, Q.; Kannan, S.; Raghavan, V. Uncatalyzed and acid-aided microwave hydrothermal carbonization of orange peel waste. Waste Manag. 2021, 126, 106–118. [Google Scholar] [CrossRef]
- Becker, G.C.; Wüst, D.; Köhler, H.; Lautenbach, A.; Kruse, A. Novel approach of phosphate-reclamation as struvite from sewage sludge by utilising hydrothermal carbonization. J. Environ. Manag. 2019, 238, 119–125. [Google Scholar] [CrossRef]
- Sang, S.; Yang, S.; Guo, A.; Gao, X.; Wang, Y.; Zhang, C.; Cui, F.; Yang, X. Hydrothermal Synthesis of Carbon Nano—Onions from Citric Acid. Chem.—Asian J. 2020, 15, 3428–3431. [Google Scholar] [CrossRef]
- Faradilla, R.F.; Lucia, L.; Hakovirta, M. Remarkable Physical and Thermal Properties of Hydrothermal Carbonized Nanoscale Cellulose Observed from Citric Acid Catalysis and Acetone Rinsing. Nanomaterials 2020, 10, 1049. [Google Scholar] [CrossRef]
- Wang, S.; Chen, Z.; Cole, I.; Li, Q. Structural evolution of graphene quantum dots during thermal decomposition of citric acid and the corresponding photoluminescence. Carbon 2015, 82, 304–313. [Google Scholar] [CrossRef] [Green Version]
- Fiol, N.; Villaescusa, I. Determination of sorbent point zero charge: Usefulness in sorption studies. Environ. Chem. Lett. 2009, 7, 79–84. [Google Scholar] [CrossRef]
- Boehm, H. Chapter Thirteen—Surface Chemical Characterization of Carbons from Adsorption Studies. In Adsorption by Carbons; Elsevier: Amsterdam, The Netherlands, 2008; pp. 301–327. [Google Scholar]
- Largitte, L.; Pasquier, R. A review of the kinetics adsorption models and their application to the adsorption of lead by an activated carbon. Chem. Eng. Res. Des. 2016, 109, 495–504. [Google Scholar] [CrossRef]
- Al-Ghouti, M.A.; Da’Ana, D.A. Guidelines for the use and interpretation of adsorption isotherm models: A review. J. Hazard. Mater. 2020, 393, 122383. [Google Scholar] [CrossRef] [PubMed]
- Sharma, G.; Kumar, A.; Ghfar, A.A.; García-Peñas, A.; Naushad, M.; Stadler, F.J. Fabrication and Characterization of Xanthan Gum-cl-poly(acrylamide-co-alginic acid) Hydrogel for Adsorption of Cadmium Ions from Aqueous Medium. Gels 2022, 8, 23. [Google Scholar] [CrossRef]
- Ebadi, A.; Soltan Mohammadzadeh, J.S.; Khudiev, A. What is the correct form of BET isotherm for modeling liquid phase adsorption? Adsorption 2009, 15, 65–73. [Google Scholar] [CrossRef]
- Lima, E.C.; Sher, F.; Saeb, M.R.; Abatal, M.; Seliem, M.K. Comments on Reasonable calculation of the thermodynamic parameters from adsorption equilibrium constant. J. Mol. Liq. 2021, 334, 116542. [Google Scholar] [CrossRef]
- Cao, J.; Li, L.; Morishita, K.; Xiao, X.; Zhao, X.; Wei, X.; Takarada, T. Nitrogen transformations during fast pyrolysis of sewage sludge. Fuel 2013, 104, 1–6. [Google Scholar] [CrossRef]
- Francioso, O.; Rodriguez-Estrada, M.T.; Montecchio, D.; Salomoni, C.; Caputo, A.; Palenzona, D. Chemical characterization of municipal wastewater sludges produced by two-phase anaerobic digestion for biogas production. J. Hazard. Mater. 2010, 175, 740–746. [Google Scholar] [CrossRef]
- Li, X.; Zheng, H.; Gao, B.; Zhao, C.; Sun, Y. UV-initiated polymerization of acid- and alkali-resistant cationic flocculant P(AM-MAPTAC): Synthesis, characterization, and application in sludge dewatering. Sep. Purif. Technol. 2017, 187, 244–254. [Google Scholar] [CrossRef]
- He, C.; Giannis, A.; Wang, J. Conversion of sewage sludge to clean solid fuel using hydrothermal carbonization: Hydrochar fuel characteristics and combustion behavior. Appl. Energy 2013, 111, 257–266. [Google Scholar] [CrossRef]
- He, C.; Zhao, J.; Yang, Y.; Wang, J. Multiscale characteristics dynamics of hydrochar from hydrothermal conversion of sewage sludge under sub- and near-critical water. Bioresour. Technol. 2016, 211, 486–493. [Google Scholar] [CrossRef]
- Ma, X.; Shan, Y.; Duan, P.; Liao, J.; Chen, D.; Xu, Z. Fe(NO3)3 assisted hydrothermal carbonization of sewage sludge: Focusing on characteristics of hydrochar and aqueous phase. Mol. Catal. 2021, 514, 111823. [Google Scholar] [CrossRef]
- Zhuang, X.; Huang, Y.; Song, Y.; Zhan, H.; Yin, X.; Wu, C. The transformation pathways of nitrogen in sewage sludge during hydrothermal treatment. Bioresour. Technol. 2017, 245, 463–470. [Google Scholar] [CrossRef] [PubMed]
- Chen, J.; Chen, Q.; Ma, Q. Influence of surface functionalization via chemical oxidation on the properties of carbon nanotubes. J. Colloid. Interf. Sci. 2012, 370, 32–38. [Google Scholar] [CrossRef]
- Sing, K.S.W.; Williams, R.T. Physisorption Hysteresis Loops and the Characterization of Nanoporous Materials. Adsorpt. Sci. Technol. 2004, 22, 773–782. [Google Scholar] [CrossRef]
- Zhu, X.; Liu, Y.; Qian, F.; Zhou, C.; Zhang, S.; Chen, J. Role of Hydrochar Properties on the Porosity of Hydrochar-based Porous Carbon for Their Sustainable Application. ACS Sustain. Chem. Eng. 2015, 3, 833–840. [Google Scholar] [CrossRef]
- Mouni, L.; Merabet, D.; Bouzaza, A.; Belkhiri, L. Adsorption of Pb(II) from aqueous solutions using activated carbon developed from Apricot stone. Desalination 2011, 276, 148–153. [Google Scholar] [CrossRef]
- Xia, Y.; Yang, T.; Zhu, N.; Li, D.; Chen, Z.; Lang, Q.; Liu, Z.; Jiao, W. Enhanced adsorption of Pb(II) onto modified hydrochar: Modeling and mechanism analysis. Bioresour. Technol. 2019, 288, 121593. [Google Scholar] [CrossRef]
- Xue, Y.; Gao, B.; Yao, Y.; Inyang, M.; Zhang, M.; Zimmerman, A.R.; Ro, K.S. Hydrogen peroxide modification enhances the ability of biochar (hydrochar) produced from hydrothermal carbonization of peanut hull to remove aqueous heavy metals: Batch and column tests. Chem. Eng. J. 2012, 200–202, 673–680. [Google Scholar] [CrossRef]
- Li, Y.; Li, K.; Su, M.; Ren, Y.; Li, Y.; Chen, J.; Li, L. Fabrication of carbon/SiO2 composites from the hydrothermal carbonization process of polysaccharide and their adsorption performance. Carbohyd. Polym. 2016, 153, 320–328. [Google Scholar] [CrossRef]
- Luo, X.; Huang, Z.; Lin, J.; Li, X.; Qiu, J.; Liu, J.; Mao, X. Hydrothermal carbonization of sewage sludge and in-situ preparation of hydrochar/MgAl-layered double hydroxides composites for adsorption of Pb(II). J. Clean Prod. 2020, 258, 120991. [Google Scholar] [CrossRef]
- Zhang, J.; Shao, J.; Jin, Q.; Li, Z.; Zhang, X.; Chen, Y.; Zhang, S.; Chen, H. Sludge-based biochar activation to enhance Pb(II) adsorption. Fuel 2019, 252, 101–108. [Google Scholar] [CrossRef]
- Zhang, W.; Mao, S.; Chen, H.; Huang, L.; Qiu, R. Pb(II) and Cr(VI) sorption by biochars pyrolyzed from the municipal wastewater sludge under different heating conditions. Bioresour. Technol. 2013, 147, 545–552. [Google Scholar] [CrossRef] [PubMed]
- Ho, S.; Chen, Y.; Yang, Z.; Nagarajan, D.; Chang, J.; Ren, N. High-efficiency removal of lead from wastewater by biochar derived from anaerobic digestion sludge. Bioresour. Technol. 2017, 246, 142–149. [Google Scholar] [CrossRef] [PubMed]
- Sharma, G.; Pathania, D.; Naushad, M. Preparation, characterization, and ion exchange behavior of nanocomposite polyaniline zirconium(IV) selenotungstophosphate for the separation of toxic metal ions. Ionics 2015, 21, 1045–1055. [Google Scholar] [CrossRef]
Publisher’s Note: MDPI stays neutral with regard to jurisdictional claims in published maps and institutional affiliations. |
© 2022 by the authors. Licensee MDPI, Basel, Switzerland. This article is an open access article distributed under the terms and conditions of the Creative Commons Attribution (CC BY) license (https://creativecommons.org/licenses/by/4.0/).