
A Mini-Review of Strategies for Quantifying Anthropogenic Activities in Microplastic Studies in Aquatic Environments


Abstract
:1. Introduction
2. Microplastics and Anthropogenic Activities
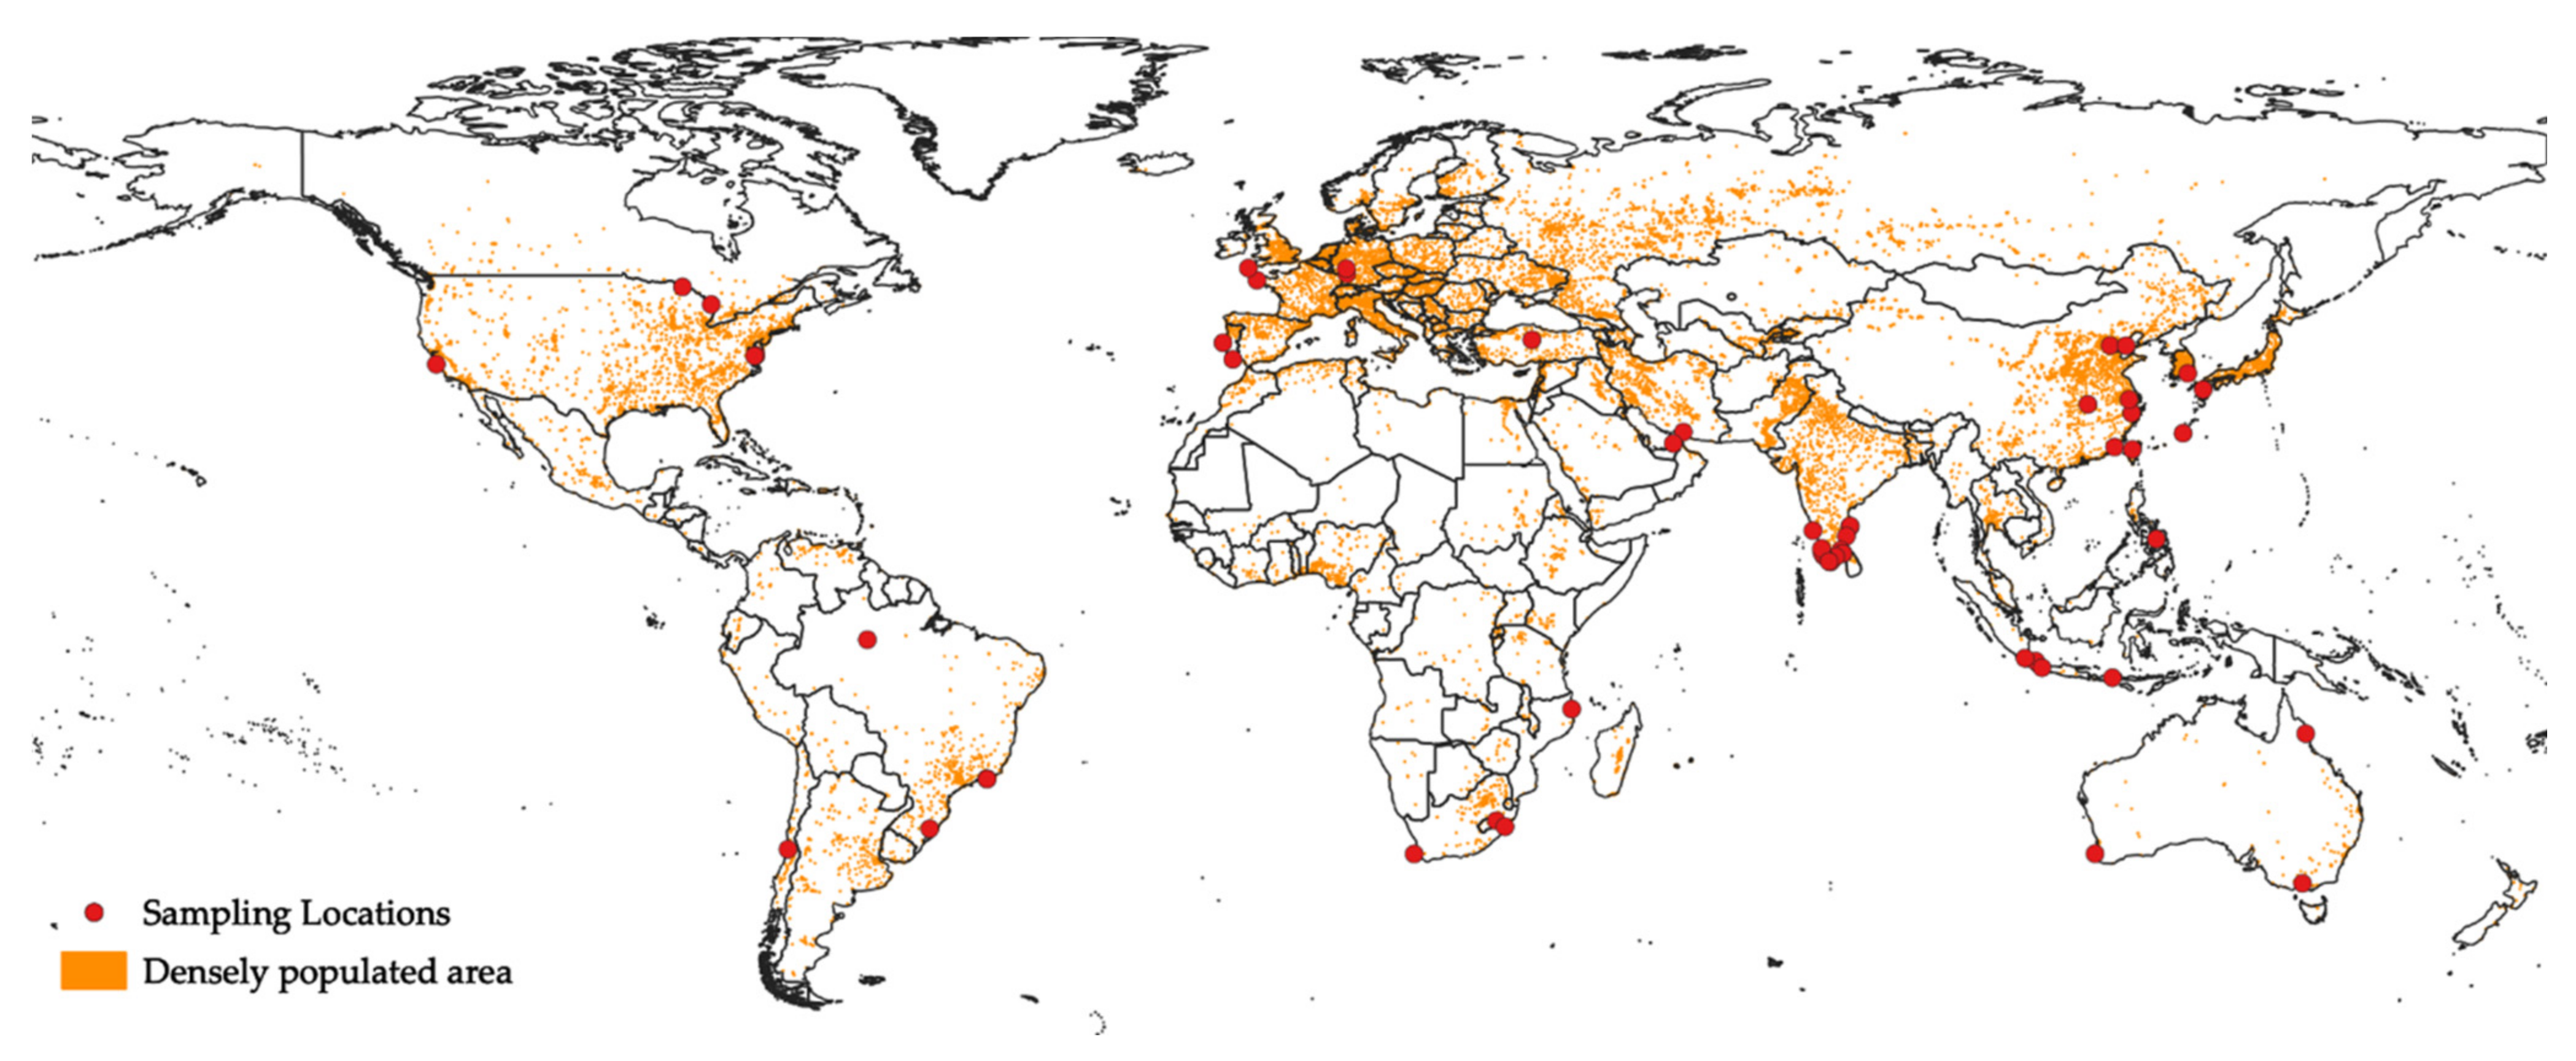
2.1. Population Density

| Environment | Sample Type and Average MP Concentration for Sampling Sites | Statistical Analysis | Anthropogenic Factors | Conclusion | Reference | |||
|---|---|---|---|---|---|---|---|---|
| Water Surface | Water Column | Sediment | Organism | |||||
| Bay | 0.24 ± 0.35 MP m−3 (excluding fibers, mean ± SD) | - | 0.97 ± 2.08 MP kg−1 (excluding fibers, dw, mean ± SD) | - | - | 1. Commercial port 2. Military base 3. Wastewater treatment plant 4. Shellfish farming 5. Marina | MP abundance at water surface was higher in sites next to anthropogenic factors | [5] |
| Bay | 2.2 ± 1.4 MP L−1 | 1.6 to 6.9 MP L−1 | 31.1 to 256.3 MP kg−1 (dw) | - | - | 1. Vessel activity 2. Close to coastline | MP abundance at water surface and in columns was higher in sites next to anthropogenic factors | [56] |
| Bay | 7.62 MP m−3 | - | Beach: 166.50 MP kg−1 bay sediment: 20.74 166.5 MP kg−1 | - | - | 1. Aquaculture 2. Fishing activity 3. recreational activities 4. Marine sports activities 5. Bars and restaurants 6. Proximity to rivers and channels 7. Urban drainage 8. Boat marina 9. Proximity to roads and waterway transport | MP abundance might be related to adjacent potential human activities, greater river inflow, and lower hydrodynamics | [57] |
| Bay | For each sampling date: 5534 to 297,927 MP km−2 or 2.7 to 245.7 g km−2 | - | - | - | V | 1. Land use (proportion of urban/suburban area, agricultural area in catchments) 2. Population density | MP abundance was significantly correlated with population density and the proportion of urban/suburban development in the catchment | [52] |
| Bay | - | - | In Lumpung: 72.64 ± 25.28 MP kg−1 (mean ± SD) In Sumbawa: 44.19 ± 12.40 MP kg−1 (mean ± SD) | Sandfish: In Lampung: 3.21 ± 1.07 MP fish−1 (mean ± SD) or 126.34 ± 51.99 MP kg−1 (mean ± SD) In Sumbawa: 1.39 ± 0.86 MP fish−1 (mean ± SD) or 69.69 ± 52.22 MP kg−1 (mean ± SD) | V | 1. Populated area | MP abundance in sediment and sandfish was significantly higher in Lumpung (populated area) than in Sumbawa (semi-enclosed ecosystem). | [58] |
| Bay/Coastline | 0.77 ± 0.88 MP L−1 (mean ± SD) | - | 0.94 ± 0.69 MP g−1 (ww, mean ± SD) | Mussel: 1.43 ± 1.45 MP g−1 (ww, mean ± SD) Oyster: 1.13 ± 0.84 MP g−1 (ww, mean ± SD) Polychaete: 0.71 ± 1.00 MP g−1 (ww, mean ± SD) | V | 1. Close to urban areas 2. Close to aquafarm areas | MP abundance in sediment was significantly higher in urban areas than in rural areas | [47] |
| Bay/Coastline/Estuary | 514.3 ± 520.0 MP m−3 (mean ± SD) | - | - | 76 to 333 MP kg−1(mean ± SD) | V | 1. Total population 2. Urbanization rate 3. Farmland | MP abundance at water surface was significantly correlated with total population and urbanization rate | [53] |
| River | - | - | Summer: 6.3 ± 4.3 MP kg−1 (dw, mean ± SD) Winter: 160.1 ± 139.5 MP kg−1 (dw, mean ± SD) | Chironomus spp.: Summer: 0.37 ± 0.44 MP mg−1 (ww, mean ± SD) Winter: 1.12 ± 1.19 MP mg−1 (ww, mean ± SD) | - | 1. Close to populated areas 2. Close to wastewater treatment plants | MP abundance was higher in sites next to anthropogenic factors | [59] |
| River | 892,777 MP km−2 | - | - | - | - | 1. Close to populated areas 2. Close to wastewater treatment plants | MP abundance was higher near populated areas and at the side of riverbanks wherein wastewater treatment plant effluents are entering | [60] |
| River | - | - | 0.063–5 mm: 417 to 8178 MP kg−1 (dw) 0.063–1 mm: 0 to 5725 MP kg−1 (dw) | - | - | 1. City | Location with highest MP concentration might be related to hydraulic conditions and proximity to the city | [61] |
| River | Reference area: 6.8 MP L−1 Textile industrial area: 13.3 MP L−1 | - | 16.7 to 1323.3 MP kg−1 (dw) | - | V | 1. Close to textile industrial area | MP abundance was significantly higher in the industrial area than in the reference area | [46] |
| River | 9.2 ± 2.2 MP L−1 (mean ± SD) | Intermediate: 8.4 ± 1.7 MP L−1 (mean ± SD) Bottom: 14.2 ± 5.6 MP L−1 (mean ± SD) | 4328 ± 2037 MP kg−1 (dw, mean ± SD) | - | V | 1. Population density of suburban area 2. Population density of urban area 3. Population density of industrial area | MP abundance in water columns was significantly correlated with population density in suburban and urban areas | [48] |
| River | - | - | Rhine river: 21.8 to 932 mg kg−1 or 228 to 3763 MP kg−1 Main river: 43.5 to 459 mg kg−1 or 786 to 1368 MP kg−1 | - | V | 1. Close to industrial area 2. Population density | No significant correlation between MP masses and population density was found, and MP abundance did not increase downstream of the industrial area | [55] |
| River | - | - | - | Chironomidae larvae: 0.28 to 2.07 MP mg−1 | V | 1. Land use (proportion of industrial area and residential area in the catchment) | The proportion of industrial areas in catchment contributes more to MP concentration in midge larvae than the proportion of residential areas | [49] |
| River | - | 5.85 ± 3.28 MP L−1 (mean ± SD) | 3.03 ± 1.59 MP 100 g−1 (dw, mean ± SD) | - | V | 1. Industrial area 2. Slum area | MP abundance in sediment was significantly higher in sites located around industrial and slum areas | [62] |
| River/ Coastline | 8.48 to 9.37 MP m−3 | - | - | Aplocheilus sp.: 1.97 MP fish−1 | - | 1. Tourism 2. Port 3. Industrial operation | MP abundance was higher in sites located around anthropogenic factors | [63] |
| River/Lake | - | 1660.0 to 8925 MP m−3 | - | - | V | 1. Distance from the urban left | MP abundance correlated significantly negatively with distance from the city left | [51] |
| Lake | 43,157 ± 115,519 MP km−2 (mean ± SD) | - | - | - | - | 1. Close to populated areas 2. Close to shoreline | MP abundance was higher near populated areas and areas near the shoreline | [64] |
| Lake | 11.9 to 61.2 MP m−3 | - | - | - | - | 1. Population density 2. Domestic sewage | MP abundance was higher in sites located around populated area | [65] |
| Lake | 3.4 to 25.8 MP L−1 | - | 11.0 to 234.6 MP kg−1 (dw) | Plankton: 0.01 × 10⁶ to 6.8 × 10⁶ MP km−2 Asian clams: August: 1.3 to 12.5 MP g−1 (ww) November: 0.2 to 9.6 MP g−1 (ww) | V | 1. Close to populated areas 2. Index of eutrophication | MP abundance in sediment was significantly higher near areas with more human activity than areas with less human activity, according to the index of eutrophication | [9] |
| Lake | 0.05 to 32 MP m−3 | - | - | - | V | 1. Land use (proportion of industrial area, agricultural area (total, crops, pasture, and hay) and impervious area) 2. Population density 3. Wastewater treatment plant effluent contribution | MP abundance was significantly correlated with the proportion of urban area, agricultural area (total and crops), and impervious area in catchments; MP abundance was significantly correlated with population density | [66] |
| Coastline | - | - | High tide line: 439 ± 172 to 119 ± 72 MP kg−1 (dw, mean ± SD) Low tide line: 179 ± 68 to 33 ± 30 MP kg−1 (dw, mean ± SD) | - | - | 1. Metropolitan city | MP abundance was highest in the location near the metropolitan city | [67] |
| Coastline | - | 24 ± 9 to 96 ± 57 MP L−1 (mean ± SD) | 55 ± 21 to 259 ± 88 MP kg−1 (mean ± SD) | - | - | 1. Tourism 2. Shipping 3. Fishing 4. Aquaculture | MP abundance was higher in sites located around anthropogenic factors | [68] |
| Coastline | - | 3.1 ± 2.3 to 23.7 ± 4.2 MP L−1 (mean ± SD) | - | 0.11 ± 0.06 to 3.64 ± 1.7 MP fish−1 (mean ± SD) or 0.0002 ± 0.0001 to 0.2 ± 0.03 MP g−1gut weight (mean ± SD) | - | 1. Sewage effluent 2. Proximity to anthropogenic activities | MP abundance was higher in shore areas (adjacent to sewage effluent) and in epipelagic fish (adjacent to urban runoff) | [69] |
| Coastline | - | 1.25 ± 0.88 MP m−3 (mean ± SD) | 40.7 ± 33.2 MP m−2 (mean ± SD) | Fishes (not specified) | - | 1. Population density 2. Industrial activities 3. Tourism 4. Sewage effluent 5. fishing | MP abundance in water and sediment was high due to proximity of urban regions, river runoff, fisheries and tourism | [70] |
| Coastline | - | - | - | Zooplankton: 0.002 to 0.036 MP m−3 | - | 1. Close to populated areas 2. Close to industrial facilities 3. Close to port facilities | MP abundance was higher near populated areas and areas close to industrial and port facilities | [71] |
| Coastline | - | - | 43 MP 50 g−1 (dw, only include fragments and fibers) | - | - | 1. Tourism 2. Harbor 3. Residential area | MP abundance was high in beaches with associated anthropogenic activity | [72] |
| Coastline | - | - | 2 to 31 MP 250 mL−1 | - | V | 1. Population density | MP abundance was significantly correlated with population density | [45] |
| Coastline | - | (Not specified) | 86.67 ± 48.68 to 754.7 ± 393 MP m−2 (depth 5 cm, mean ± SD) | - | V | 1. Close to harbors 2. Population density | No significant correlation between population density and MP abundance in water column and sediment was found | [38] |
| Coastline | - | - | High tide line: 1323 ± 1228 mg m−2 (mean ± SD) Low tide line: 180 ± 261 mg m−2 (mean ± SD) Overall: 46.6 ± 37.2MP m−2 (mean ± SD) | Important fish species: 0.1 MP fish−1 | V | 1. Tourism 2. Fishing 3. River mouth 4. Urban activities | MP abundance in beaches was insignificantly correlated with the distance of the beach from the nearest river mouth | [73] |
| Coastline | Proportion of MP in collected particles: 13.3 to 25.0% | - | - | - | V | 1. Population density | Significantly greater proportions of MP particles were found in areas with higher population density | [74] |
| Pond | 233 MP m−3 | - | - | - | - | 1. Populated area | MP abundance was low in the studied area (near protected areas) compared to reference study sites (near populated areas) | [75] |
| Strait | - | - | 2 to 1258 MP kg−1 (dw) | - | - | 1. The relative level of industrialization (manufacturing, oil refineries, and industrial sewage) and urbanization | MP abundance was higher near areas with elevated levels of industrialization and urbanization | [44] |
| Wetland | - | - | 2 to 147 MP kg−1 (dw) | - | V | 1. Land use (proportion of and absolute commercial area, industrial area, and residential area) 2. Dwelling density 3. Population density 4. Population size 5. Road/rail 6. Urban growth | MP abundance was significantly less in catchments with more open space (undeveloped catchments) The proportion of road/rail areas, commercial areas, industrial areas, and residential areas in catchments was not significantly associated with MP abundance Population density, population size, dwelling density, urban growth, and catchment size were not significantly associated with MP abundance | [50] |
2.2. Importance of Statistical Analysis
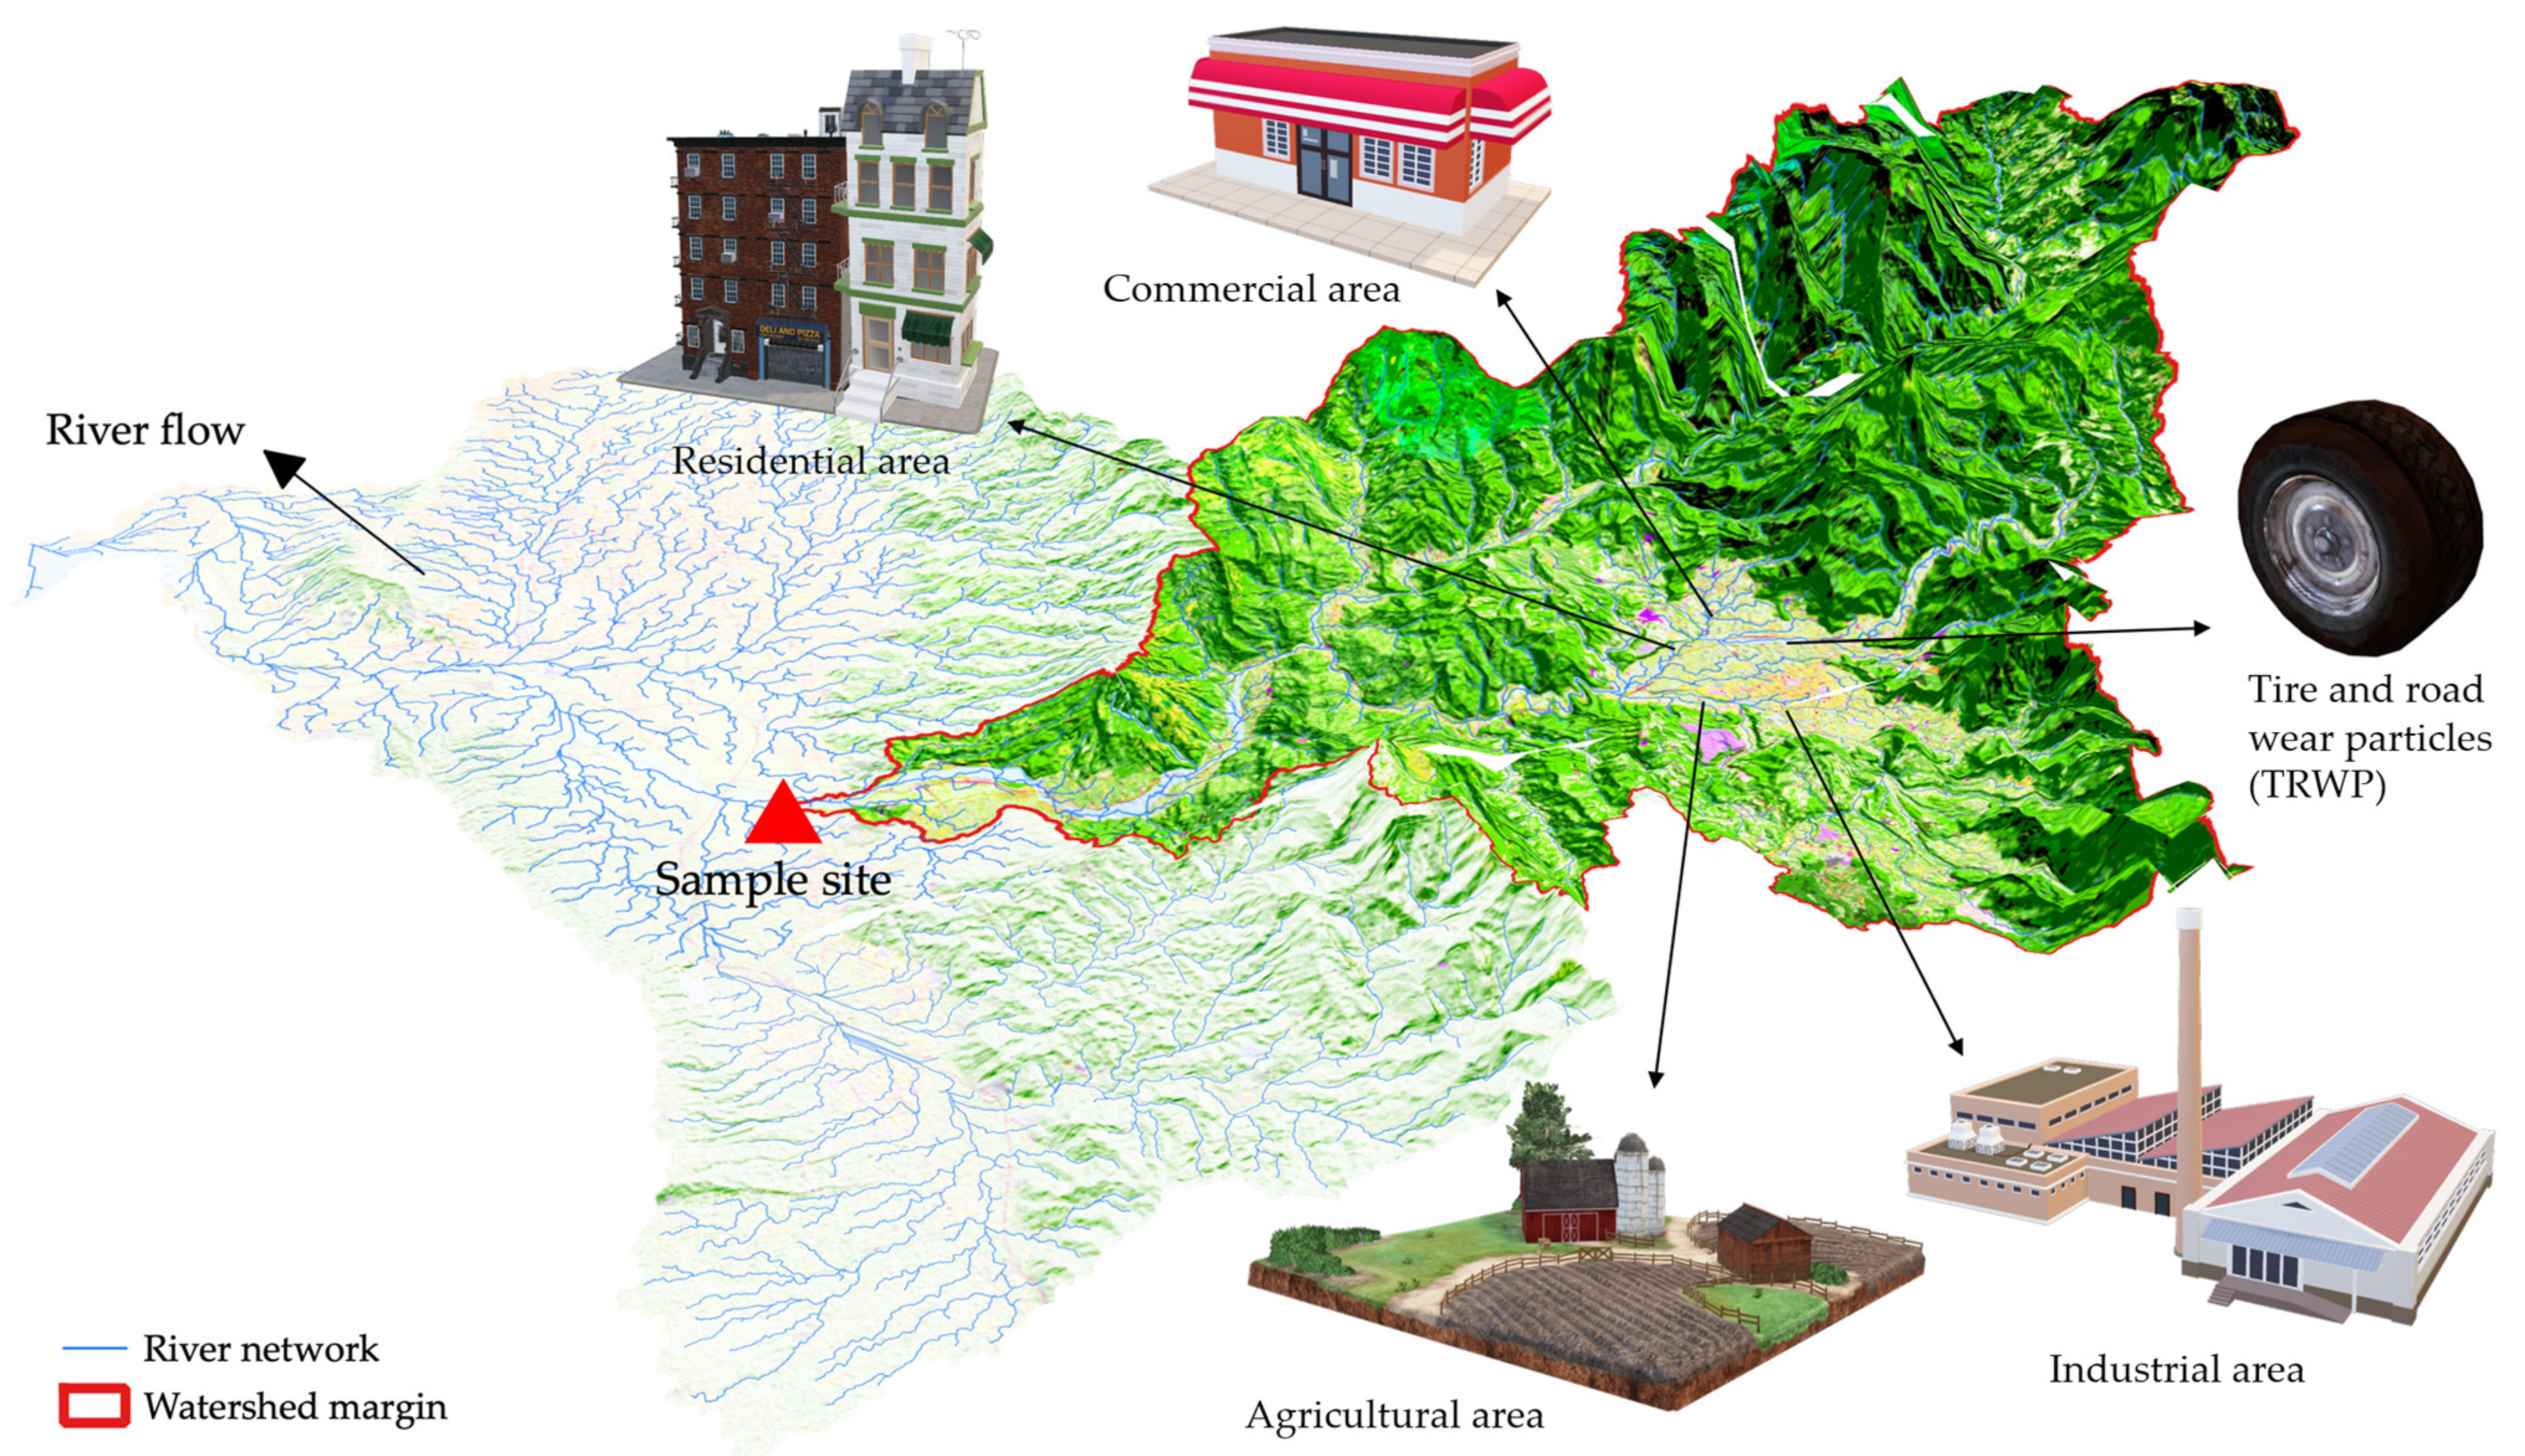
2.3. Urban Attributes
3. Future Directions and Conclusions
Author Contributions
Funding
Institutional Review Board Statement
Informed Consent Statement
Conflicts of Interest
References
- Arthur, C.; Baker, J.; Bamford, H. Proceedings of the International Research Workshop on the Occurrence, Effects, and Fate of Microplastic Marine Debris, 9–11 September 2008; University of Washington Tacoma: Tacoma, WA, USA, 2009; 530p. [Google Scholar]
- Thompson, R.C.; Olsen, Y.; Mitchell, R.P.; Davis, A.; Rowland, S.J.; John, A.W.G.; McGonigle, D.; Russel, A.E. Lost at Sea: Where Is All the Plastic? Science 2004, 304, 838. [Google Scholar] [CrossRef] [PubMed]
- Barnes, D.K.A.; Galgani, F.; Thompson, R.C.; Barlaz, M. Accumulation and fragmentation of plastic debris in global environments. Philos. Trans. R. Soc. B Biol. Sci. 2009, 364, 1985–1998. [Google Scholar] [CrossRef] [Green Version]
- Singh, B.; Sharma, N. Mechanistic implications of plastic degradation. Polym. Degrad. Stab. 2008, 93, 561–584. [Google Scholar] [CrossRef]
- Frère, L.; Paul-Pont, I.; Rinnert, E.; Petton, S.; Jaffré, J.; Bihannic, I.; Soudant, P.; Lambert, C.; Huvet, A. Influence of environmental and anthropogenic factors on the composition, concentration and spatial distribution of microplastics: A case study of the Bay of Brest (Brittany, France). Environ. Pollut. 2017, 225, 211–222. [Google Scholar] [CrossRef] [Green Version]
- Eriksen, M.; Lebreton, L.C.M.; Carson, H.S.; Thiel, M.; Moore, C.J.; Borerro, J.C.; Galgani, F.; Ryan, P.G.; Reisser, J. Plastic Pollution in the World’s Oceans: More than 5 Trillion Plastic Pieces Weighing over 250,000 Tons Afloat at Sea. PLoS ONE 2014, 9, e111913. [Google Scholar] [CrossRef] [PubMed] [Green Version]
- Van Cauwenberghe, L.; Vanreusel, A.; Mees, J.; Janssen, C. Microplastic pollution in deep-sea sediments. Environ. Pollut. 2013, 182, 495–499. [Google Scholar] [CrossRef]
- Li, J.; Liu, H.; Chen, J.P. Microplastics in freshwater systems: A review on occurrence, environmental effects, and methods for microplastics detection. Water Res. 2018, 137, 362–374. [Google Scholar] [CrossRef]
- Su, L.; Xue, Y.; Li, L.; Yang, D.; Kolandhasamy, P.; Li, D.; Shi, H. Microplastics in Taihu Lake, China. Environ. Pollut. 2016, 216, 711–719. [Google Scholar] [CrossRef]
- Wetherbee, G.A.; Baldwin, A.K.; Ranville, J.F. It Is Raining Plastic; U.S. Geological Survey: Reston, VA, USA, 2019. [Google Scholar] [CrossRef]
- Bergmann, M.; Mützel, S.; Primpke, S.; Tekman, M.B.; Trachsel, J.; Gerdts, G. White and wonderful? Microplastics prevail in snow from the Alps to the Arctic. Sci. Adv. 2019, 5, eaax1157. [Google Scholar] [CrossRef] [Green Version]
- Bergmann, M.; Sandhop, N.; Schewe, I.; D’Hert, D. Observations of floating anthropogenic litter in the Barents Sea and Fram Strait, Arctic. Polar Biol. 2015, 39, 553–560. [Google Scholar] [CrossRef]
- Windsor, F.M.; Tilley, R.M.; Tyler, C.R.; Ormerod, S.J. Microplastic ingestion by riverine macroinvertebrates. Sci. Total Environ. 2018, 646, 68–74. [Google Scholar] [CrossRef]
- Karami, A.; Golieskardi, A.; Choo, C.K.; Larat, V.; Karbalaei, S.; Salamatinia, B. Microplastic and mesoplastic contamination in canned sardines and sprats. Sci. Total Environ. 2018, 612, 1380–1386. [Google Scholar] [CrossRef]
- Carlin, J.; Craig, C.; Little, S.; Donnelly, M.; Fox, D.; Zhai, L.; Walters, L. Microplastic accumulation in the gastrointestinal tracts in birds of prey in central Florida, USA. Environ. Pollut. 2020, 264, 114633. [Google Scholar] [CrossRef]
- Free, C.M.; Jensen, O.P.; Mason, S.A.; Eriksen, M.; Williamson, N.J.; Boldgiv, B. High-levels of microplastic pollution in a large, remote, mountain lake. Mar. Pollut. Bull. 2014, 85, 156–163. [Google Scholar] [CrossRef]
- Wong, J.K.H.; Lee, K.K.; Tang, K.H.D.; Yap, P.-S. Microplastics in the freshwater and terrestrial environments: Prevalence, fates, impacts and sustainable solutions. Sci. Total Environ. 2020, 719, 137512. [Google Scholar] [CrossRef]
- Wright, S.L.; Thompson, R.C.; Galloway, T.S. The physical impacts of microplastics on marine organisms: A review. Environ. Pollut. 2013, 178, 483–492. [Google Scholar] [CrossRef] [PubMed]
- Straub, S.; Hirsch, P.E.; Burkhardt-Holm, P. Biodegradable and Petroleum-Based Microplastics Do Not Differ in Their Ingestion and Excretion but in Their Biological Effects in a Freshwater Invertebrate Gammarus fossarum. Int. J. Environ. Res. Public Health 2017, 14, 774. [Google Scholar] [CrossRef] [PubMed] [Green Version]
- Lu, Y.; Zhang, Y.; Deng, Y.; Jiang, W.; Zhao, Y.; Geng, J.; Ding, L.; Ren, H.-Q. Uptake and Accumulation of Polystyrene Microplastics in Zebrafish (Danio rerio) and Toxic Effects in Liver. Environ. Sci. Technol. 2016, 50, 4054–4060. [Google Scholar] [CrossRef] [PubMed]
- Silva, C.J.; Beleza, S.; Campos, D.; Soares, A.M.; Silva, A.L.P.; Pestana, J.L.; Gravato, C. Immune response triggered by the ingestion of polyethylene microplastics in the dipteran larvae Chironomus riparius. J. Hazard. Mater. 2021, 414, 125401. [Google Scholar] [CrossRef]
- Wang, K.; Li, J.; Zhao, L.; Mu, X.; Wang, C.; Wang, M.; Xue, X.; Qi, S.; Wu, L. Gut microbiota protects honey bees (Apis mellifera L.) against polystyrene microplastics exposure risks. J. Hazard. Mater. 2020, 402, 123828. [Google Scholar] [CrossRef]
- Jin, Y.; Xia, J.; Pan, Z.; Yang, J.; Wang, W.; Fu, Z. Polystyrene microplastics induce microbiota dysbiosis and inflammation in the gut of adult zebrafish. Environ. Pollut. 2018, 235, 322–329. [Google Scholar] [CrossRef] [PubMed]
- Huang, Y.; Li, W.; Gao, J.; Wang, F.; Yang, W.; Han, L.; Lin, D.; Min, B.; Zhi, Y.; Grieger, K.; et al. Effect of microplastics on ecosystem functioning: Microbial nitrogen removal mediated by benthic invertebrates. Sci. Total Environ. 2020, 754, 142133. [Google Scholar] [CrossRef] [PubMed]
- Hansen, B.; Hansen, P.J.; Nielsen, T.G. Effects of large nongrazable particles on clearance and swimming behaviour of zooplankton. J. Exp. Mar. Biol. Ecol. 1991, 152, 257–269. [Google Scholar] [CrossRef]
- Cole, M.; Lindeque, P.; Fileman, E.; Halsband, C.; Goodhead, R.; Moger, J.; Galloway, T.S. Microplastic Ingestion by Zooplankton. Environ. Sci. Technol. 2013, 47, 6646–6655. [Google Scholar] [CrossRef] [PubMed]
- Kirstein, I.V.; Kirmizi, S.; Wichels, A.; Garin-Fernandez, A.; Erler, R.; Löder, M.; Gerdts, G. Dangerous hitchhikers? Evidence for potentially pathogenic Vibrio spp. on microplastic particles. Mar. Environ. Res. 2016, 120, 1–8. [Google Scholar] [CrossRef] [Green Version]
- Oliver, J.D. Wound infections caused by Vibrio vulnificus and other marine bacteria. Epidemiol. Infect. 2005, 133, 383–391. [Google Scholar] [CrossRef]
- Fackelmann, G.; Sommer, S. Microplastics and the gut microbiome: How chronically exposed species may suffer from gut dysbiosis. Mar. Pollut. Bull. 2019, 143, 193–203. [Google Scholar] [CrossRef] [PubMed]
- Teuten, E.L.; Saquing, J.M.; Knappe, D.; Barlaz, M.A.; Jonsson, S.; Björn, A.; Rowland, S.J.; Thompson, R.; Galloway, T.S.; Yamashita, R.; et al. Transport and release of chemicals from plastics to the environment and to wildlife. Philos. Trans. R. Soc. B Biol. Sci. 2009, 364, 2027–2045. [Google Scholar] [CrossRef] [Green Version]
- Talsness, C.E.; Andrade, A.J.M.; Kuriyama, S.N.; Taylor, J.A.; vom Saal, F.S. Components of plastic: Experimental studies in animals and relevance for human health. Philos. Trans. R. Soc. B Biol. Sci. 2009, 364, 2079–2096. [Google Scholar] [CrossRef] [PubMed] [Green Version]
- Andrady, A.L. Microplastics in the marine environment. Mar. Pollut. Bull. 2011, 62, 1596–1605. [Google Scholar] [CrossRef]
- Oehlmann, J.; Schulte-Oehlmann, U.; Kloas, W.; Jagnytsch, O.; Lutz, I.; Kusk, K.O.; Wollenberger, L.; Santos, E.; Paull, G.C.; Van Look, K.J.W.; et al. A critical analysis of the biological impacts of plasticizers on wildlife. Philos. Trans. R. Soc. B Biol. Sci. 2009, 364, 2047–2062. [Google Scholar] [CrossRef] [PubMed] [Green Version]
- Neuman, H.; Debelius, J.; Knight, R.; Koren, O. Microbial endocrinology: The interplay between the microbiota and the endocrine system. FEMS Microbiol. Rev. 2015, 39, 509–521. [Google Scholar] [CrossRef] [PubMed] [Green Version]
- Eerkes-Medrano, D.; Thompson, R.C.; Aldridge, D.C. Microplastics in freshwater systems: A review of the emerging threats, identification of knowledge gaps and prioritisation of research needs. Water Res. 2015, 75, 63–82. [Google Scholar] [CrossRef]
- Hidalgo-Ruz, V.; Gutow, L.; Thompson, R.C.; Thiel, M. Microplastics in the Marine Environment: A Review of the Methods Used for Identification and Quantification. Environ. Sci. Technol. 2012, 46, 3060–3075. [Google Scholar] [CrossRef] [PubMed]
- Yang, L.; Zhang, Y.; Kang, S.; Wang, Z.; Wu, C. Microplastics in freshwater sediment: A review on methods, occurrence, and sources. Sci. Total Environ. 2020, 754, 141948. [Google Scholar] [CrossRef]
- Nel, H.A.; Hean, J.W.; Noundou, X.S.; Froneman, W. Do microplastic loads reflect the population demographics along the southern African coastline? Mar. Pollut. Bull. 2017, 115, 115–119. [Google Scholar] [CrossRef]
- Jambeck, J.R.; Geyer, R.; Wilcox, C.; Siegler, T.R.; Perryman, M.; Andrady, A.; Narayan, R.; Law, K.L. Plastic waste inputs from land into the ocean. Science 2015, 347, 768–771. [Google Scholar] [CrossRef] [PubMed]
- Geyer, R.; Jambeck, J.R.; Law, K.L. Production, use, and fate of all plastics ever made. Sci. Adv. 2017, 3, e1700782. [Google Scholar] [CrossRef] [Green Version]
- World Population Prospects. World Population Prospects 2019: Highlights; ST/ESA/SER.A/423; UN: New York, NY, USA, 2019. [Google Scholar]
- Plastics Europe. Plastics—The Facts. An Analysis of European Plastics Production, Demand and Waste Data; Plastics Europe: Brussels, Belgium, 2020. [Google Scholar]
- Patterson, T.; Kelso, N.V. World Urban Areas, LandScan, 1:10 Million; North American Cartographic Information Society: Milwaukee, WI, USA, 2012. [Google Scholar]
- Naji, A.; Esmaili, Z.; Khan, F.R. Plastic debris and microplastics along the beaches of the Strait of Hormuz, Persian Gulf. Mar. Pollut. Bull. 2017, 114, 1057–1062. [Google Scholar] [CrossRef] [PubMed]
- Browne, M.A.; Crump, P.; Niven, S.J.; Teuten, E.; Tonkin, A.; Galloway, T.; Thompson, R. Accumulation of Microplastic on Shorelines Woldwide: Sources and Sinks. Environ. Sci. Technol. 2011, 45, 9175–9179. [Google Scholar] [CrossRef] [PubMed]
- Deng, H.; Wei, R.; Luo, W.; Hu, L.; Li, B.; Di, Y.; Shi, H. Microplastic pollution in water and sediment in a textile industrial area. Environ. Pollut. 2020, 258, 113658. [Google Scholar] [CrossRef] [PubMed]
- Jang, M.; Shim, W.J.; Cho, Y.; Han, G.M.; Song, Y.K.; Hong, S.H. A close relationship between microplastic contamination and coastal area use pattern. Water Res. 2019, 171, 115400. [Google Scholar] [CrossRef]
- Liu, Y.; You, J.; Li, Y.; Zhang, J.; He, Y.; Breider, F.; Tao, S.; Liu, W. Insights into the horizontal and vertical profiles of microplastics in a river emptying into the sea affected by intensive anthropogenic activities in Northern China. Sci. Total Environ. 2021, 779, 146589. [Google Scholar] [CrossRef] [PubMed]
- Lin, C.-T.; Chiu, M.-C.; Kuo, M.-H. Effects of anthropogenic activities on microplastics in deposit-feeders (Diptera: Chironomidae) in an urban river of Taiwan. Sci. Rep. 2021, 11, 1–8. [Google Scholar] [CrossRef]
- Townsend, K.R.; Lu, H.-C.; Sharley, D.J.; Pettigrove, V. Associations between microplastic pollution and land use in urban wetland sediments. Environ. Sci. Pollut. Res. 2019, 26, 22551–22561. [Google Scholar] [CrossRef] [PubMed]
- Wang, W.; Ndungu, A.W.; Li, Z.; Wang, J. Microplastics pollution in inland freshwaters of China: A case study in urban surface waters of Wuhan, China. Sci. Total Environ. 2017, 575, 1369–1374. [Google Scholar] [CrossRef]
- Yonkos, L.T.; Friedel, E.A.; Perez-Reyes, A.C.; Ghosal, S.; Arthur, C.D. Microplastics in Four Estuarine Rivers in the Chesapeake Bay, U.S.A. Environ. Sci. Technol. 2014, 48, 14195–14202. [Google Scholar] [CrossRef] [PubMed]
- Tang, G.; Liu, M.; Zhou, Q.; He, H.; Chen, K.; Zhang, H.; Hu, J.; Huang, Q.; Luo, Y.; Ke, H.; et al. Microplastics and polycyclic aromatic hydrocarbons (PAHs) in Xiamen coastal areas: Implications for anthropogenic impacts. Sci. Total Environ. 2018, 634, 811–820. [Google Scholar] [CrossRef] [PubMed]
- Feng, S.; Lu, H.; Liu, Y. The occurrence of microplastics in farmland and grassland soils in the Qinghai-Tibet plateau: Different land use and mulching time in facility agriculture. Environ. Pollut. 2021, 279, 116939. [Google Scholar] [CrossRef] [PubMed]
- Klein, S.; Worch, E.; Knepper, T.P. Occurrence and Spatial Distribution of Microplastics in River Shore Sediments of the Rhine-Main Area in Germany. Environ. Sci. Technol. 2015, 49, 6070–6076. [Google Scholar] [CrossRef] [PubMed]
- Dai, Z.; Zhang, H.; Zhou, Q.; Tian, Y.; Chen, T.; Tu, C.; Fu, C.; Luo, Y. Occurrence of microplastics in the water column and sediment in an inland sea affected by intensive anthropogenic activities. Environ. Pollut. 2018, 242, 1557–1565. [Google Scholar] [CrossRef]
- Castro, R.O.; da Silva, M.L.; Marques, M.R.; de Araújo, F.V. Spatio-temporal evaluation of macro, meso and microplastics in surface waters, bottom and beach sediments of two embayments in Niterói, RJ, Brazil. Mar. Pollut. Bull. 2020, 160, 111537. [Google Scholar] [CrossRef]
- Riani, E.; Cordova, M.R. Microplastic ingestion by the sandfish Holothuria scabra in Lampung and Sumbawa, Indonesia. Mar. Pollut. Bull. 2021, 113134. [Google Scholar] [CrossRef] [PubMed]
- Nel, H.A.; Dalu, T.; Wasserman, R.J. Sinks and sources: Assessing microplastic abundance in river sediment and deposit feeders in an Austral temperate urban river system. Sci. Total Environ. 2018, 612, 950–956. [Google Scholar] [CrossRef] [PubMed]
- Mani, T.; Hauk, A.; Walter, U.; Burkhardt-Holm, P. Microplastics profile along the Rhine River. Sci. Rep. 2016, 5, 17988. [Google Scholar] [CrossRef] [PubMed]
- Gerolin, C.R.; Pupim, F.N.; Sawakuchi, A.O.; Grohmann, C.H.; Labuto, G.; Semensatto, D. Microplastics in sediments from Amazon rivers, Brazil. Sci. Total Environ. 2020, 749, 141604. [Google Scholar] [CrossRef] [PubMed]
- Alam, F.C.; Sembiring, E.; Muntalif, B.S.; Suendo, V. Microplastic distribution in surface water and sediment river around slum and industrial area (case study: Ciwalengke River, Majalaya district, Indonesia). Chemosphere 2019, 224, 637–645. [Google Scholar] [CrossRef]
- Cordova, M.R.; Riani, E.; Shiomoto, A. Microplastics ingestion by blue panchax fish (Aplocheilus sp.) from Ciliwung Estuary, Jakarta, Indonesia. Mar. Pollut. Bull. 2020, 161, 111763. [Google Scholar] [CrossRef] [PubMed]
- Eriksen, M.; Mason, S.; Wilson, S.; Box, C.; Zellers, A.; Edwards, W.; Farley, H.; Amato, S. Microplastic pollution in the surface waters of the Laurentian Great Lakes. Mar. Pollut. Bull. 2013, 77, 177–182. [Google Scholar] [CrossRef] [PubMed]
- Bertoldi, C.; Lara, L.Z.; Mizushima, F.A.D.L.; Martins, F.C.; Battisti, M.A.; Hinrichs, R.; Fernandes, A.N. First evidence of microplastic contamination in the freshwater of Lake Guaíba, Porto Alegre, Brazil. Sci. Total Environ. 2020, 759, 143503. [Google Scholar] [CrossRef] [PubMed]
- Baldwin, A.; Corsi, S.R.; Mason, S.A. Plastic Debris in 29 Great Lakes Tributaries: Relations to Watershed Attributes and Hydrology. Environ. Sci. Technol. 2016, 50, 10377–10385. [Google Scholar] [CrossRef] [PubMed]
- Sathish, N.; Jeyasanta, K.I.; Patterson, J. Abundance, characteristics and surface degradation features of microplastics in beach sediments of five coastal areas in Tamil Nadu, India. Mar. Pollut. Bull. 2019, 142, 112–118. [Google Scholar] [CrossRef] [PubMed]
- Jeyasanta, K.I.; Patterson, J.; Grimsditch, G.; Edward, J.P. Occurrence and characteristics of microplastics in the coral reef, sea grass and near shore habitats of Rameswaram Island, India. Mar. Pollut. Bull. 2020, 160, 111674. [Google Scholar] [CrossRef] [PubMed]
- Sathish, M.N.; Jeyasanta, I.; Patterson, J. Occurrence of microplastics in epipelagic and mesopelagic fishes from Tuticorin, Southeast coast of India. Sci. Total Environ. 2020, 720, 137614. [Google Scholar] [CrossRef] [PubMed]
- Robin, R.; Karthik, R.; Purvaja, R.; Ganguly, D.; Anandavelu, I.; Mugilarasan, M.; Ramesh, R. Holistic assessment of microplastics in various coastal environmental matrices, southwest coast of India. Sci. Total Environ. 2019, 703, 134947. [Google Scholar] [CrossRef] [PubMed]
- Frias, J.P.G.L.; Otero, V.; Sobral, P. Evidence of microplastics in samples of zooplankton from Portuguese coastal waters. Mar. Environ. Res. 2014, 95, 89–95. [Google Scholar] [CrossRef] [PubMed]
- Sundar, S.; Chokkalingam, L.; Roy, P.D.; Usha, T. Estimation of microplastics in sediments at the southernmost coast of India (Kanyakumari). Environ. Sci. Pollut. Res. 2020, 28, 18495–18500. [Google Scholar] [CrossRef]
- Karthik, R.; Robin, R.; Purvaja, R.; Ganguly, D.; Anandavelu, I.; Raghuraman, R.; Hariharan, G.; Ramakrishna, A.; Ramesh, R. Microplastics along the beaches of southeast coast of India. Sci. Total Environ. 2018, 645, 1388–1399. [Google Scholar] [CrossRef] [PubMed]
- Ripken, C.; Kotsifaki, D.G.; Nic Chormaic, S. Analysis of small microplastics in coastal surface water samples of the subtropical island of Okinawa, Japan. Sci. Total Environ. 2020, 760, 143927. [Google Scholar] [CrossRef]
- Erdogan, S. Microplastic pollution in freshwater ecosystems: A case study from Turkey. Ege J. Fish. Aquat. Sci. 2020, 37, 213–221. [Google Scholar] [CrossRef]
- Lusher, A.L.; Tirelli, V.; O’Connor, I.; Officer, R. Microplastics in Arctic polar waters: The first reported values of particles in surface and sub-surface samples. Sci. Rep. 2015, 5, 14947. [Google Scholar] [CrossRef] [PubMed] [Green Version]
- Sadri, S.S.; Thompson, R. On the quantity and composition of floating plastic debris entering and leaving the Tamar Estuary, Southwest England. Mar. Pollut. Bull. 2014, 81, 55–60. [Google Scholar] [CrossRef] [PubMed]
- Guerranti, C.; Martellini, T.; Perra, G.; Scopetani, C.; Cincinelli, A. Microplastics in cosmetics: Environmental issues and needs for global bans. Environ. Toxicol. Pharmacol. 2019, 68, 75–79. [Google Scholar] [CrossRef] [PubMed]
- Kumar, R.; Sharma, P.; Manna, C.; Jain, M. Abundance, interaction, ingestion, ecological concerns, and mitigation policies of microplastic pollution in riverine ecosystem: A review. Sci. Total Environ. 2021, 782, 146695. [Google Scholar] [CrossRef]
- Larsen, J.; Venkova, S. The Downfall of the Plastic Bag: A Global Picture 2014. Available online: http://www.earth-policy.org/plan_b_updates/2014/update123 (accessed on 20 December 2021).
- Jiang, J.-Q. Occurrence of microplastics and its pollution in the environment: A review. Sustain. Prod. Consum. 2018, 13, 16–23. [Google Scholar] [CrossRef]
- Laskar, N.; Kumar, U. Plastics and microplastics: A threat to environment. Environ. Technol. Innov. 2019, 14, 100352. [Google Scholar] [CrossRef]
- Li, L.; Geng, S.; Wu, C.; Song, K.; Sun, F.; Visvanathan, C.; Xie, F.; Wang, Q. Microplastics contamination in different trophic state lakes along the middle and lower reaches of Yangtze River Basin. Environ. Pollut. 2019, 254, 112951. [Google Scholar] [CrossRef] [PubMed]


Publisher’s Note: MDPI stays neutral with regard to jurisdictional claims in published maps and institutional affiliations. |
© 2022 by the authors. Licensee MDPI, Basel, Switzerland. This article is an open access article distributed under the terms and conditions of the Creative Commons Attribution (CC BY) license (https://creativecommons.org/licenses/by/4.0/).
Share and Cite
Lin, C.-T.; Chiu, M.-C.; Kuo, M.-H. A Mini-Review of Strategies for Quantifying Anthropogenic Activities in Microplastic Studies in Aquatic Environments. Polymers 2022, 14, 198. https://doi.org/10.3390/polym14010198
Lin C-T, Chiu M-C, Kuo M-H. A Mini-Review of Strategies for Quantifying Anthropogenic Activities in Microplastic Studies in Aquatic Environments. Polymers. 2022; 14(1):198. https://doi.org/10.3390/polym14010198
Chicago/Turabian StyleLin, Chun-Ting, Ming-Chih Chiu, and Mei-Hwa Kuo. 2022. "A Mini-Review of Strategies for Quantifying Anthropogenic Activities in Microplastic Studies in Aquatic Environments" Polymers 14, no. 1: 198. https://doi.org/10.3390/polym14010198
APA StyleLin, C.-T., Chiu, M.-C., & Kuo, M.-H. (2022). A Mini-Review of Strategies for Quantifying Anthropogenic Activities in Microplastic Studies in Aquatic Environments. Polymers, 14(1), 198. https://doi.org/10.3390/polym14010198