
Product Design by Additive Manufacturing for Water Environments: Study of Degradation and Absorption Behavior of PLA and PETG

 ,
,  ,
,  and
and
Abstract

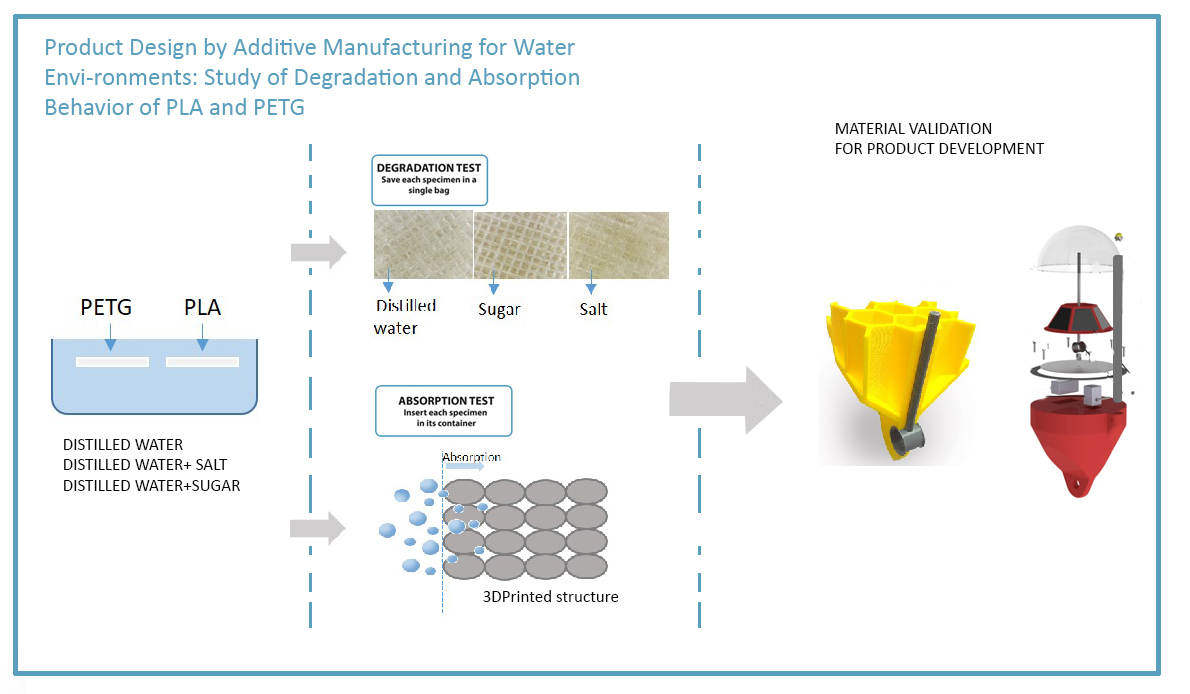
1. Introduction
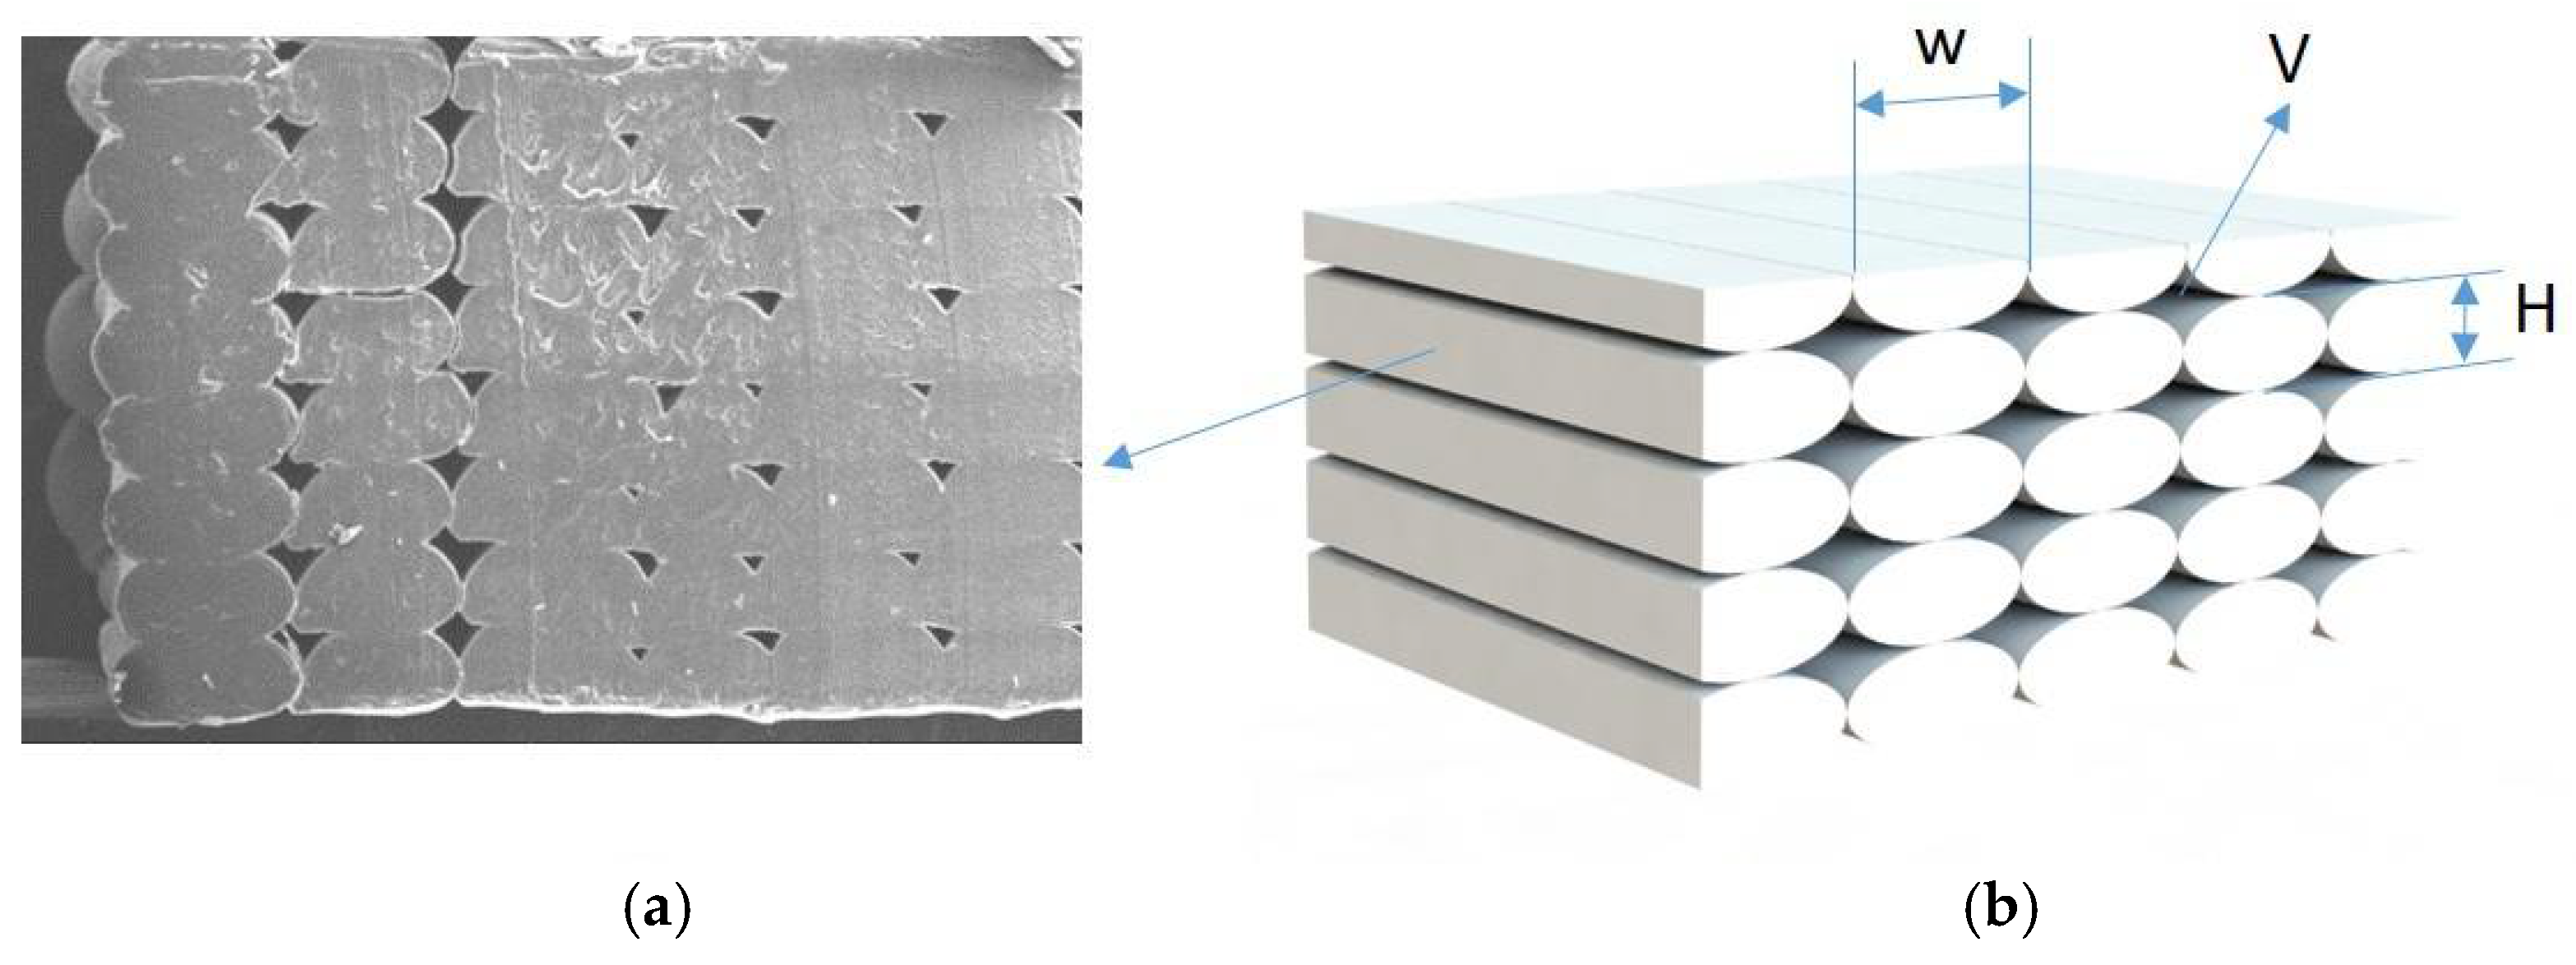
2. Materials and Methods
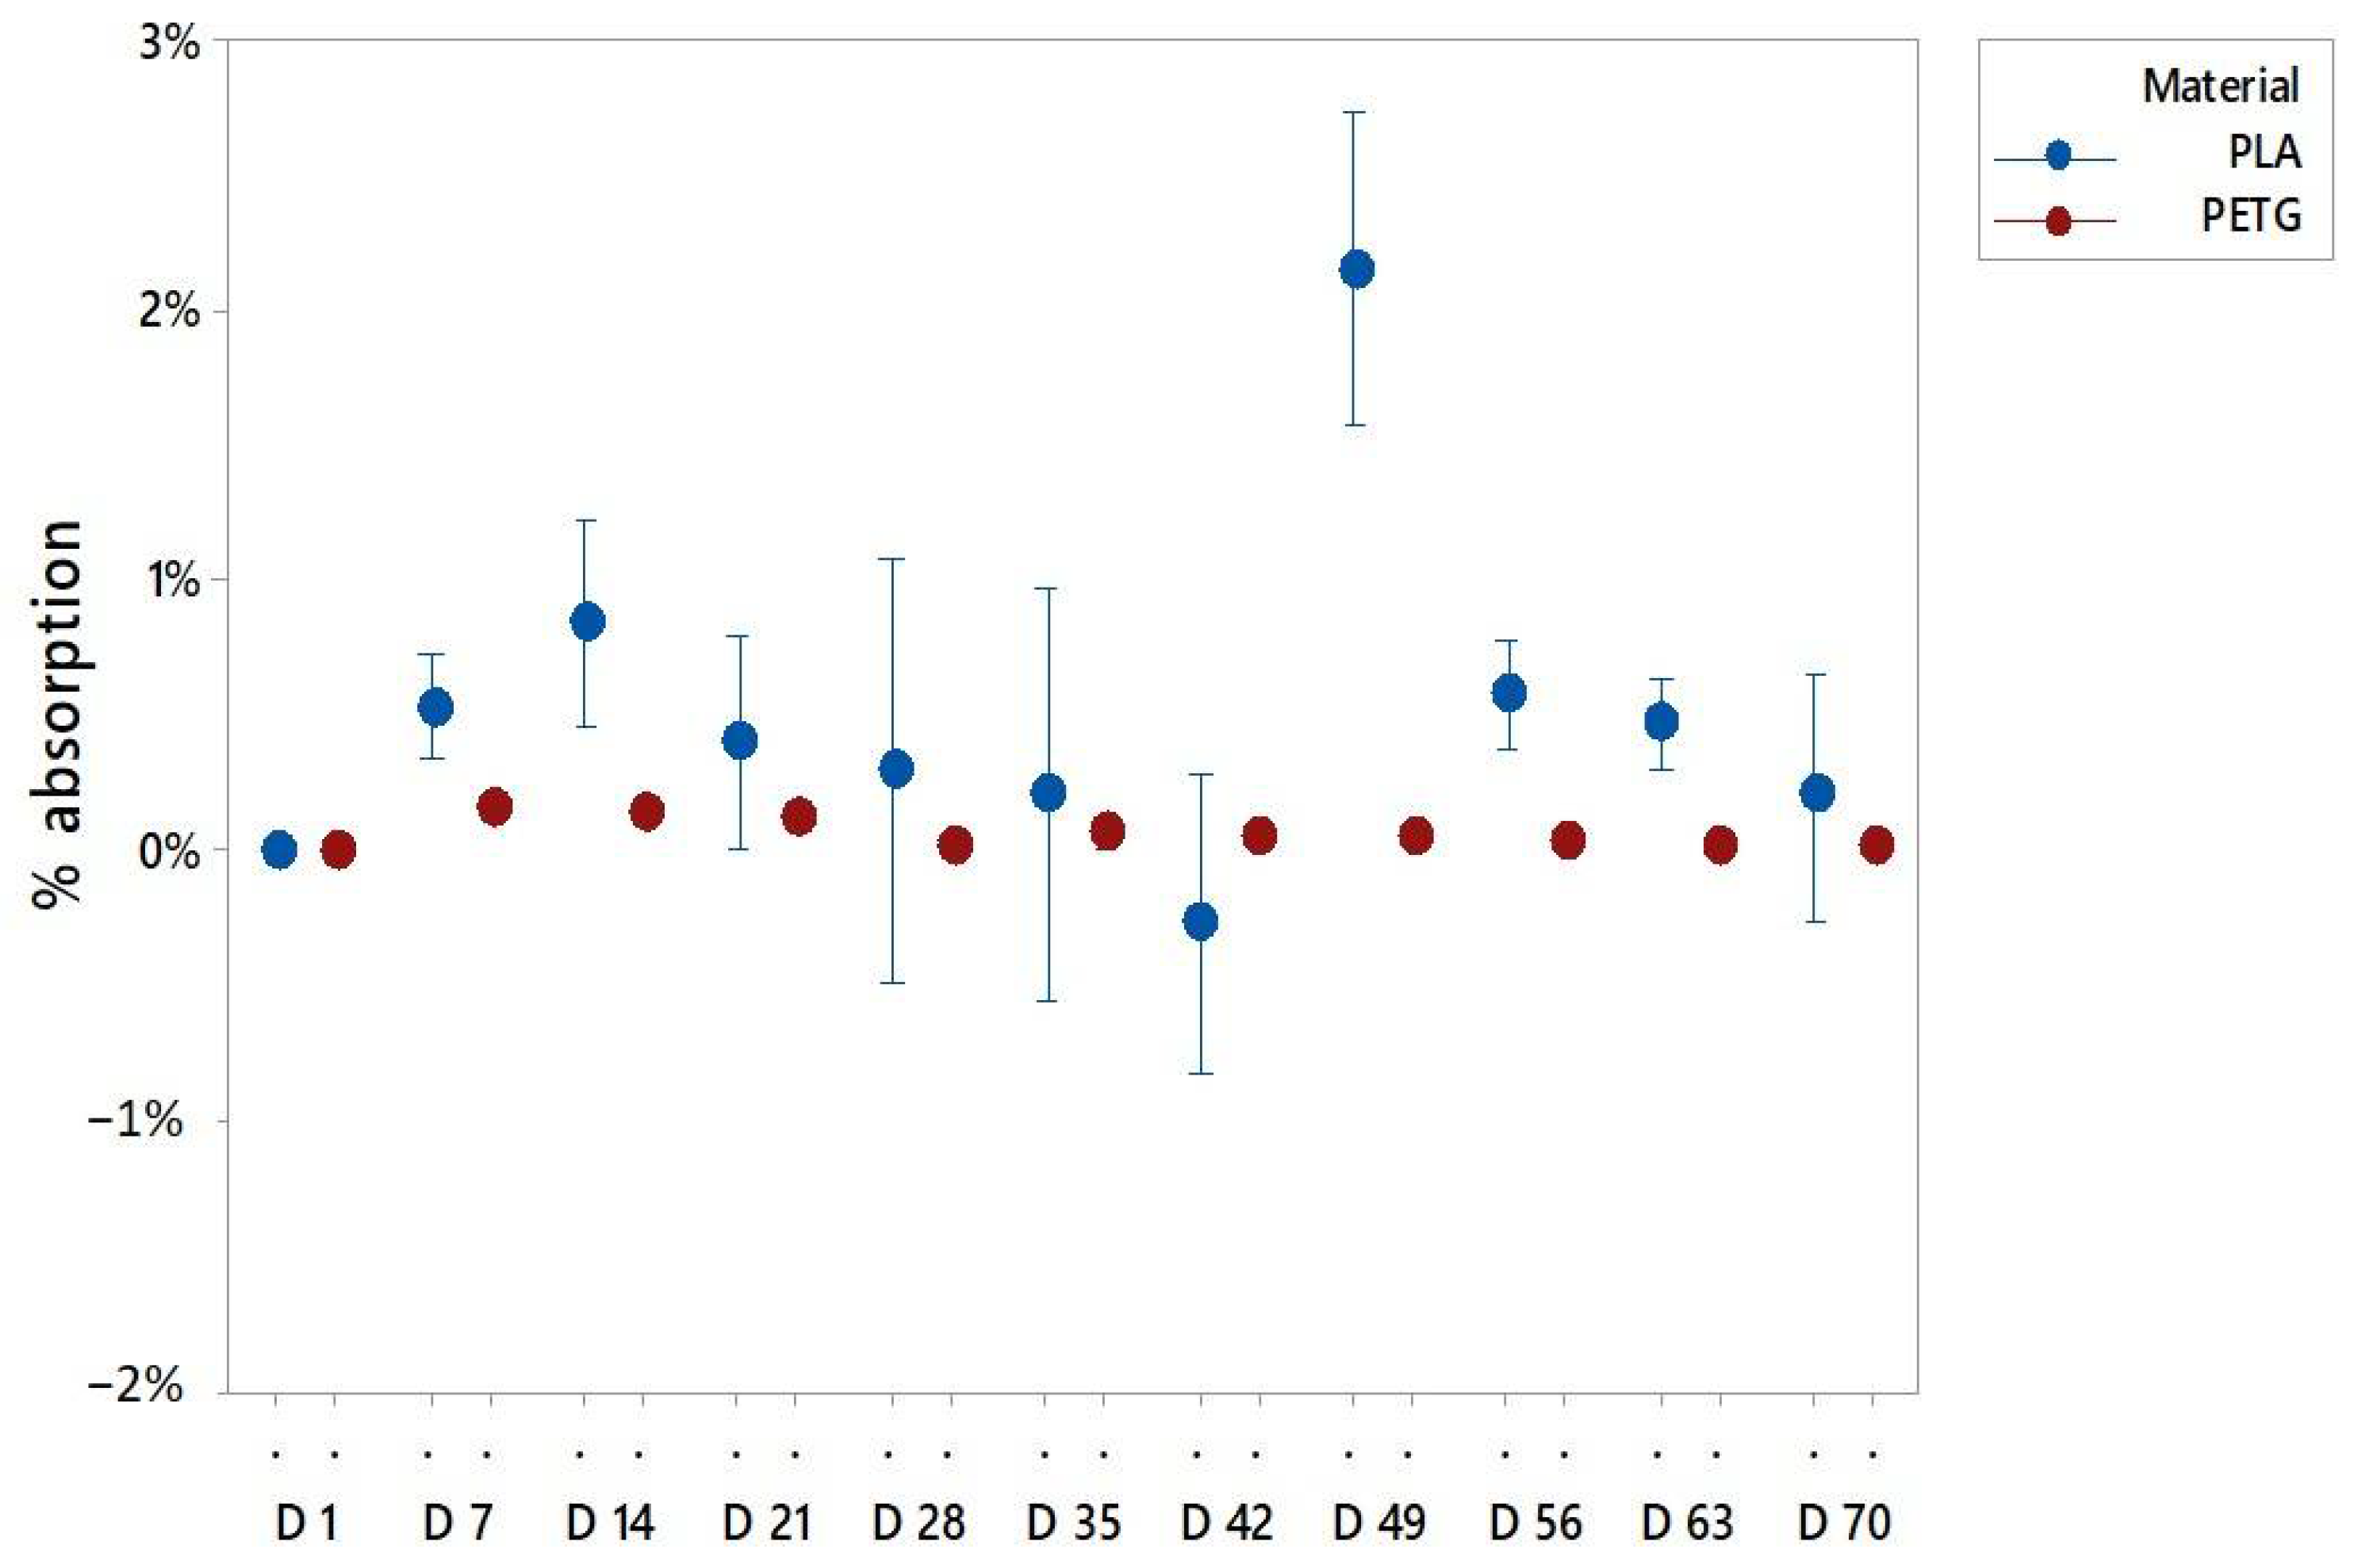
3. Results and Discussion
3.1. Water Absorption Test
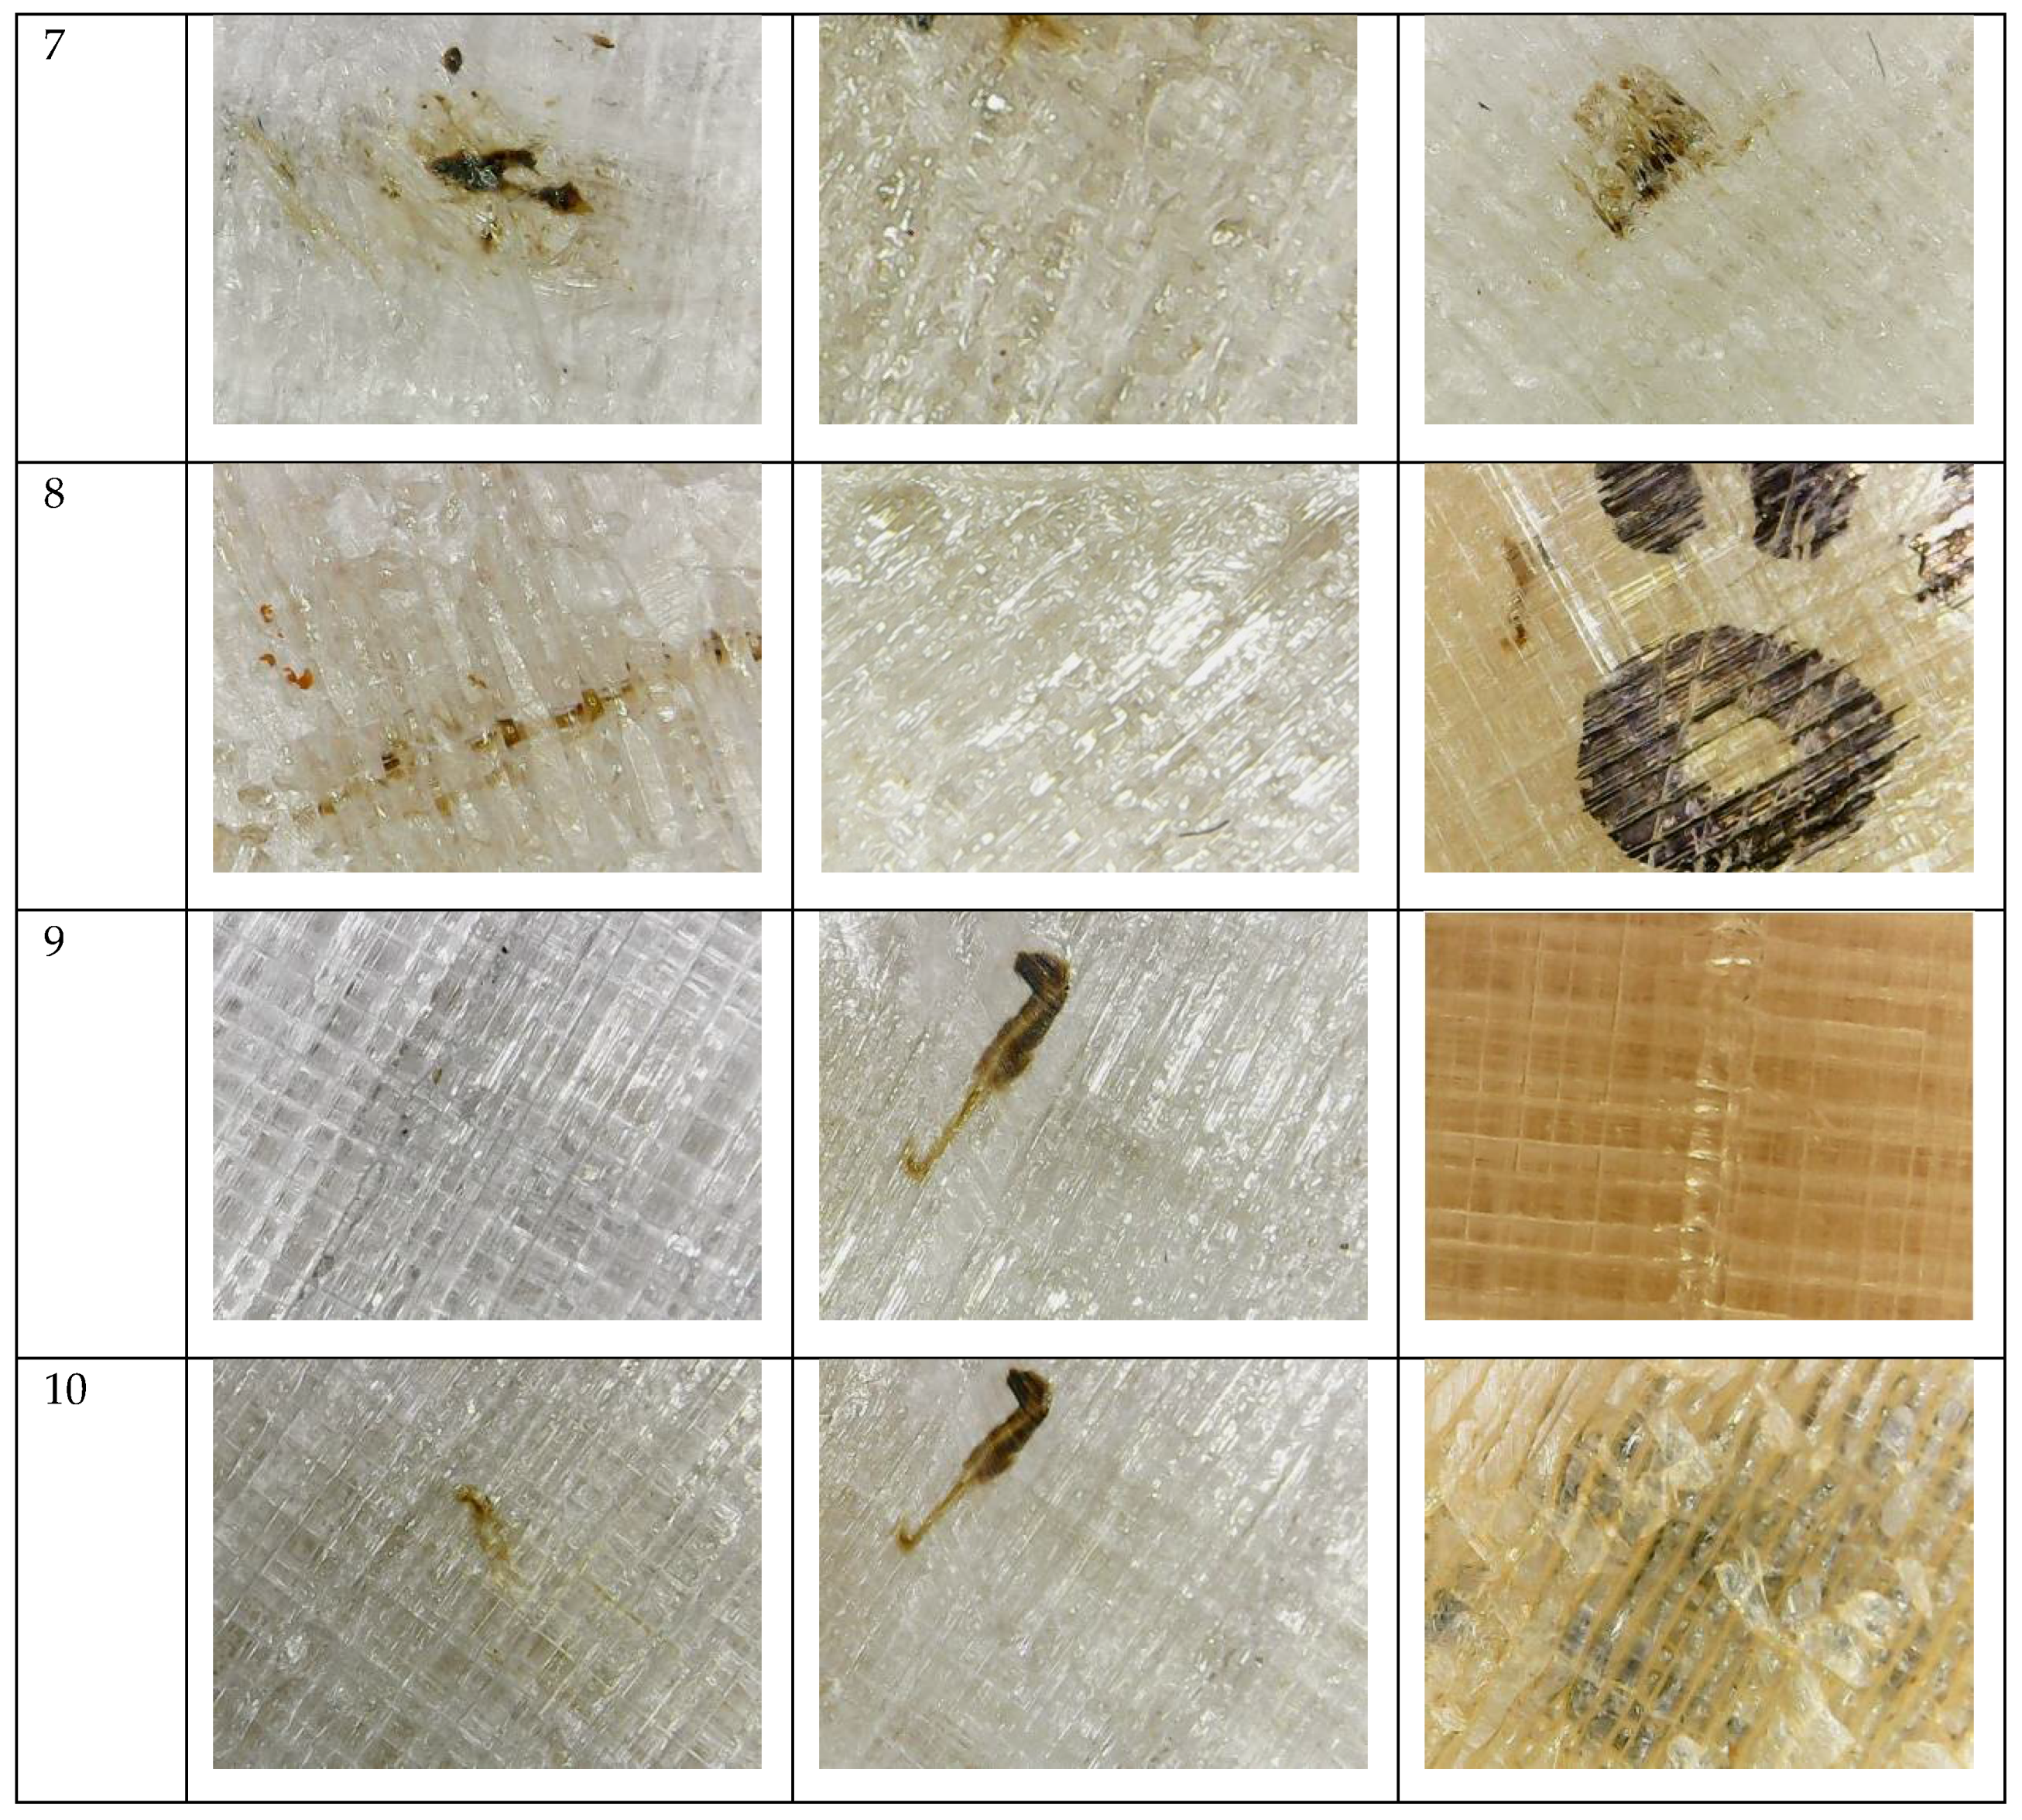
3.2. Degradation Test
4. Product Development Case Study
5. Conclusions
Author Contributions
Funding
Institutional Review Board Statement
Informed Consent Statement
Data Availability Statement
Acknowledgments
Conflicts of Interest
Appendix A


References
- ASTM-F42.91 Subcommittee. Standard Terminology for Additive Manufacturing Technologies; American Standard for Testing Materials: West Conshohocken, PA, USA, 2015. [Google Scholar]
- Gibson, I.; Rosen, D.W.; Stucker, B.; Gibson, B.S.I.; Rosen, D.W. Additive Manufacturing Technologies: Rapid Prototyping to Direct Digital Manufacturing, 2nd ed.; Springer: Berlin/Heidelberg, Germany, 2015; Volume 54. [Google Scholar]
- Ahn, S.H.; Montero, M.; Odell, D.; Roundy, S.; Wright, P.K. Anisotropic material properties of fused deposition modeling ABS. Rapid Prototyp. J. 2002, 8, 248–257. [Google Scholar] [CrossRef]
- Szykiedans, K.; Credo, W.; Osiński, D. Selected Mechanical Properties of PETG 3-D Prints. Procedia Eng. 2017, 177, 455–461. [Google Scholar] [CrossRef]
- Cicala, G.; Ognibene, G.; Portuesi, S.; Blanco, I.; Rapisarda, M.; Pergolizzi, E.; Recca, G. Comparison of Ultem 9085 Used in Fused Deposition Modelling (FDM) with Polytherimide Blends. Materials 2018, 11, 285. [Google Scholar] [CrossRef] [PubMed]
- Wang, T.M.; Xi, J.T.; Jin, Y. A model research for prototype warp deformation in the FDM process. Int. J. Adv. Manuf. Technol. 2007, 33, 1087–1096. [Google Scholar] [CrossRef]
- Ivanova, O.; Williams, C.; Campbell, T. Additive manufacturing (AM) and nanotechnology: Promises and challenges. Rapid Prototyp. J. 2013, 19, 353–364. [Google Scholar] [CrossRef]
- Relinque, J.J.; de León, A.S.; Hernández-Saz, J.; García-Romero, M.G.; Navas-Martos, F.J.; Morales-Cid, G.; Molina, S.I. Development of surface-coated polylactic acid/polyhydroxyalkanoate (PLA/PHA) nanocomposites. Polymers 2019, 11, 400. [Google Scholar] [CrossRef] [PubMed]
- Rosen, D.W. Design for additive manufacturing: A method to explore unexplored regions of the design space. Eighteenth Annu. Solid Free. Fabr. Symp. 2007, 402–415. [Google Scholar] [CrossRef]
- Pastor-Artigues, M.-M.; Roure-Fernández, F.; Ayneto-Gubert, X.; Bonada-Bo, J.; Pérez-Guindal, E.; Buj-Corral, I. Elastic Asymmetry of PLA Material in FDM-Printed Parts: Considerations Concerning Experimental Characterisation for Use in Numerical Simulations. Materials 2020, 13, 15. [Google Scholar] [CrossRef]
- Mazzanti, V.; Malagutti, L.; Mollica, F. FDM 3D Printing of Polymers Containing Natural Fillers: A Review of their Mechanical Properties. Polymers 2019, 11, 1094. [Google Scholar] [CrossRef]
- García-Domínguez, A.; Claver, J.; Camacho, A.M.; Sebastián, M.A. Considerations on the Applicability of Test Methods for Mechanical Characterization of Materials Manufactured by FDM. Materials 2020, 13, 28. [Google Scholar] [CrossRef]
- Iquebal, A.S.; El Amri, S.; Shrestha, S.; Wang, Z.; Manogharan, G.P.; Bukkapatnam, S. Longitudinal milling and fine abrasive finishing operations to improve surface integrity of metal am components. Procedia Manuf. 2017, 10, 990–996. [Google Scholar] [CrossRef]
- Galantucci, L.M.; Lavecchia, F.; Percoco, G. Experimental study aiming to enhance the surface finish of fused deposition modeled parts. CIRP Ann. 2009, 58, 189–192. [Google Scholar] [CrossRef]
- Algarni, M. The Influence of Raster Angle and Moisture Content on the Mechanical Properties of PLA Parts Produced by Fused Deposition Modeling. Polymers 2021, 13, 237. [Google Scholar] [CrossRef] [PubMed]
- Ayrilmis, N.; Kariz, M.; Kwon, J.H.; Kuzman, M.K. Effect of printing layer thickness on water absorption and mechanical properties of 3D-printed wood/PLA composite materials. Int. J. Adv. Manuf. Technol. 2019, 102, 2195–2200. [Google Scholar] [CrossRef]
- Vicente, C.; Fernandes, J.; Deus, A.; Vaz, M.; Leite, M.; Reis, L. Effect of protective coatings on the water absorption and mechanical properties of 3D printed PLA. Frat. Integrità Strutt. 2019, 13, 748–756. [Google Scholar] [CrossRef]
- Kakanuru, P.; Pochiraju, K. Moisture Ingress and Degradation of Additively Manufactured PLA, ABS and PLA/SiC Composite Parts. Addit. Manuf. 2020, 36, 101529. [Google Scholar] [CrossRef]
- Kariz, M.; Sernek, M.; Kuzman, M.K. Effect of humidity on 3D-printed specimens from wood-PLA filaments. Wood Res. 2018, 63, 917–922. [Google Scholar]
- Kwon, D.; Park, E.; Ha, S.; Kim, N. Effect of humidity changes on dimensional stability of 3D printed parts by selective laser sintering. Int. J. Precis. Eng. Manuf. 2017, 18, 1275–1280. [Google Scholar] [CrossRef]
- Cuiffo, M.A.; Snyder, J.; Elliott, A.M.; Romero, N.; Kannan, S.; Halada, G.P. Impact of the Fused Deposition (FDM) Printing Process on Polylactic Acid (PLA) Chemistry and Structure. Appl. Sci. 2017, 7, 579. [Google Scholar] [CrossRef]
- Li, S.; McCarthy, S. Further investigations on the hydrolytic degradation of poly (DL-lactide). Biomaterials 1999, 20, 35–44. [Google Scholar] [CrossRef]
- De Jong, S.J.; Arias, E.R.; Rijkers, D.T.S.; van Nostrum, C.F.; Kettenes-van den Bosch, J.J.; Hennink, W.E. Newinsights into the hydrolytic degradation of poly(lactic acid): Participation of the alcohol terminus. Polymer 2001, 42, 2795–2802. [Google Scholar] [CrossRef]
- Kaza, S.; Yao, L.; Bhada-Tata, P.; Van Woerden, F. What a Waste 2.0: A Global Snapshot of Solid Waste Management to 2050; World Bank Publications: Washington, DC, USA, 2018; p. 295. [Google Scholar]
- Ivanov, D.; Bliznakova, K.; Buliev, I.; Popov, P.; Mettivier, G.; Russo, P. Suitability of low density materials for 3D printing of physical breast phantoms Suitability of low density materials for 3D printing of physical breast phantoms. Phys. Med. Biol. 2018, 17, 175020. [Google Scholar] [CrossRef] [PubMed]
- Habel, C.; Schöttle, M.; Daab, M.; Eichstaedt, N.J.; Wagner, D.; Bakhshi, H.; Agarwal, S.; Horn, M.A.; Breu, J. High-Barrier, Biodegradable Food Packaging. Macromol. Mater. Eng. 2018, 303, 1800333. [Google Scholar] [CrossRef]
- Bałdowska-Witos, P.; Kruszelnicka, W.; Tomporowski, A. Life cycle assessment of beverage bottles. J. Phys. Conf. Ser. 2020, 1426, 12038. [Google Scholar] [CrossRef]
- Ziółkowski, M.; Dyl, T. Possible Applications of Additive Manufacturing Technologies in Shipbuilding: A Review. Machines 2020, 8, 84. [Google Scholar] [CrossRef]
- Rodrigues, C.; Nunes, D.; Clemente, D.; Mathias, N.; Correia, J.M.; Rosa-Santos, P.; Ventura, J. Emerging triboelectric nanogenerators for ocean wave energy harvesting: State of the art and future perspectives. Energy Environ. Sci. 2020, 13, 2657–2683. [Google Scholar] [CrossRef]
- Rodríguez-Parada, L.; Mayuet, P.F.; Gámez, A.J. Evaluation of Reliefs’ Properties on Design of Thermoformed Packaging Using Fused Deposition Modelling Moulds. Materials 2019, 12, 478. [Google Scholar] [CrossRef]
- Nieto, D.M.; López, V.C.; Molina, S.I. Large-format polymeric pellet-based additive manufacturing for the naval industry. Addit. Manuf. 2018, 23, 79–85. [Google Scholar] [CrossRef]
- Benedict. 3D Printed Submarine Built with ORNL’s BAAM 3D Printer Suggests Additive Future for Navy. 3ders. 2017. Available online: https://www.3ders.org/articles/20170721-3d-printed-submarine-built-with-ornls-baam-3d-printer-suggests-additive-future-for-navy.html (accessed on 20 November 2020).
- Lehvoss. Official Presentation of 3D Printed Sail Boat for Mini Transat Ocean Race 2019. Lehvoss Italia. 2018. Available online: https://www.lehvoss.it/en/news-events/news/details/article/official-presentation-of-3d-printed-sail-boat-for-mini-transat-ocean-race-2019-1/ (accessed on 14 May 2020).
- Nicholson, J.W. The Chemistry of Polymers; Royal Society of Chemistry: London, UK, 1991. [Google Scholar]
- Wahit, M.U.; Hassan, A.; Ibrahim, A.N.; Zawawi, N.A.; Kunasegeran, K. Mechanical, thermal and chemical resistance of epoxidized natural rubber toughened polylactic acid blends. Sains Malays. 2015, 44, 1615–1623. [Google Scholar]
- ISO Standards. Plastics-Determination of Water Absorption; ISO 62:2008; International Organization for Standardization: Geneva, Switzerland, 2008. [Google Scholar]
- Latko-Durałek, P.; Dydek, K.; Boczkowska, A. Thermal, Rheological and Mechanical Properties of PETG/rPETG Blends. J. Polym. Environ. 2019, 27, 2600–2606. [Google Scholar] [CrossRef]
- ISO Standards. Corrosion Tests in Artificial Atmospheres—Salt Spray Tests; ISO 9227:2017; International Organization for Standardization: Geneva, Switzerland, 2017. [Google Scholar]
- ISO Standards. Plastics—Methods of Test for the Determination of the Effects of Immersion in Liquid Chemicals; ISO 175:2001; International Organization for Standardization: Geneva, Switzerland, 2001. [Google Scholar]
- Hannay, F. Rigid Plastics Packaging: Materials, Processes and Applications; Rapra Technology: Shawbury, UK, 2002. [Google Scholar]
- Schweitzer, J.-P.; Gionfra, S.; Pantzar, M.; Mottershead, D.; Watkins, E.; Petsinaris, F.; Brink, P.T.; Ptak, E.; Lacey, C.; Janssens, C. Plastic Packaging and Food Waste—New Perspectives on a Dual Sustainability Crisis. Available online: https://ieep.eu/publications/plastic-packaging-and-food-waste-new-perspectives-on-a-dual-sustainability-crisis (accessed on 11 July 2018).
- Wikström, F.; Verghese, K.; Auras, R.; Olsson, A.; Williams, H.; Wever, R.; Soukka, R. Packaging strategies that save food: A research agenda for 2030. J. Ind. Ecol. 2019, 23, 532–540. [Google Scholar] [CrossRef]
- Muller, J.; González-Martínez, C.; Chiralt, A. Combination of poly (lactic) acid and starch for biodegradable food packaging. Materials 2017, 10, 952. [Google Scholar] [CrossRef] [PubMed]
- Turner, N.; Strong, R.; Gold, A. A review of melt extrusion additive manufacturing processes: I. Process design and modeling. Rapid Prototyp. J. 2014, 20, 192–204. [Google Scholar] [CrossRef]
- Turner, B.N.; Gold, S.A. A review of melt extrusion additive manufacturing processes: II. Materials, dimensional accuracy, and surface roughness. Rapid Prototyp. J. 2015, 21, 250–261. [Google Scholar] [CrossRef]
- Van der Vegt, A.K.; Govaert, L.E. Polymeren: Van Keten Tot Kunststof; VSSD: Twente, The Netherlands, 2005; ISBN 10 9040723885. [Google Scholar]
- Crawford, R.J.; Throne, J.L. Rotational molding polymers. In Rotational Molding Technology; Elsevier: Amsterdam, The Netherlands, 2002; pp. 19–68. [Google Scholar]
- Shaker, R.; Rodrigue, D. Rotomolding of thermoplastic elastomers based on low-density polyethylene and recycled natural rubber. Appl. Sci. 2019, 9, 5430. [Google Scholar] [CrossRef]
- Rosato, D.V.; Rosato, D.V.; Rosato, M.V. Plastic Product Material and Process Selection Handbook; Elsevier: Amsterdam, The Netherlands, 2004. [Google Scholar]
- Obi, B.E. Structural Foams. In Polymeric Foams Structure-Property-Performance; Elsevier: Amsterdam, The Netherlands, 2018; pp. 255–298. [Google Scholar]


| Process Parameters | PETG | PLA |
|---|---|---|
| Layer height (mm) | 0.2 | 0.2 |
| Printing rectilinear pattern (°) | 0/90 | 0/90 |
| Infill (%) | 100 | 100 |
| Printing temperature (°C) | 260 | 210 |
| Bed temperature (°C) | 60 | 24 |
| Printing speed (mm/s) | 37.5 | 40 |
| Adhesion type | Raft | Brim |
Publisher’s Note: MDPI stays neutral with regard to jurisdictional claims in published maps and institutional affiliations. |
© 2021 by the authors. Licensee MDPI, Basel, Switzerland. This article is an open access article distributed under the terms and conditions of the Creative Commons Attribution (CC BY) license (http://creativecommons.org/licenses/by/4.0/).
Share and Cite
Moreno Nieto, D.; Alonso-García, M.; Pardo-Vicente, M.-A.; Rodríguez-Parada, L. Product Design by Additive Manufacturing for Water Environments: Study of Degradation and Absorption Behavior of PLA and PETG. Polymers 2021, 13, 1036. https://doi.org/10.3390/polym13071036
Moreno Nieto D, Alonso-García M, Pardo-Vicente M-A, Rodríguez-Parada L. Product Design by Additive Manufacturing for Water Environments: Study of Degradation and Absorption Behavior of PLA and PETG. Polymers. 2021; 13(7):1036. https://doi.org/10.3390/polym13071036
Chicago/Turabian StyleMoreno Nieto, Daniel, María Alonso-García, Miguel-Angel Pardo-Vicente, and Lucía Rodríguez-Parada. 2021. "Product Design by Additive Manufacturing for Water Environments: Study of Degradation and Absorption Behavior of PLA and PETG" Polymers 13, no. 7: 1036. https://doi.org/10.3390/polym13071036
APA StyleMoreno Nieto, D., Alonso-García, M., Pardo-Vicente, M.-A., & Rodríguez-Parada, L. (2021). Product Design by Additive Manufacturing for Water Environments: Study of Degradation and Absorption Behavior of PLA and PETG. Polymers, 13(7), 1036. https://doi.org/10.3390/polym13071036