Article

Modelling and Investigation of Crack Growth for 3D-Printed Acrylonitrile Butadiene Styrene (ABS) with Various Printing Parameters and Ambient Temperatures

by
Yousef Lafi A. Alshammari
1,2,
Feiyang He
3 and
Muhammad A. Khan
4,*
1
School of Water, Energy and Environment, Cranfield University, Cranfield MK43 0AL, UK
2
Mechanical Engineering Department, Engineering College, Northern Border University, King Fahad Road, Arar 92341, Saudi Arabia
3
School of Aerospace, Transport and Manufacturing, Cranfield University, Cranfield MK43 0AL, UK
4
Centre for Life-Cycle Engineering and Management, Cranfield University, Cranfield MK43 0AL, UK
*
Author to whom correspondence should be addressed.
Polymers 2021, 13(21), 3737; https://doi.org/10.3390/polym13213737
Submission received: 9 October 2021 / Revised: 22 October 2021 / Accepted: 25 October 2021 / Published: 29 October 2021
(This article belongs to the Section Polymer Processing and Engineering)

Abstract

:
Three-dimensional (3D) printing is one of the significant industrial manufacturing methods in the modern era. Many materials are used for 3D printing; however, as the most used material in fused deposition modelling (FDM) technology, acrylonitrile butadiene styrene (ABS) offers good mechanical properties. It is perfect for making structures for industrial applications in complex environments. Three-dimensional printing parameters, including building orientation, layers thickness, and nozzle size, critically affect the crack growth in FDM structures under complex loads. Therefore, this paper used the dynamic bending vibration test to investigate their influence on fatigue crack growth (FCG) rate under dynamic loads and the Paris power law constant C and m. The paper proposed an analytical solution to determine the stress intensity factor (SIF) at the crack tip based on the measurement of structural dynamic response. The experimental results show that the lower ambient temperature, as well as increased nozzle size and layer thickness, provide a lower FCG rate. The printing orientation, which is the same as loading, also slows the crack growth. The linear regression between these parameters and Paris Law’s coefficient also proves the same conclusion.

1. Introduction

Three-dimensional (3D) printing is one of the additive manufacturing (AM) technology and has been developed over the years. In the past, 3D printing was primarily used for prototyping. However, because of its effective operation, freedom of customization, and cost-effectiveness, 3D printing has been used in many important applications in recent years, such as medical, automotive, aerospace, and biomechanical sectors [1,2,3,4,5].
Moreover, fused deposition modeling (FDM)) is one of the most used 3D printing techniques [6,7]. It is layer-by-layer printing, based on computer-aided design (CAD) and computer-aided manufacturing (CAM) [8]. Moreover, the most common materials used in this method are polymers because of their distinguished properties with low cost and light weight, making them suitable for essential applications, such as aircraft wings and wind blades [9].
These structures can experience fatigue failure due to dynamic loads in a complex thermo-mechanical environment [10,11,12]. Compared with other materials [13,14,15,16,17], the crack propagation during fatigue is highly complicated for FDM polymeric structures because of the significant differences in its microstructure due to various printing parameters. Therefore, the effect of 3D printing parameters on mechanical properties was discussed in much research.
Ismail et al. investigated the effect of raster angle and orientation on the mechanical properties of ABS printed parts using tensile and three-point bending tests [18]. Similar work has been carried out by Ziemian et al., whereby the effect of building orientation on fatigue strength of acrylonitrile butadiene styrene (ABS) parts fabricated by 3D printing was evaluated using the tensile test [19]. Furthermore, Sood et al. improved the compressive strength of the FDM ABS specimen by changing building orientation, raster angle and layer thickness, raster width, and gap [20]. Many other FDM polymeric materials were investigated too. The relationship between building orientations and the fatigue life of polylactic acid (PLA) specimens fabricated by 3D printing were tested under ultimate tensile stress with 50–80% nominal values [21]. Tymrak et al. measured and compared the tensile strength and elastic modulus of FDM ABS and PLA parts printed with different building orientations, layer thickness, and raster gap [22]. In another study, four FDM materials, including polycarbonate (PC), ABS, glycol-modified polyethylene terephthalate (PET-G), and PLA, investigated the effect of layer thickness on the impact strength [23]. Wang et al. analyzed the effect of layer thickness on mechanical properties of polyetheretherketone (PEEK) and its fiber-reinforced parts fabricated by 3D printing. Tensile, flexural and impact tests were performed for glass fiber (GF) and carbon fiber (CF) reinforced materials printed with layer thickness from 0.1 to 0.3 mm [24]. In addition to orientation and layer thickness, several other parameters were also evaluated in previous research. Vicente et al. studied the nozzle size influence on mechanical properties of 3D-printed ABS parts via the tensile test. The selected nozzle sizes, 0.4 mm and 0.8 mm, were compared with other printing parameters [25]. Zhang et al. tested the fracture behaviour of a glass fiber-reinforced polymeric joint by tensile with different temperatures ranging between −35 °C and 60 °C [26].
However, when we critically review the previous studies, it is found that the current research still lacks an investigation about the crack growth in a FDM polymeric structure. No research tested the crack propagation in a FDM structure like many similar works on conventionally manufactured polymers. For conventionally manufactured polymeric structures, a large number of studies tested the fatigue crack growth (FCG) rate considering the ambient temperature and loading frequency [27,28,29]. Luo et al. investigated the effect of temperature on the FCG rate of rubber polymer [27]. Kim and wang calculated the Paris’ power law constant C and m of ABS material at different temperatures and frequencies [28]. Similarly, Kim et al. calculated the Paris power law constant C and m in a commercial-grade ABS under different temperatures ranging from −50 °C to 80 °C [29].
It is found that the above research about conventionally manufactured polymers [27,28,29] investigated the FCG rate with the empirical correlation of Paris’ Law because this famous empirical model [30,31] can represent the crack propagation behavior. Roylance reported that the constants C and m in Paris’ law could be affected by the material type, testing temperature, and loading frequency [32]. So, similarly, the printing parameters of the FDM structure definitely can also affect the crack propagation and affect these two constants.
Therefore, this paper enhanced our previous research [33], which studied the fatigue life of FDM ABS with different printing parameters and ambient temperatures, to further test and investigate the effect of raster orientation, nozzle size, and layer thickness on crack propagation and Paris’ law for FDM ABS. Unlike the test for conventionally manufactured polymer, the dynamic thermo-mechanical loads are considered during tests to simulate the actual working conditions. Thus, the paper also provides an analytical solution to determine the dynamic stress intensity factor (SIF) used in Paris’ law correlation.

2. Materials and Methods

2.1. Printing Parameters

Like the previous work [33], the paper focused on three essential parameters: building orientation, layer thickness, and nozzle size. These parameters were tested under three different environment temperatures (50, 60, 70 °C).
Three values, as shown in Table 1 and Figure 1, Figure 2 and Figure 3, were evaluated for each printing parameter to cover the typical range of printing parameters. It was assisted in a complete assessment of the experimental results. Moreover, to deliver excellent print quality and a typical setting range, the layer thickness and nozzle size were derived from the profile of the default setting [33].

2.2. FDM Material

The red ABS (Color code: RAL 3020) filament fabricated by the Ultimaker® (Utrecht, The Netherlands) was selected as raw material (Filament details shown in Table 2) [33] because the ABS is the most used material for FDM and plastic zones can be clearly observed for red color material [33].

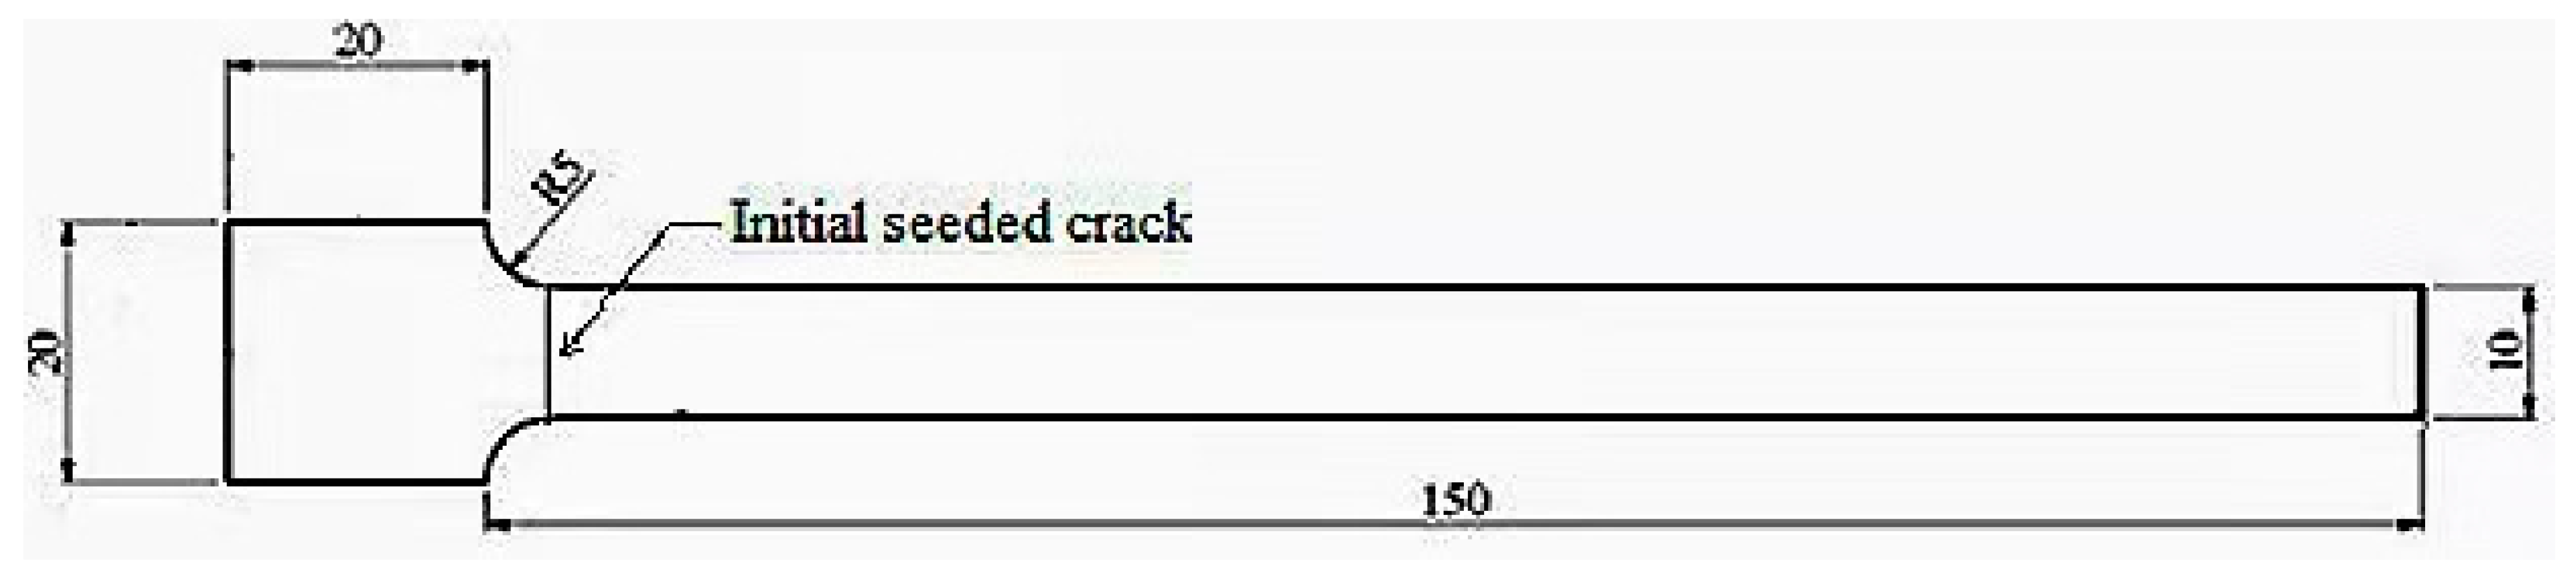
2.3. Sample Preparation

The bending fatigue test of FDM polymers does not have a specific standard. Therefore, the geometry of the sample was selected as 150 × 10 × 3 mm3, as shown in Figure 4, which is the same as that used in previous research [33,34]. Therefore, the results for the present experiment and previous research can be compared. There was a 0.5-mm-deep initial-seeded crack near the fixed end of the beam for all the samples to ensure that the maximum stress concentration took place at the same point. As a result, the crack location in all the experiments was the same and very similar to the fatigue failures of a real scenario due to the stress concentration.
The CATIA v5 CAD software was used to design the specimen. The CAD model of the specimen was built in CATIA v5 with an STL file format and imported to the Ultimaker® CURA 4.6 software. CURA software was used to set a series of printing parameters. Most parameters were maintained or recommended to default values during the printing process, apart from the selected parameters shown in Table 1. The printing process of the Ultimaker® 2+ 3D printer is shown in Figure 5.

2.4. Experiments

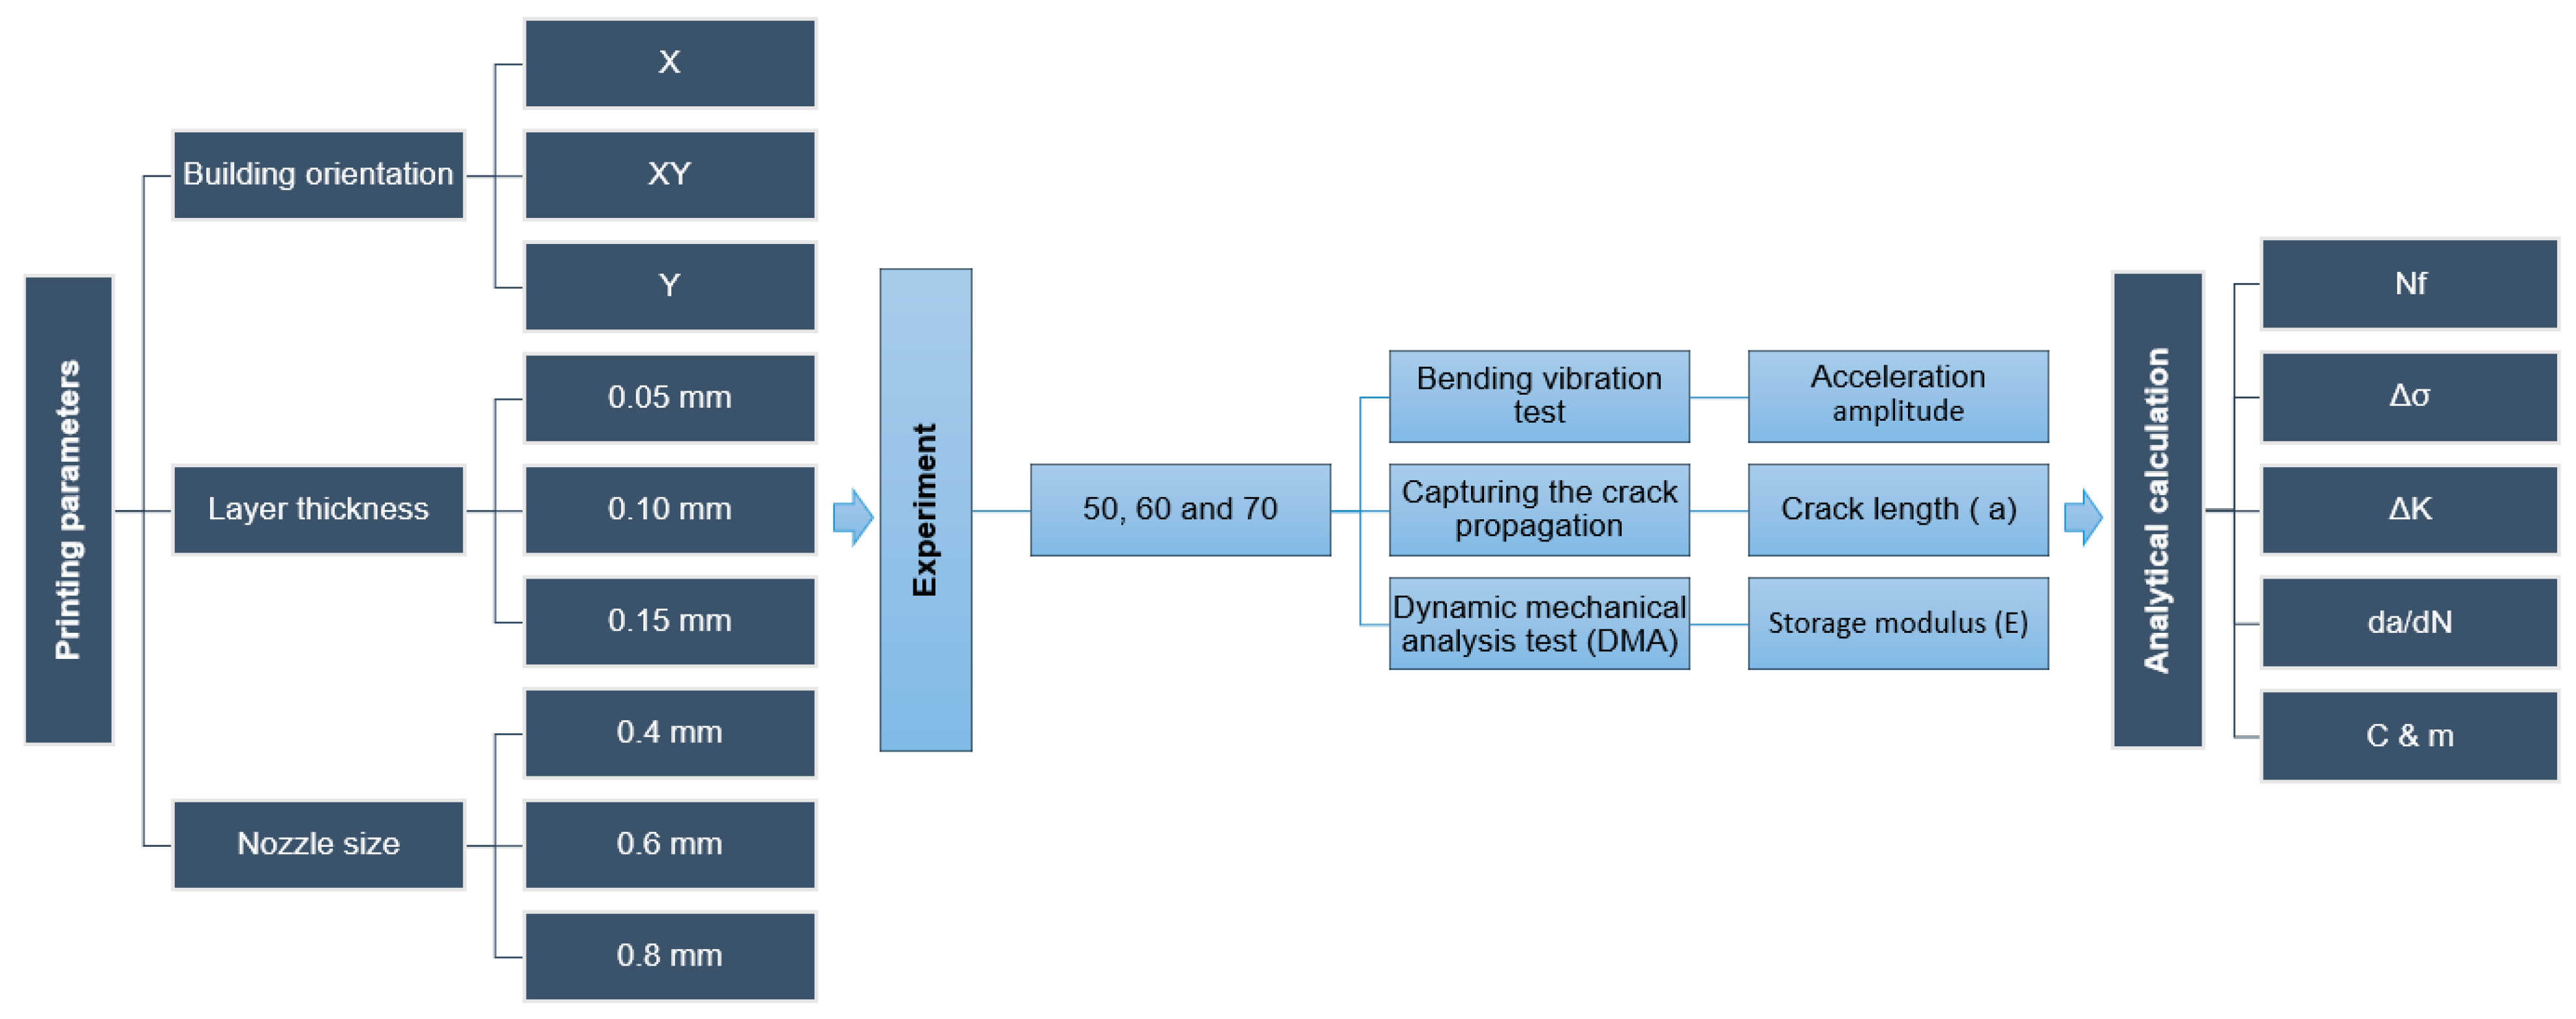
2.4.1. Experimental Scheme

The 81 configurations mentioned in Section 2.1 were tested by a series of experiments. The experiment was divided into three main parts. Firstly, the continuous bending vibration was applied to the specimen. The number of cycles between different crack propagation until fracture were recorded. Secondly, a digital microscope was used to capture the crack depth. Finally, a dynamic mechanical analysis test (DMA) was applied to the broken samples from the previous test to find the storage modulus. After that, the experimental outputs were used in analytical calculations to find out the SIF and FCG rate. The detailed experimental scheme can be shown in Figure 6.

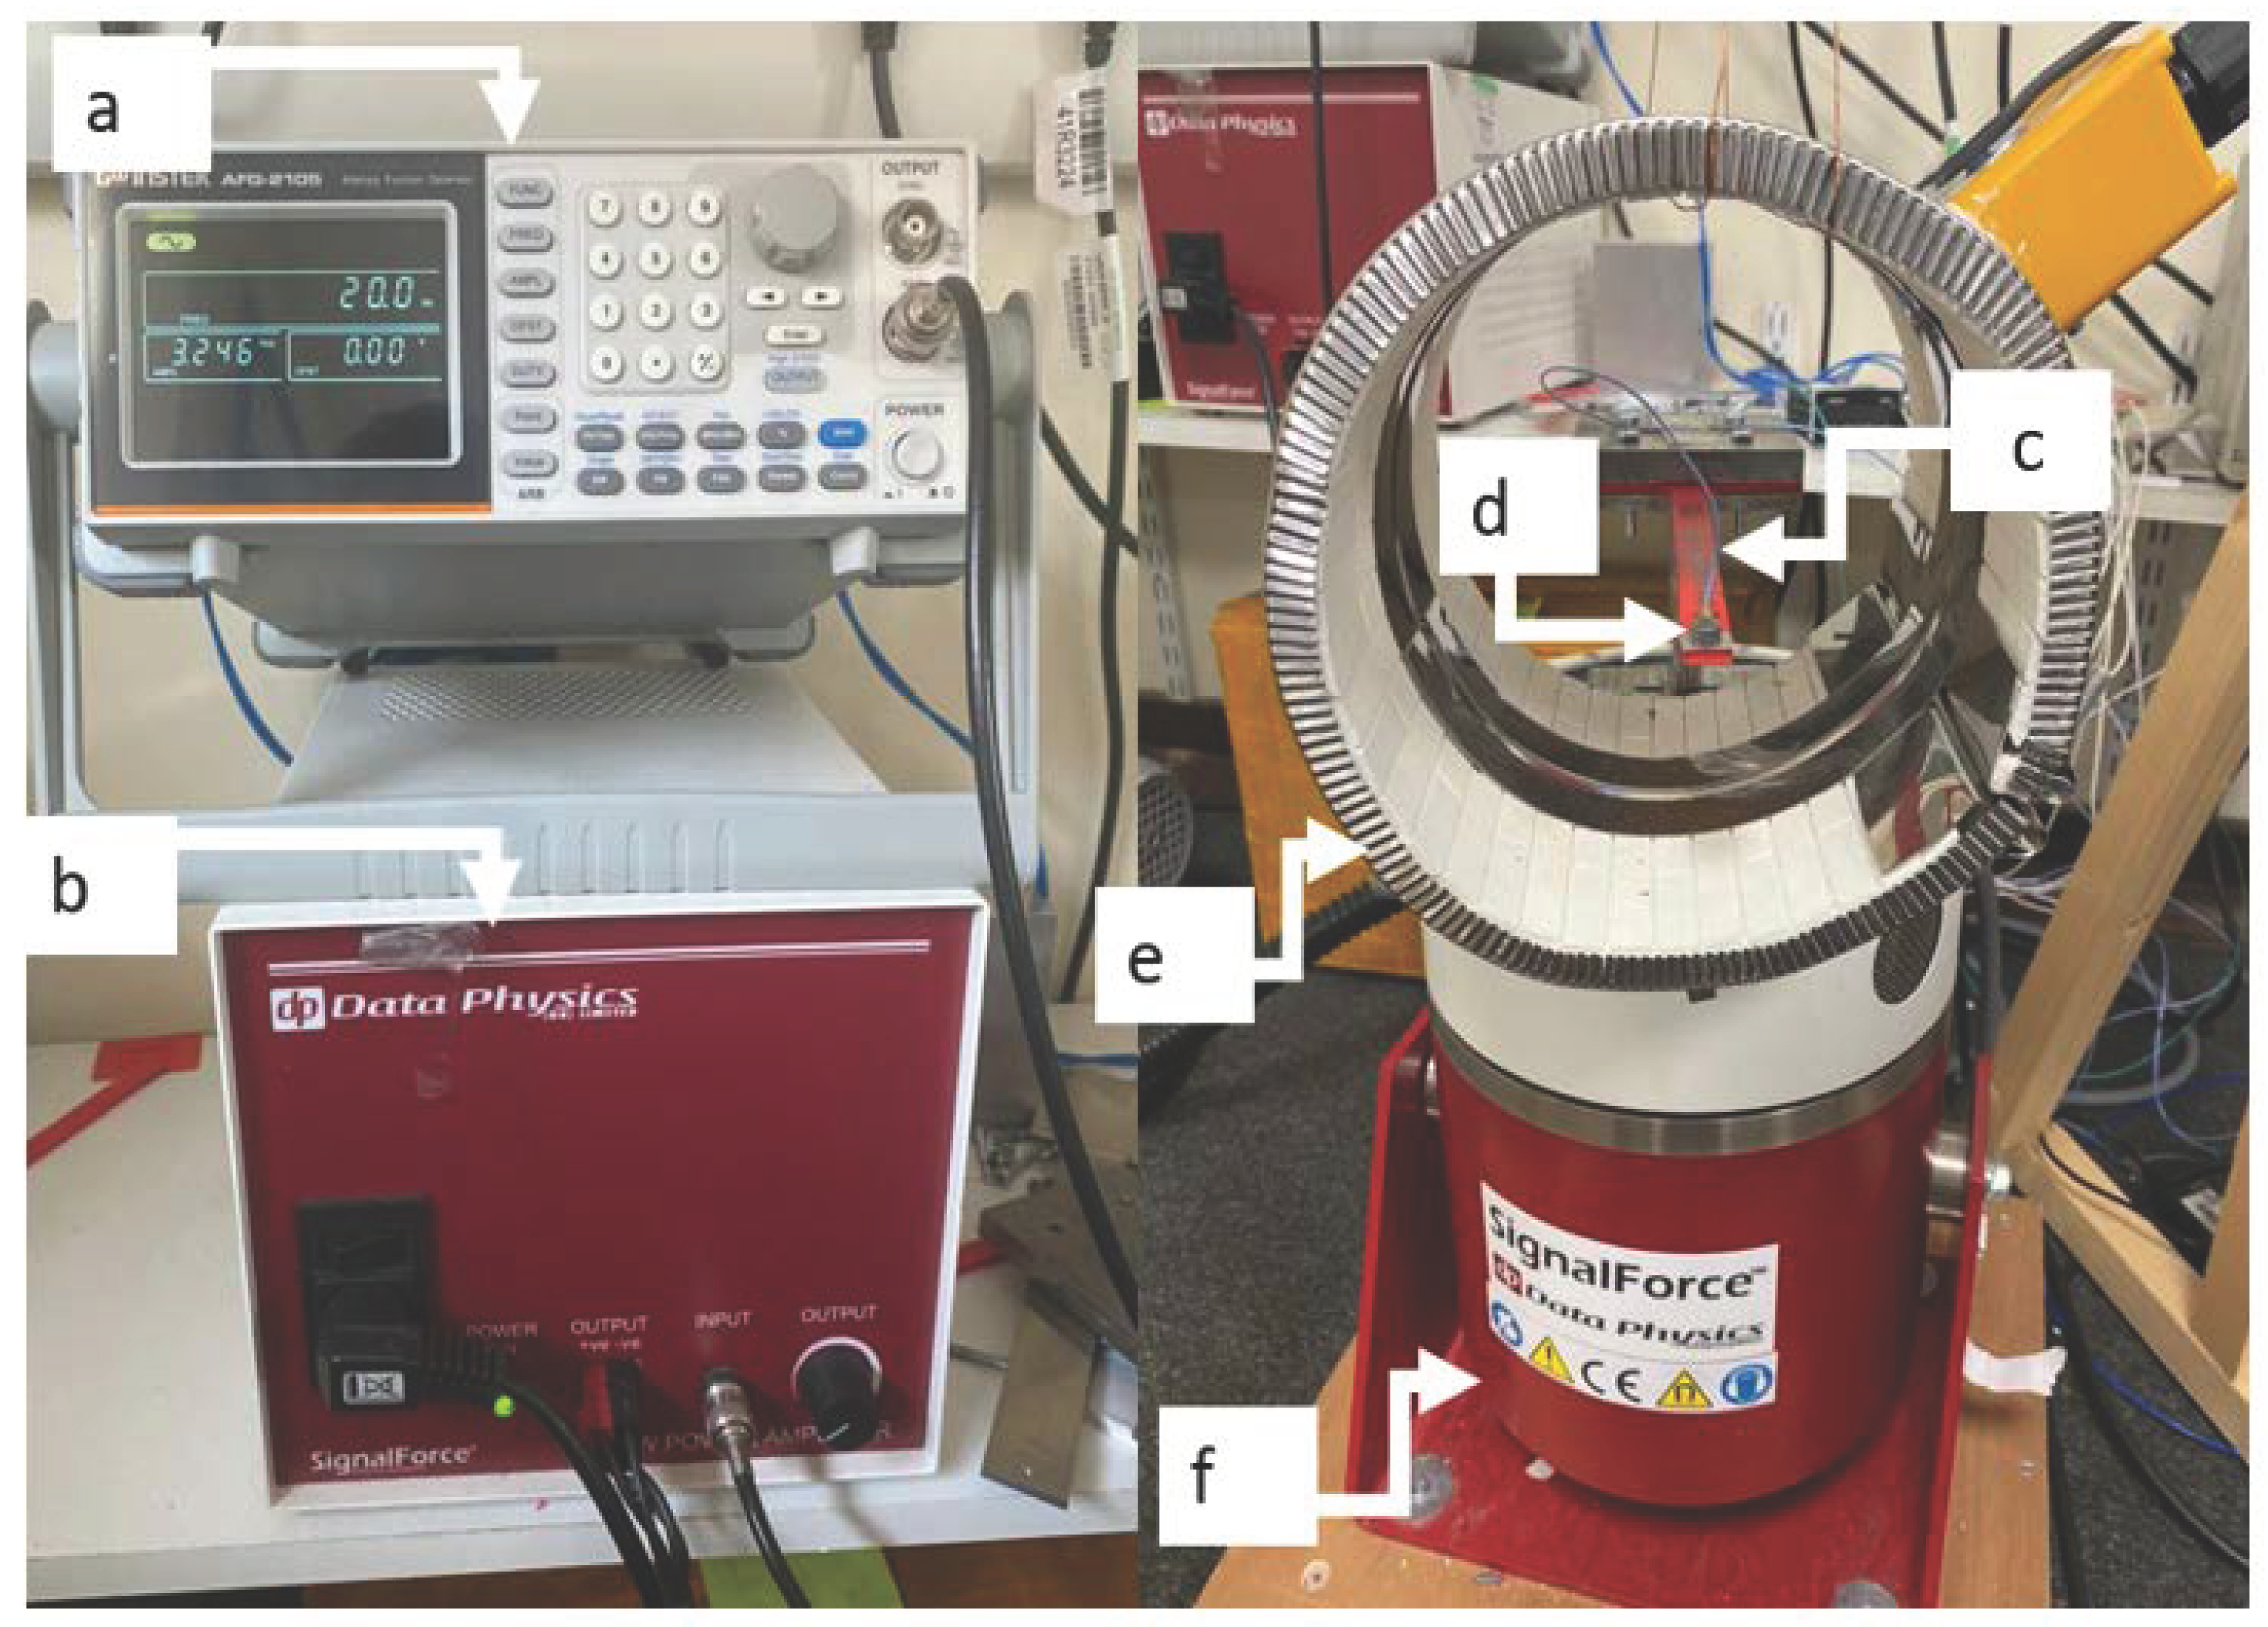
2.4.2. Experimental Setup and Procedures

The experimental setup is shown in Figure 7, which is the same as the previous study [33]. The fundamental frequency of the specimen was measured by an impact test twice. Then, the shaker excited the specimen with an amplitude of 2 mm with the measured fundamental frequency. This led to the resonance of the beam, and then the pre-seeded crack growth started. The accelerometer measured the acceleration and time data during crack growth and transferred them into SignalExpress software via a DAQ card. The test was paused when a significant displacement amplitude drop was observed in Signal Express. A Dino–Lite digital microscope (AnMo Electronics Corporation, Hsinchu, China) measured the corresponding crack depth. The new fundamental frequency was measured and applied to the cracked specimen again. These procedures were repeated until the beam broke.

3. Analytical Model and Experimental Data Process

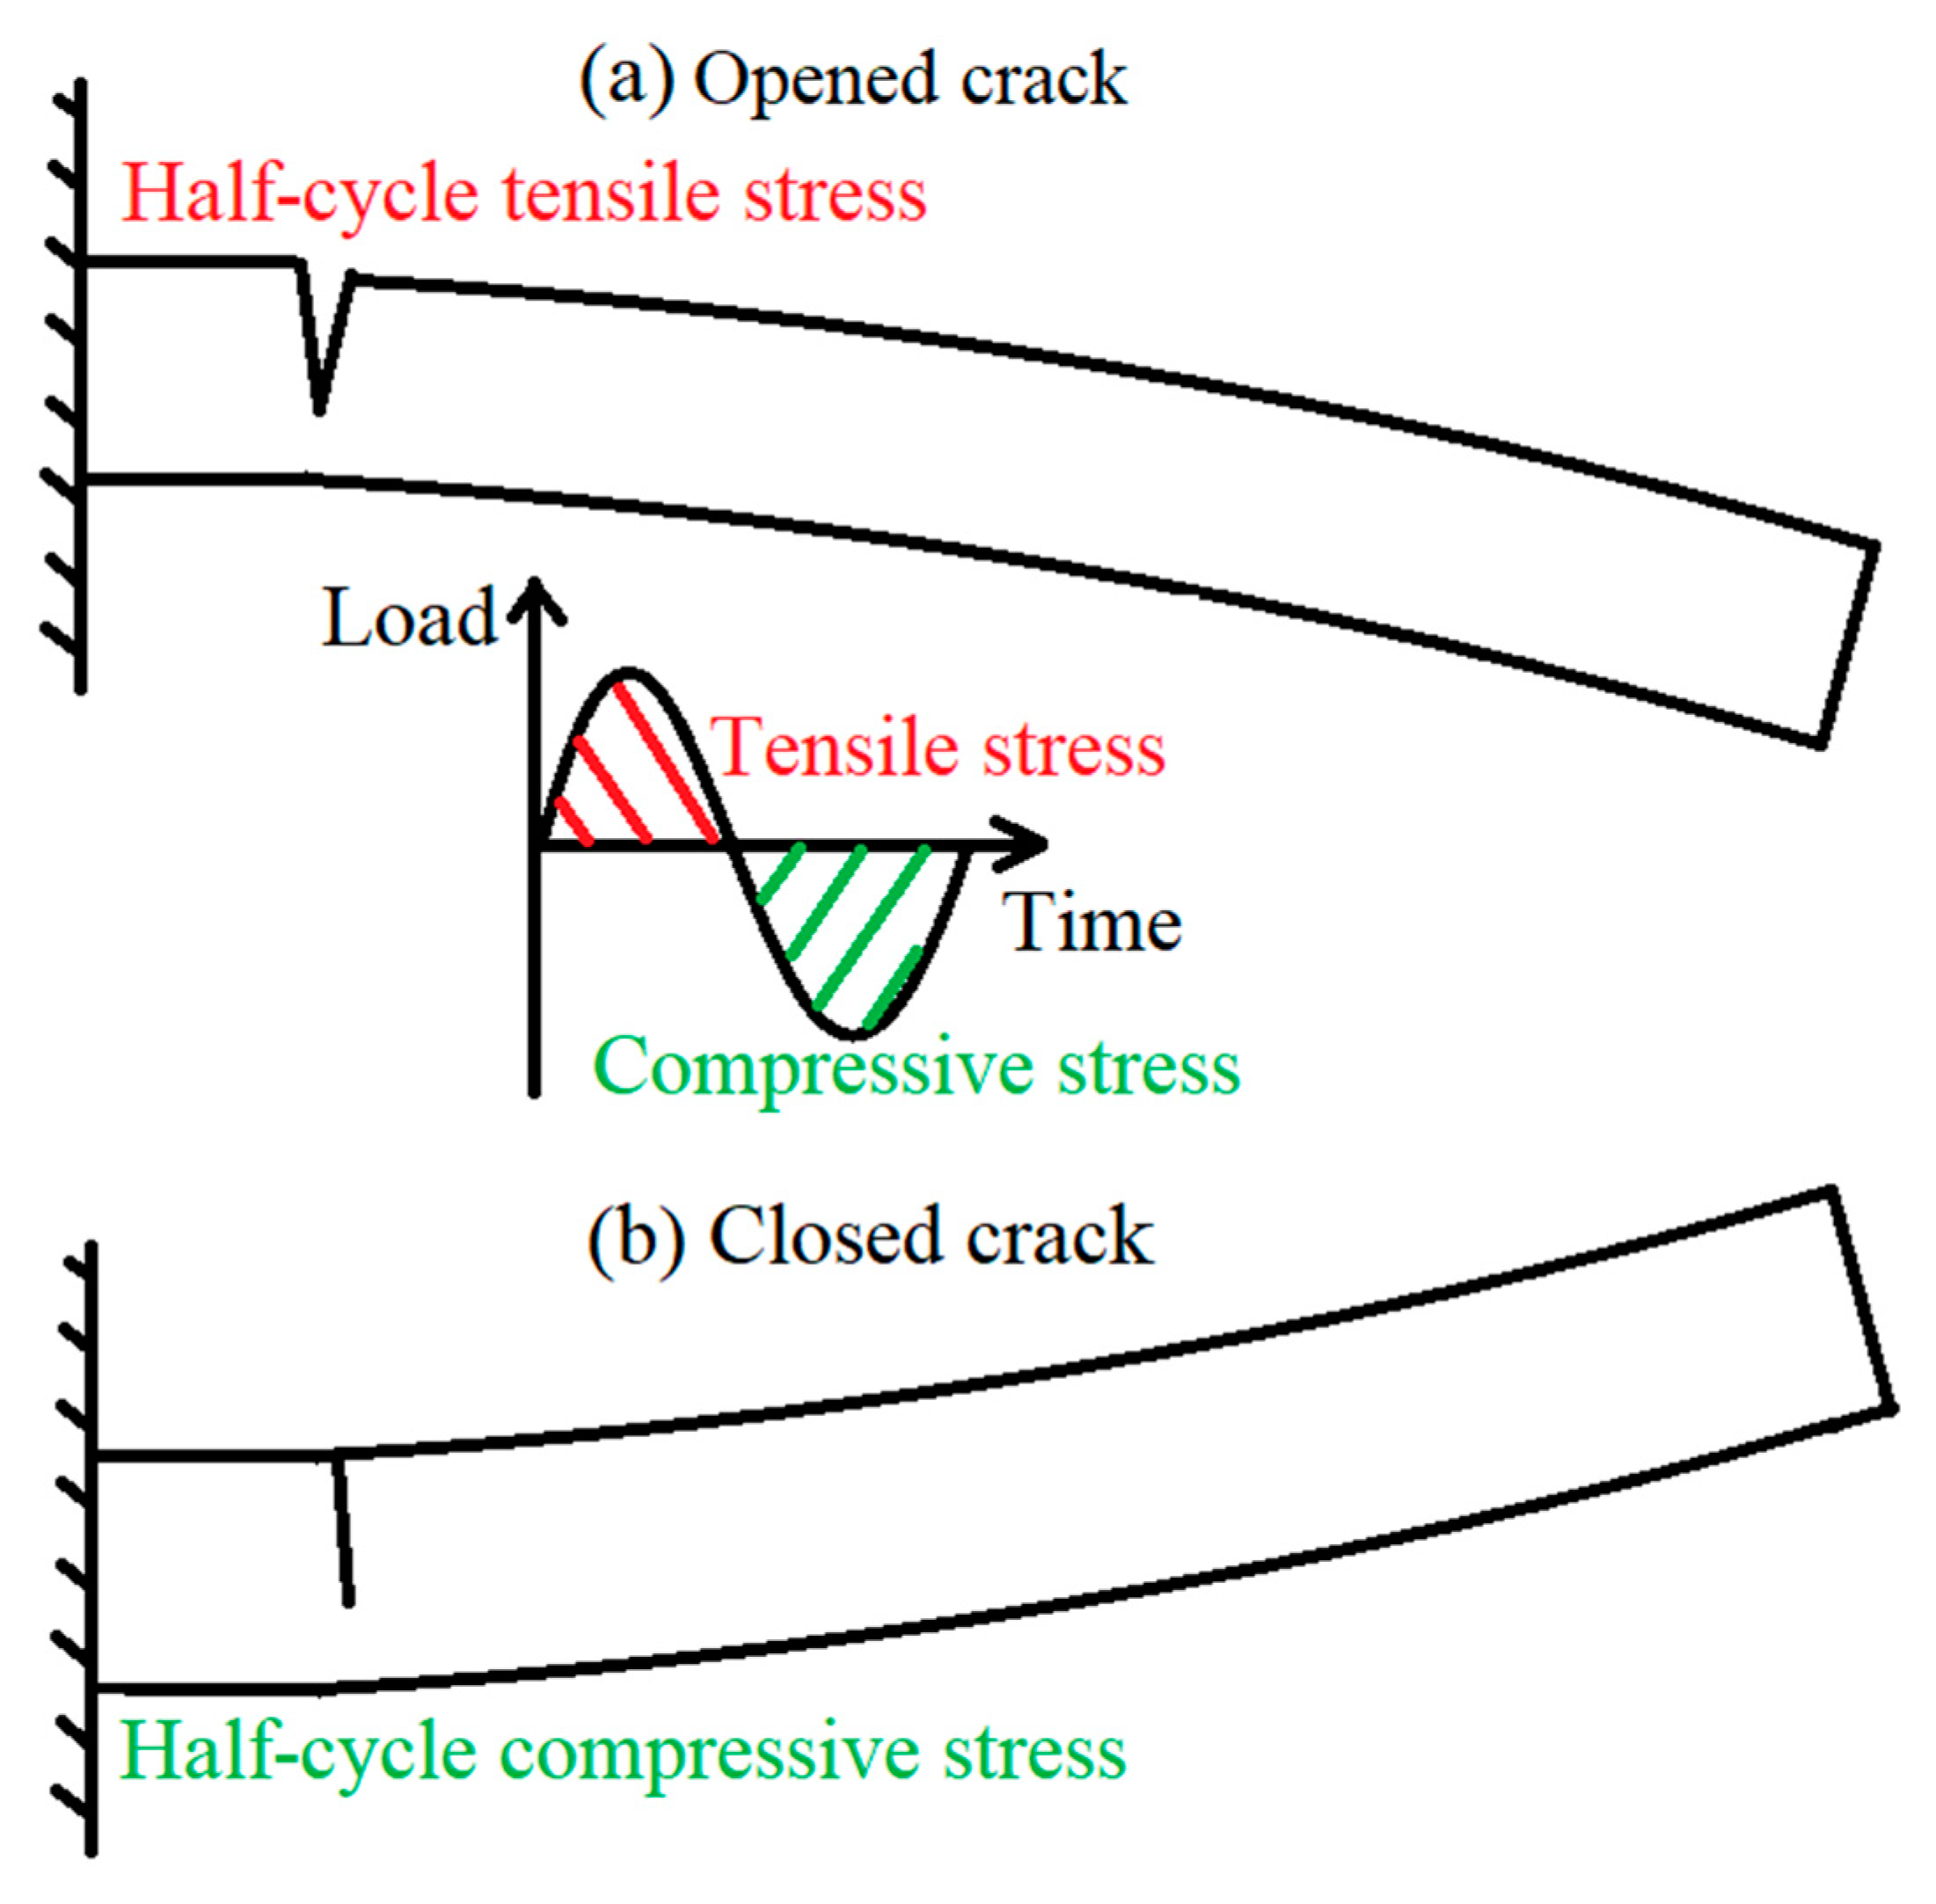
3.1. Calculation of SIF Range and FCG Rate

This section shows how SIF and the FCG rates were calculated based on the raw experimental data. Because the dynamic loads were applied on the tests, the stress ratio is time-dependent rather than a constant value. The appropriate estimation is essential to calculate the SIF.
For mode I fracture, the range of SIF ( Δ K ) can be calculated using Equations (1) and (2) [35,36]. However, the average applied stress range ( Δ σ ) was then used in this paper. It was different from the constant stress range in the standard FCG test. Δ σ was time-dependent due to the variable beam amplitude. Therefore, the mean Δ σ was approximately calculated using the MATLAB code and then substituted in Equation (1).
Δ K = Δ σ π a i f ( a i H )
where a i the initial crack depth, H is the beam thickness, and f ( a i H ) is the dimensionless boundary correction factor which can be calculated using Equation (2) [35,37].
( a H ) = 1.13 1.374 ( a H ) + 5.749 ( a H ) 2 4.464 ( a H ) 3
Moreover, to calculate the average stress range at the crack location according to the accelerometer measurements, the mean stress amplitude was calculated for each loading cycle by using Equation (3) to Equation (12) [38]. Firstly, the displacement amplitude was calculated at the beam tip (accelerometer location) by its quadratic integral relationship with acceleration amplitude measured by the accelerometer during the experiments, as shown in Equation (3).
y i ( L ) = 1 2 a c c i , p e a k a c c i , t r o u g h ( 2 π f i ) 2
where y i ( L ) : the displacement amplitude at beam tip in the ith cycle, a c c i : the acceleration in the ith cycle, and f i : the fundamental frequency of beam in the ith cycle.
Then, the displacement amplitude at the crack location y i ( l c ) can be derived based on the mode shape of a cracked beam f ( x ) [39], as shown in Equations (4)–(9)
y i ( l c ) = C s f × f ( l c )
C s f = y i ( L ) f ( L )
f ( x ) = C 1 sin ( β x ) + C 2 cos ( β x ) + C 3 sinh ( β x ) + C 4 cosh ( β x )
β 4 = ω 2 ρ A E T I
I = b H 3 12
ω = t i t j i j
where C s f : the scale factor, l c : the crack location, C 1 4 : the coefficient in mode shape function of the cracked beam, ω : the fundamental angular frequency, ρ : the FDM ABS density, A : the beam’s cross-section area, E T : the elastic modulus at test temperature, I : the area moment of inertia, b : the beam width, H : the beam height; and t i and t j : the ith and jth peak time, respectively.
After that, the bending moment M i ( l c ) at the crack location in ith cycle can be calculated by Equation (10):
M i ( l c ) = | E T I d 2 y i ( l c ) d x 2 |
Next, assuming that the bending stress amplitude σ i ( l c ) at the crack tip in the ith cycle was constant and equal to the stress at the beam surface. It can be calculated using Equation (11),
σ i ( l c ) = 6 M i ( l c ) b H 2
Finally, the mean stress range is given by Equation (12)
Δ σ = i = 1 n σ i ( l c ) T i i = 1 n T i
where T i : the period of the ith cycle.
During the dynamic fatigue crack test, the single side cracked beam vibrated up and down. As a result, it was exposed to two types of cyclic loading (tensile and compressive stresses), as shown in Figure 8. However, only tensile stress was responsible for the propagation of the crack. Therefore, the stress amplitude σ i ( l c ) was used to show the stress range per cycle instead of the difference among the peak and trough as shown in Equation (12).
For the same reason, the actual number of cycles that lead to crack propagation is half of the total number of cycles. Because the crack was not propagated when the specimen was exposed to compressive stresses; therefore, the average crack rate between two crack depths can be calculated by Equation (13)
d a d N = 2 ( a f a i N )
where a f : the final crack depth.
With the calculated SIF range Δ K and FCG rate d a d N . The empirical relationship between the Δ K and the fatigue crack growth rate can be modelled. The format of the model was represented by Paris law, as shown in Equation (14) [29,30]. After that, this relationship was plotted, and then the suitable values for C and m were identified using the curve fitting function in MATLAB.
d a d N = C ( Δ K ) m

3.2. Data Process

The C and m values were determined in Section 3.1 for different configurations. In order to investigate and compare the effect of printing parameters on Paris’ law, a multiple linear regression (MLR) model was used, as shown in Equation (15).
Y ^ = b 0 + b 1 X 1 + b 2 X 2 + b 3 X 3 + b 4 X 4
where Y ^ is the C or m values, and we denote that X 1 represents the raster orientation, X 2 represents the nozzle size, X 3 represents the layer thickness, X 4 represents the temperature, and b 0 4 is the estimated regression coefficient that quantifies the association between the parameters X and the dependent variable Y ^ .
The printing parameters are converted from the original values in Table 1 into standardized dimensionless values to eliminate the effects of differences in properties, such as dimension and order of magnitude between different variables, thus making the effect sizes of different variables comparable. The z-score standardized method was used, and the values of X are shown in Table 3.

4. Results and Discussion

The influence of printing parameters (building orientation, layers thickness, and nozzle size) under 50, 60, and 70 °C on the FCG rate were studied. The effect was visualised by the log-log plot, which used the Paris’ law relationship between the crack growth rate ( d a d N ) during crack propagation and the range of the stress intensity factor (ΔK). The first-order polynomial curve fitting method was used to plot the figures due to the linear relationships of Paris law. R-squared and RMSE values for each parameter are shown in Table 4.

4.1. Building Orientation Influence

Figure 9 shows the crack growth rate variation for X, XY, and Y building orientations. As can be observed, samples printed with X building orientation have the lowest FCG rate, while Y building orientation has the highest, and XY orientation lies between them for the same SIF value.
Table 5 shows the FCG rate range and the mean fatigue life. The average FCG rate for the X orientation corresponds to the 9.68 × 10⁻⁷ m/cycle. In comparison, Y orientation corresponds to the 9.77 × 10⁻⁷ m/cycle. Furthermore, the mean number of cycles until the fracture has 4343 cycles for the X orientation. However, the Y building orientation approximately has 2282 cycles. These results are similar to the previous study provided by the applied bending fatigue test [32,40]. However, they are different from what was provided in most previous studies, which was tested by tension fatigue test [20,41]. This found that the XY building orientation had the highest fatigue life, which means they had the lowest FCG rate. Therefore, the difference in the type of the test may be the main reason behind the difference in results.
The findings are reasonable. The Y building orientation samples provide the highest FCG rate because the Y orientation is lateral on the beam in a similar direction to the initial seed crack. In fracture mechanics, the micro-cracks on or in the structure are the main reason for the propagation of the crack [42]. These micro-cracks occur between filaments of 3D structures due to printing defects in the form of microvoids. Furthermore, one of the stress characteristics is that it concentrates around the weakest area of the structure. Therefore, when the beam is vibrated, these microvoids lead to concentrate the stress around them. The micro air voids are in the same direction as the initial seed crack in the Y building orientation. Therefore, an excellent crack path was created, especially when the stress acting vertically on these voids due to the beam’s vibration increased the FCG rate and decreased the fatigue life. In contrast, the opposite happened in X building orientation [33].

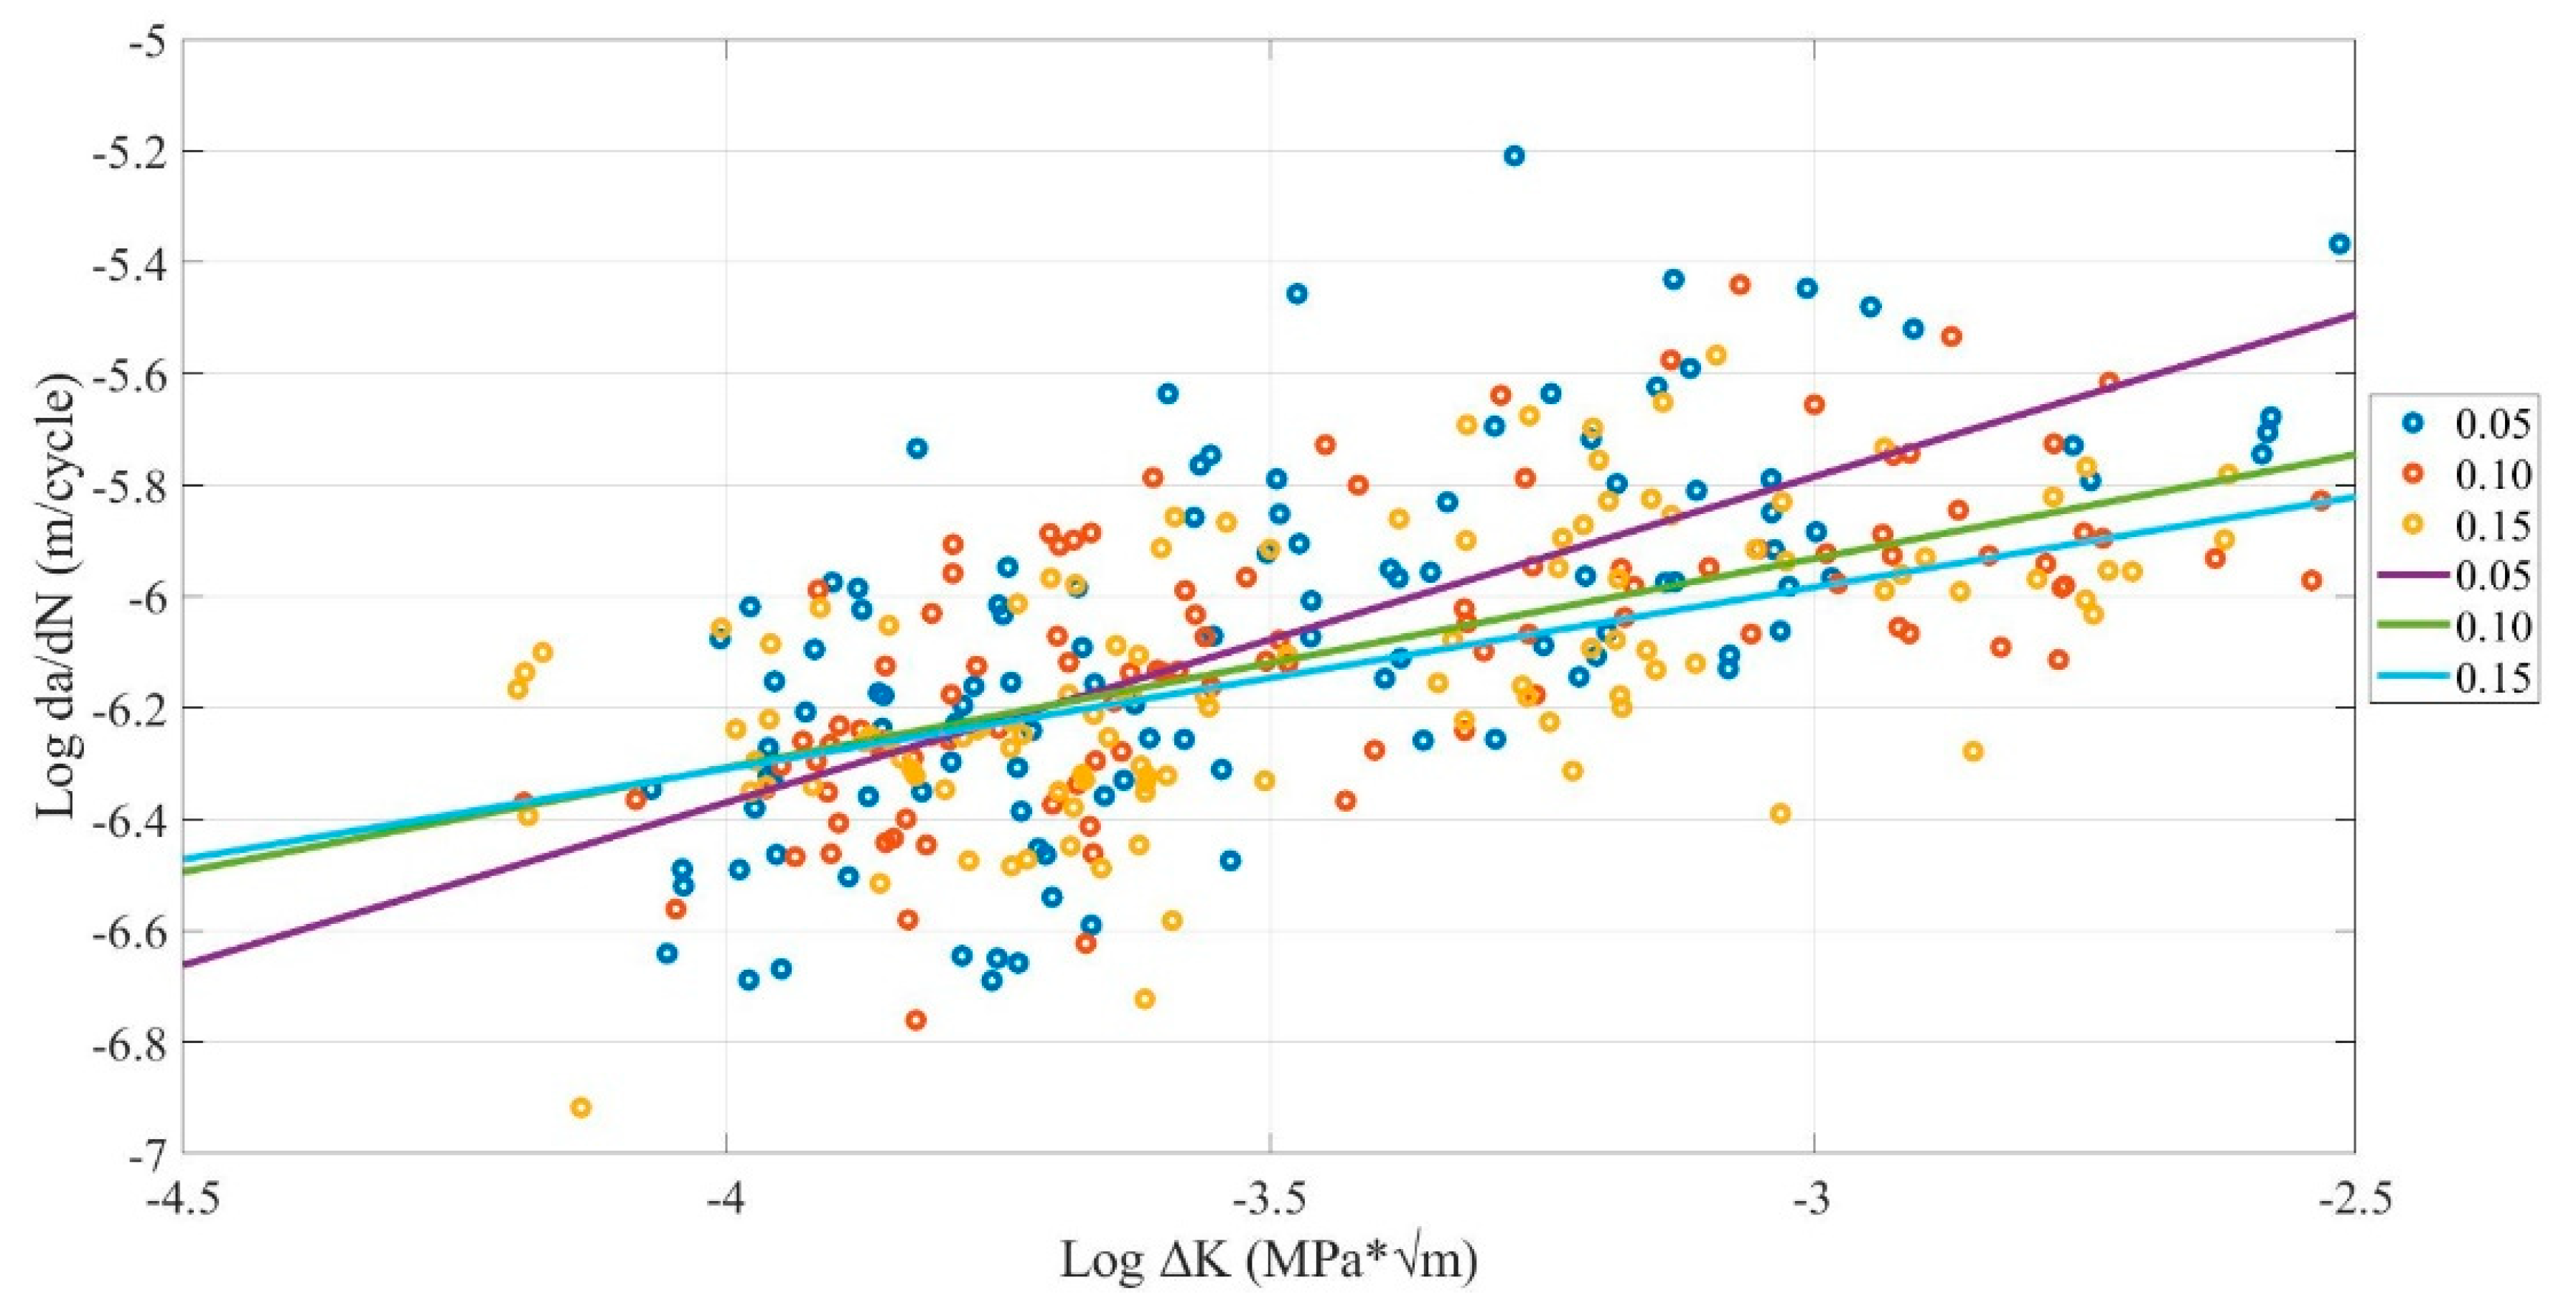
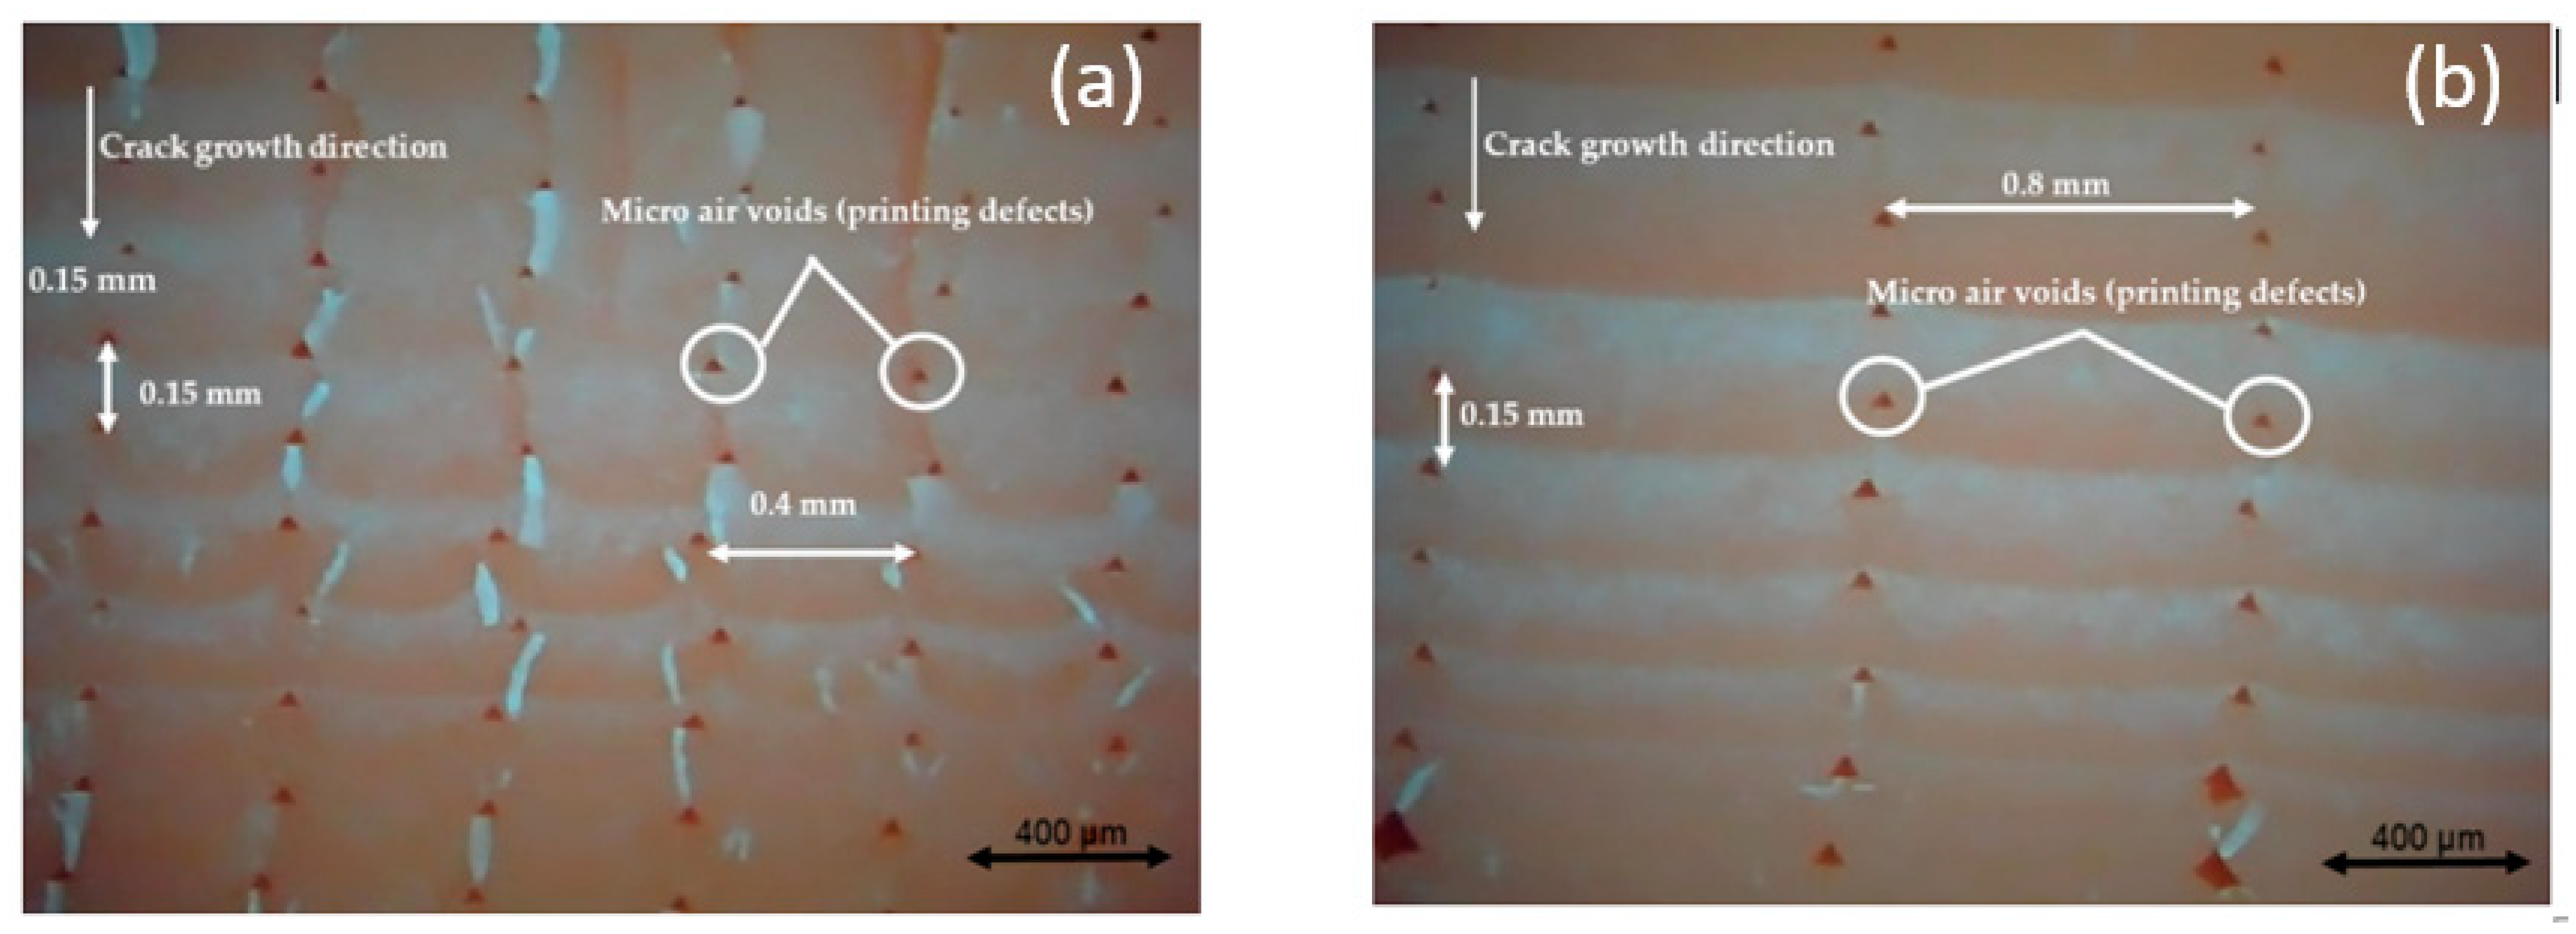
4.2. Layer Thickness Influence

Figure 10 shows that the 0.15-mm layer thickness had the lowest crack growth rate, while the 0.05-mm layer thickness had the highest. Furthermore, the 0.10-mm layer thickness always lies between them. Table 6 shows the FCG rate range and the mean fatigue life. The average crack growth rate for 0.15-mm layer thickness corresponds to the 9.19 × 10⁻⁷ m/cycle. While 0.05-mm layer thickness corresponds to a 1.04 × 10⁻⁶ m/cycle, and the 0.10-mm layer thickness lies between them. Furthermore, the highest mean number of cycles until the fracture has 3805 cycles for the 0.15-mm layer thickness, while the lowest has 3417 cycles provided by the 0.05-mm layer thickness.
As can be observed, when the layer thickness changes between 0.05, 0.10, and 0.15 mm, the crack growth rate changes slightly. In addition, by increasing the layer thickness, the FCG rate will decrease. These results are similar to what was founded in previous studies for FDM ABS and PLA [33,40,43,44].
The reason behind the lower FCG rate of 0.15-mm layer thickness is related to the micro air voids theory which states that, when the micro air voids decrease, the FCG rate will decrease. In addition, when the layer thickness increases, the number of air voids will decrease, increasing the global density and decreasing the concentrated stress on the sample, increasing the strength and fatigue life. Therefore, the 0.15-mm layer thickness has fewer micro air voids (dark red area) than the 0.10-mm and 0.05-mm layer thickness, which provides more strength and longer fatigue life, as shown in Figure 11 [33].

4.3. Nozzle Size Influence

Figure 12 shows that the 0.8-mm nozzle size had the lowest crack growth rate, while the 0.4-mm nozzle size had the highest and 0.6 lies between them. However, some samples operating at 60 and 70 °C shows the 0.8-mm nozzle size had the lowest FCG at the start of the test and the highest at the end. Table 7 shows the average FCG rate range and mean the number of cycles until fracture. The average crack growth rate range for the 0.8-mm nozzle size corresponds to the 8.19 × 10⁻⁷ m/cycle. However, a 0.4-mm nozzle size corresponds with the 1.06 × 10⁻⁶ m/cycle. Furthermore, the highest mean number of cycles until the fracture has 4147 cycles by the 0.8-mm nozzle size, while the lowest has 3224 cycles by the 0.4-mm nozzle size.
As can be observed, when the nozzle size increases, the FCG rate will decrease. These results are like previous research conclusions for FDM ABS and PLA [33,40,43,44]. Furthermore, this result is related to the micro air voids provided and explained in Section 4.2. The samples printed with 0.8-mm nozzle size has a lower number of micro air void than 0.6 and 0.4 mm, as shown in Figure 13.

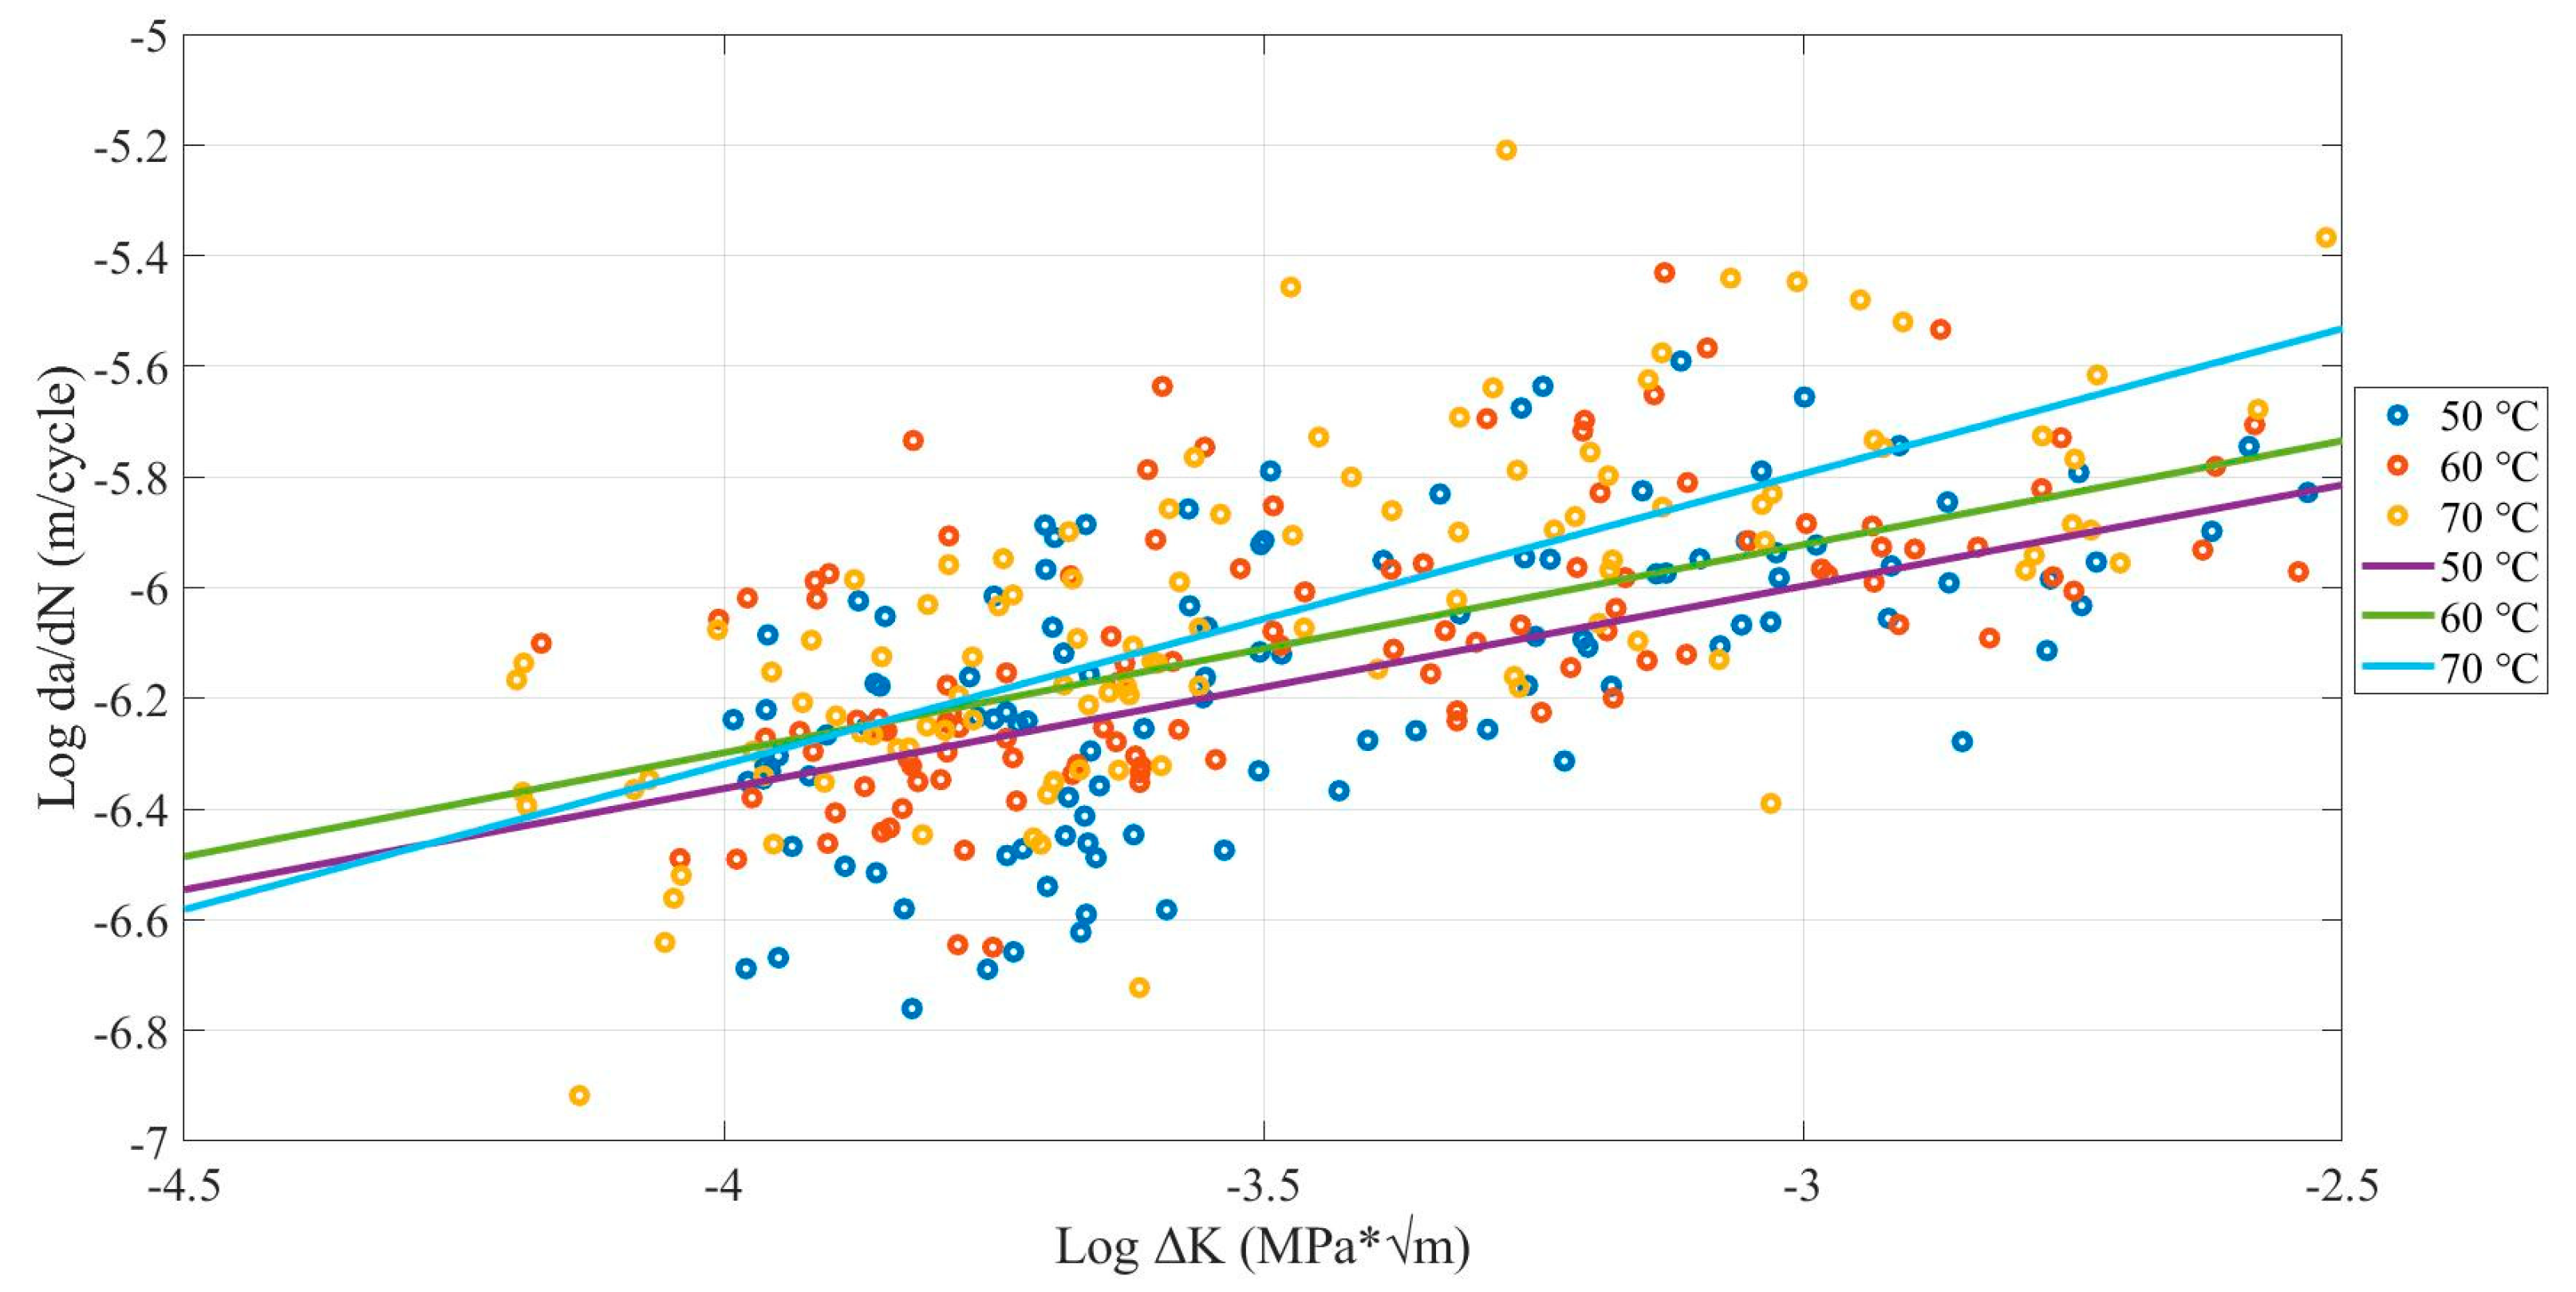
4.4. Environmental Temperature Influence

The environmental temperature has a significant influence on the FCG rate. Figure 14 shows that the FCG rate increased due to the increase in temperature. Additionally, the 50 °C environmental temperature had the lowest crack growth rate, the 70 °C had the highest, and 60 °C was lies between them. Table 8 shows the average FCG rate and the mean number of cycles. The average crack growth rate range for the 50 °C environmental temperature was the 9.77 × 10⁻⁷ m/cycle. While the 70 °C environmental temperature corresponds to the 9.86 × 10⁻⁷ m/cycle. Furthermore, the mean number of cycles until the fracture has 3604 cycles for the 50 °C environmental temperature, 3068 cycles for 60 °C, and 3122 cycles for 70 °C. This means that the FCG rate increases when the temperature increases. This result is likely what was mentioned in previous research [9].
The results are reasonable. The increase in temperature is negatively affecting the mechanical properties. The evidence for this claim is that, in the DMA test, when temperature increases, the storage modulus decreases, decreasing the strength of the printed sample and increasing the FCG rate. In addition, for the FDM ABS at lower temperatures, the strength of the bounding of the molecules to each other is very strong. However, at higher temperatures, this strength decreases, which leads to the slip of the chain easily. In conclusion, the increase in temperature in FDM ABS negatively affects the mechanical and microstructural properties, leading to an increase in FCG rate [33].

4.5. Paris Law Constants (C and m) for Different Printing Parameters

The C and m values were determined for different configurations experimentally. Part of the results is shown in Table 9. The full results are attached in Appendix A. It was found that the values in Table 9 for FDM ABS are higher than previous research testing on conventionally manufactured ABS [28,29] because of the micro air voids in the FDM structure. The existence of air voids changes the microstructure of ABS, which leads to lower crack resistance. This is reflected as the larger values of C and m in Paris’ law.
Because there is too much data, the MLR results from Section 3.2 were used to investigate printing parameters’ effect on Paris’ law.
Regression Equations (16) and (17) were fitted by MATLAB.
C = 0.38 + 0.55 X 1 0.45 X 2 0.57 X 3 + 0.02 X 4
m = 0.66 + 0.12 X 1 + 0.09 X 2 0.2 X 3 + 0.11 X 4
The regression coefficients of building orientation and temperature are positive values (0.55 and 0.02). This proves that, when building orientation tends to be perpendicular to the direction of stress or increased ambient environment, it increases the C value, resulting in a higher FCG rate. In contrast, the nozzle size and layer thickness regression coefficients are negative values (−0.45 and −0.57). This shows that the increased nozzle size and layer thickness all decrease the FCG rate. These results again support the conclusion from Section 4.1, Section 4.2, Section 4.3 and Section 4.4.
The m value in Paris Law, which shows the slope of the curve in log-log plots, has a smaller effect on the FCG rate. Therefore, the regression coefficient of nozzle size for the m value is 0.09, which is the opposite of −0.45 in Equation (16). The overall trend of FCG rate still decreases when the nozzle size is increasing.

5. Conclusions

An experimental study was performed on FDM ABS using the dynamic mechanical loads at different ambient temperatures to investigate the influence of printing parameters and temperature on FCG rates and the Paris law constants.
The paper proposed one analytical solution to determine the SIF range when dynamic stress at the crack location is difficult to measure under structural resonating conditions. The empirical Paris law model was developed for different configurations of raster orientation, nozzle size, layer thickness, and ambient temperature. The corresponding C and m constants are listed as a reference for future research.
With the comparison of the FCG rate, it is found that increased layer thickness and nozzle size all reduce the FCG rate due to the decrease in micro air voids. On the contrary, the building orientation close to 90° and increased temperature accelerates the crack growth. Therefore, combining the following parameters provides the lowest FCG rate and Paris law constant: X building orientation, 0.15-mm layer thickness, and 0.8-mm nozzle size.
For Paris’ law, C and m values were also affected by environmental temperature and printing parameters. As the temperature increased, the C and m values increased. In addition, the X building orientation, higher layer thicknesses, and larger nozzle size values provide the lowest C and m values because C and m values are directly related to FCG rate. These results are realistic due to the material type and environmental temperature influence on crack growth [9].
However, the overall trend in C and m values was higher than in previous research [28,29]. This disparity is likely due to differing material status, structure, and operating conditions, leading to a decrease in the FCG rate.

Author Contributions

Conceptualization, M.A.K.; Data curation, Y.L.A.A.; Formal analysis, Y.L.A.A. and F.H.; Funding acquisition, M.A.K.; Investigation, Y.L.A.A. and F.H.; Methodology, Y.L.A.A., F.H. and M.A.K.; Project administration, M.A.K.; Resources, M.A.K.; Software, Y.L.A.A. and F.H.; Supervision, M.A.K.; Validation, Y.L.A.A.; Visualization, Y.L.A.A. and F.H.; Writing—original draft, Y.L.A.A. and F.H.; Writing—review & editing, F.H. and M.A.K. All authors have read and agreed to the published version of the manuscript.

Funding

This research received no external funding.

Conflicts of Interest

The authors declare no conflict of interest.

Appendix A

Table A1. The Paris power law constant (C and m) for all configurations obtained from experimental results where (da/dN in m/cycle and ΔK in MPa*√m).
Building Orientation T
(°C)
Nozzle Size (mm)Layer Thickness (mm)Log CCmR-Square (%)
X500.40.05−3.6072.47 × 10−40.76394%
X600.40.05−4.7361.84 × 10−50.42693%
X700.40.05−3.8881.29 × 10−40.67398%
X500.40.10−4.8851.30 × 10−50.39081%
X600.40.10−5.0878.18 × 10−60.33091%
X700.40.10−4.7461.79 × 10−50.39086%
X500.40.15−5.0997.96 × 10−60.32991%
X600.40.15−5.1097.78 × 10−60.31893%
X700.40.15−4.7871.63 × 10−50.38782%
X500.60.05−3.7541.76 × 10−40.75499%
X600.60.05−4.3274.71 × 10−50.51595%
X700.60.05−4.8881.29 × 10−50.34199%
X500.60.10−4.4813.30 × 10−50.53798%
X600.60.10−4.7191.91 × 10−50.44497%
X700.60.10−4.7641.72 × 10−50.39695%
X500.60.15−5.7002.00 × 10−60.22184%
X600.60.15−4.4833.29 × 10−50.49891%
X700.60.15−4.1527.05 × 10−50.68087%
X500.80.05−2.9361.16 × 10−30.99999%
X600.80.05−0.2295.90 × 10−11.70399%
X700.80.05−4.2136.12 × 10−50.60393%
X500.80.10−5.0249.46 × 10−60.44288%
X600.80.10−5.1636.87 × 10−60.32197%
X700.80.10−4.6632.17 × 10−50.43585%
X500.80.15−5.5592.76 × 10−60.24591%
X600.80.15−5.3674.30 × 10−60.26396%
X700.80.15−4.0059.89 × 10−50.64184%
XY500.40.05−2.0788.36 × 10−31.13198%
XY600.40.05−3.8861.30 × 10−40.63295%
XY700.40.05−2.3744.23 × 10−31.04199%
XY500.40.10−4.0139.71 × 10−50.60396%
XY600.40.10−4.9671.08 × 10−50.32495%
XY700.40.10−4.2046.25 × 10−50.52399%
XY500.40.15−4.9241.19 × 10−50.35999%
XY600.40.15−4.4263.75 × 10−50.49697%
XY700.40.15−4.5023.15 × 10−50.45375%
XY500.60.05−2.9331.17 × 10−30.86398%
XY600.60.05−4.5123.08 × 10−50.45694%
XY700.60.05−4.1067.83 × 10−50.50599%
XY500.60.10−4.7891.63 × 10−50.38199%
XY600.60.10−4.4003.98 × 10−50.50597%
XY700.60.10−2.1017.93 × 10−31.08385%
XY500.60.15−5.0459.02 × 10−60.30987%
XY600.60.15−2.5602.75 × 10−30.98098%
XY700.60.15−4.3074.93 × 10−50.50995%
XY500.80.05−3.6792.09 × 10−40.78195%
XY600.80.05−0.9451.14 × 10−11.46990%
XY700.80.05−0.9341.16 × 10−11.49085%
XY500.80.10−4.0139.71 × 10−50.66999%
XY600.80.10−3.7211.90 × 10−40.69164%
XY700.80.10−1.7021.99 × 10−21.23890%
XY500.80.15−4.5053.13 × 10−50.52999%
XY600.80.15−4.7741.68 × 10−50.43399%
XY700.80.15−3.2665.42 × 10−40.81291%
Y500.40.05−2.9381.15 × 10−30.81884%
Y 600.40.051.4372.74 × 10+011.93884%
Y700.40.05−0.8371.46 × 10−11.35792%
Y 500.40.10−4.6182.41 × 10−50.34699%
Y600.40.10−4.3164.83 × 10−50.41998%
Y 700.40.10−3.0748.43 × 10−40.78199%
Y500.40.15−4.8261.49 × 10−50.31497%
Y 600.40.15−4.9111.23 × 10−50.28499%
Y700.40.15−4.3444.53 × 10−50.43392%
Y500.60.05−3.0628.67 × 10−40.80196%
Y 600.60.05−4.3015.00 × 10−50.43296%
Y700.60.05−4.1676.81 × 10−50.48893%
Y 500.60.10−4.8361.46 × 10−50.34090%
Y600.60.10−4.8791.32 × 10−50.35398%
Y 700.60.10−2.2415.74 × 10−31.00296%
Y500.60.15−3.2036.27 × 10−40.75598%
Y 600.60.15−3.0638.65 × 10−40.81496%
Y700.60.15−1.2785.27 × 10−21.32292%
Y500.80.05−4.3074.93 × 10−50.50894%
Y 600.80.050.2701.86 × 1001.70597%
Y700.80.05−0.1537.03 × 10−11.54994%
Y 500.80.10−4.6202.40 × 10−50.42999%
Y600.80.10−4.7591.74 × 10−50.38397%
Y 700.80.10−1.9511.12 × 10−21.12496%
Y500.80.15−4.6602.19 × 10−50.41898%
Y 600.80.15−4.6602.19 × 10−50.41898%
Y700.80.15−3.4083.91 × 10−40.73199%

References

  1. Turner, B.N.; Strong, R.; Gold, S.A. A review of melt extrusion additive manufacturing processes: I. Process design and modeling. Rapid Prototyp. J. 2014, 20, 192–204. [Google Scholar] [CrossRef]
  2. Jap, N.S.F.; Pearce, G.M.; Hellier, A.K.; Russell, N.; Parr, W.C.; Walsh, W.R. The effect of raster orientation on the static and fatigue properties of filament deposited ABS polymer. Int. J. Fatigue 2019, 124, 328–337. [Google Scholar] [CrossRef]
  3. Nikolova, M.P.; Chavali, M.S. Recent advances in biomaterials for 3D scaffolds: A review. Bioact. Mater. 2019, 4, 271–292. [Google Scholar] [CrossRef] [PubMed]
  4. Stratton, S.; Manoukian, O.S.; Patel, R.; Wentworth, A.; Rudraiah, S.; Kumbar, S.G. Polymeric 3D printed structures for soft-tissue engineering. J. Appl. Polym. Sci. 2018, 135, 45569. [Google Scholar] [CrossRef] [PubMed] [Green Version]
  5. Zai, B.A.; Khan, M.; Khan, K.A.; Mansoor, A.; Shah, A.; Shahzad, M. The role of dynamic response parameters in damage prediction. Proc. Inst. Mech. Eng. Part C J. Mech. Eng. Sci. 2019, 233, 4620–4636. [Google Scholar] [CrossRef] [Green Version]
  6. Zai, B.A.; Khan, M.A.; Khan, S.Z.; Asif, M.; Khan, K.A.; Saquib, A.N.; Mansoor, A.; Shahzad, M.; Mujtaba, A. Prediction of crack depth and fatigue life of an acrylonitrile butadiene styrene cantilever beam using dynamic response. J. Test. Eval. 2020, 48, 1520–1536. [Google Scholar] [CrossRef]
  7. Vyavahare, S.; Teraiya, S. Fused deposition modelling: A review. Rapid Prototyp. J. 2020, 26, 176–201. [Google Scholar] [CrossRef]
  8. Masood, S.H. Advances in Fused Deposition Modeling; Elsevier: Amsterdam, The Netherlands, 2014; Volume 10, ISBN 9780080965338. [Google Scholar]
  9. He, F.; Kumar, V.; Khan, M.A. Evolution and New Horizons in Modelling Crack Mechanics of Polymeric Structures. Mater. Today Chem. 2020, 20, 100393. [Google Scholar] [CrossRef]
  10. Fleet, T.; Kamei, K.; He, F.; Khan, M.A.; Khan, K.A.; Starr, A. A machine learning approach to model interdependencies between dynamic response and crack propagation. Sensors 2020, 20, 6847. [Google Scholar] [CrossRef]
  11. Almutairi, M.D.; Aria, A.I.; Thakur, V.K.; Khan, M.A. Self-healing mechanisms for 3D-printed polymeric structures: From lab to reality. Polymers 2020, 12, 1534. [Google Scholar] [CrossRef]
  12. Kamei, K.; Khan, M.A. Current challenges in modelling vibrational fatigue and fracture of structures: A review. J. Braz. Soc. Mech. Sci. Eng. 2021, 43, 1–20. [Google Scholar] [CrossRef]
  13. Kamei, K.; Khan, M.A.; Khan, K.A. Characterising modal behaviour of a cantilever beam at different heating rates for isothermal conditions. Appl. Sci. 2021, 11, 4375. [Google Scholar] [CrossRef]
  14. Zai, B.A.; Khan, M.A.; Khan, K.A.; Mansoor, A. A novel approach for damage quantification using the dynamic response of a metallic beam under thermo-mechanical loads. J. Sound Vib. 2020, 469, 115134. [Google Scholar] [CrossRef]
  15. Zai, B.A.; Khan, M.A.; Mansoor, A.; Khan, S.Z.; Khan, K.A. Instant dynamic response measurements for crack monitoring in metallic beams. Insight Non-Destr. Test. Cond. Monit. 2019, 61, 222–229. [Google Scholar] [CrossRef]
  16. Khan, M.A.; Khan, K.A.; Khan, S.Z.; Nisar, S.; Starr, A. Fracture life estimation of Al-1050 thin beams using empirical data and a numerical approach. Insight Non-Destr. Test. Cond. Monit. 2018, 60, 363–368. [Google Scholar] [CrossRef] [Green Version]
  17. Khan, M.A.; Khan, S.Z.; Sohail, W.; Khan, H.; Sohaib, M.; Nisar, S. Mechanical fatigue in aluminium at elevated temperature and remaining life prediction based on natural frequency evolution. Fatigue Fract. Eng. Mater. Struct. 2015, 38, 897–903. [Google Scholar] [CrossRef]
  18. Durgun, I.; Ertan, R. Experimental investigation of FDM process for improvement of mechanical properties and production cost. Rapid Prototyp. J. 2014, 20, 228–235. [Google Scholar] [CrossRef]
  19. Ziemian, C.; Sharma, M.; Ziemi, S. Anisotropic Mechanical Properties of ABS Parts Fabricated by Fused Deposition Modelling. In Mechanical Engineering; Gokcek, M., Ed.; IntechOpen Limited: London, UK, 2012. [Google Scholar]
  20. Sood, A.K.; Ohdar, R.K.; Mahapatra, S.S. Experimental investigation and empirical modelling of FDM process for compressive strength improvement. J. Adv. Res. 2012, 3, 81–90. [Google Scholar] [CrossRef] [Green Version]
  21. Afrose, M.F.; Masood, S.H.; Iovenitti, P.; Nikzad, M.; Sbarski, I. Effects of part build orientations on fatigue behaviour of FDM-processed PLA material. Prog. Addit. Manuf. 2016, 1, 21–28. [Google Scholar] [CrossRef]
  22. Tymrak, B.M.; Kreiger, M.; Pearce, J.M. Mechanical properties of components fabricated with open-source 3-D printers under realistic environmental conditions. Mater. Des. 2014, 58, 242–246. [Google Scholar] [CrossRef] [Green Version]
  23. Tezel, T.; Ozenc, M.; Kovan, V. Impact properties of 3D-printed engineering polymers. Mater. Today Commun. 2021, 26, 102161. [Google Scholar] [CrossRef]
  24. Wang, P.; Zou, B.; Ding, S.; Li, L.; Huang, C. Effects of FDM-3D printing parameters on mechanical properties and microstructure of CF/PEEK and GF/PEEK. Chin. J. Aeronaut. 2021, 34, 236–246. [Google Scholar] [CrossRef]
  25. Vicente, C.M.S.; Martins, T.S.; Leite, M.; Ribeiro, A.; Reis, L. Influence of fused deposition modeling parameters on the mechanical properties of ABS parts. Polym. Adv. Technol. 2020, 31, 501–507. [Google Scholar] [CrossRef]
  26. Zhang, Y.; Vassilopoulos, A.P.; Keller, T. Effects of low and high temperatures on tensile behavior of adhesively-bonded GFRP joints. Compos. Struct. 2010, 92, 1631–1639. [Google Scholar] [CrossRef]
  27. Luo, W.; Li, M.; Huang, Y.; Yin, B.; Hu, X. Effect of Temperature on the Tear Fracture and Fatigue Life of Carbon-Black-Filled Rubber. Polymers 2019, 11, 768. [Google Scholar] [CrossRef] [PubMed] [Green Version]
  28. Kim, H.S.; Wang, X.M. Temperature and frequency effects on fatigue crack growth in acrylonitrile–butadiene–styrene (ABS). J. Appl. Polym. Sci. 1995, 57, 811–817. [Google Scholar] [CrossRef]
  29. Kim, H.S.; Wang, X.M.; Abdullah, N.A.H.N. Effect of Temperature on Fatigue Crack Growth in the Polymer ABS. Fatigue Fract. Eng. Mater. Struct. 1994, 17, 361–367. [Google Scholar] [CrossRef]
  30. Paris, P.C.; Gomez, M.P.; Anderson, W.E. A rational analytic theory of fatigue. Trend Eng. 1961, 13, 9–14. [Google Scholar]
  31. Paris, P.; Erdogan, F. A Critical Analysis of Crack Propagation Laws. J. Basic Eng. 1963, 85, 528–533. [Google Scholar] [CrossRef]
  32. Roylance, D. Fatigue. Available online: https://ocw.mit.edu/courses/materials-science-and-engineering/3-11-mechanics-of-materials-fall-1999/modules/MIT3_11F99_fatigue.pdf (accessed on 9 October 2021).
  33. He, F.; Khan, M. Effects of Printing Parameters on the Fatigue Behaviour of 3D-Printed ABS under Dynamic Thermo-Mechanical Loads. Polymers 2021, 13, 2362. [Google Scholar] [CrossRef] [PubMed]
  34. Baqasah, H.; He, F.; Zai, B.A.; Asif, M.; Khan, K.A.; Thakur, V.K.; Khan, M.A. In-situ dynamic response measurement for damage quantification of 3D printed ABS cantilever beam under thermomechanical load. Polymers 2019, 11, 2079. [Google Scholar] [CrossRef] [PubMed] [Green Version]
  35. Ostachowicz, W.M.; Krawczuk, M. Analysis of the effect of cracks on the natural frequencies of a cantilever beam. J. Sound Vib. 1991, 150, 191–201. [Google Scholar] [CrossRef]
  36. Kolednik, O. Fracture Mechanics. In Wiley Encyclopedia of Composites; John Wiley & Sons, Inc.: Hoboken, NJ, USA, 2012; Volume 30, pp. 136–139. ISBN 9781118147757. [Google Scholar]
  37. McGinty, B. Fracture Mechanics. Available online: http://www.fracturemechanics.org/sif.html (accessed on 24 October 2021).
  38. He, F. Dynamic Response for 3D-Printed Acrylonitrile Butadiene Styrene (ABS) Damaged Structure under Thermo-Mechanical Loads; Cranfield University: Cranfield, UK, 2021. [Google Scholar]
  39. Xu, Z.; Ma, L. Structural Dynamics; Anqi, T., Ed.; Science Press: Beijing, China, 2007; ISBN 978-7-03-020457-8. [Google Scholar]
  40. Gomez-Gras, G.; Jerez-Mesa, R.; Travieso-Rodriguez, J.A.; Lluma-Fuentes, J. Fatigue performance of fused filament fabrication PLA specimens. Mater. Des. 2018, 140, 278–285. [Google Scholar] [CrossRef] [Green Version]
  41. Afrose, M.F.; Masood, S.H.; Nikzad, M.; Iovenitti, P. Effects of Build Orientations on Tensile Properties of PLA Material Processed by FDM. Adv. Mater. Res. 2014, 1044–1045, 31–34. [Google Scholar] [CrossRef]
  42. Wang, C.-H. Introduction to Fracture Mechanics; DSTO Aeronautical and Maritime Research Laboratory: Kensington, Australia, 1996. [Google Scholar]
  43. Jerez-Mesa, R.; Travieso-Rodriguez, J.A.; Llumà-Fuentes, J.; Gomez-Gras, G.; Puig, D. Fatigue lifespan study of PLA parts obtained by additive manufacturing. Procedia Manuf. 2017, 13, 872–879. [Google Scholar] [CrossRef] [Green Version]
  44. Travieso-Rodriguez, J.A.; Jerez-Mesa, R.; Llumà, J.; Traver-Ramos, O.; Gomez-Gras, G.; Rovira, J.J.R. Mechanical properties of 3D-printing polylactic acid parts subjected to bending stress and fatigue testing. Materials 2019, 12, 3859. [Google Scholar] [CrossRef] [Green Version]
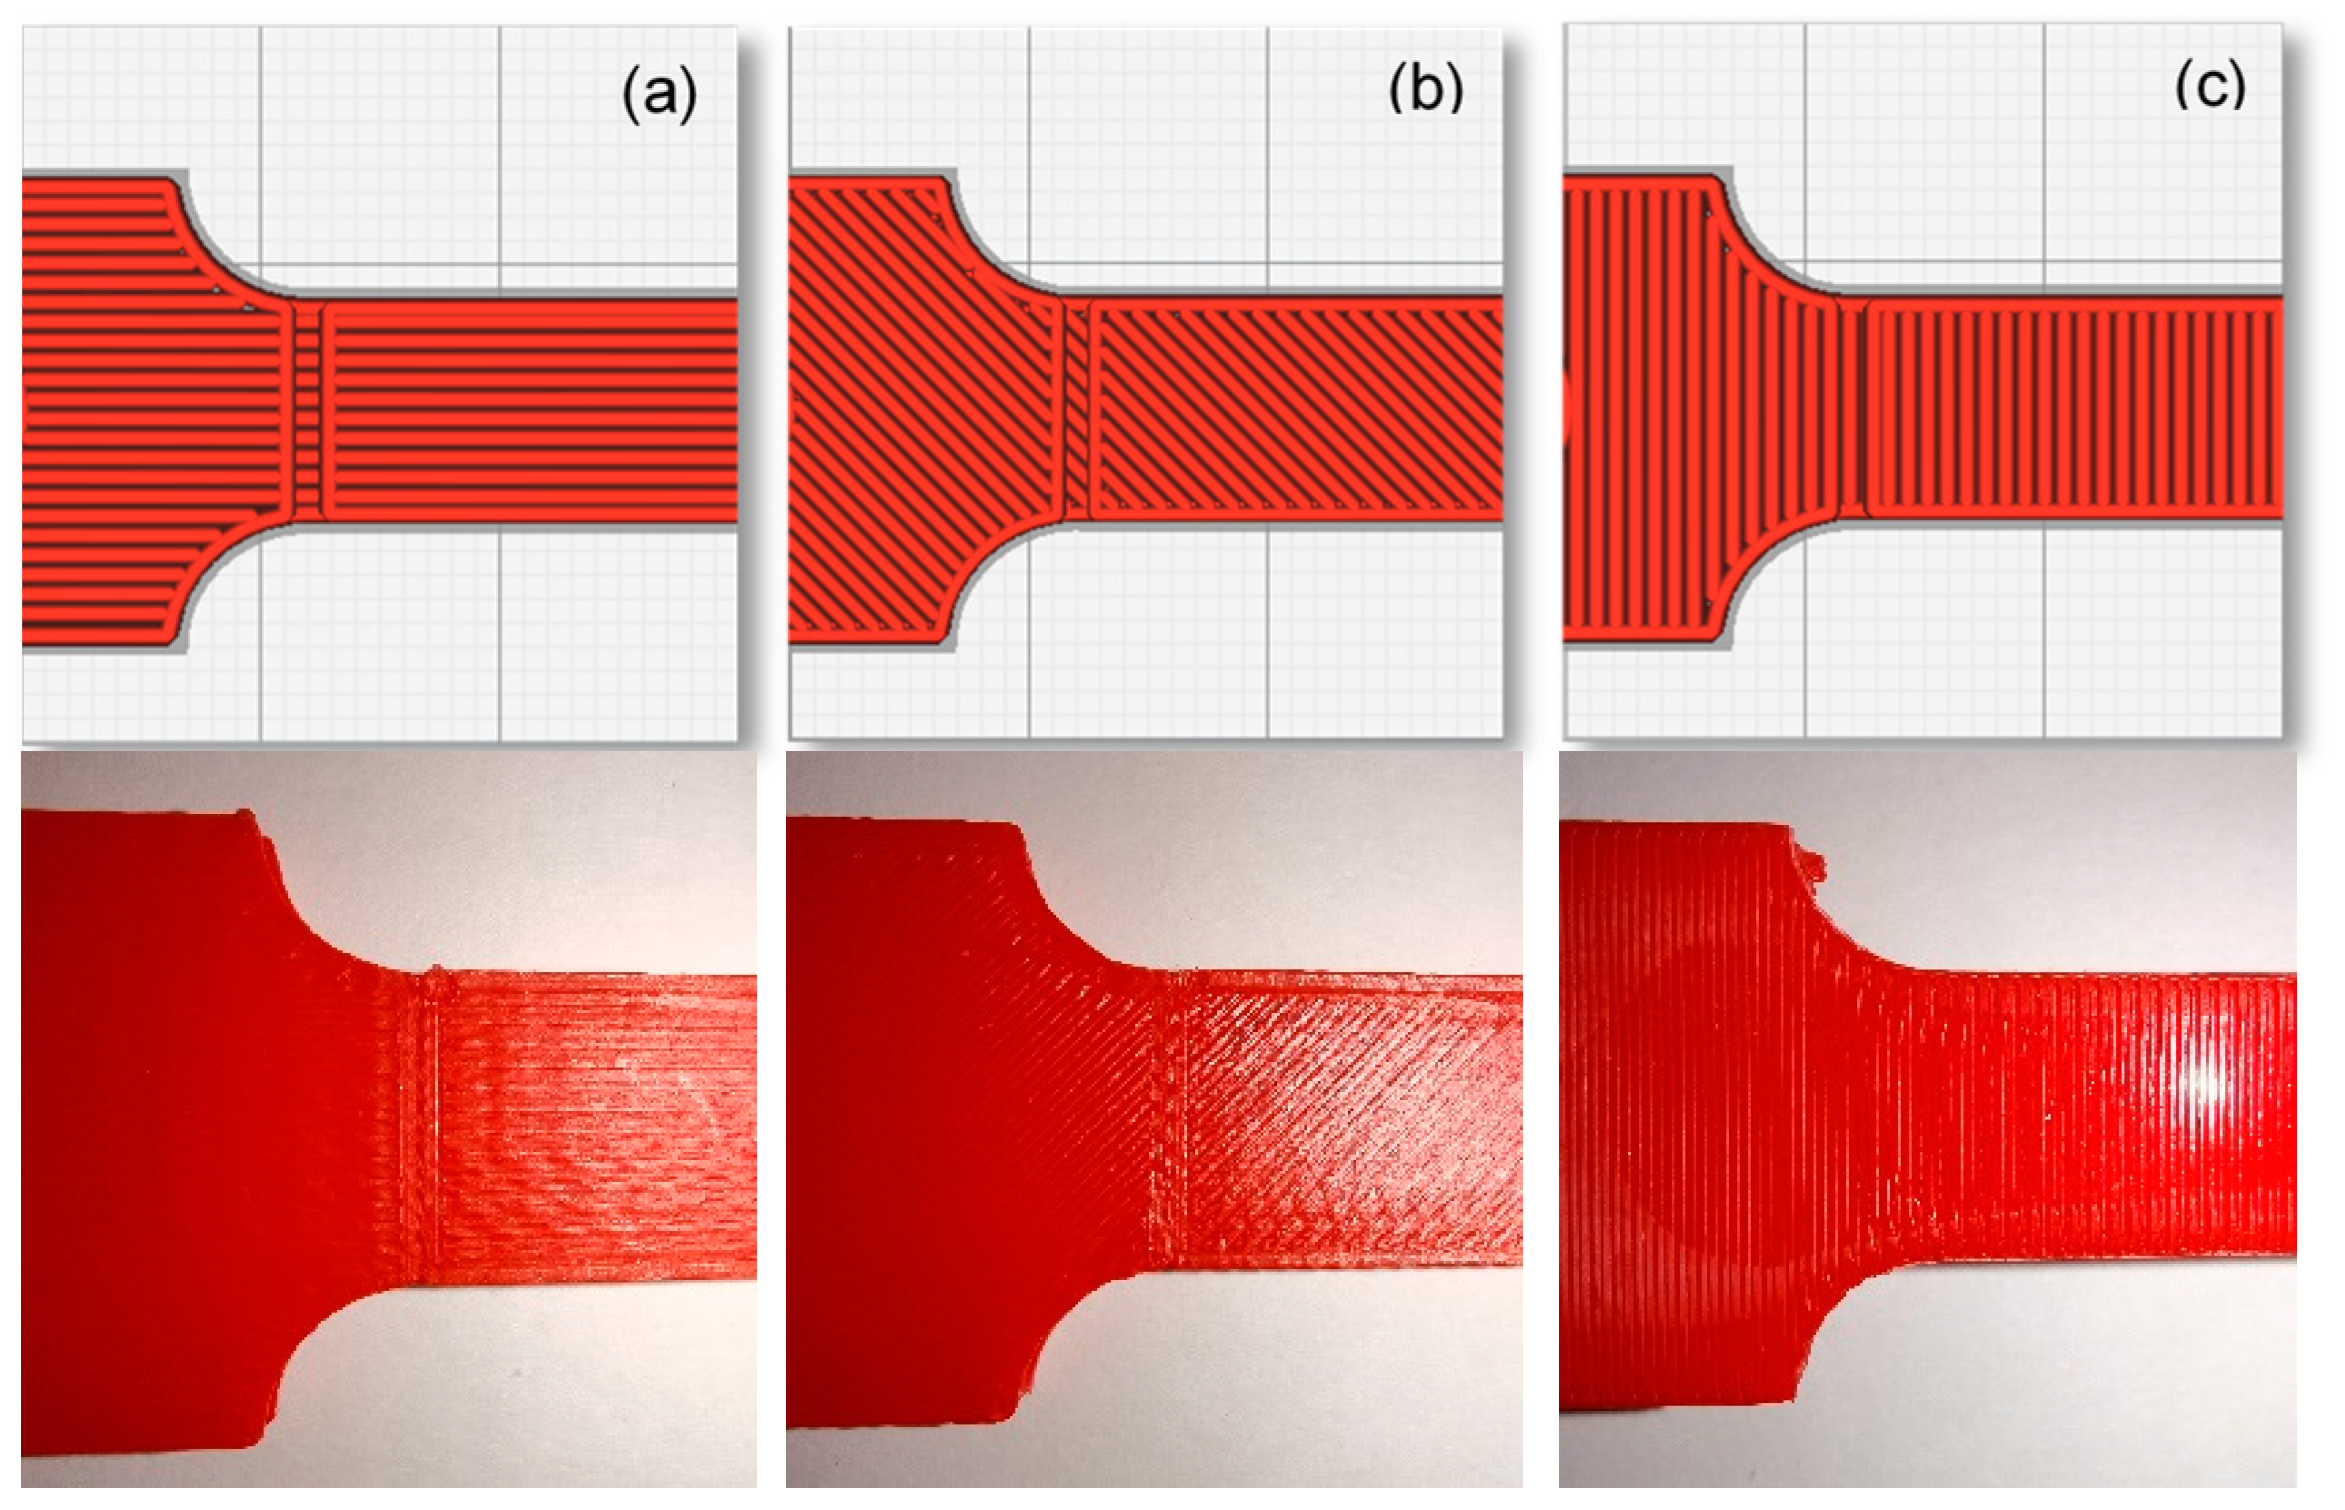
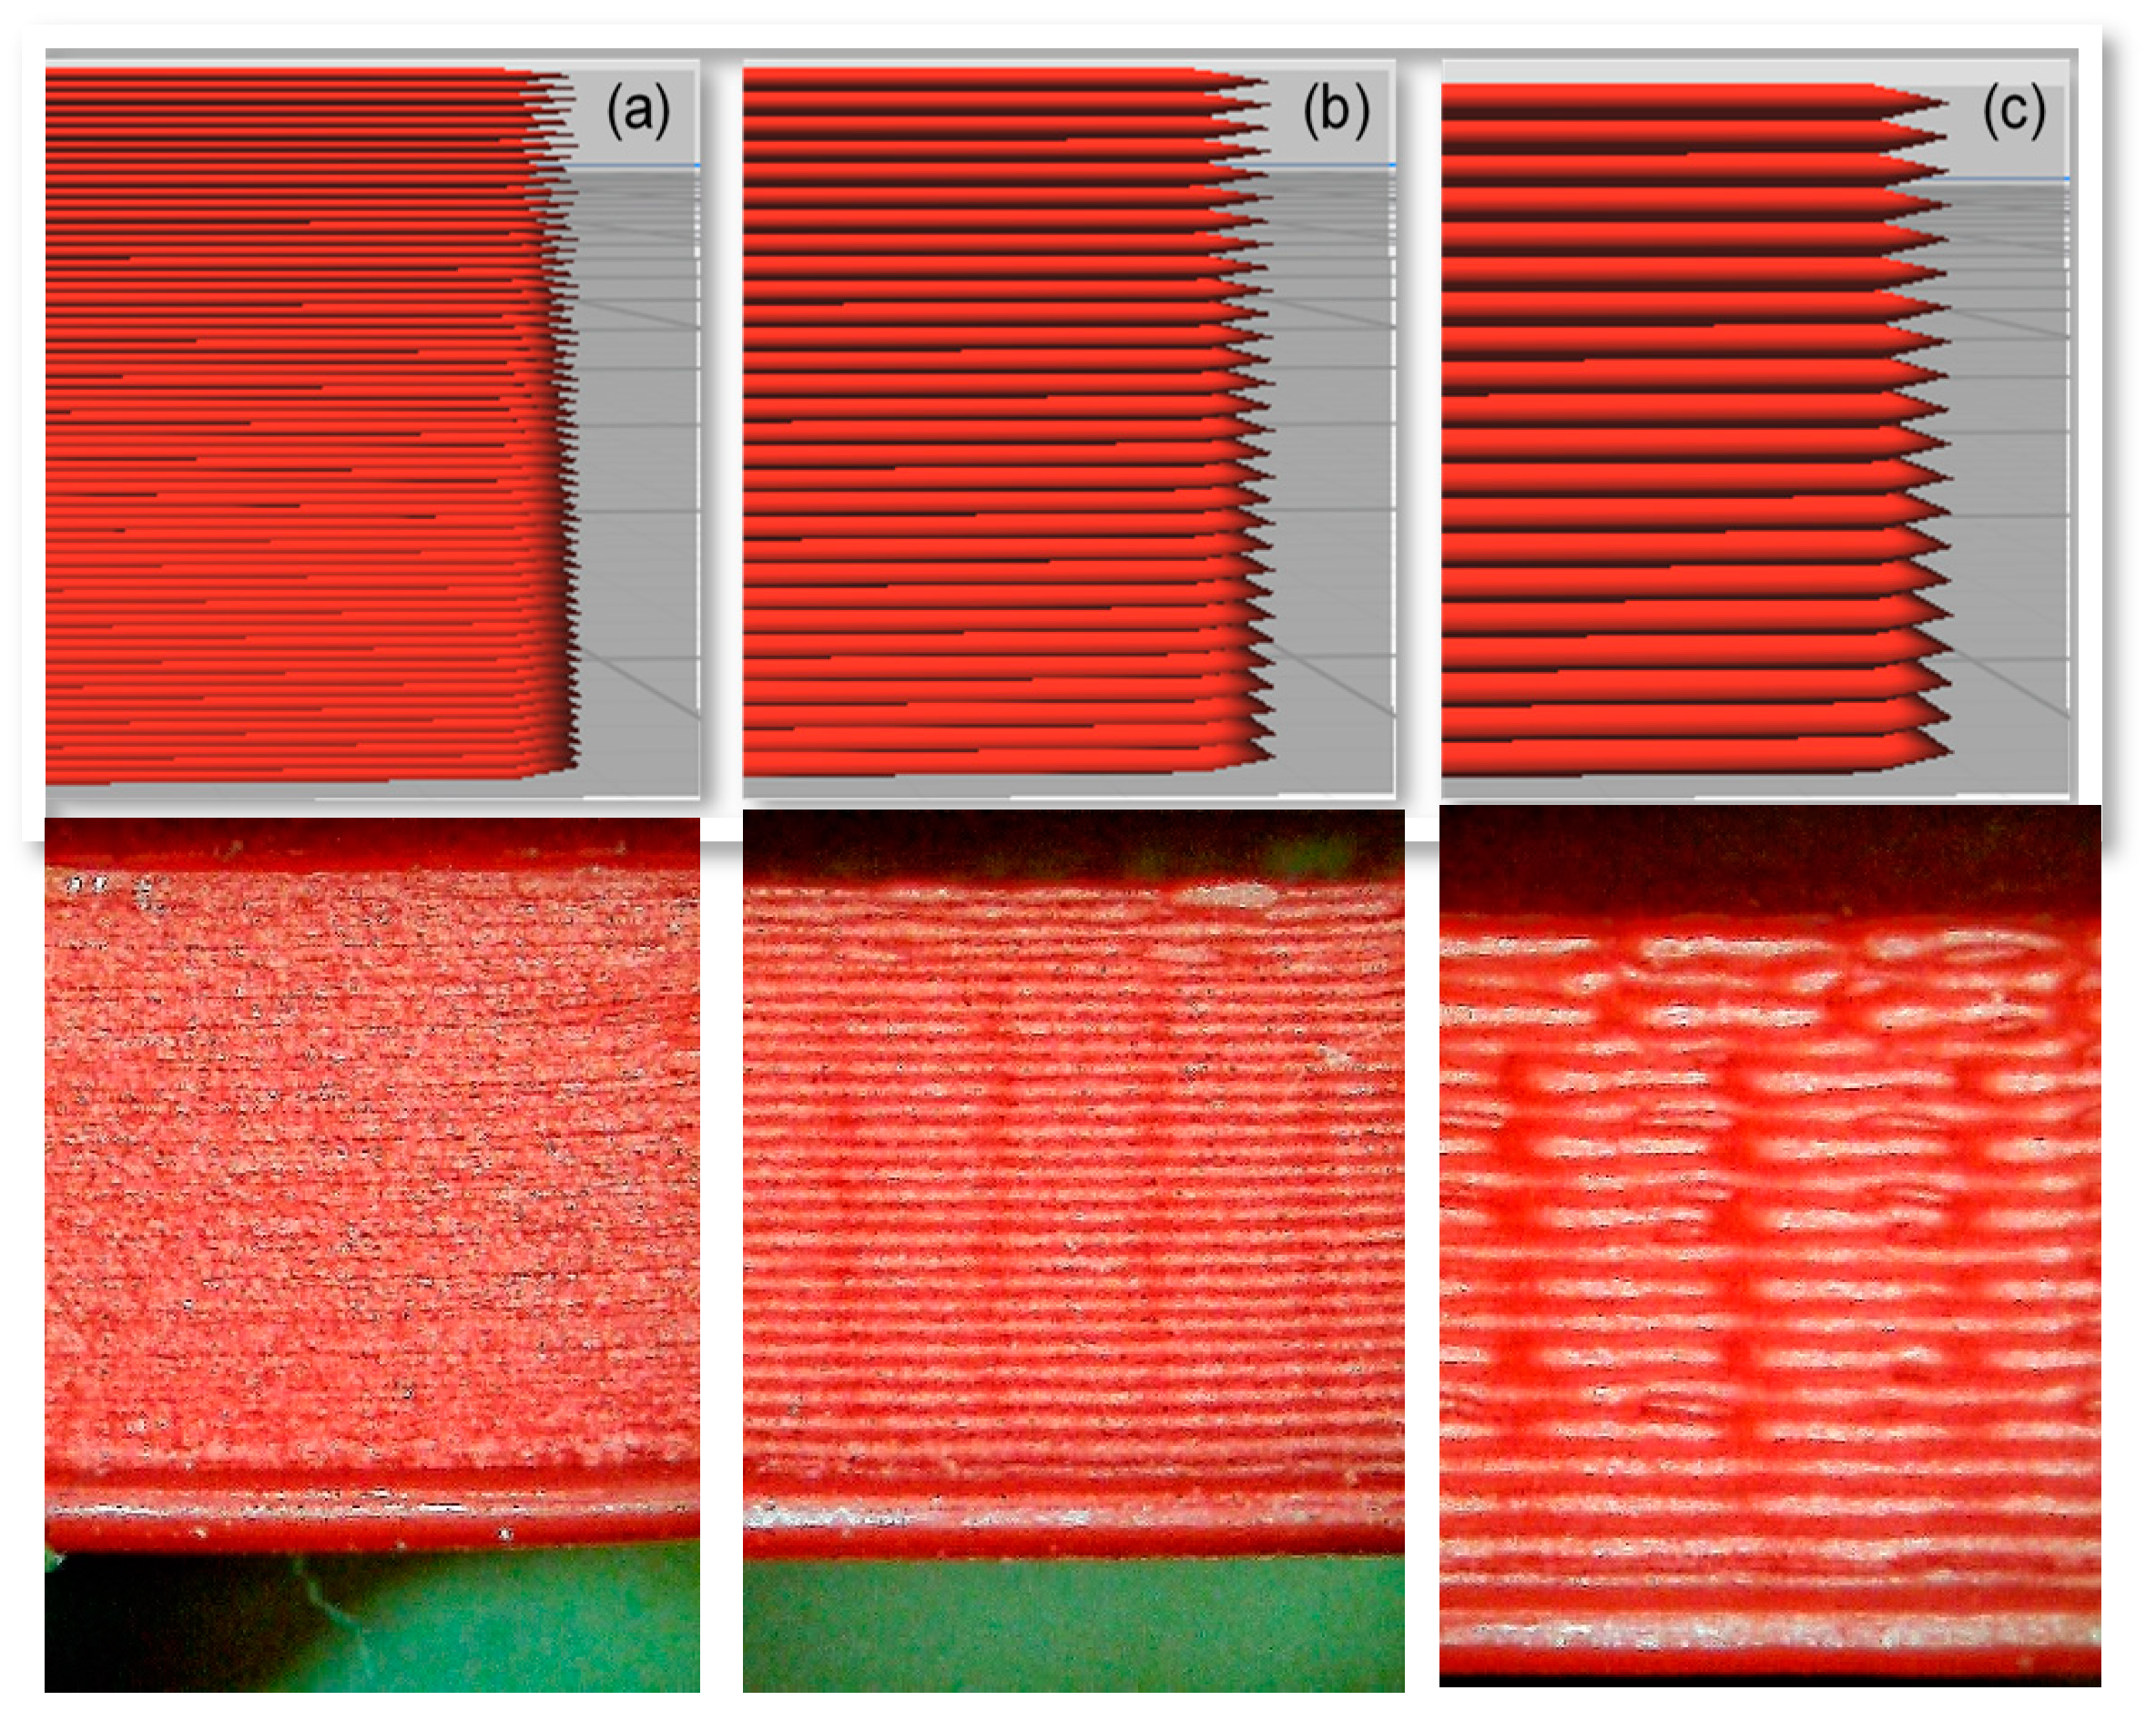
Figure 1. Building orientations directions and angles: (a) X (0°); (b) XY (±45°); and (c) Y (90°) [33].
Polymers 13 03737 g001
Figure 2. Three different layer thicknesses: (a) 0.05 mm; (b) 0.10 mm; (c) 0.15 mm [33].
Polymers 13 03737 g002
Figure 3. Three different nozzle sizes: (a) 0.4 mm; (b) 0.6 mm; (c) 0.8 mm [33].
Polymers 13 03737 g003
Figure 4. The samples geometry [33].
Polymers 13 03737 g004
Figure 5. The 3D printing process by the Ultimaker 2+ printer.
Polymers 13 03737 g005
Figure 6. Detailed experiment scheme.
Polymers 13 03737 g006
Figure 7. Experimental setup for the bending vibration test. (a) Signal generator, (b) power amplifier, (c) tested sample, (d) accelerator, (e) heat band, and (f) shaker.
Polymers 13 03737 g007
Figure 8. Load conditions during cyclic vibration.
Polymers 13 03737 g008
Figure 9. Comparison of building orientation influence on FCG rate for ABS samples with (0.4-, 0.6-, and 0.8-mm nozzle size and 0.05-, 0.10-, 0.15-mm layer thickness) under 50, 60, and 70 °C environmental temperatures.
Polymers 13 03737 g009
Figure 10. Comparison between layer thickness influence on FCG rate of FDM ABS samples with (0.4-, 0.6-, and 0.8-mm nozzle size, and X, XY, and Y building orientation) under 50, 60, 70 °C environmental temperatures.
Polymers 13 03737 g010
Figure 11. Comparison between the influence of different layer thicknesses of FDM ABS, printed with a 0.6-mm nozzle size, Y building orientation, and layer thickness (a) 0.15 mm and (b) 0.10 mm [33].
Polymers 13 03737 g011
Figure 12. Comparison between nozzle size influence on FCG rate of FDM ABS samples with (0.05, 0.10 and 0.15 mm layer thickness and X, XY, Y building orientation) under 50, 60, 70 °C environmental temperatures.
Polymers 13 03737 g012
Figure 13. Comparison between the influence of different nozzle sizes of FDM ABS, printed with 0.15-mm layer thickness, X building orientation, and nozzle size (a) 0.4 mm and (b) 0.8 mm [33].
Polymers 13 03737 g013
Figure 14. Comparison between the environmental temperatures influence on FCG rate of FDM ABS samples printed with (0.05-, 0.10-, and 0.15-mm layer thickness; 0.4-, 0.6-, and 0.8-mm nozzle sizes; and X, XY, and Y building orientations).
Polymers 13 03737 g014
Table 1. Parameters of printed samples.
Building OrientationNozzle SizeLayer Thickness
X (0°)0.4 mm0.05 mm
XY (±45°)0.6 mm0.10 mm
Y (90°)0.8 mm0.15 mm
Table 2. Filament specifications, and mechanical and thermal properties of the Ultimaker® ABS (RAL 3020) [33].
Filament Specifications and PropertiesValue
Diameter2.85 ± 0.10 mm
Tensile modulus1681 MPa (ISO 527)
Tensile stress at yield39 MPa (ISO 527)
Tensile stress at break33.9 MPa (ISO 527)
Elongation at yield3.5% (ISO 527)
Elongation at break4.8% (ISO 527)
Melt mass flow rate (MFR)41 g/10 min (ISO 1133)
Melting temperature225–245 °C (ISO 294)
Glass transition temperature97 °C (ISO 294)
Table 3. Standardized Value for different parameters.
Building OrientationNozzle SizeLayer ThicknessTemperatureStandardised Value
X (0°)0.4 mm0.05 mm50 °C−1
XY (±45°)0.6 mm0.10 mm60 °C0
Y (90°)0.8 mm0.15 mm70 °C1
Table 4. R-squared and RMSE for curve fitting of each parameter.
ParametersR-SquaredRMSE
Building orientationX (0°)0.62510.1562
XY (±45°)0.62440.1752
Y (90°)0.50610.175
Nozzle size (mm)0.40.41030.2054
0.60.42350.2057
0.80.35560.2253
Layer thickness (mm)0.050.45170.247
0.100.41780.1932
0.150.30770.198
Temperature (°C)500.32220.2143
600.38620.1937
700.47810.2281
Table 5. The mean FCG rate and number of cycles of different orientations regardless of other printing parameters.
Building OrientationMean FCG Rate
(m/cycle)
Mean Number of Cycles until the Fracture
X9.68 × 10−7 4343
XY9.75 × 10−73912
Y9.77 × 10−72282
Table 6. The mean FCG rate and number of cycles of different layer thicknesses regardless of other printing parameters.
Layer Thickness
(mm)
Mean FCG Rate
(m/cycle)
Mean Number of Cycles until the Fracture
0.051.04 × 10−63417
0.109.94 × 10−73523
0.159.19 × 10−73805
Table 7. The mean FCG rate and number of cycles of different nozzle sizes regardless of other printing parameters.
Nozzle Size
(mm)
Mean FCG Rate
(m/cycle)
Mean Number of Cycles until the Fracture
0.41.06 × 10−6 3224
0.61.02 × 10−6 3374
0.88.19 × 10−7 4147
Table 8. The mean FCG rate and number of cycles of different environmental temperatures regardless of other printing parameters.
Environmental Temperature (°C)Mean FCG Rate
(m/cycle)
Mean Number of Cycles until the Fracture
509.77 × 10−73604
609.78 × 10−73292
709.86 × 10−73122
Table 9. The Paris power law constant (C and m) for a part of configurations obtained from experimental results where (da/dN in m/cycle and ΔK in MPa*√m).
Building Orientation T
(°C)
Nozzle Size (mm)Layer Thickness (mm)Log CCmR-Square (%)
X500.40.05−3.6072.47 × 10−40.76394%
X500.40.10−4.8851.30 × 10−50.39081%
X500.40.15−5.0997.96 × 10−60.32991%
X500.60.05−3.7541.76 × 10−40.75499%
XY500.40.05−2.0788.36 × 10−31.13198%
Y500.40.05−2.9381.15 × 10−30.81884%
Y500.80.15−4.6602.19 × 10−50.41898%
Y 600.80.15−4.6602.19 × 10−50.41898%
Y700.80.15−3.4083.91 × 10−40.73199%
Publisher’s Note: MDPI stays neutral with regard to jurisdictional claims in published maps and institutional affiliations.

