
Polymer Composites Based on Polycarbonate (PC) Applied to Additive Manufacturing Using Melted and Extruded Manufacturing (MEM) Technology

 ,
,  ,
,  , ,
, ,  and
and 
Abstract
:
1. Introduction
2. Materials and Methods
2.1. Materials
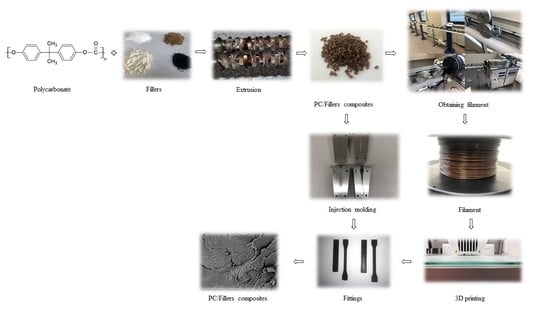
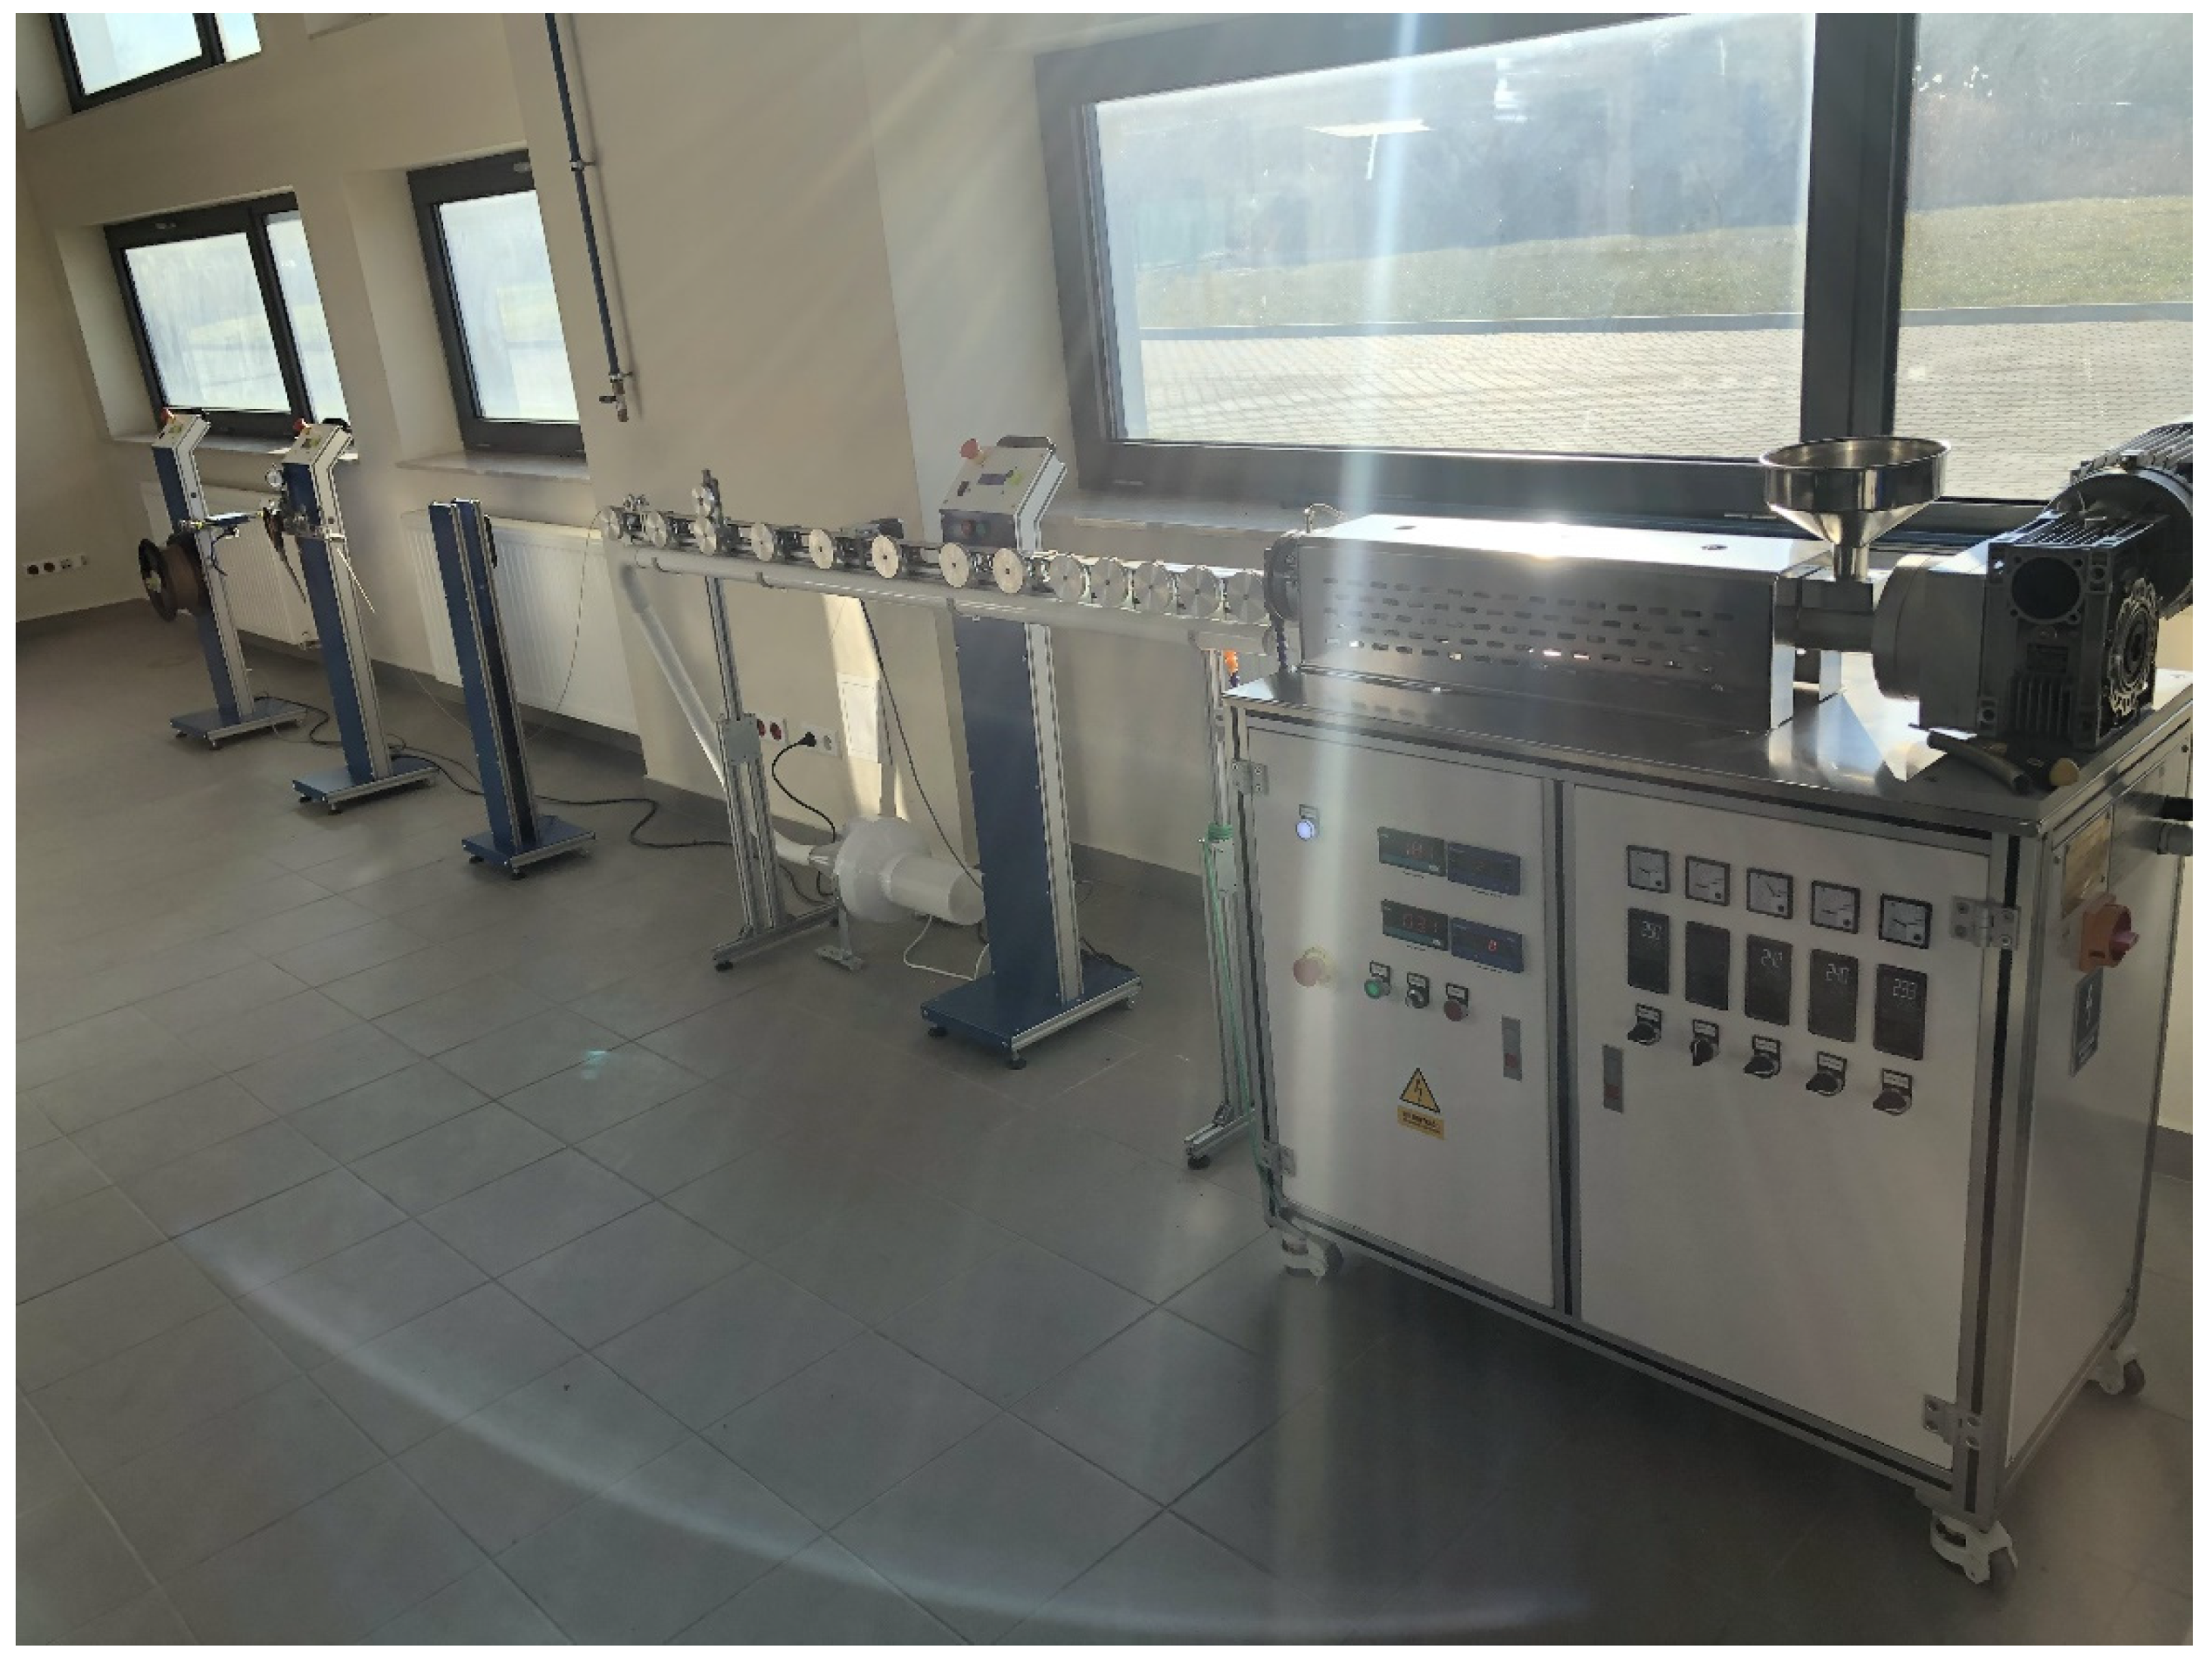
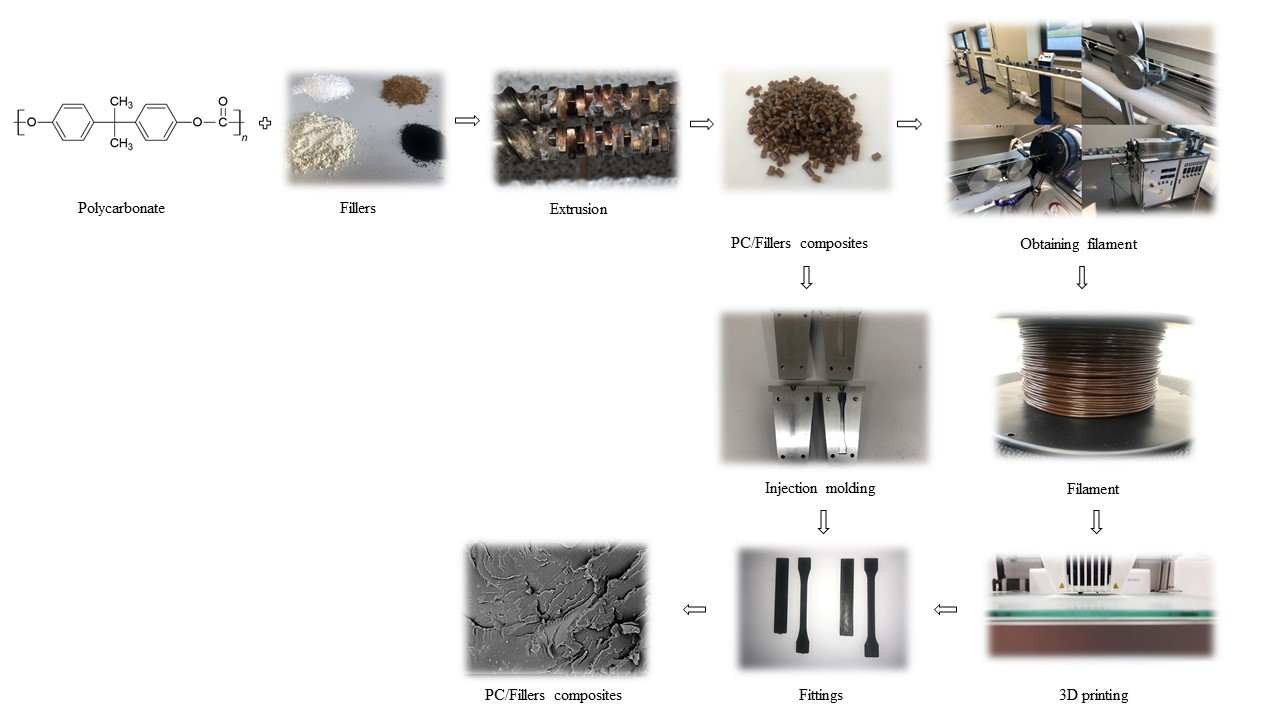
2.2. Preparation of the Composite
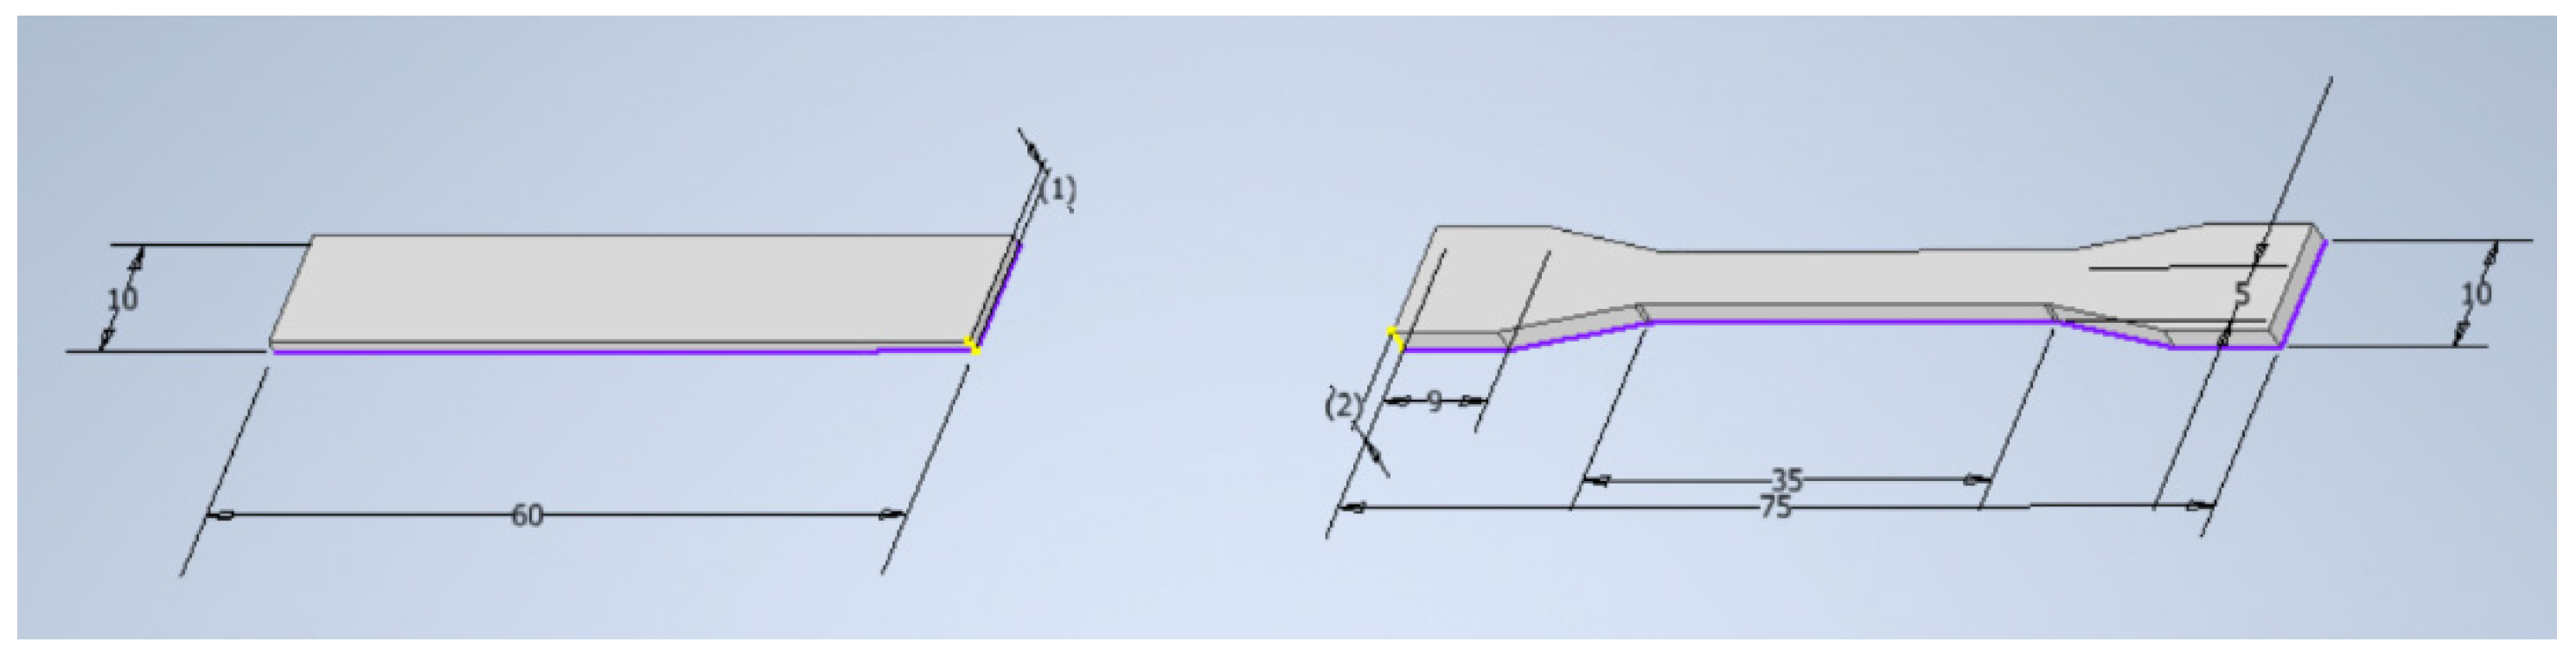
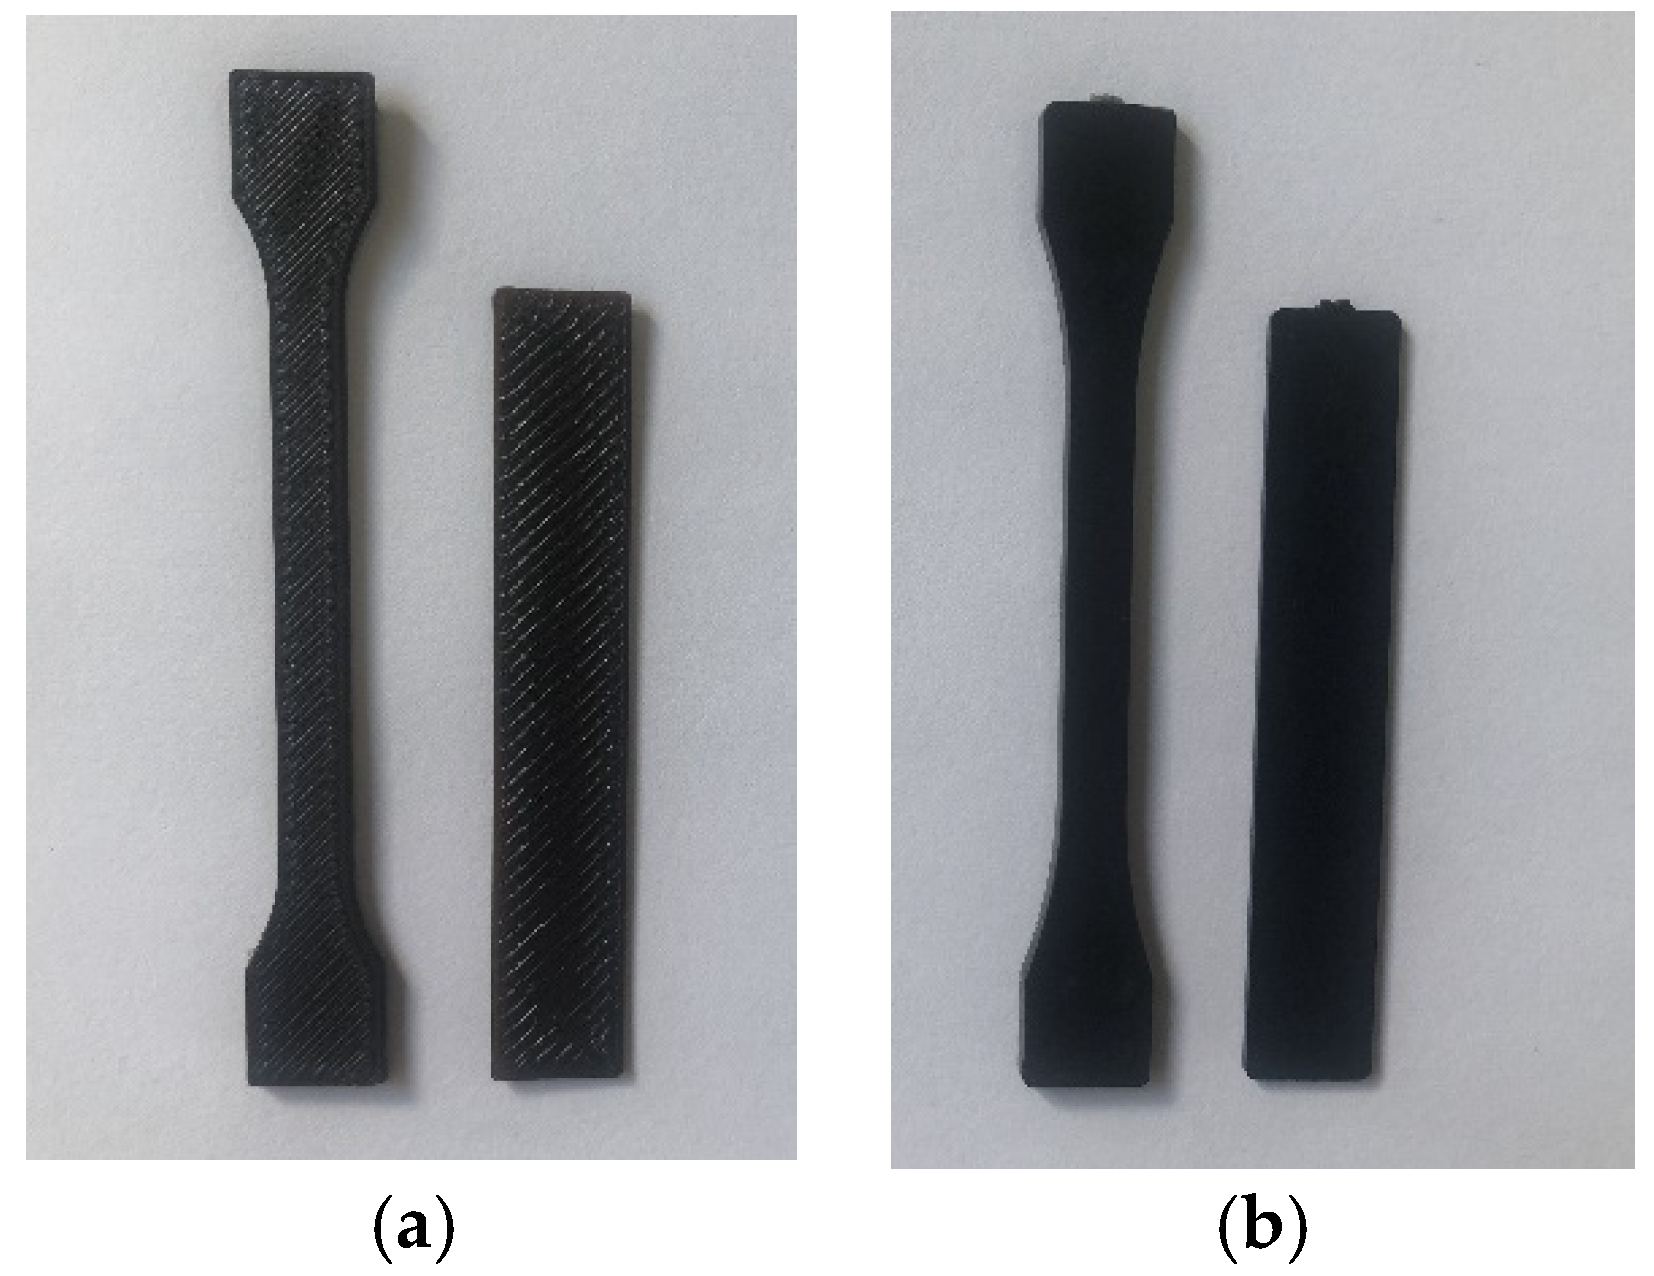
2.3. Sample Preparation
2.4. Characterization
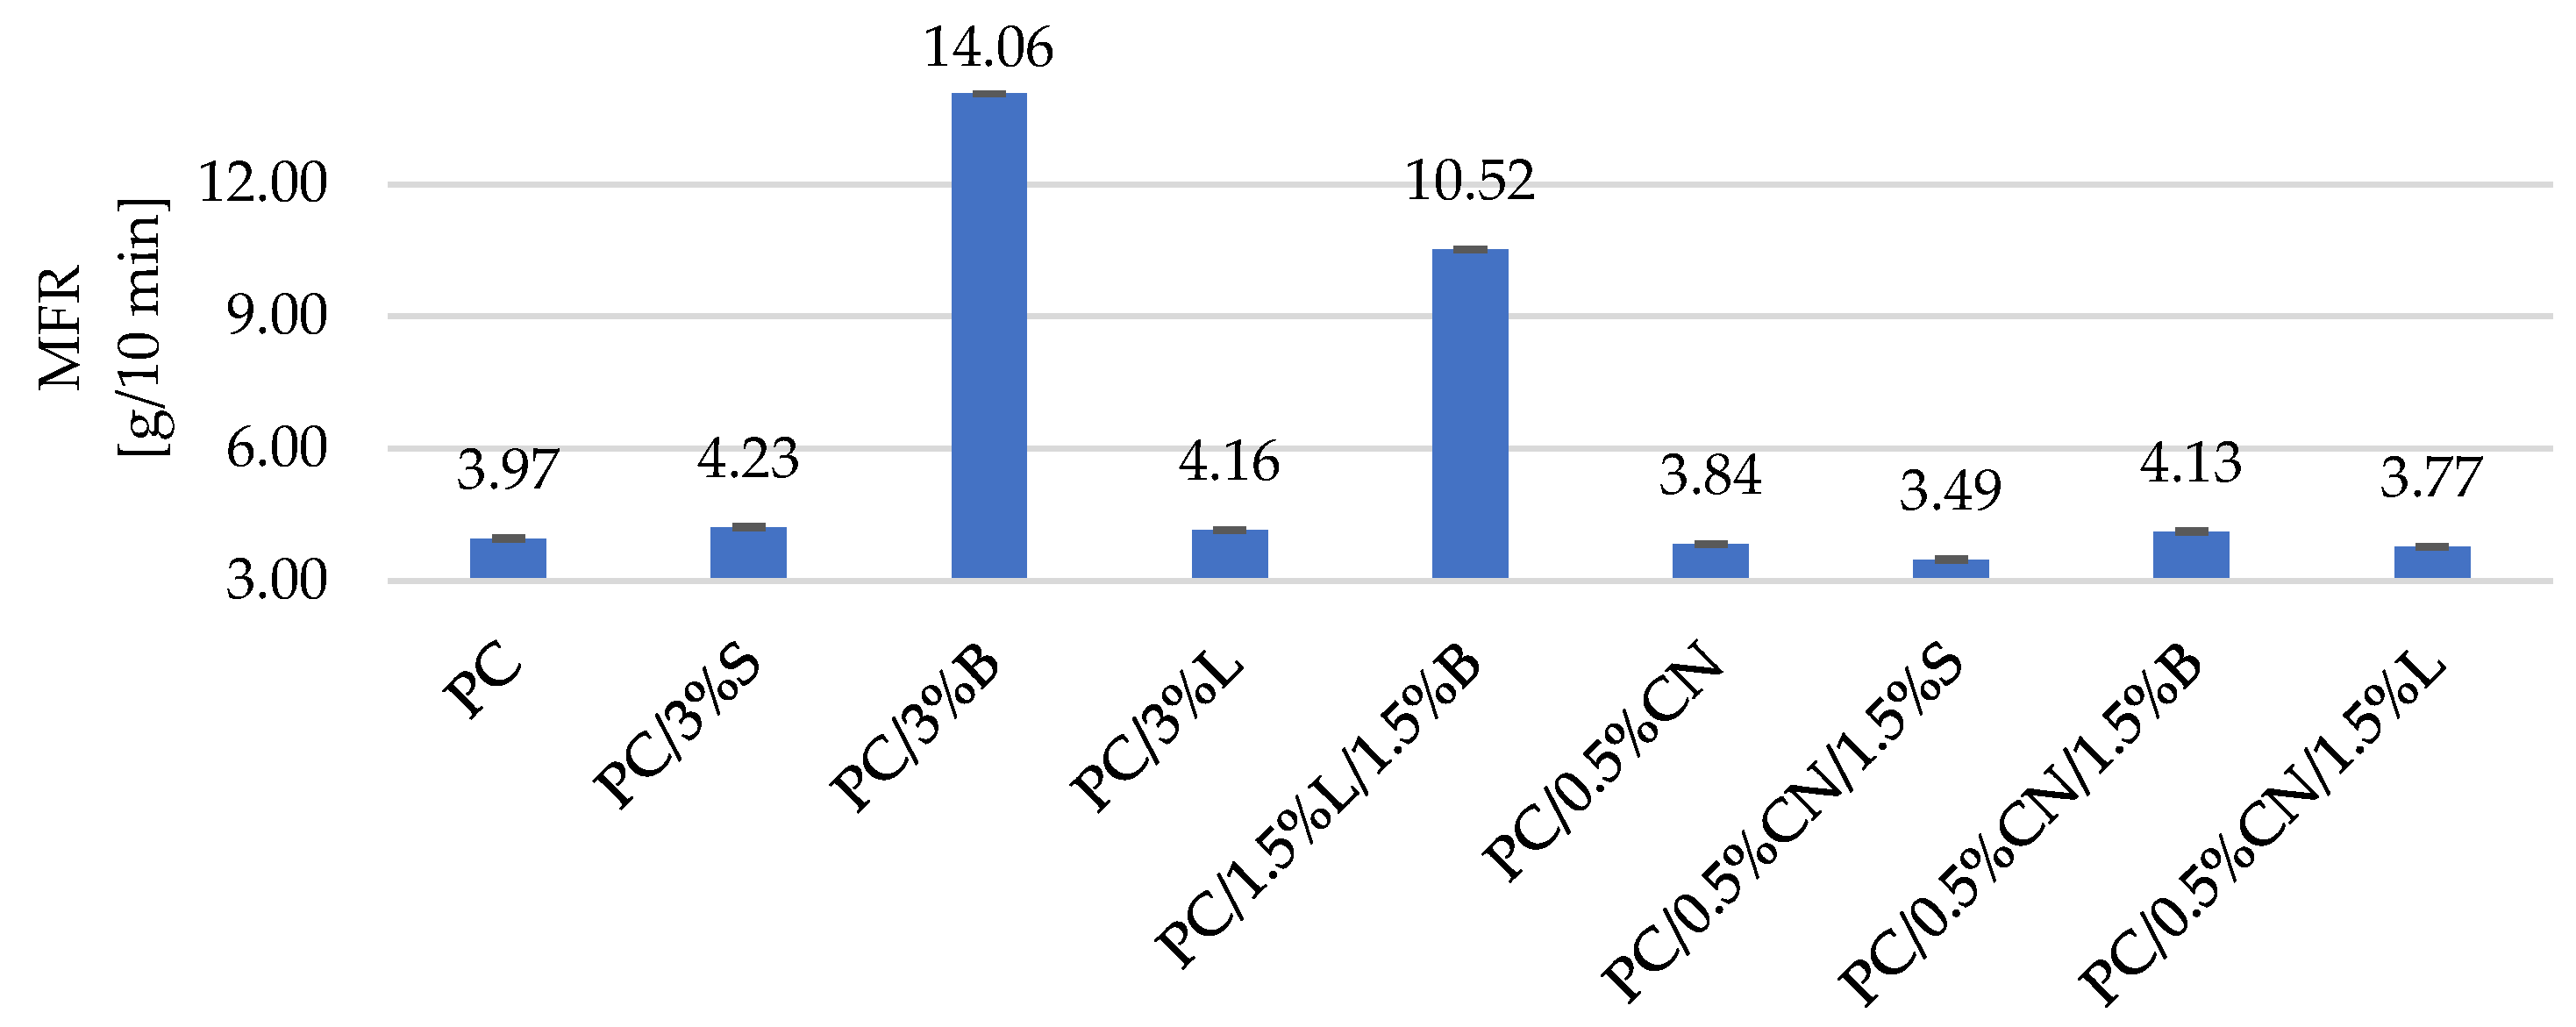
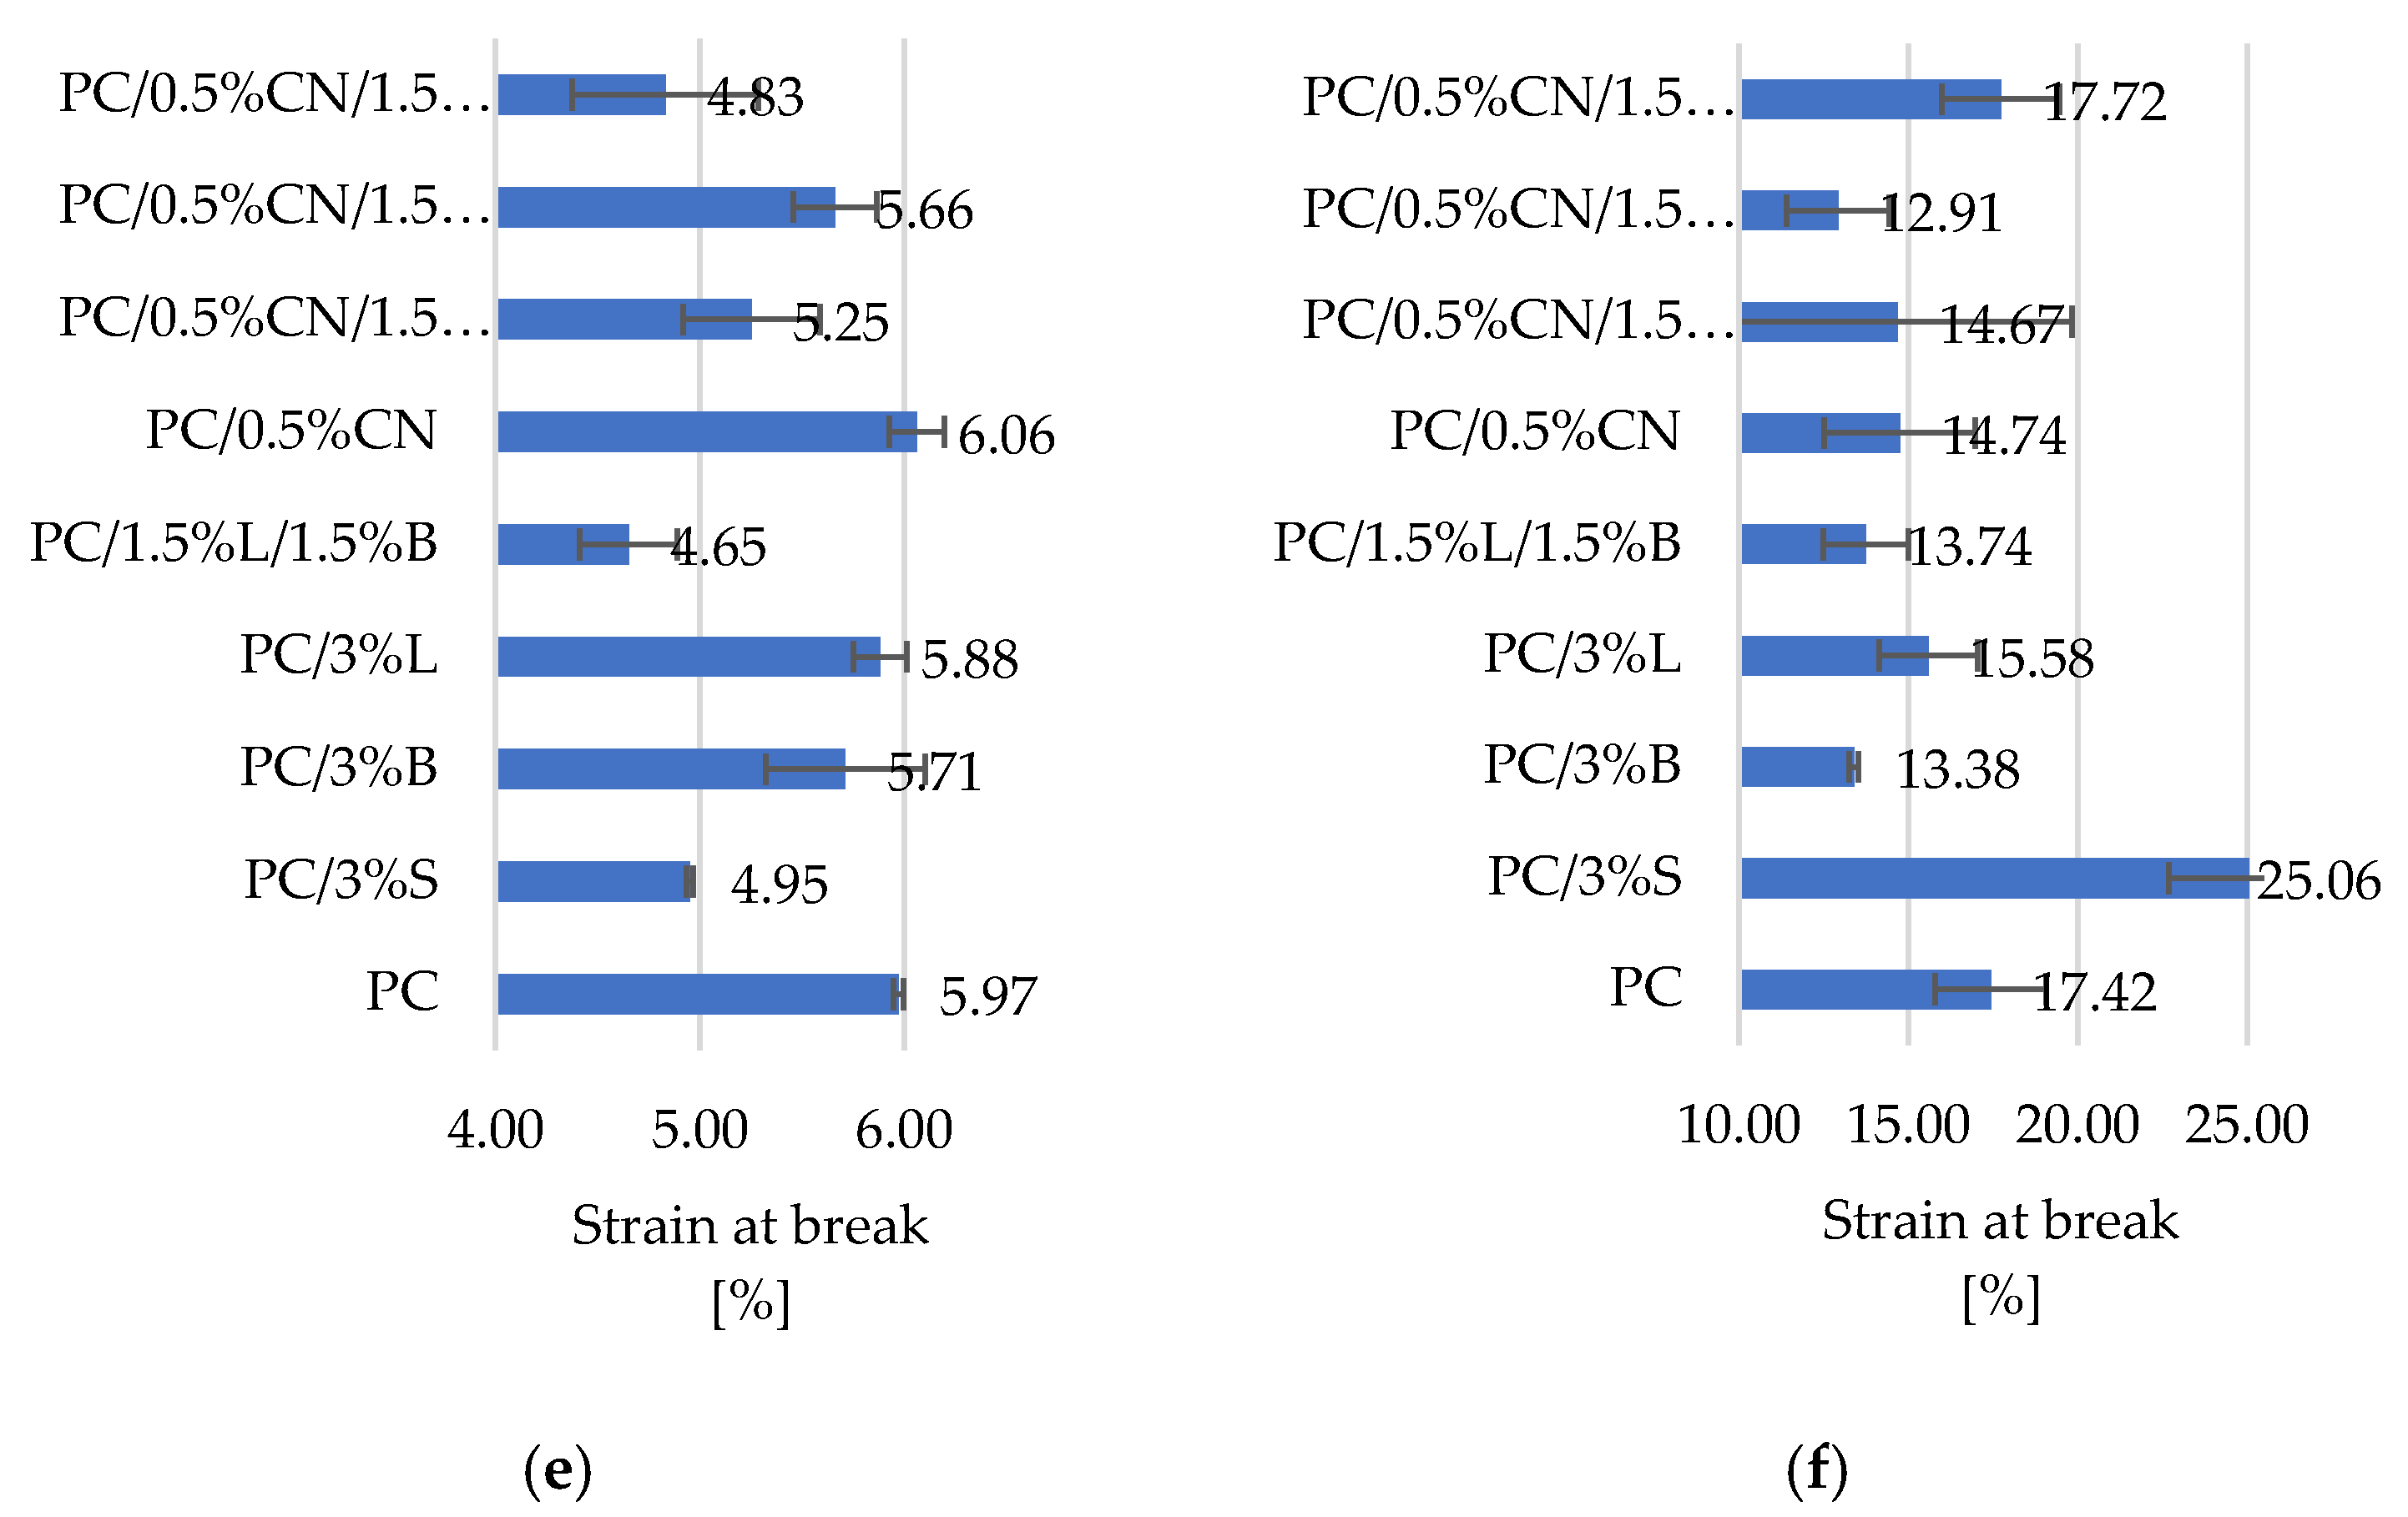
3. Results and Discussion
4. Conclusions
Author Contributions
Funding
Institutional Review Board Statement
Informed Consent Statement
Data Availability Statement
Acknowledgments
Conflicts of Interest
References
- Shanmugam, V.; Das, O.; Babu, K.; Marimuthu, U.; Veerasimman, A.; Johnson, D.J.; Neisiany, R.E.; Hedenqvist, M.S.; Ramakrishna, S.; Berto, F. Fatigue behaviour of FDM-3D printed polymers, polymeric composites and architected cellular materials. Int. J. Fatigue 2021, 143, 106007. [Google Scholar] [CrossRef]
- Çevik, U.; Kam, M. A Review Study on Mechanical Properties of Obtained Products by FDM Method and Metal/Polymer Composite Filament Production. J. Nanomater. 2020, 2020, 1–9. [Google Scholar] [CrossRef]
- Wang, P.; Zou, B.; Ding, S.; Huang, C.; Shi, Z.; Ma, Y.; Yao, P. Preparation of short CF/GF reinforced PEEK composite filaments and their comprehensive properties evaluation for FDM-3D printing. Compos. Part B Eng. 2020, 198, 108175. [Google Scholar] [CrossRef]
- Antony, S.; Cherouat, A.; Montay, G. Fabrication and Characterization of Hemp Fibre Based 3D Printed Honeycomb Sandwich Structure by FDM Process. Appl. Compos. Mater. 2020, 27, 935–953. [Google Scholar] [CrossRef]
- Ahmed, W.; Alnajjar, F.; Zaneldin, E.; Al-Marzouqi, A.H.; Gochoo, M.; Khalid, S. Implementing FDM 3D Printing Strategies Using Natural Fibers to Produce Biomass Composite. Materials 2020, 13, 4065. [Google Scholar] [CrossRef]
- Lee, J.-Y.; An, J.; Chua, C.K. Fundamentals and applications of 3D printing for novel materials. Appl. Mater. Today 2017, 7, 120–133. [Google Scholar] [CrossRef]
- Bere, P.; Neamtu, C.; Udroiu, R. Novel Method for the Manufacture of Complex CFRP Parts Using FDM-based Molds. Polymers 2020, 12, 2220. [Google Scholar] [CrossRef] [PubMed]
- Koziol, M.; Szperlich, P.; Toron, B.; Olesik, P.; Jesionek, M. Assessment of the Piezoelectric Response of an Epoxy Res-in/SbSINanowires Composite Filling FDM Printed Grid. Materials 2020, 13, 5281. [Google Scholar] [CrossRef] [PubMed]
- Justo, J.; Tavara, L.; García-Guzmán, L.; París, F. Characterization of 3D printed long fibre reinforced composites. Compos. Struct. 2018, 185, 537–548. [Google Scholar] [CrossRef]
- Brenken, B.; Barocio, E.; Favaloro, A.; Kunc, V.; Pipes, R.B. Fused filament fabrication of fiber-reinforced polymers: A review. Addit. Manuf. 2018, 21, 1–16. [Google Scholar] [CrossRef]
- Vinyas, M.; Athul, S.; Harursampath, D.; Thoi, T.N. Experimental evaluation of the mechanical and thermal properties of 3D printed PLA and its composites. Mater. Res. Express 2019, 6, 115301. [Google Scholar] [CrossRef]
- Suárez-Macías, J.; Terrones-Saeta, J.M.; Iglesias-Godino, F.J.; Corpas-Iglesias, F.A. Surface Treatments with Dichloromethane to Eliminate Printing Lines on Polycarbonate Components Printed by Fused Deposition Modelling Technology. Materials 2020, 13, 2724. [Google Scholar] [CrossRef] [PubMed]
- Park, S.J.; Lee, J.E.; Park, J.H.; Lyu, M.-Y.; Park, K.; Koo, M.S.; Kim, K.Y. PFDM 3D Printing of Environmental Friendly and High Strength Bio-based PC Filaments for Baby Toys. Elastomers Compos. 2017, 52, 99–104. [Google Scholar] [CrossRef]
- Kumar, M.; Ramakrishnan, R.; Omarbekova, A.; R, S.K. Experimental characterization of mechanical properties and microstructure study of polycarbonate (PC) reinforced acrylonitrile-butadiene-styrene (ABS) composite with varying PC loadings. AIMS Mater. Sci. 2021, 8, 18–28. [Google Scholar] [CrossRef]
- Bano, S.; Iqbal, T.; Ramzan, N.; Farooq, U. Study of Surface Mechanical Characteristics of ABS/PC Blends Using Nanoindentation. Processes 2021, 9, 637. [Google Scholar] [CrossRef]
- Kannan, S.; Ramamoorthy, M.; K, S.; Manoharan, R. Mechanical characterization and experimental modal analysis of 3D Printed ABS, PC and PC-ABS materials. Mater. Res. Express 2020, 7, 15341. [Google Scholar] [CrossRef]
- Farcas, M.T.; Stefaniak, A.B.; Knepp, A.K.; Bowers, L.; Mandler, W.K.; Kashon, M.; Jackson, S.R.; Stueckle, T.A.; Sisler, J.D.; Friend, S.A.; et al. Acrylonitrile butadiene styrene (ABS) and polycarbonate (PC) filaments three-dimensional (3-D) printer emissions-induced cell toxicity. Toxicol. Lett. 2019, 317, 1–12. [Google Scholar] [CrossRef]
- Yap, Y.L.; Toh, W.; Koneru, R.; Lin, K.; Yeoh, K.M.; Lim, C.M.; Lee, J.S.; Plemping, N.A.; Lin, R.; Ng, T.Y.; et al. A non-destructive experimental-cum-numerical methodology for the characterization of 3D-printed materials—polycarbonate-acrylonitrile butadiene styrene (PC-ABS). Mech. Mater. 2019, 132, 121–133. [Google Scholar] [CrossRef]
- Andrzejewski, J.; Marciniak-Podsadna, L. Development of Thermal Resistant FDM Printed Blends. The Preparation of GPET/PC Blends and Evaluation of Material Performance. Materials 2020, 13, 2057. [Google Scholar] [CrossRef] [PubMed]
- Gupta, A.; Fidan, I.; Hasanov, S.; Nasirov, A. Processing, mechanical characterization, and micrography of 3D-printed short carbon fiber reinforced polycarbonate polymer matrix composite material. Int. J. Adv. Manuf. Technol. 2020, 107, 3185–3205. [Google Scholar] [CrossRef]
- Yeong, W.Y.; Goh, G.D. 3D Printing of Carbon Fiber Composite: The Future of Composite Industry? Matter 2020, 2, 1361–1363. [Google Scholar] [CrossRef]
- Oliwa, R. The Mechanical Properties of Kevlar Fabric/Epoxy Composites Containing Aluminosilicates Modified with Qua-ternary Ammonium and Phosphonium Salts. Materials 2020, 13, 3726. [Google Scholar] [CrossRef]
- Oliwa, R.; Heneczkowski, M.; Oleksy, M. Epoxy composites for aviation industry. Polimery 2015, 60, 167–178. [Google Scholar] [CrossRef]
- Klapiszewski, Ł.; Bula, K.; Sobczak, M.; Jesionowski, T. Influence of Processing Conditions on the Thermal Stability and Mechanical Properties of PP/Silica-Lignin Composites. Int. J. Polym. Sci. 2016, 2016, 1–9. [Google Scholar] [CrossRef] [Green Version]
- Bula, K.; Klapiszewski, Ł.; Jesionowski, T. A novel functional silica/lignin hybrid material as a potential bio-based polypropylene filler. Polym. Compos. 2014, 36, 913–922. [Google Scholar] [CrossRef]
- Fal, J.; Bulanda, K.; Oleksy, M.; Sobczak, J.; Shi, J.; Liu, M.; Boncel, S.; Żyła, G. High AC and DC Electroconductivity of Scalable and Economic Graphite–Diamond Polylactide Nanocomposites. Materials 2021, 14, 2835. [Google Scholar] [CrossRef] [PubMed]
- Teng, C.-C.; Ma, C.-C.M.; Huang, Y.-W.; Yuen, S.-M.; Weng, C.-C.; Chen, C.-H.; Su, S.-F. Effect of MWCNT content on rheological and dynamic mechanical properties of multiwalled carbon nanotube/polypropylene composites. Compos. Part A Appl. Sci. Manuf. 2008, 39, 1869–1875. [Google Scholar] [CrossRef]
- Tanahashi, M.; Watanabe, Y.; Lee, J.-C.; Takeda, K.; Fujisawa, T. Melt flow and mechanical properties of silica/perfluoropolymer nanocomposites Fabricated by direct melt-compounding without surface modification on nano-silica. J. Nanosci. Nanotechnol. 2009, 9, 539–549. [Google Scholar] [CrossRef] [PubMed]
- Shen, J.; Ji, G.; Hu, B.; Huang, Y. Effect of filler size and surface treatment on impact and rheological properties of wollastonite-polypropylene composites. J. Mater. Sci. Lett. 1993, 12, 1344. [Google Scholar] [CrossRef]
- Park, C.-W.; Youe, W.-J.; Han, S.-Y.; Park, J.-S.; Lee, E.-A.; Park, J.-Y.; Kwon, G.-J.; Kim, S.-J.; Lee, S.-H. Influence of Lignin and Polymeric Diphenylmethane Diisocyante Addition on the Properties of Poly(butylene succinate)/Wood Flour Composite. Polymers 2019, 11, 1161. [Google Scholar] [CrossRef] [Green Version]
- Park, C.-W.; Youe, W.-J.; Namgung, H.-W.; Han, S.-Y.; Seo, P.-N.; Chae, H.-M.; Lee, S.-H. Effect of Lignocellulose Nanofibril and Polymeric Methylene Diphenyl Diisocyanate Addition on Plasticized Lignin/Polycaprolactone Composites. Bioresources 2018, 13, 6802–6817. [Google Scholar]
- Alhallak, L.M.; Tirkes, S.; Tayfun, Ü. Mechanical, thermal, melt-flow and morphological characterizations of bentonite-filled ABS copolymer. Rapid Prototyp. J. 2020, 26, 1305–1312. [Google Scholar] [CrossRef]
- Ozdemir, E.; Lekesiz, T.O.; Hacaloglu, J. Polylactide/organicallymodifiedmontmorillonitecomposites; effects of organic modifier on thermalcharacteristics. Polym. Degrad. Stab. 2016, 134, 87–96. [Google Scholar] [CrossRef]
- Alhaj, I.; Tirkes, S.; Hacioglu, H.; Tayfun, U. Investigations of polycarbonate hybrid compositescontaining mi-caflakes and glassfiber. Adv. Mater. Lett. 2020, 11, 20041501. [Google Scholar] [CrossRef]
- Jang, K.-S. Mineral filler effect on the mechanics and flame retardancy of polycarbonate composites: Talc and kaolin. e-Polymers 2016, 16, 379–386. [Google Scholar] [CrossRef]
- Poosala, A.; Hrimchum, K.; Aussawasathien, D.; Pentrakoon, D. The Effect of Oxygen-Plasma Treated Graphene Nanoplatelets upon the Properties of Multiwalled Carbon Nanotube and Polycarbonate Hybrid Nanocomposites Used for Electrostatic Dissipative Applications. J. Nanomater. 2015, 2015, 1–9. [Google Scholar] [CrossRef]
- Aalaie, J.; Rahmatpour, A.; Maghami, S. Preparation and characterization of linear low density polyethylene/carbon nanotube nanocomposites. J. Macromol. Sci. B 2007, 46, 877. [Google Scholar] [CrossRef]
- Bulanda, K.; Oleksy, M.; Oliwa, R.; Budzik, G.; Przeszlowski, L.; Mazurkow, A. Biodegradable polymer composites used in rapid prototyping technology by Melt Extrusion Polymers (MEP). Polimery 2020, 65, 430–436. [Google Scholar] [CrossRef]
- Bakır, A.A.; Atik, R.; Özerinç, S. Mechanical properties of thermoplastic parts produced by fused deposition modeling:a review. Rapid Prototyp. J. 2021, 27, 537–561. [Google Scholar] [CrossRef]
- Budzik, G.; Magniszewski, M.; Przeszlowski, L. Torsional strength testing of machine elements manufacture by incremental technology from polymeric materials. Polimery 2018, 63, 830–832. [Google Scholar] [CrossRef]
- Jindal, P.; Yadav, R.N.; Kumar, N. Dynamic mechanical characterization of PC/MWCNT composites under variable temperature conditions. Iran. Polym. J. 2017, 26, 445–452. [Google Scholar] [CrossRef]
- Arif, M.; Alhashmi, H.; Varadarajan, K.; Koo, J.H.; Hart, A.; Kumar, S. Multifunctional performance of carbon nanotubes and graphene nanoplatelets reinforced PEEK composites enabled via FFF additive manufacturing. Compos. Part B Eng. 2020, 184, 107625. [Google Scholar] [CrossRef]
- Navidfar, A.; Sancak, A.; Yildirim, K.B.; Trabzon, L. A Study on Polyurethane Hybrid Nanocomposite Foams Reinforced with Multiwalled Carbon Nanotubes and Silica Nanoparticles. Polym. Technol. Eng. 2017, 57, 1463–1473. [Google Scholar] [CrossRef]
- Vidakis, N.; Petousis, M.; Velidakis, E.; Mountakis, N.; Tzounis, L.; Liebscher, M.; Grammatikos, S. Enhanced Mechanical, Thermal and Antimicrobial Properties of Additively Manufactured Polylactic Acid with Optimized Nano Silica Content. Nanomaterials 2021, 11, 1012. [Google Scholar] [CrossRef]
- Gamboa, G.; Mazumder, S.; Hnatchuk, N.; Catalan, J.A.; Cortes, D.; Chen, I.; Perez, P.; Brostow, W.; Kaul, A.B. 3D-printed and injection molded polymer matrix composites with 2D layered materials. J. Vac. Sci. Technol. A 2020, 38, 042201. [Google Scholar] [CrossRef]
- Zaaba, N.F.; Ismail, H. The effect of filler loading on tensile and morphological properties of polylactic acid (PLA)/ thermoplastic corn starch (TPCS)/ peanut shell powder (PSP) biocomposites. AIP Conf. Proc. 2019, 2068, 20073. [Google Scholar] [CrossRef]
- Oleksy, M.; Szwarc-Rzepka, K.; Heneczkowski, M.; Oliwa, R.; Jesionowski, T. Epoxy Resin Composite Based on Functional Hybrid Fillers. Materials 2014, 7, 6064–6091. [Google Scholar] [CrossRef] [Green Version]
- Oleksy, M.; Oliwa, R.; Zawila, B.; Budzik, G. Polyurethane compositions for rapid prototyping containing bentonites modified with silsesquioxanes. Polimery 2012, 57, 463–469. [Google Scholar] [CrossRef]
- Ahmed, M.; Elshafie, M.; Kandil, U.; Taha, M.R. Improving the Mechanical Properties of Thermoplastic Polyolefins Using Recycled Low-Density Polyethylene and Multi-Walled Carbon Nanotubes. Egypt. J. Chem. 2021, 64, 2517–2523. [Google Scholar] [CrossRef]
- Da Silva, G.E.H.; Granada, J.E.; De Melo, C.C.N.; Marini, J.; De Oliveira, A.D. Effect of Adding Modified Clays on the Mechanical Behavior of PC/ABS Polymer Blend. Macromol. Symp. 2020, 394, 2000145. [Google Scholar] [CrossRef]
- Manap, A.; Mahalingam, S.; Vaithylingam, R.; Abdullah, H. Mechanical, thermal and morphological properties of thermoplastic polyurethane composite reinforced by multi-walled carbon nanotube and titanium dioxide hybrid fillers. Polym. Bull. 2020. [Google Scholar] [CrossRef]
- Nouh, S.A.; Elfadl, A.A.; Alhazime, A.A.; Al-Harbi, A.M. Effect of proton irradiation on the physical properties of PC/PBT blends. Radiat. Eff. Defects Solids 2018, 173, 629–642. [Google Scholar] [CrossRef]
- Hellati, A.; Douibi, A.; Boufassa, S.; Benavente, R.; Benachour, D.; Calleja, F.B. The role of the compatibilizer on the microindentation hardness of iPP/PC blends. Polym. Eng. Sci. 2016, 56, 1138–1145. [Google Scholar] [CrossRef]
- De Melo, R.P.; Aguiar, V.D.O.; Marques, M.D.F.V. Silane Crosslinked Polyethylene from Different Commercial PE’s: Influence of Comonomer, Catalyst Type and Evaluation of HLPB as Crosslinking Coagent. Mater. Res. 2015, 18, 313–319. [Google Scholar] [CrossRef] [Green Version]
- Yang, Y.; Sheng, L.; Zhang, H.; Li, M.; Xu, R.; Bai, Y.; Song, S.; Liu, G.; Wang, T.; Huang, X.; et al. Investigation on the solid–liquid (S–L) phase separation of the PE/LP blend with different molecular weight polyethylene. Polym. Bull. 2021. [Google Scholar] [CrossRef]
- Amoroso, L.; Heeley, E.; Ramadas, S.N.; McNally, T. Crystallisation behaviour of composites of HDPE and MWCNTs: The effect of nanotube dispersion, orientation and polymer deformation. Polymer 2020, 201, 122587. [Google Scholar] [CrossRef]
- Wang, C.; Wang, H.; Gu, G.-H.; Lin, Q.-Q.; Zhang, L.-L.; Huang, L.-L.; Zhao, J.-Y. Ammonia modification for flotation separation of polycarbonate and polystyrene waste plastics. Waste Manag. 2016, 51, 13–18. [Google Scholar] [CrossRef] [PubMed]
- Taurozzi, J.S.; Tarabara, V.V. Silver Nanoparticle Arrays on Track Etch Membrane Support as Flow-Through Optical Sensors for Water Quality Control. Environ. Eng. Sci. 2007, 24, 122–137. [Google Scholar] [CrossRef] [Green Version]
- Gumede, T.P.; Luyt, A.S.; Camargo, R.A.P.; Tercjak, A.; Müller, A.J. Morphology, Nucleation, and Isothermal Crystallization Kinetics of Poly(Butylene Succinate) Mixed with a Polycarbonate/MWCNT Masterbatch. Polymers 2018, 10, 424. [Google Scholar] [CrossRef] [Green Version]
- Sackey, J.; Fell, A.; Ngilirabanga, J.; Razanamahandry, L.; Ntwampe, S.; Nkosi, M. Antibacterial effect of silver nanoparticles synthesised on a polycarbonate membrane. Mater. Today Proc. 2021, 36, 336–342. [Google Scholar] [CrossRef]
- Sackey, J.; Nuru, Z.Y.; Sone, B.; Maaza, M. Structural and optical investigation on the wings of Idea malabarica (Moore, 1877). IET Nanobiotechnology 2017, 11, 71–76. [Google Scholar] [CrossRef] [PubMed]
- Wang, H.; Wang, J.; Zou, Q.; Liu, W.; Wang, C.; Huang, W. Surface treatment using potassium ferrate for separation of polycarbonate and polystyrene waste plastics by froth flotation. Appl. Surf. Sci. 2018, 448, 219–229. [Google Scholar] [CrossRef]
- Lora, J.H.; Glasser, W.G. Recent Industrial Applications of Lignin: A Sustainable Alternative to Nonrenewable Materials. J. Polym. Environ. 2002, 10, 39–48. [Google Scholar] [CrossRef]


| Composition | PC Content (wt.%) | Silica Content (wt.%) | Lignin/SiO2 Content (wt.%) | Bentonite Content (wt.%) | Fusabond Content (wt.%) | Multiwalled Carbon Nanotubes Content (wt.%) |
|---|---|---|---|---|---|---|
| PC | 100 | - | - | - | - | - |
| PC/3%S | 96 | 3 | - | - | 1 | - |
| PC/3%B | 96 | - | - | 3 | 1 | - |
| PC/3%L | 96 | - | 3 | - | 1 | - |
| PC/1.5%L/1.5%B | 96 | - | 1.5 | 1.5 | 1 | - |
| PC/0.5%CN | 98.5 | - | - | - | 1 | 0.5 |
| PC/0.5%CN/1.5%S | 97 | 1.5 | - | - | 1 | 0.5 |
| PC/0.5%CN/1.5%B | 97 | - | - | 1.5 | 1 | 0.5 |
| PC/0.5%CN/1.5%L | 97 | - | 1.5 | - | 1 | 0.5 |
| Nozzle diameter | 0.4 mm |
| Nozzle material | Brass/TwinClad XT |
| Layer height | 0.2 mm |
| Infill percentage | 100% |
| Infill pattern | Rectilinear ± 45 |
| Extrusion temperature | 270 °C |
| Bed temperature | 80 °C |
| Bed surface | Up Flex |
| Printing speeds | 70 mm/s |
| Paddles | Bars | |
|---|---|---|
| Mold temperature, °C | 90 | 90 |
| Injection temperature, °C | 280 | 280 |
| Injection pressure, bar | 650 | 950 |
| Post pressure, bar | 600 | 900 |
| Plasticizing time, s | 180 | 180 |
| Injection time, s | 5 | 5 |
| Post time, s | 3 | 3 |
| Samples | Porosity (%) | Ra (µm) | Dimensional Stability (60.00 mm × 10.00 mm × 1.0 mm) |
|---|---|---|---|
| PC | 0.10 | 1.66 ± 0.08 | 60.09 ± 0.13 × 10.09 ± 0.12 × 0.92 ± 0.81 |
| PC/3%S | 0.14 | 8.02 ± 0.70 | 60.05 ± 0.01 × 10.08 ± 0.01 × 0.95 ± 0.01 |
| PC/3%B | 0.05 | 7.52 ± 0.04 | 60.12 ± 0.01 × 10.08 ± 0.01 × 0.88 ± 0.06 |
| PC/3%L | 0.24 | 7.99 ± 1.30 | 60.14 ± 0.06 × 10.06 ± 0.01 × 0.95 ± 0.01 |
| PC/1.5%L/1.5%B | 0.07 | 1.29 ± 0.08 | 60.06 ± 0.13 × 10.06 ± 0.11 × 0.96 ± 0.01 |
| PC/0.5%CN | 0.17 | 1.51 ± 0.04 | 60.04 ± 0.01 × 10.09 ± 0.01 × 0.87 ± 0.01 |
| PC/0.5%CN/1.5%S | 0.13 | 15.65 ± 1.68 | 60.08 ± 0.01 × 10.08 ± 0.04 × 0.81 ± 0.01 |
| PC/0.5%CN/1.5%B | 0.03 | 9.12 ± 1.06 | 60.05 ± 0.07 × 10.09 ± 0.01 × 0.86 ± 0.02 |
| PC/0.5%CN/1.5%L | 0.13 | 18.65 ± 0.85 | 60.10 ± 0.02 × 10.09 ± 0.03 × 0.82 ± 0.04 |
| Parameter | T5%, °C | Tmax1, °C | Δm1, % | R600, % | |
|---|---|---|---|---|---|
| Filament | |||||
| PC | 410.00 | 453.17 | 40.32 | 21.83 | |
| PC/3%S | 453.17 | 485.83 | 43.11 | 22.20 | |
| PC/3%B | 422.83 | 487.00 | 48.26 | 21.86 | |
| PC/3%L | 445.00 | 476.50 | 43.91 | 20.88 | |
| PC/1.5%L/1.5%B | 438.00 | 478.83 | 43.95 | 21.43 | |
| PC/0.5%CN | 403.00 | 442.67 | 37.94 | 17.05 | |
| PC/0.5%CN/1.5%S | 442.67 | 477.67 | 44.95 | 20.51 | |
| PC/0.5%CN/1.5%B | 407.67 | 456.67 | 42.32 | 17.19 | |
| PC/0.5%CN/1.5%L | 440.33 | 469.50 | 41.39 | 22.21 | |
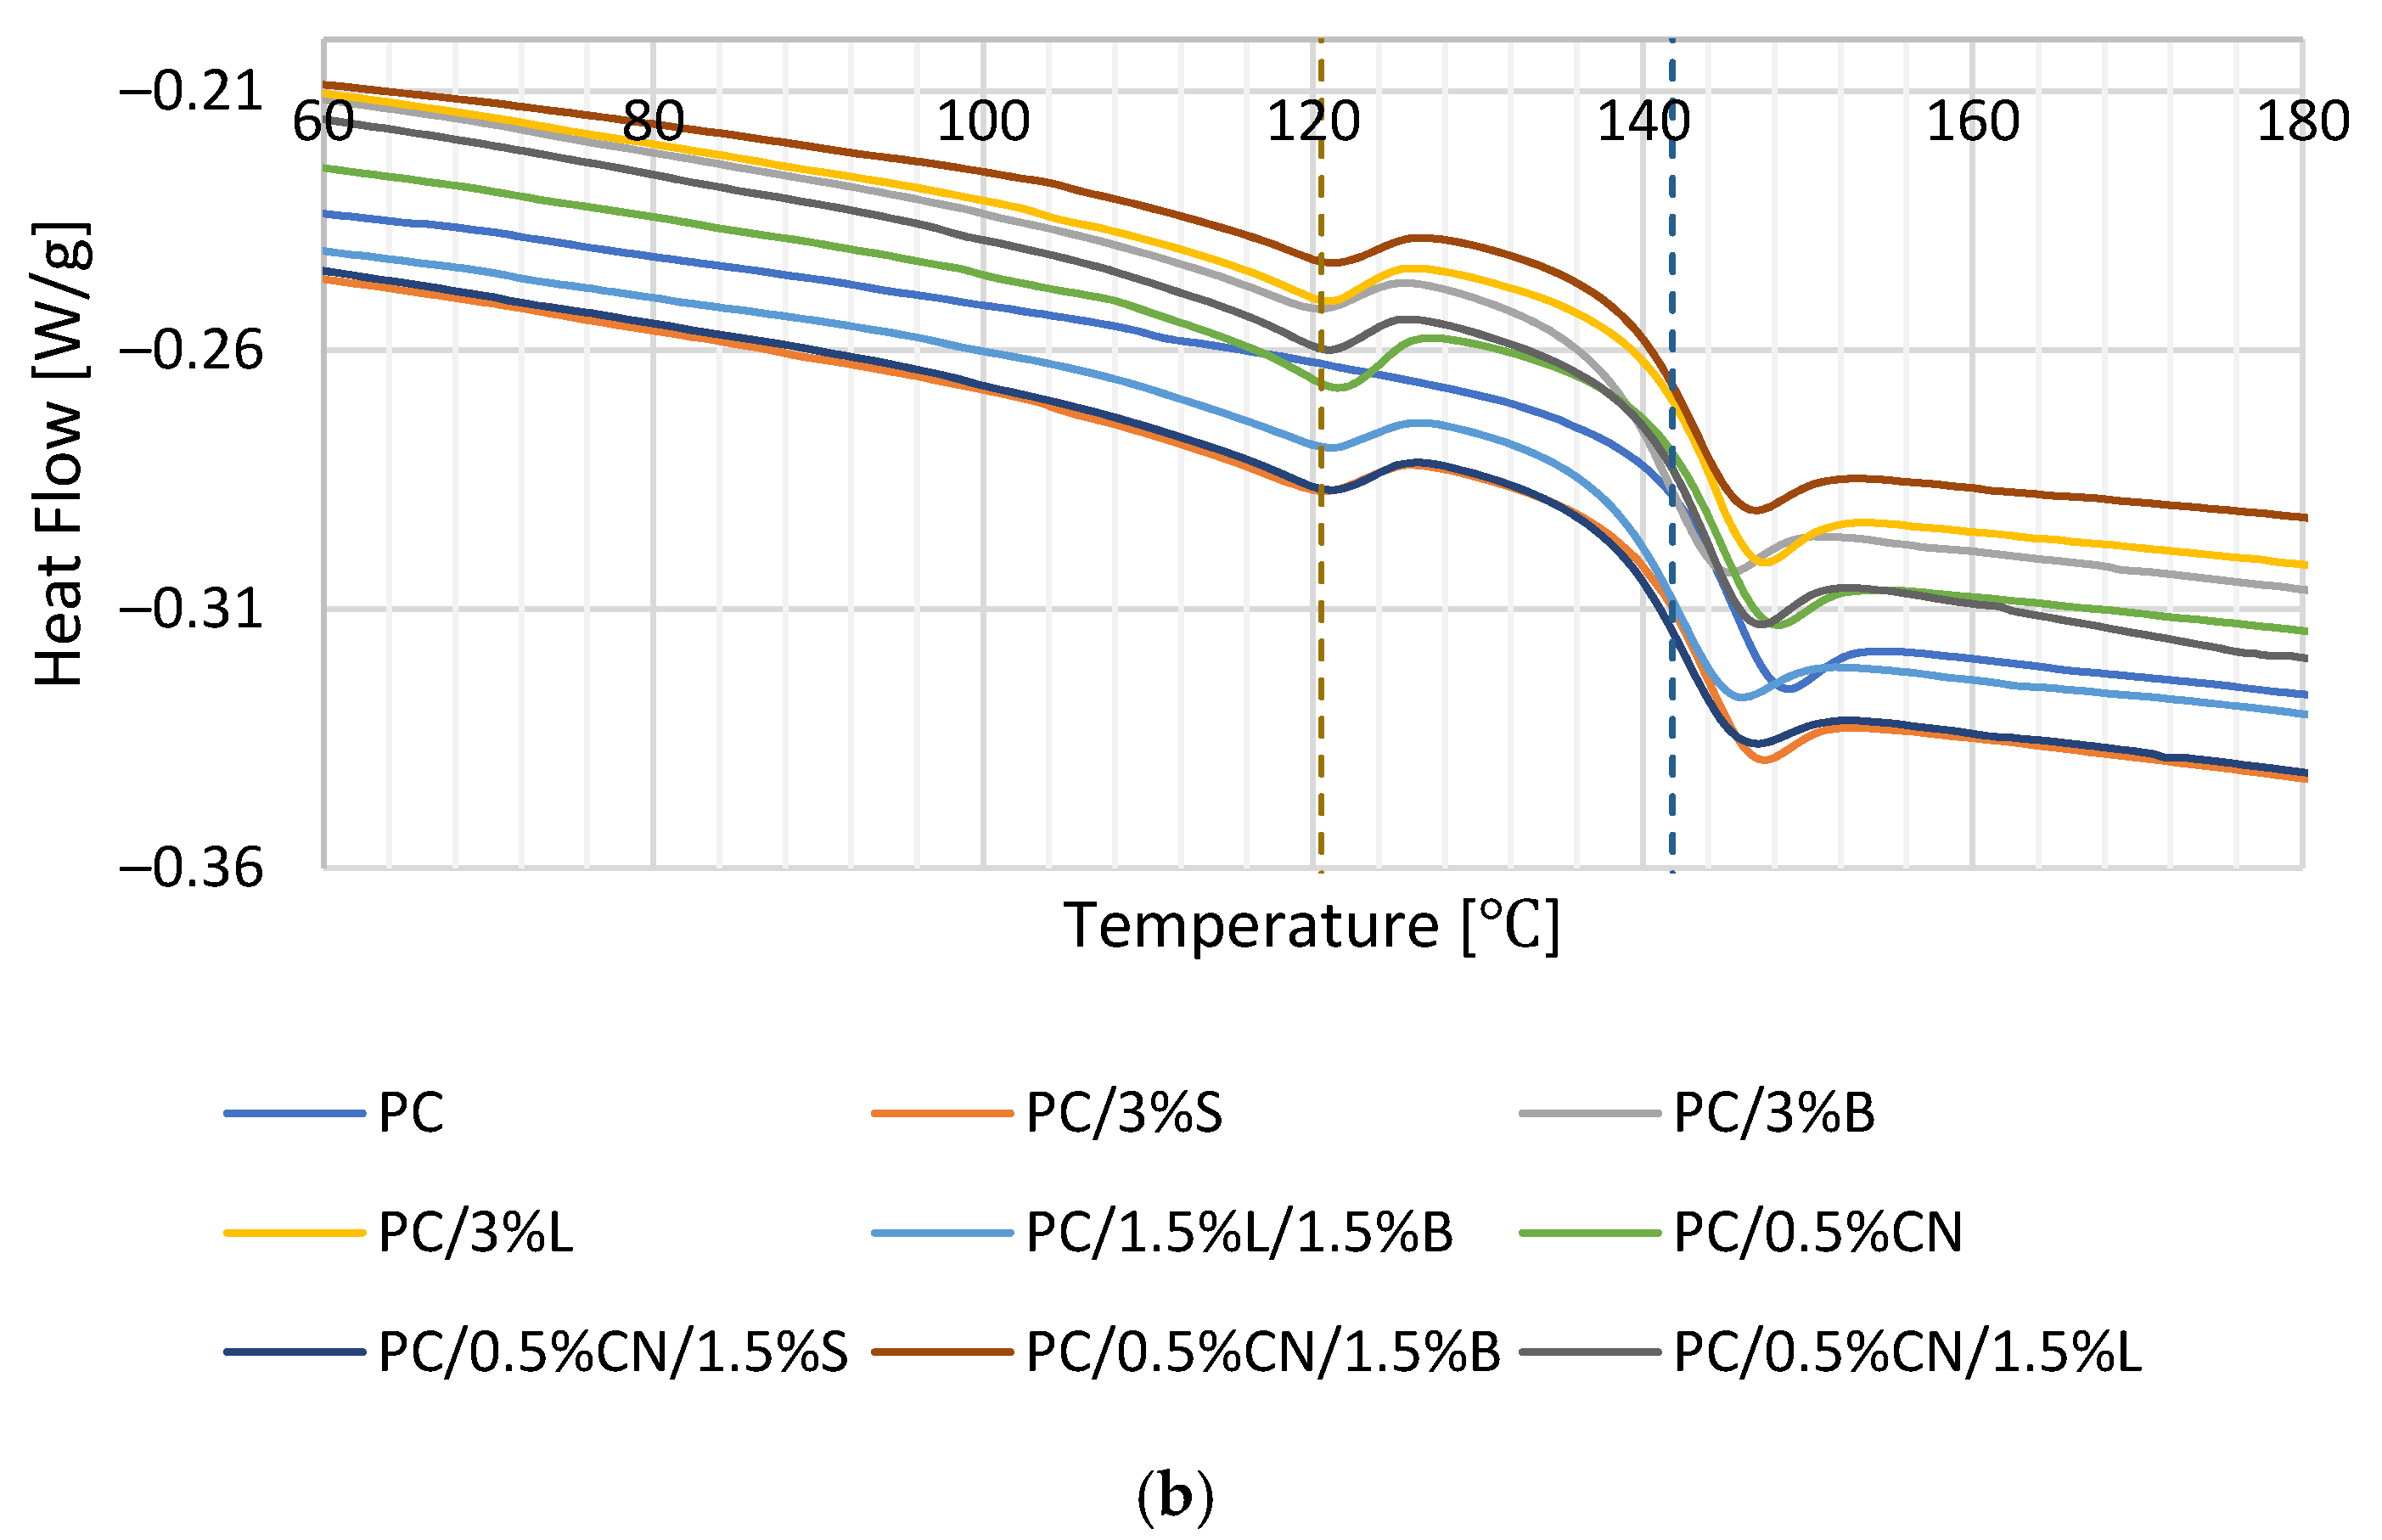
| Composition | Tg (°C) (First Heating) | Delta Cp (J/g·K) | Tg (°C) (Second Heating) | Delta Cp (J/g·K) |
|---|---|---|---|---|
| PC | 143.40 | 0.17 | 143.25 | 0.24 |
| PC/3%S | 142.03 | 0.19 | 142.70 | 0.25 |
| PC/3%B | 141.03 | 0.26 | 140.47 | 0.22 |
| PC/3%L | 142.77 | 0.25 | 142.38 | 0.22 |
| PC/1.5%L/1.5%B | 142.58 | 0.13 | 141.25 | 0.19 |
| PC/0.5%CN | 142.20 | 0.17 | 143.48 | 0.22 |
| PC/0.5%CN/1.5%S | 140.92 | 0.24 | 140.99 | 0.21 |
| PC/0.5%CN/1.5%B | 141.40 | 0.21 | 141.42 | 0.10 |
| PC/0.5%CN/1.5%L | 142.72 | 0.27 | 142.25 | 0.22 |
Publisher’s Note: MDPI stays neutral with regard to jurisdictional claims in published maps and institutional affiliations. |
© 2021 by the authors. Licensee MDPI, Basel, Switzerland. This article is an open access article distributed under the terms and conditions of the Creative Commons Attribution (CC BY) license (https://creativecommons.org/licenses/by/4.0/).
Share and Cite
Bulanda, K.; Oleksy, M.; Oliwa, R.; Budzik, G.; Przeszłowski, Ł.; Fal, J.; Jesionowski, T. Polymer Composites Based on Polycarbonate (PC) Applied to Additive Manufacturing Using Melted and Extruded Manufacturing (MEM) Technology. Polymers 2021, 13, 2455. https://doi.org/10.3390/polym13152455
Bulanda K, Oleksy M, Oliwa R, Budzik G, Przeszłowski Ł, Fal J, Jesionowski T. Polymer Composites Based on Polycarbonate (PC) Applied to Additive Manufacturing Using Melted and Extruded Manufacturing (MEM) Technology. Polymers. 2021; 13(15):2455. https://doi.org/10.3390/polym13152455
Chicago/Turabian StyleBulanda, Katarzyna, Mariusz Oleksy, Rafał Oliwa, Grzegorz Budzik, Łukasz Przeszłowski, Jacek Fal, and Teofil Jesionowski. 2021. "Polymer Composites Based on Polycarbonate (PC) Applied to Additive Manufacturing Using Melted and Extruded Manufacturing (MEM) Technology" Polymers 13, no. 15: 2455. https://doi.org/10.3390/polym13152455
APA StyleBulanda, K., Oleksy, M., Oliwa, R., Budzik, G., Przeszłowski, Ł., Fal, J., & Jesionowski, T. (2021). Polymer Composites Based on Polycarbonate (PC) Applied to Additive Manufacturing Using Melted and Extruded Manufacturing (MEM) Technology. Polymers, 13(15), 2455. https://doi.org/10.3390/polym13152455