Article

Cocrystals of 2-Aminopyrimidine with Boric Acid—Crystal Engineering of a Novel Nonlinear Optically (NLO) Active Crystal

1
Department of Inorganic Chemistry, Faculty of Science, Charles University, Hlavova 8, 128 43 Prague 2, Czech Republic
2
Section Crystallography, Institute of Geology and Mineralogy, University of Cologne, Zülpicher Str. 49b, 50674 Köln, Germany
3
Department of Chemical Physics and Optics, Faculty of Mathematics and Physics, Charles University, Ke Karlovu 3, 121 16 Prague 2, Czech Republic
*
Author to whom correspondence should be addressed.
Crystals 2019, 9(8), 403; https://doi.org/10.3390/cryst9080403
Submission received: 16 July 2019 / Revised: 29 July 2019 / Accepted: 31 July 2019 / Published: 3 August 2019
(This article belongs to the Special Issue Novel Hydrogen-bonded Materials with Significant Physical Properties)

Abstract

:
Crystal engineering of novel materials for nonlinear optics (NLO) based on 2-aminopyrimidine yielded two molecular cocrystals with boric acid—trigonal (P3221 space group) 2-aminopyrimidine—boric acid (3/2) and monoclinic (C2/c space group) 2-aminopyrimidine—boric acid (1/2). In addition to crystal structure determination by single crystal X-ray diffraction, the cocrystals were characterized by powder X-ray diffraction and vibrational spectroscopy (FTIR and FT Raman). Large single crystals of the non-centrosymmetric cocrystal 2-aminopyrimidine—boric acid (3/2) were grown to study the optical properties and determine the second harmonic generation (SHG) efficiency (using 800 nm fundamental laser line) of powder samples.

Graphical Abstract

1. Introduction

One of the most promising directions in current research trends focused on nonlinear optical (NLO) materials is crystal engineering of novel materials based on organic molecules. Organic molecules in general, but especially their salts and cocrystals, exhibit a favorable combination of sufficient hyperpolarizability and optical transparency with adequate thermal stability and outstanding resistance to optical damage.
Within a very diverse family of studied organic molecules, 2-aminopyrimidine and its monocation represent simple heteroaromatic systems with highly delocalized π-electrons, which can act as promising carriers of NLO properties. In this context, we have previously demonstrated that the χ(2) NLO properties of these moieties are closely related to their protonation—the neutral 2-aminopyrimidine molecule has a 1.6 times higher total hyperpolarizability (βtot) than its protonated monocation [1]. Considering these properties, crystal engineering has two main objectives—to incorporate the 2-aminopyrimidine moiety into molecular crystals with proper symmetry and to preserve it preferably as a neutral molecule. Moreover, several organic molecular crystals and “semi-organic” materials are promising as stimulated Raman scattering (SRS)-active materials, which could also exhibit various χ(2) and χ(3) NLO effects including third harmonic generation and cascaded self-frequency doubling and tripling [2,3].
In addition to inorganic borates, which are undoubtedly one of the most successful groups of NLO materials [4], boric acid itself has a considerable potential in crystal engineering of organic/inorganic hybrid compounds. The presence of this weak inorganic acid in molecular form has been reported in several cocrystals (adducts) (see e.g., [5,6,7,8,9,10]) and coordination compounds (see e.g., [9,10,11]), which were mainly studied with respect to their linear and nonlinear optical [9,10,11] or ferroelastic properties [5,6]. Moreover, several crystalline materials derived from boric acid esters formed by reactions with hydroxy carboxylic acids have also been prepared and characterized (including their basic NLO properties) (see e.g., [12,13,14]).
In this paper, we report the preparation, crystal structure determination, and spectroscopic and optical properties of two molecular cocrystals of 2-aminopyrimidine with boric acid, i.e., trigonal 2-aminopyrimidine—boric acid (3/2), (2-AMP)3(H3BO3)2, and monoclinic 2-aminopyrimidine—boric acid (1/2), 2-AMP(H3BO3)2. These hydrogen-bonded materials were isolated within a crystal engineering study employing promising inorganic and organic molecular carriers of NLO properties.

2. Experimental Setup

2.1. Materials and Methods

All chemicals were purchased from Fluka (2-aminopyrimidine, 97%, Seelze, Germany) and Lachema (boric acid, p.a., Brno, Czech Republic) companies.
Infrared spectra of powder samples were recorded by nujol and fluorolube mull transmission techniques on a Thermo Scientific Nicolet 6700 FTIR spectrometer (Madison, WI, USA) in the 400–4000 cm−1 region (2 cm−1 resolution, KBr beamsplitter, Happ–Genzel apodization). Raman spectra of powder samples were recorded on a Nicolet 6700 FTIR spectrometer (equipped with a Thermo Scientific Nicolet Nexus (Madison, WI, USA) FT Raman module (2 cm−1 resolution, Happ–Genzel apodization, 1064 nm Nd:YVO4 laser excitation, 250 mW power at the sample) in the 100–3700 cm−1 region. Raman spectra of microcrystalline samples were also collected on a dispersive confocal Raman microscope MonoVista CRS+ (Spectroscopy & Imaging GmbH, Germany) interfaced to an Olympus microscope (objectives 20× and 50×) using a 785 nm diode excitation laser (10 mW laser power, 40–3800 cm−1 spectral range, 300 lines/mm grating). The spectrometer was wavelength- and intensity-calibrated using a software-controlled autoalignment and calibration procedure with mercury and Ne–Ar lamps.
Second harmonic generation (SHG) measurements of (2-AMP)3(H3BO3)2 were performed using the modified Kurtz–Perry powder method [15]. The samples were irradiated with 160 fs laser pulses generated at an 82 MHz repetition rate by a Ti:sapphire laser (MaiTai, Spectra Physics, Santa Clara, CA, USA) at 800 nm. For quantitative determination of SHG efficiency, the intensity of the back-scattered laser light generated in the sample at 400 nm was measured on a grating spectrograph with a diode array (InstaSpect II, Oriel Newport Corporation Irvine, CA, USA), and the signal was compared with that produced by a potassium dihydrogen phosphate (KDP) standard. The initial experiments were performed on a powdered sample (100–150 μm particle size) loaded into a 5 mm glass cell using a mechanical vibrator. The measurements were repeated on different areas of the same sample, and the results were averaged. This experimental procedure minimized signal fluctuations induced by sample packing. Lastly, the measurements were performed also with size-fractioned samples (particle size: 25–45, 45–63, 63–75, 75–100, 100–125, and 125–150 μm).
The UV–Vis spectra of the powder samples were recorded using an Agilent Technologies Cary Series 4000 UV–Vis spectrometer (Santa Clara, CA, USA) equipped with internal DRA-900 accessory (diffuse reflectance with integrating sphere) in the 175–850 nm spectral region with a 0.5 nm spectral resolution.
Powder X-ray diffraction patterns were collected at room temperature using a Philips/PANalytical X’pert PRO MPD diffractometer (Royston, UK) (Bragg–Brentano geometry, ultrafast X’Celerator detector and Cu Kα radiation, λ = 1.5418 Å). The data were analyzed using the FullProf software [16]. Theoretical diffraction patterns for confirmation of phase purity were calculated from single-crystal X-ray diffraction data using the PLATON program [17].

2.2. Syntheses

(2-AMP)3(H3BO3)2 cocrystals were prepared by slow evaporation at room temperature of the aqueous solution of 2-aminopyrimidine and boric acid mixed in a 1:1 molar ratio. The resulting colorless crystals were filtered off and dried in air. The second studied compound, 2-AMP(H3BO3)2, was similarly prepared from an aqueous solution containing an excess of boric acid (1:2 molar ratio). Unfortunately, the crystalline product always contained some amount of pure boric acid, thus requiring washing it with ethanol. After drying in air, the product was mechanically separated (based on differences in crystal morphology) from the remaining traces of boric acid. The purity of the final products was confirmed by Raman microspectroscopy and powder X-ray diffraction (see Figures S1 and S2, Tables S1 and S2, Supplementary Materials). The solubility of 2-(AMP)3(H3BO3)2 crystals in water is highly temperature-dependent and increased from 123.6 g/L (293 K), 130.8 g/L (303 K), and 157.6 g/L (313 K) to 214.0 g/L (318 K).

2.3. Crystal Structure Determination

X-ray structural data were collected on a Kappa CCD (Bruker Nonius, Billerica, MA, USA) diffractometer equipped with an Apex II CCD detector (Bruker, Billerica, MA, USA) and with a Cryostream Cooler (Oxford Cryosystems, Oxford, UK) using graphite-monochromated Mo Kα radiation (λ = 0.71073 Å) and were corrected for absorption by the methods incorporated in the software of the diffractometer (multiscan routine [18]). The phase problem was solved using direct methods (SHELXT [19]), and the structure was refined using the full-matrix least-squares routine based on F2 (SHELXL2017 [20]). Nonhydrogen atoms were refined with anisotropic displacement parameters. The hydrogen atoms attached to carbon atoms were included in their calculated positions and refined as riding atoms, while hydrogen atoms residing on nitrogen and oxygen atoms were identified on the difference electron density maps and refined similarly with Uiso(H) set to 1.2 Ueq (pivot atom). The basic crystallographic data, measurement, and refinement details are summarized in Table 1. The crystallographic data of (2-AMP)3(H3BO3)2 and 2-AMP(H3BO3)2 were deposited at the Cambridge Crystallographic Data Centre as supplementary publications CCDC 1586908 and CCDC 1586909, respectively. A copy of the data is available free of charge from CCDC, 12 Union Road, Cambridge CG21, EZ, UK (fax: +44 1223 336033; e-mail: [email protected]).

2.4. Crystal Growth

The congruent and high (see Section 2.2) solubility of (2-AMP)3(H3BO3)2 in H2O allows crystal growth from aqueous solution with stoichiometric ratio of the crystal constituents, (i.e., (2-AMP):H3BO3 at 3:2). Best results of crystal growth experiments were obtained using the method of controlled slow evaporation of the solvent at constant temperature of 311 K. During a growth period of 5 months, crystals of dimensions up to approximately 15 × 15 × 5 mm3 resulted. However, the crystal quality suffered greatly from the perfect cleavage of the crystals parallel to (001) and very easy plastic deformation. This softness of the crystals readily affected the quality of obtainable seed crystals, and crystal defects propagated during growth in the crystals, thus leading to cloudy regions and cleavage cracks inside the crystals (see Figure 1). The morphology of the crystals is dominated by the pinacoid {001} (leading to a platy habit) and prisms {100} and {110}, see Figure 1.

2.5. Quantum Chemical Computations

Quantum chemical computations (Gaussian 09W program package [21]) were performed using the closed-shell restricted density functional theory (B3LYP) method with a 6-311G+(d,p) basis set, applying tight convergence criteria and an ultrafine integration grid. Geometry optimization of the isolated 2-aminopyrimidine molecule was followed by vibrational frequency calculations using the same method and a basis set. Theoretical Raman intensities of computed normal modes were calculated (RAINT program [22]) for a 1064 nm excitation wavelength taking Raman scattering activities from Gaussian output. The assignment of computed normal vibrational modes of 2-aminopyrimidine molecule was based on visualization of atom motions in the GaussView program [23]. The comparison of recorded vibrational spectra of 2-aminopyrimidine with computed normal modes, which were scaled using dual scaling [24] and WLS (wavenumber-linear scale) [25] procedures, is presented in Table S3, Supplementary Materials.
Solid-state DFT studies of (2-AMP)3(H3BO3)2 were conducted using the CRYSTAL17 program (version 1.0.2.) [26]. Computations employed the B3LYP functional, applying the 8-411d11G basis set [27] for oxygen atoms, and the 6-31G(d) basis set for all other atoms. DFT integration utilized an extra-large integration grid default in the program. Both the Pack–Monkhorstand and Gilat nets for sampling the Brillouin zone consisted of 8 points. Derivatives required for IR and Raman spectra were computed using the coupled perturbed Kohn–Sham [28,29] analytical approach. Fractional coordinates of individual atoms were taken from the diffraction experiment and optimized using tightened convergence criteria before computing the spectral properties. The theoretical Raman spectrum was corrected for an experimental wavelength of 1064 nm and for a temperature of 293 K. All vibrational frequencies obtained by computations were scaled using an empirical factor of 0.96.

2.6. Optical Properties

For the trigonal crystals of (2-AMP)3(H3BO3)2, the two principal refractive indices, no with wave polarization in the plane perpendicular to the 3-fold axis and ne with wave polarization along the 3-fold axis (which is parallel to the optic axis of the optical indicatrix), were determined by the prism method with normal incidence on a prism with incidence face (hk0). Using a clear region of a grown crystal, a small prism with approximately 5 × 7 mm2 incidence face dimensions was prepared by cutting and careful lapping of the prism surface. However, the prism quality was affected by the high plastic deformability and unavoidable cleavage cracks of (2-AMP)3(H3BO3)2 crystals. Refractive indices were measured with a precision goniometer/spectrometer system (Möller–Wedel, for experimental details see, e.g., [30]) at nine discrete wavelengths in the range between 435.8 and 1083.0 nm for no (with wave polarization parallel to the cleavage planes of the crystal). Measurement of refractive indices ne (with wave polarization perpendicular to the cleavage planes) was only possible for the wavelengths 546.07 and 852.11 nm.

3. Results and Discussion

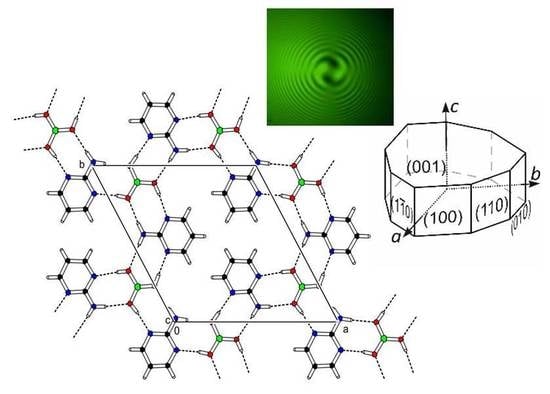
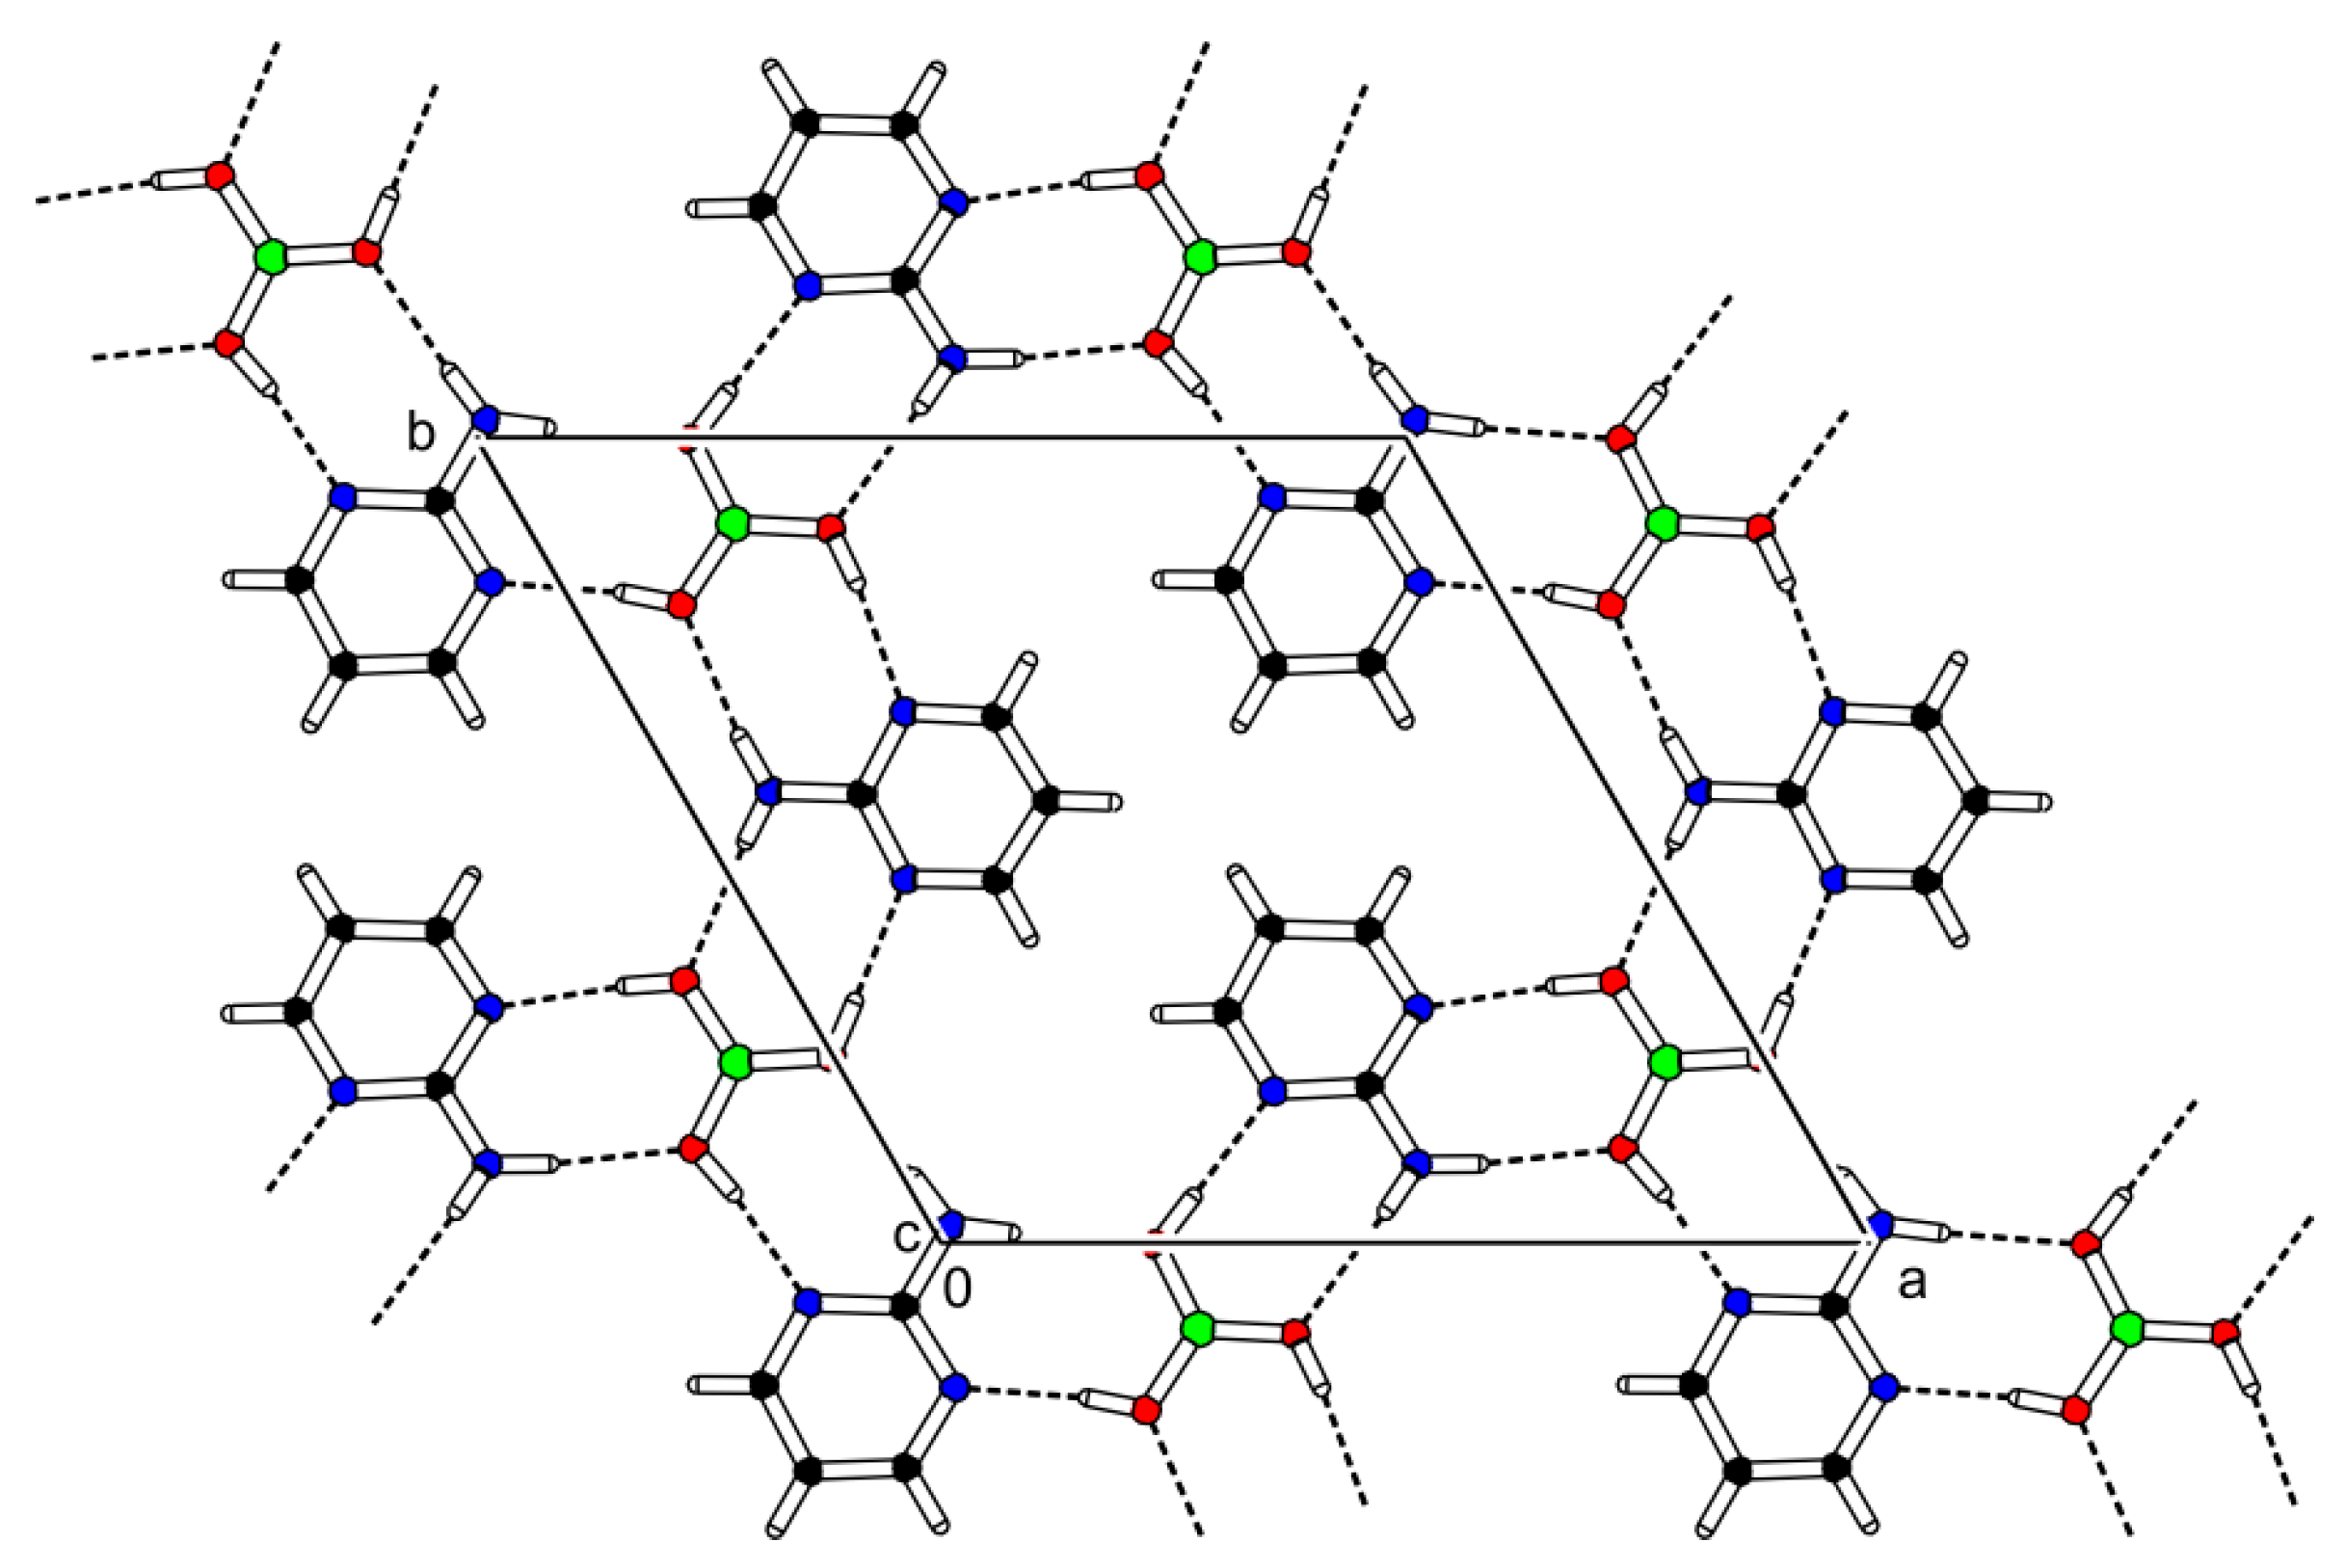
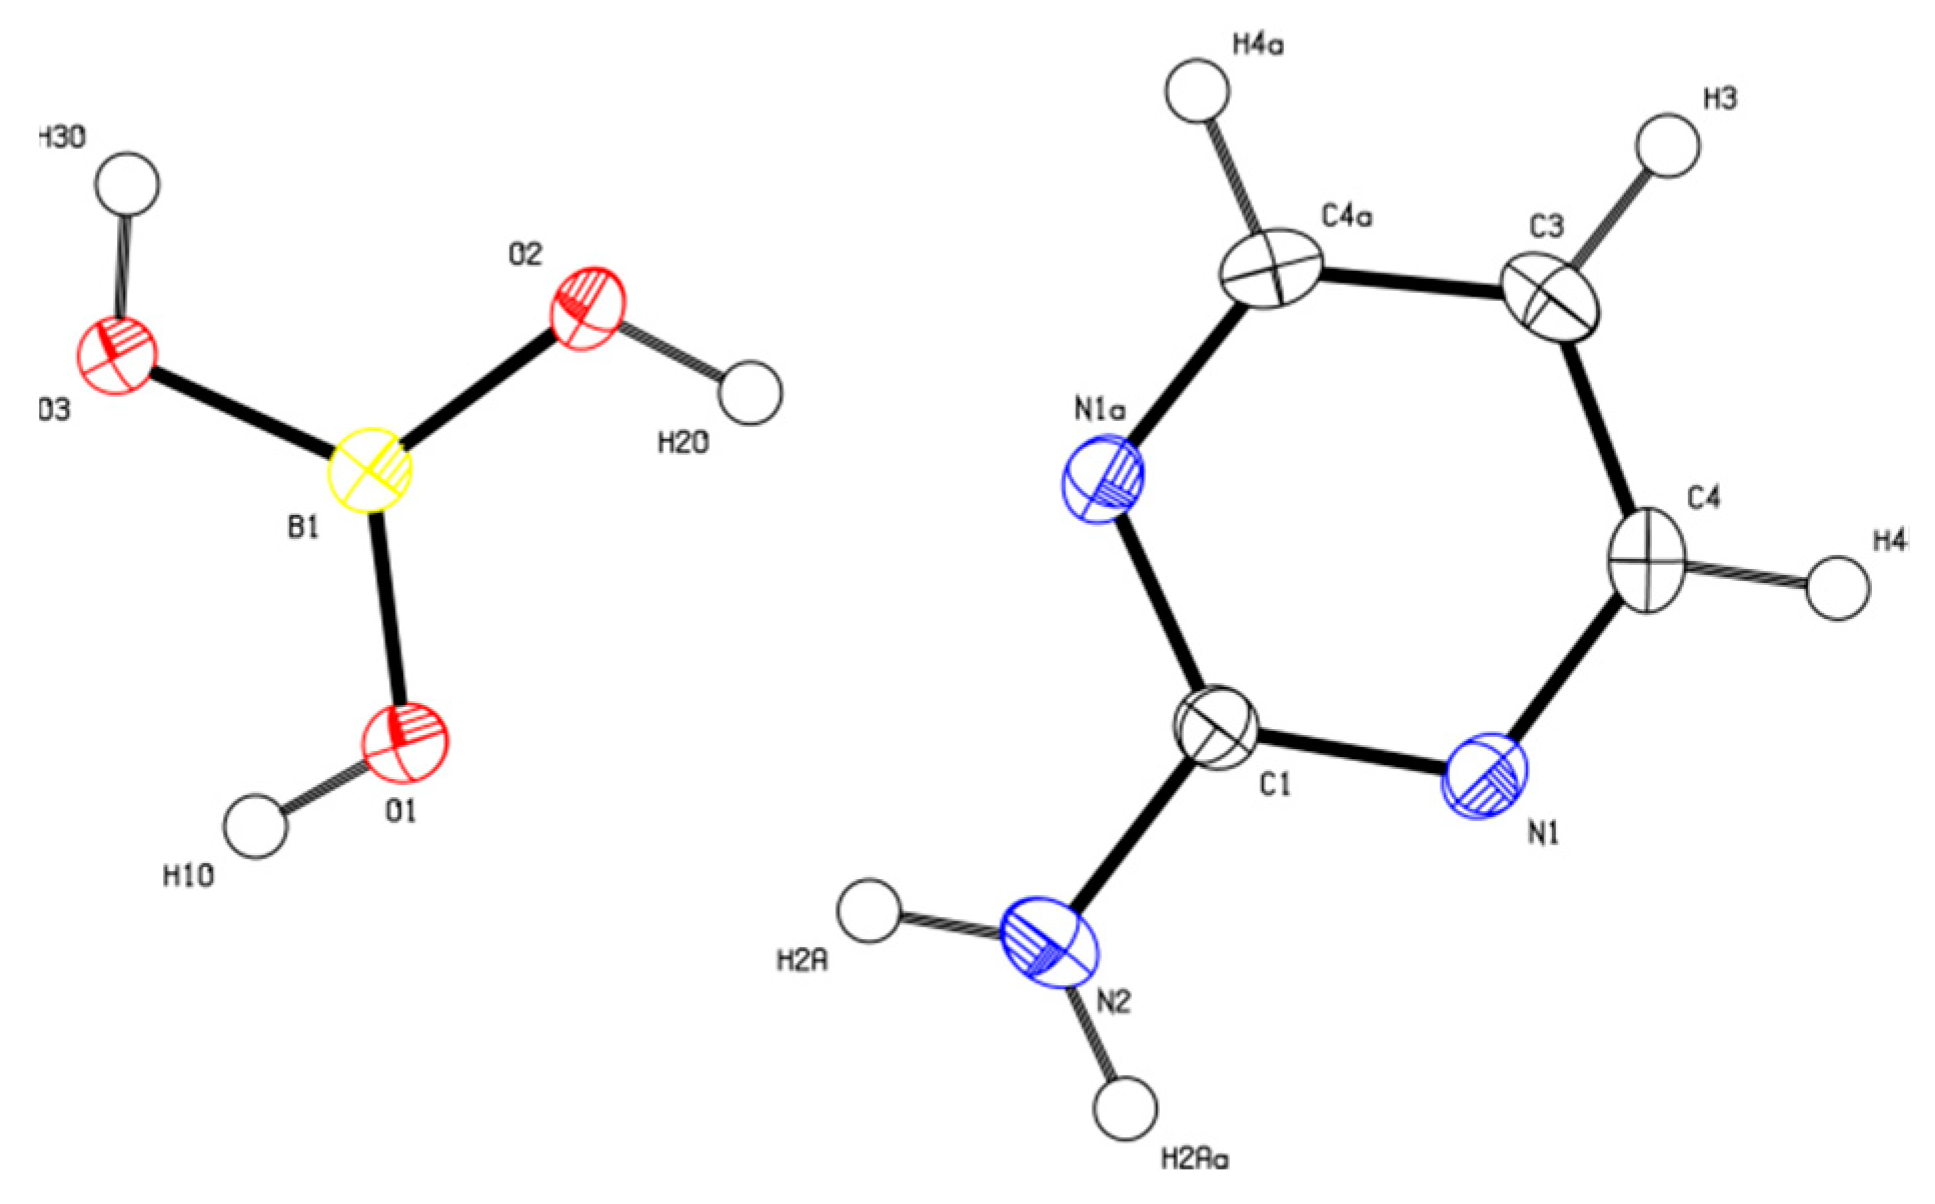
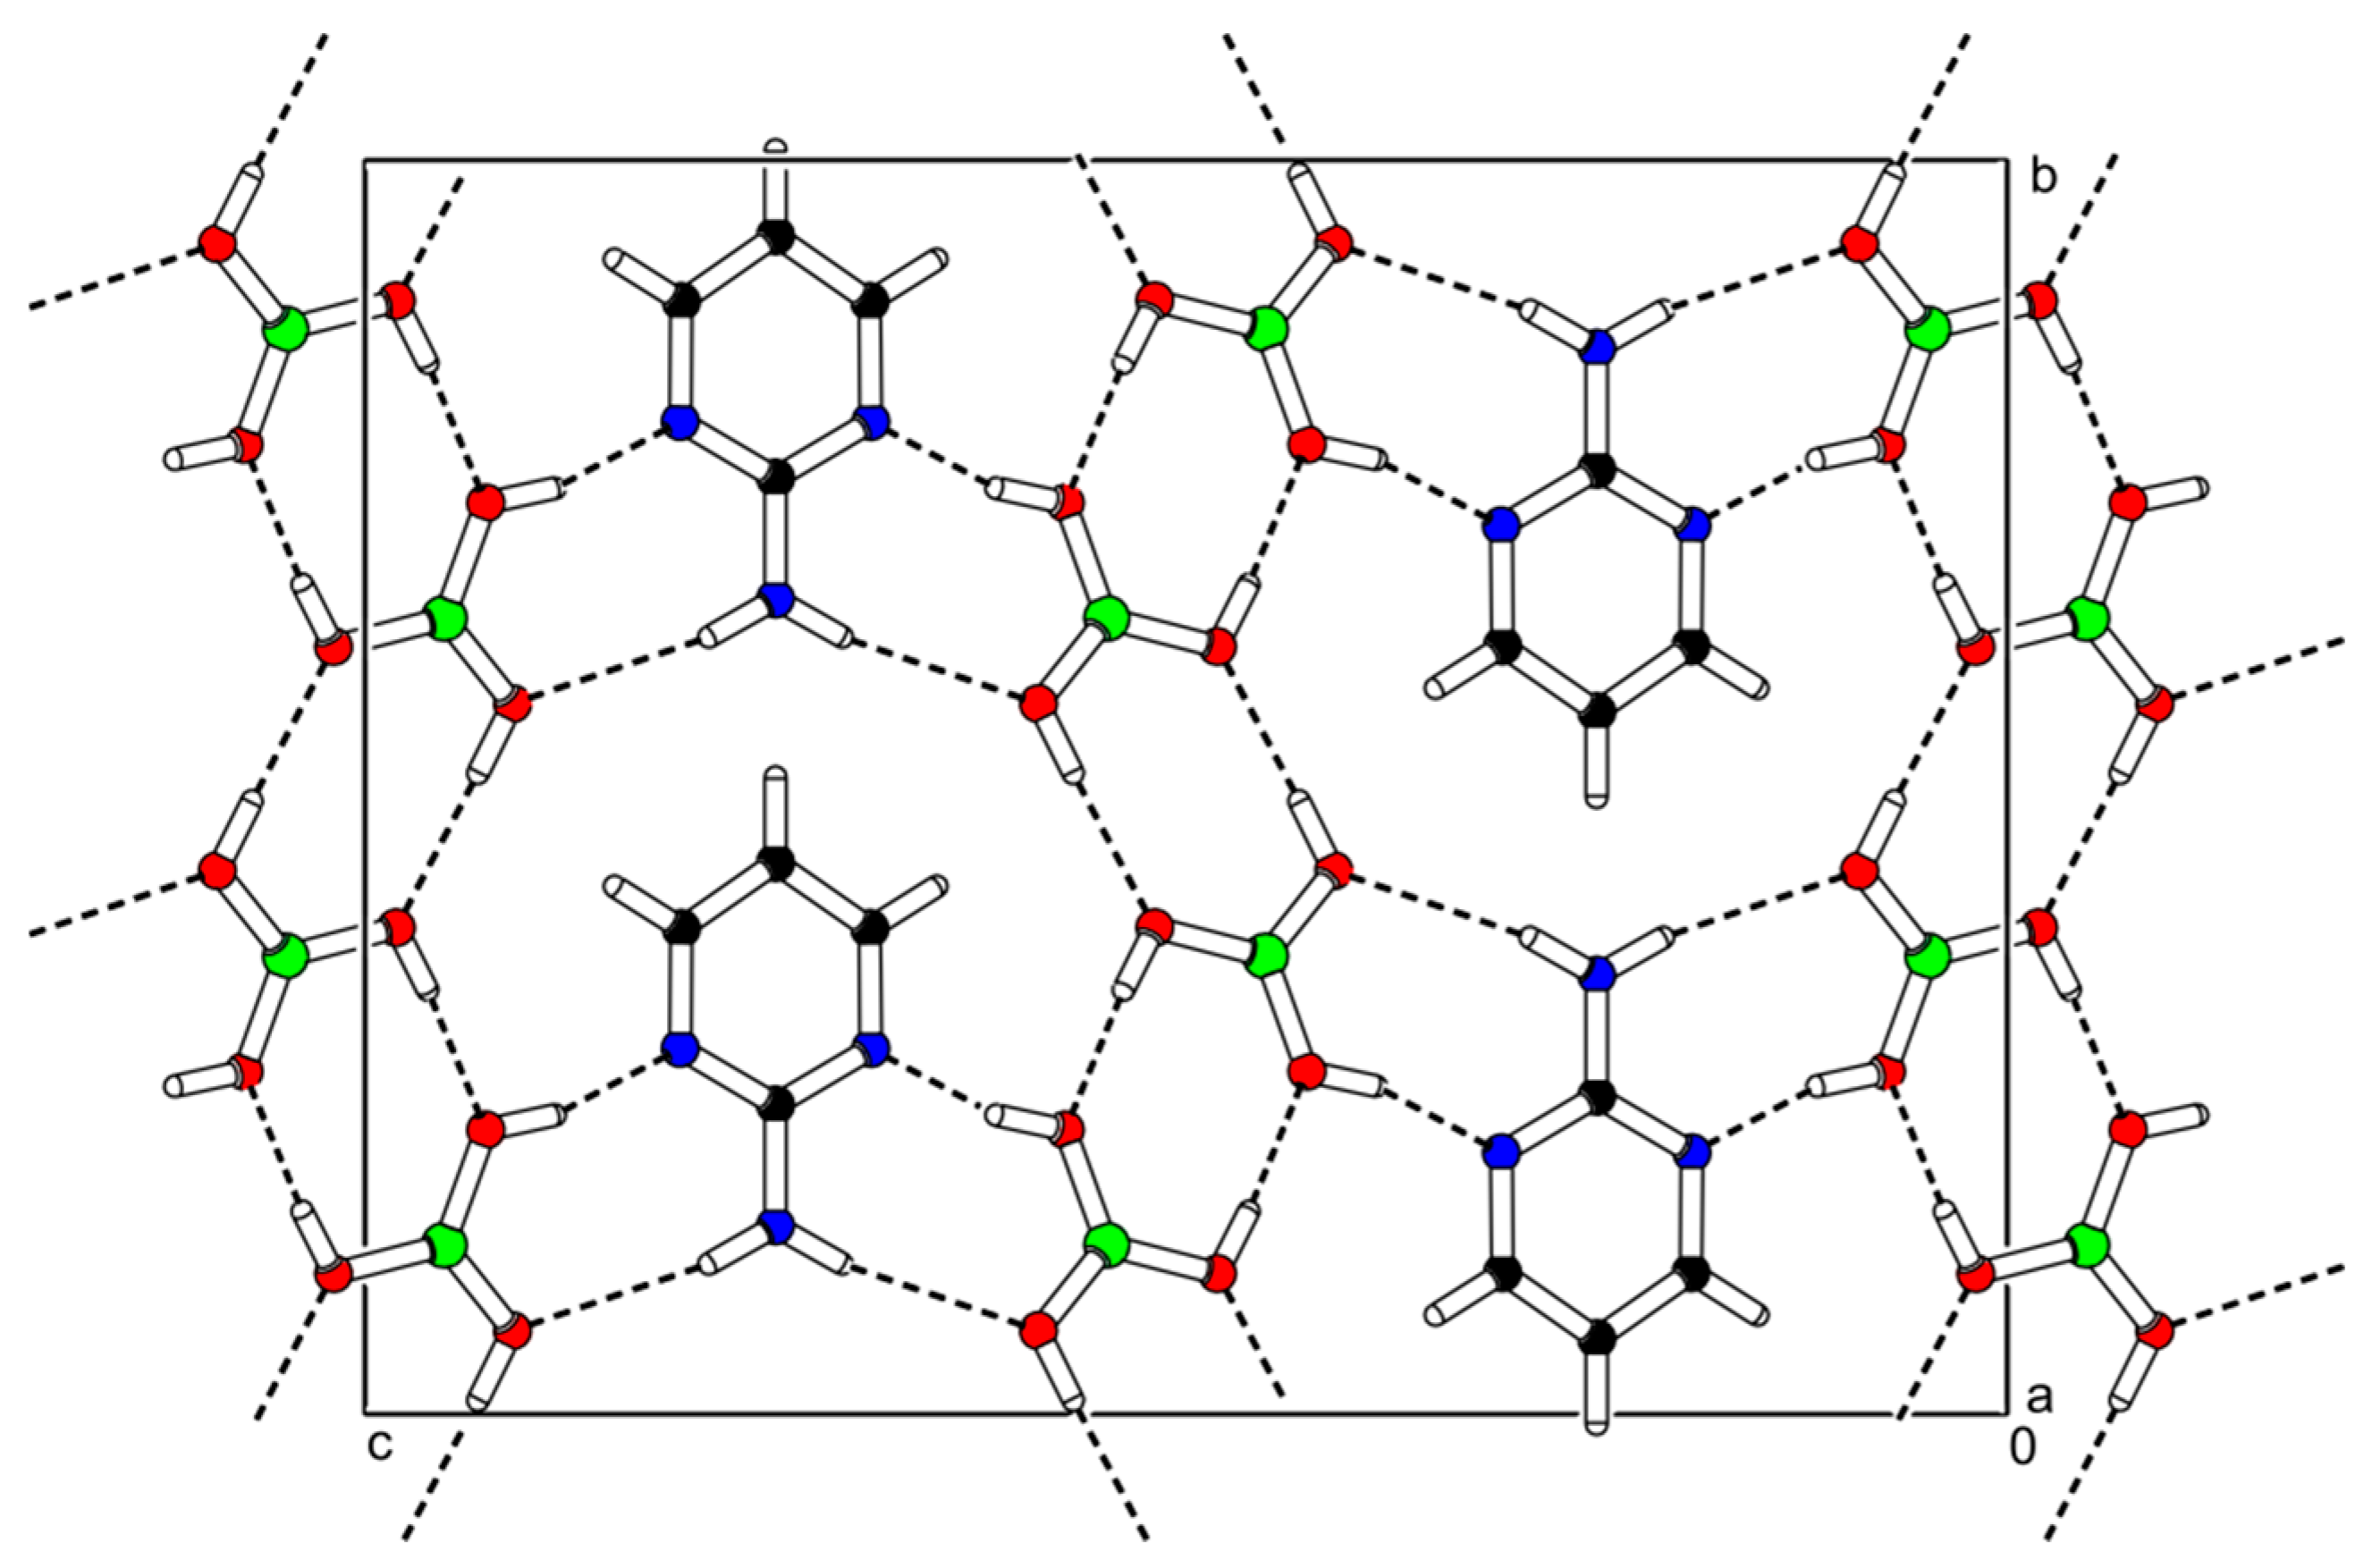
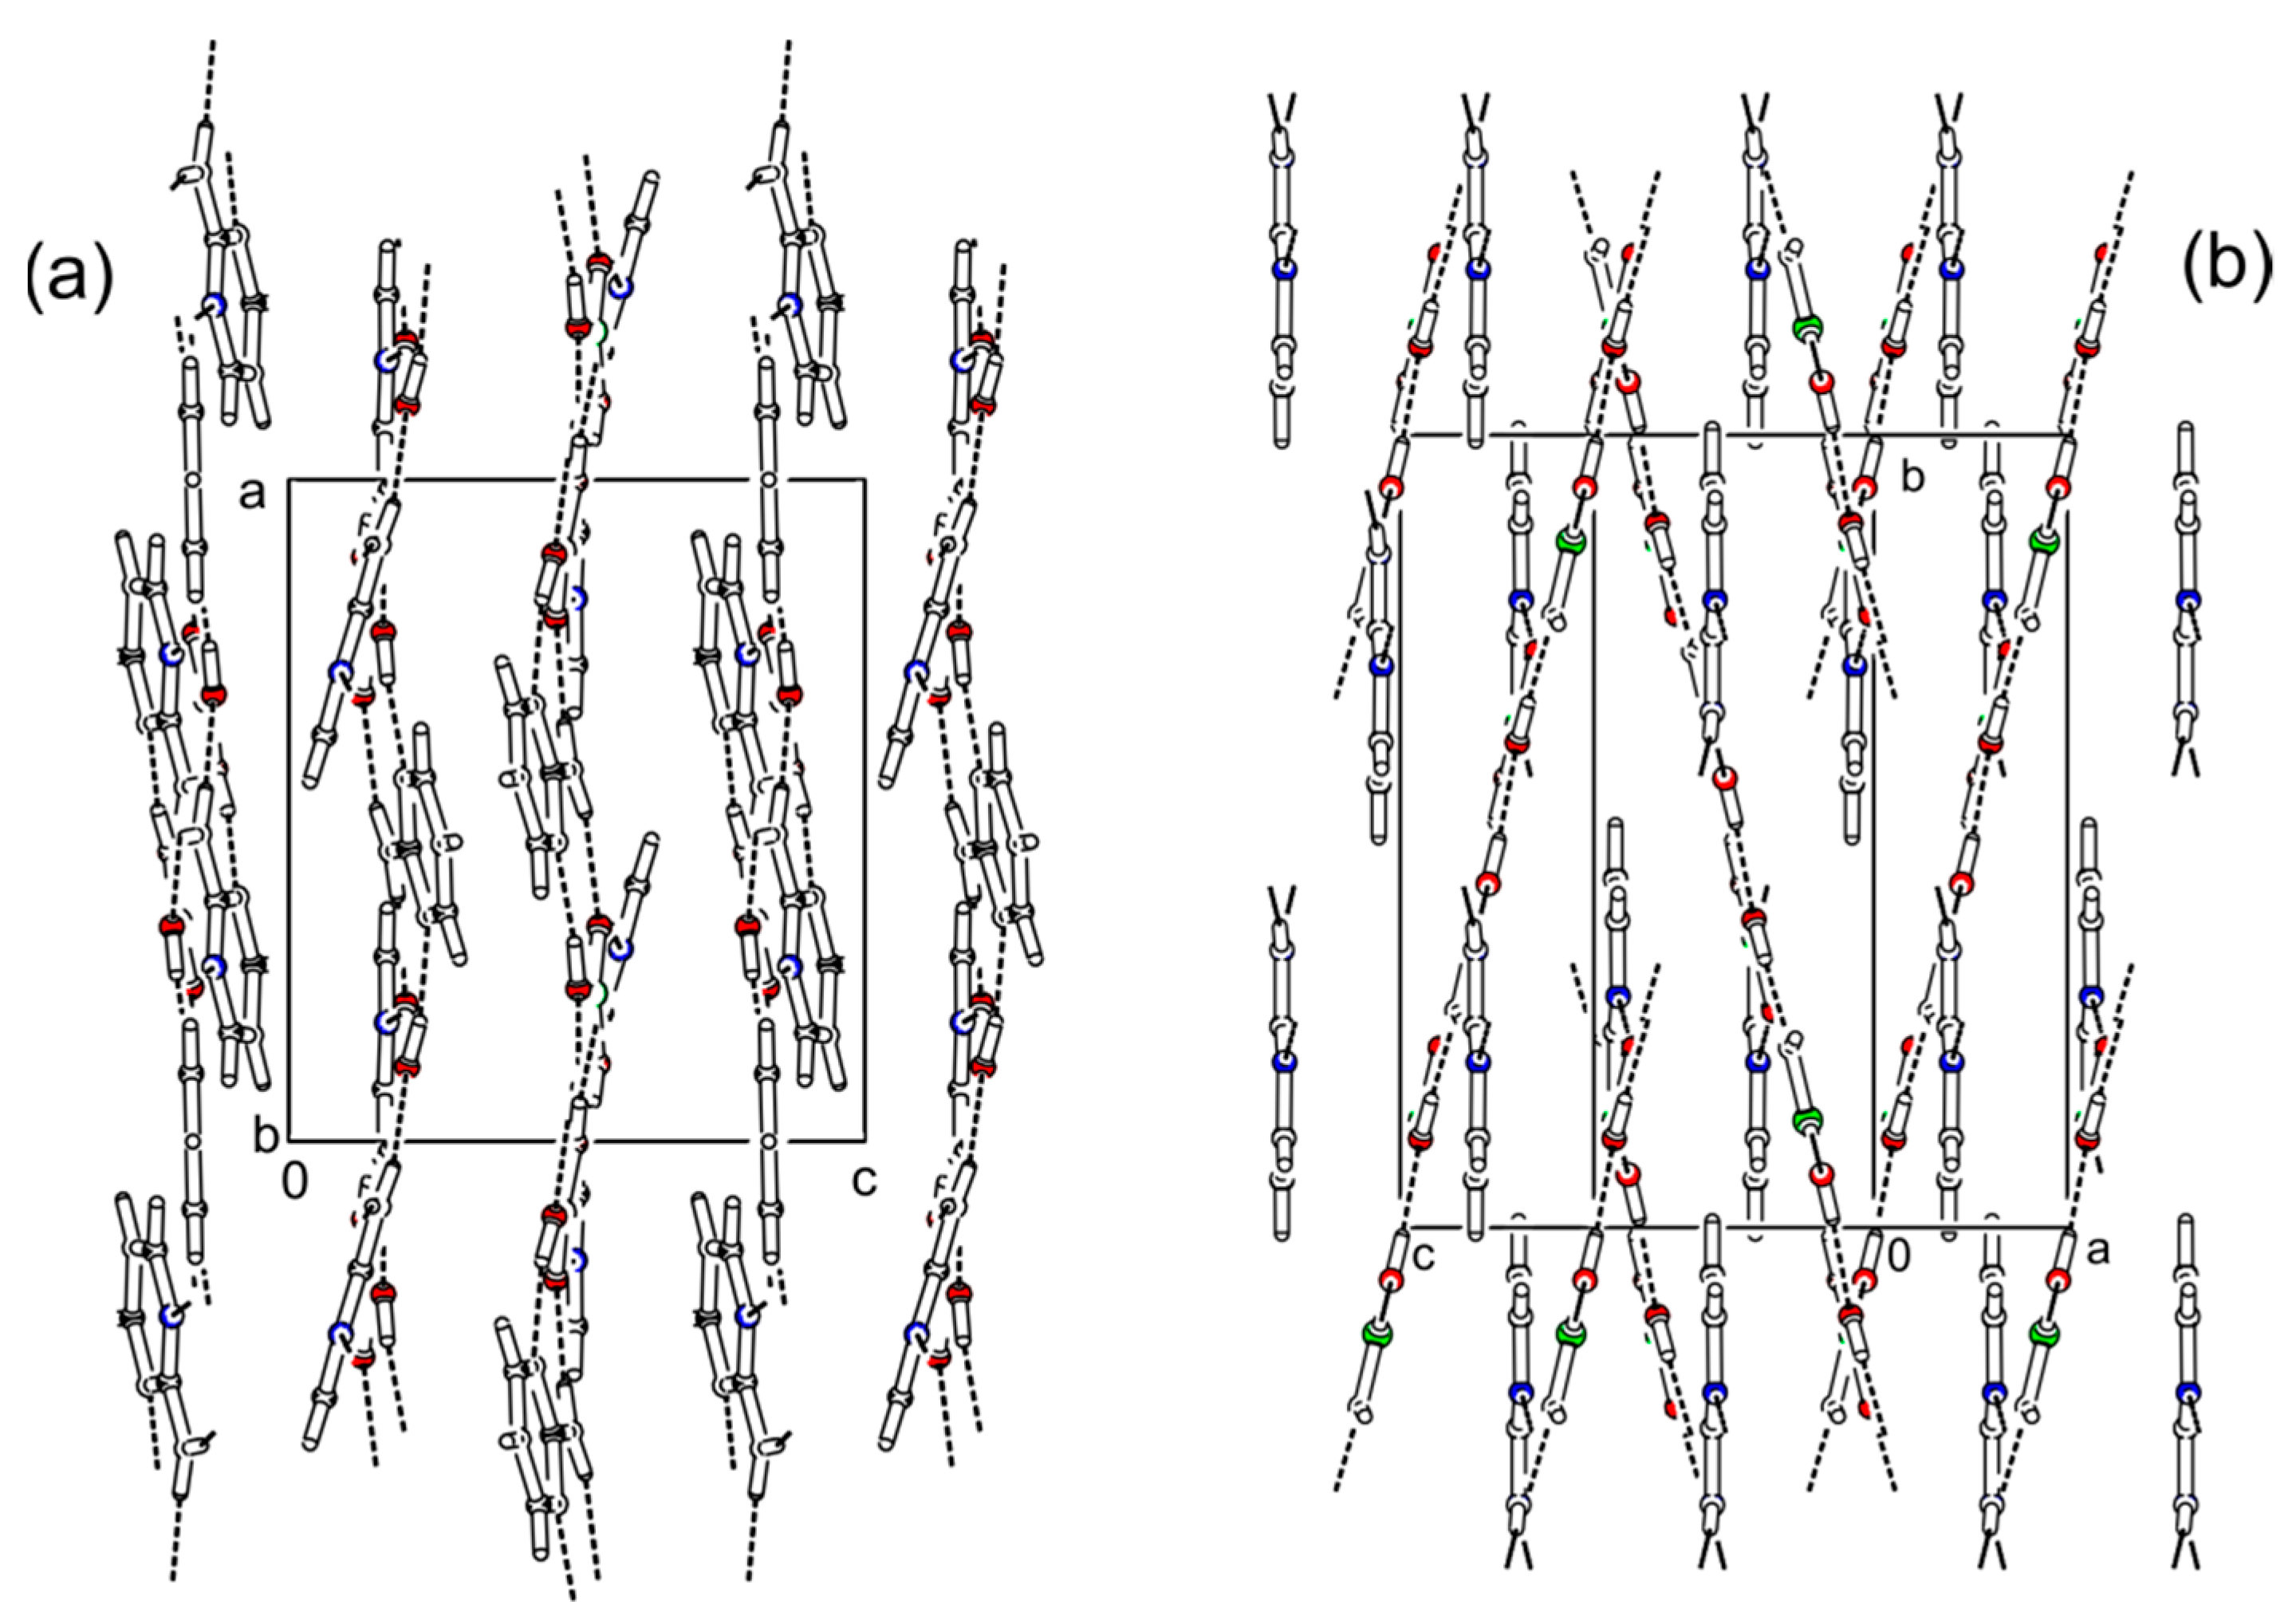
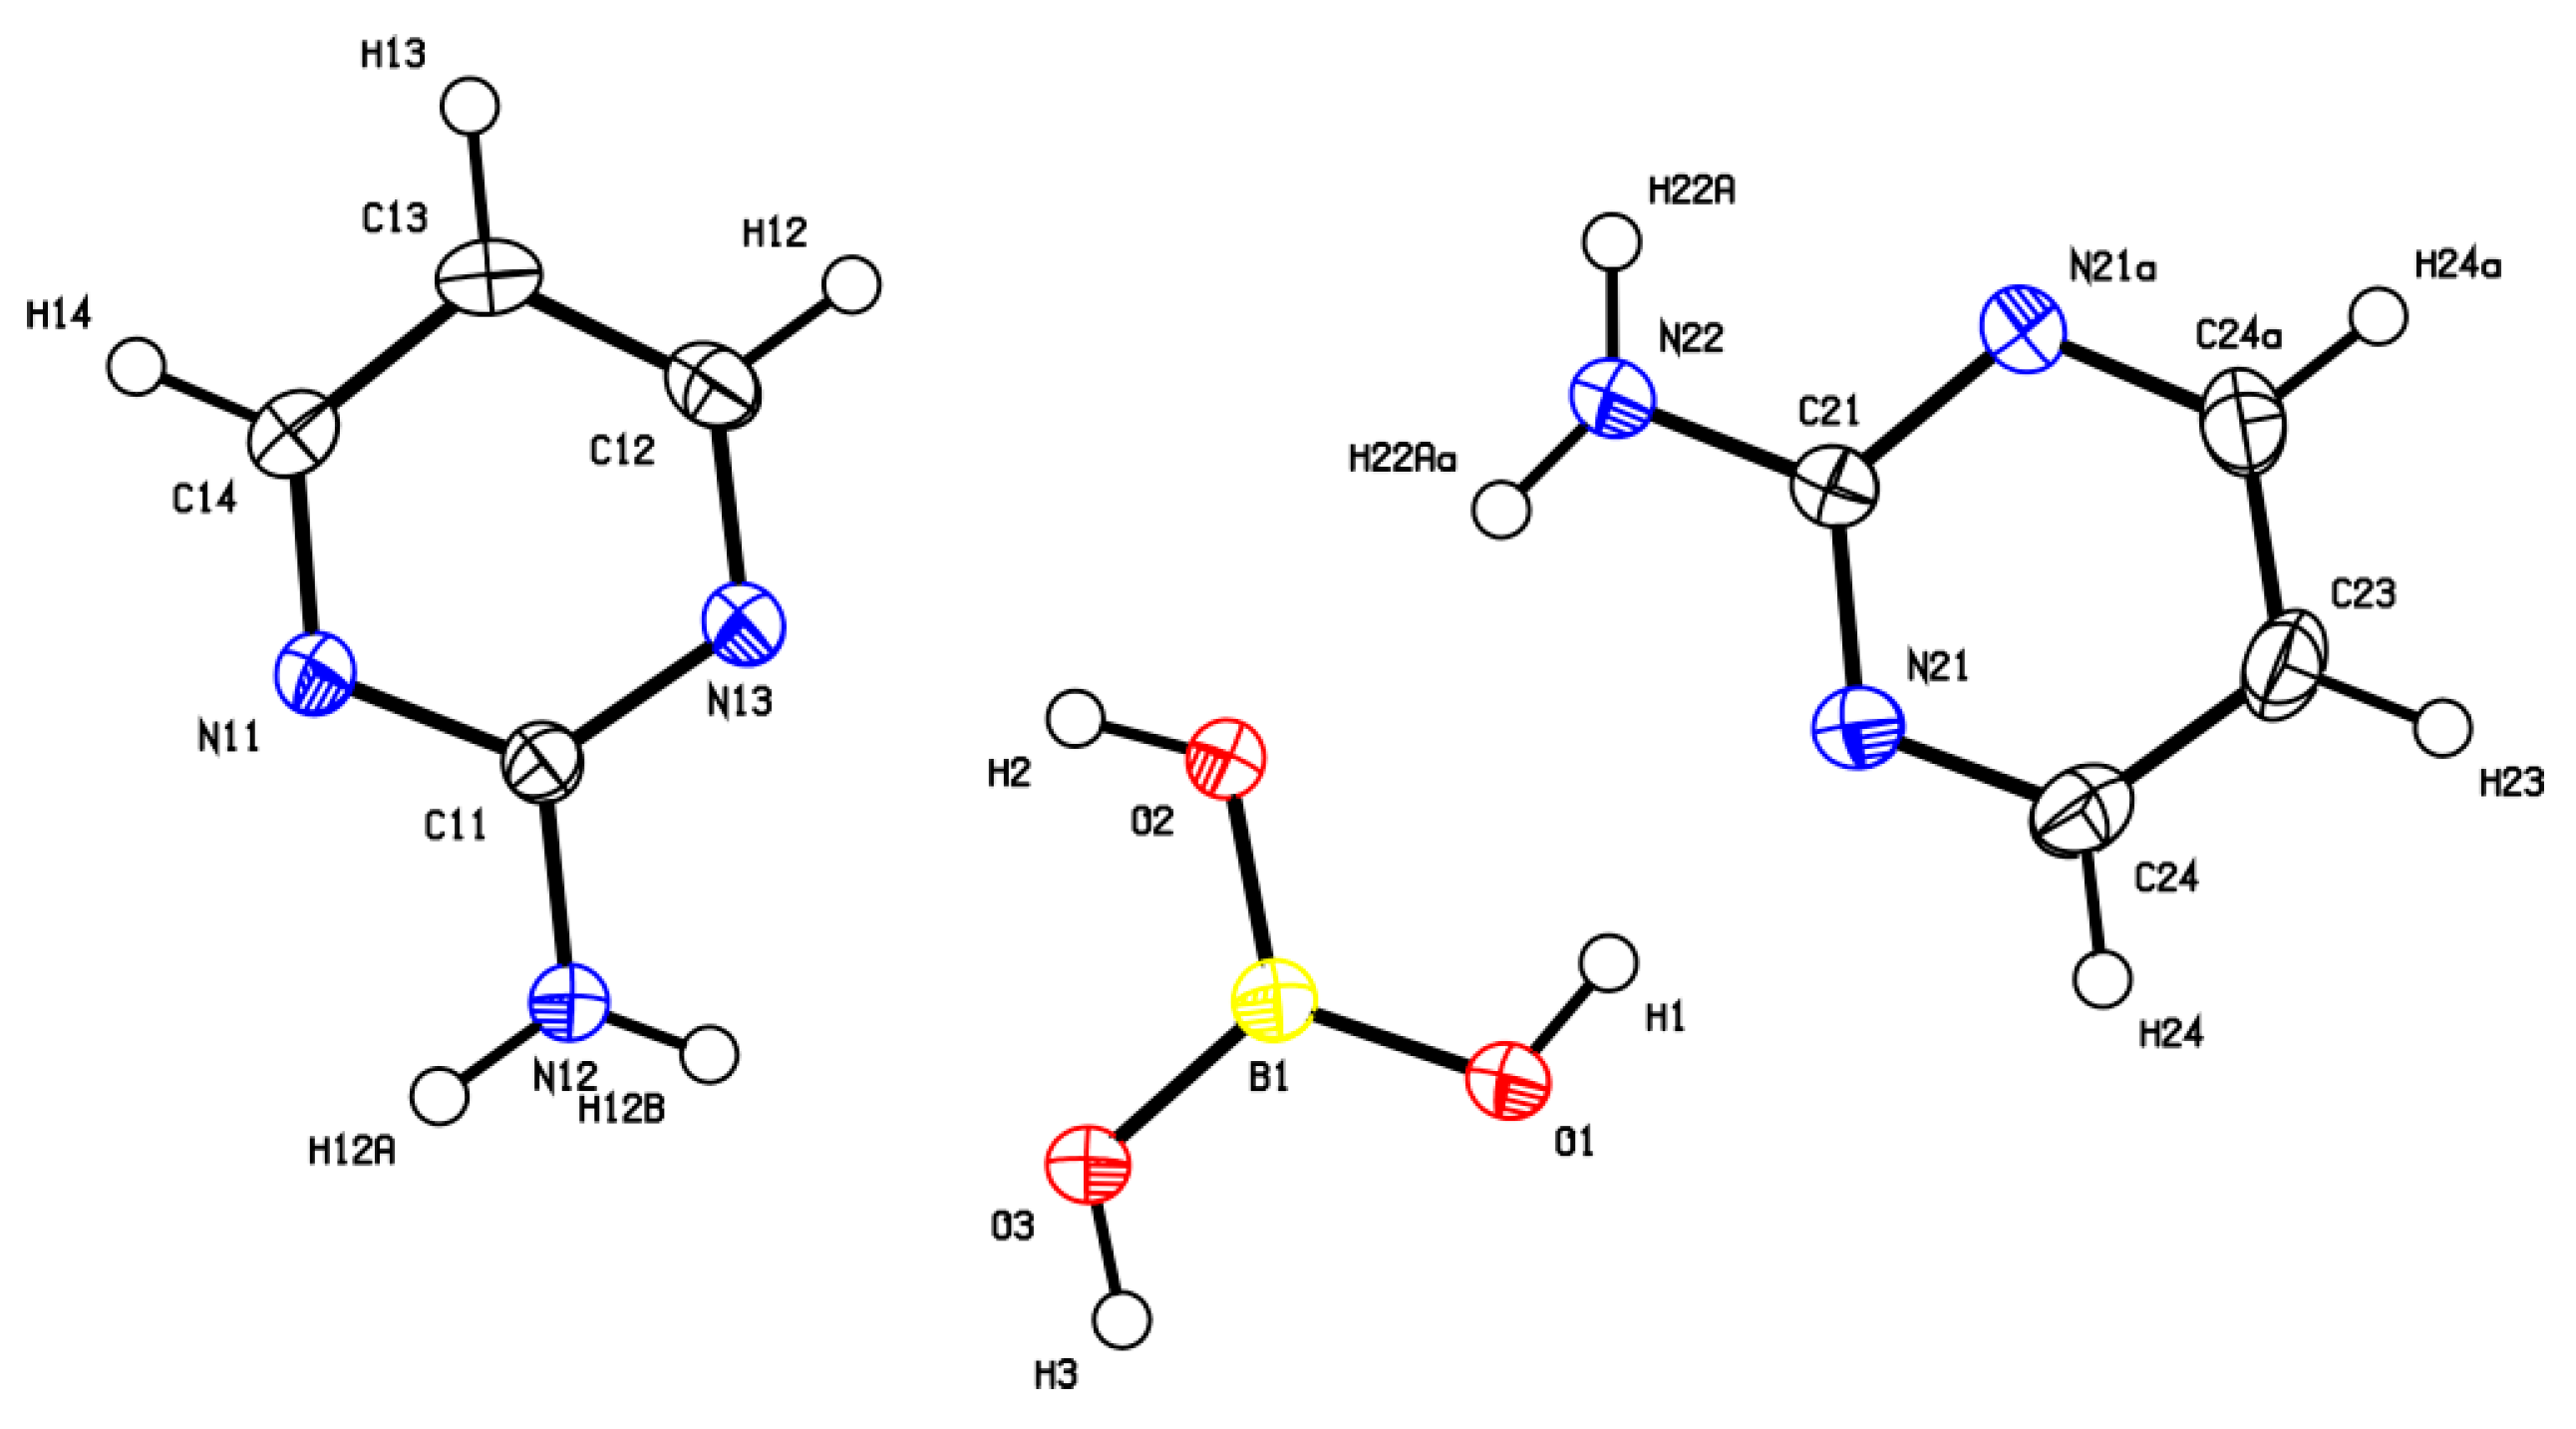
3.1. Crystal Structure Description

The cocrystal (2-AMP)3(H3BO3)2 belongs to the trigonal system with a non-centrosymmetric P3221 (resp. P3121) space group. The asymmetric unit with atom numbering is presented in Figure 2. The crystal structure is based on parallel layers formed by the motifs containing the boric acid molecule surrounded by three molecules of 2-aminopyrimidine, which are interconnected by N–H...O and O–H...N hydrogen bonds with donor…acceptor distances ranging from 2.923(2) to 3.000(2) Å and from 2.746(2) to 2.822(2) Å, respectively. The hydrogen bonding pattern of these motifs (see Figure 3) can be described by the graph set descriptor R 2 2 ( 8 ) . The arrangement of parallel layers in the crystal structure of (2-AMP)3(H3BO3)2 is depicted in Figure 6a. Bond lengths, angles, and hydrogen bond characteristics are outlined in Table S4, Supplementary Materials.
2-AMP(H3BO3)2 crystallizes in the monoclinic system with space group C2/c. The asymmetric unit with atom numbering is depicted in Figure 4. The crystal structure consists of ribbons formed by boric acid molecules connected by O–H…O hydrogen bonds with donor…acceptor distances 2.798(1) and 2.721(1) Å (graph set descriptors R 2 2 ( 8 ) ). These ribbons are interconnected via 2-aminopyrimidine molecules by O–H...N and N–H...O hydrogen bonds (graph set descriptors R 2 2 ( 8 ) ) with donor…acceptor distances 2.688(1) and 3.335(1) Å, respectively (see Figure 5). The mutual arrangement of flat 2-aminopyrimidine molecules oriented in parallel and ribbons formed by boric acid molecules is depicted in Figure 6b. Bond lengths, angles, and hydrogen bonds characteristics of 2-AMP(H3BO3)2 are outlined in Table S5, Supplementary Materials.

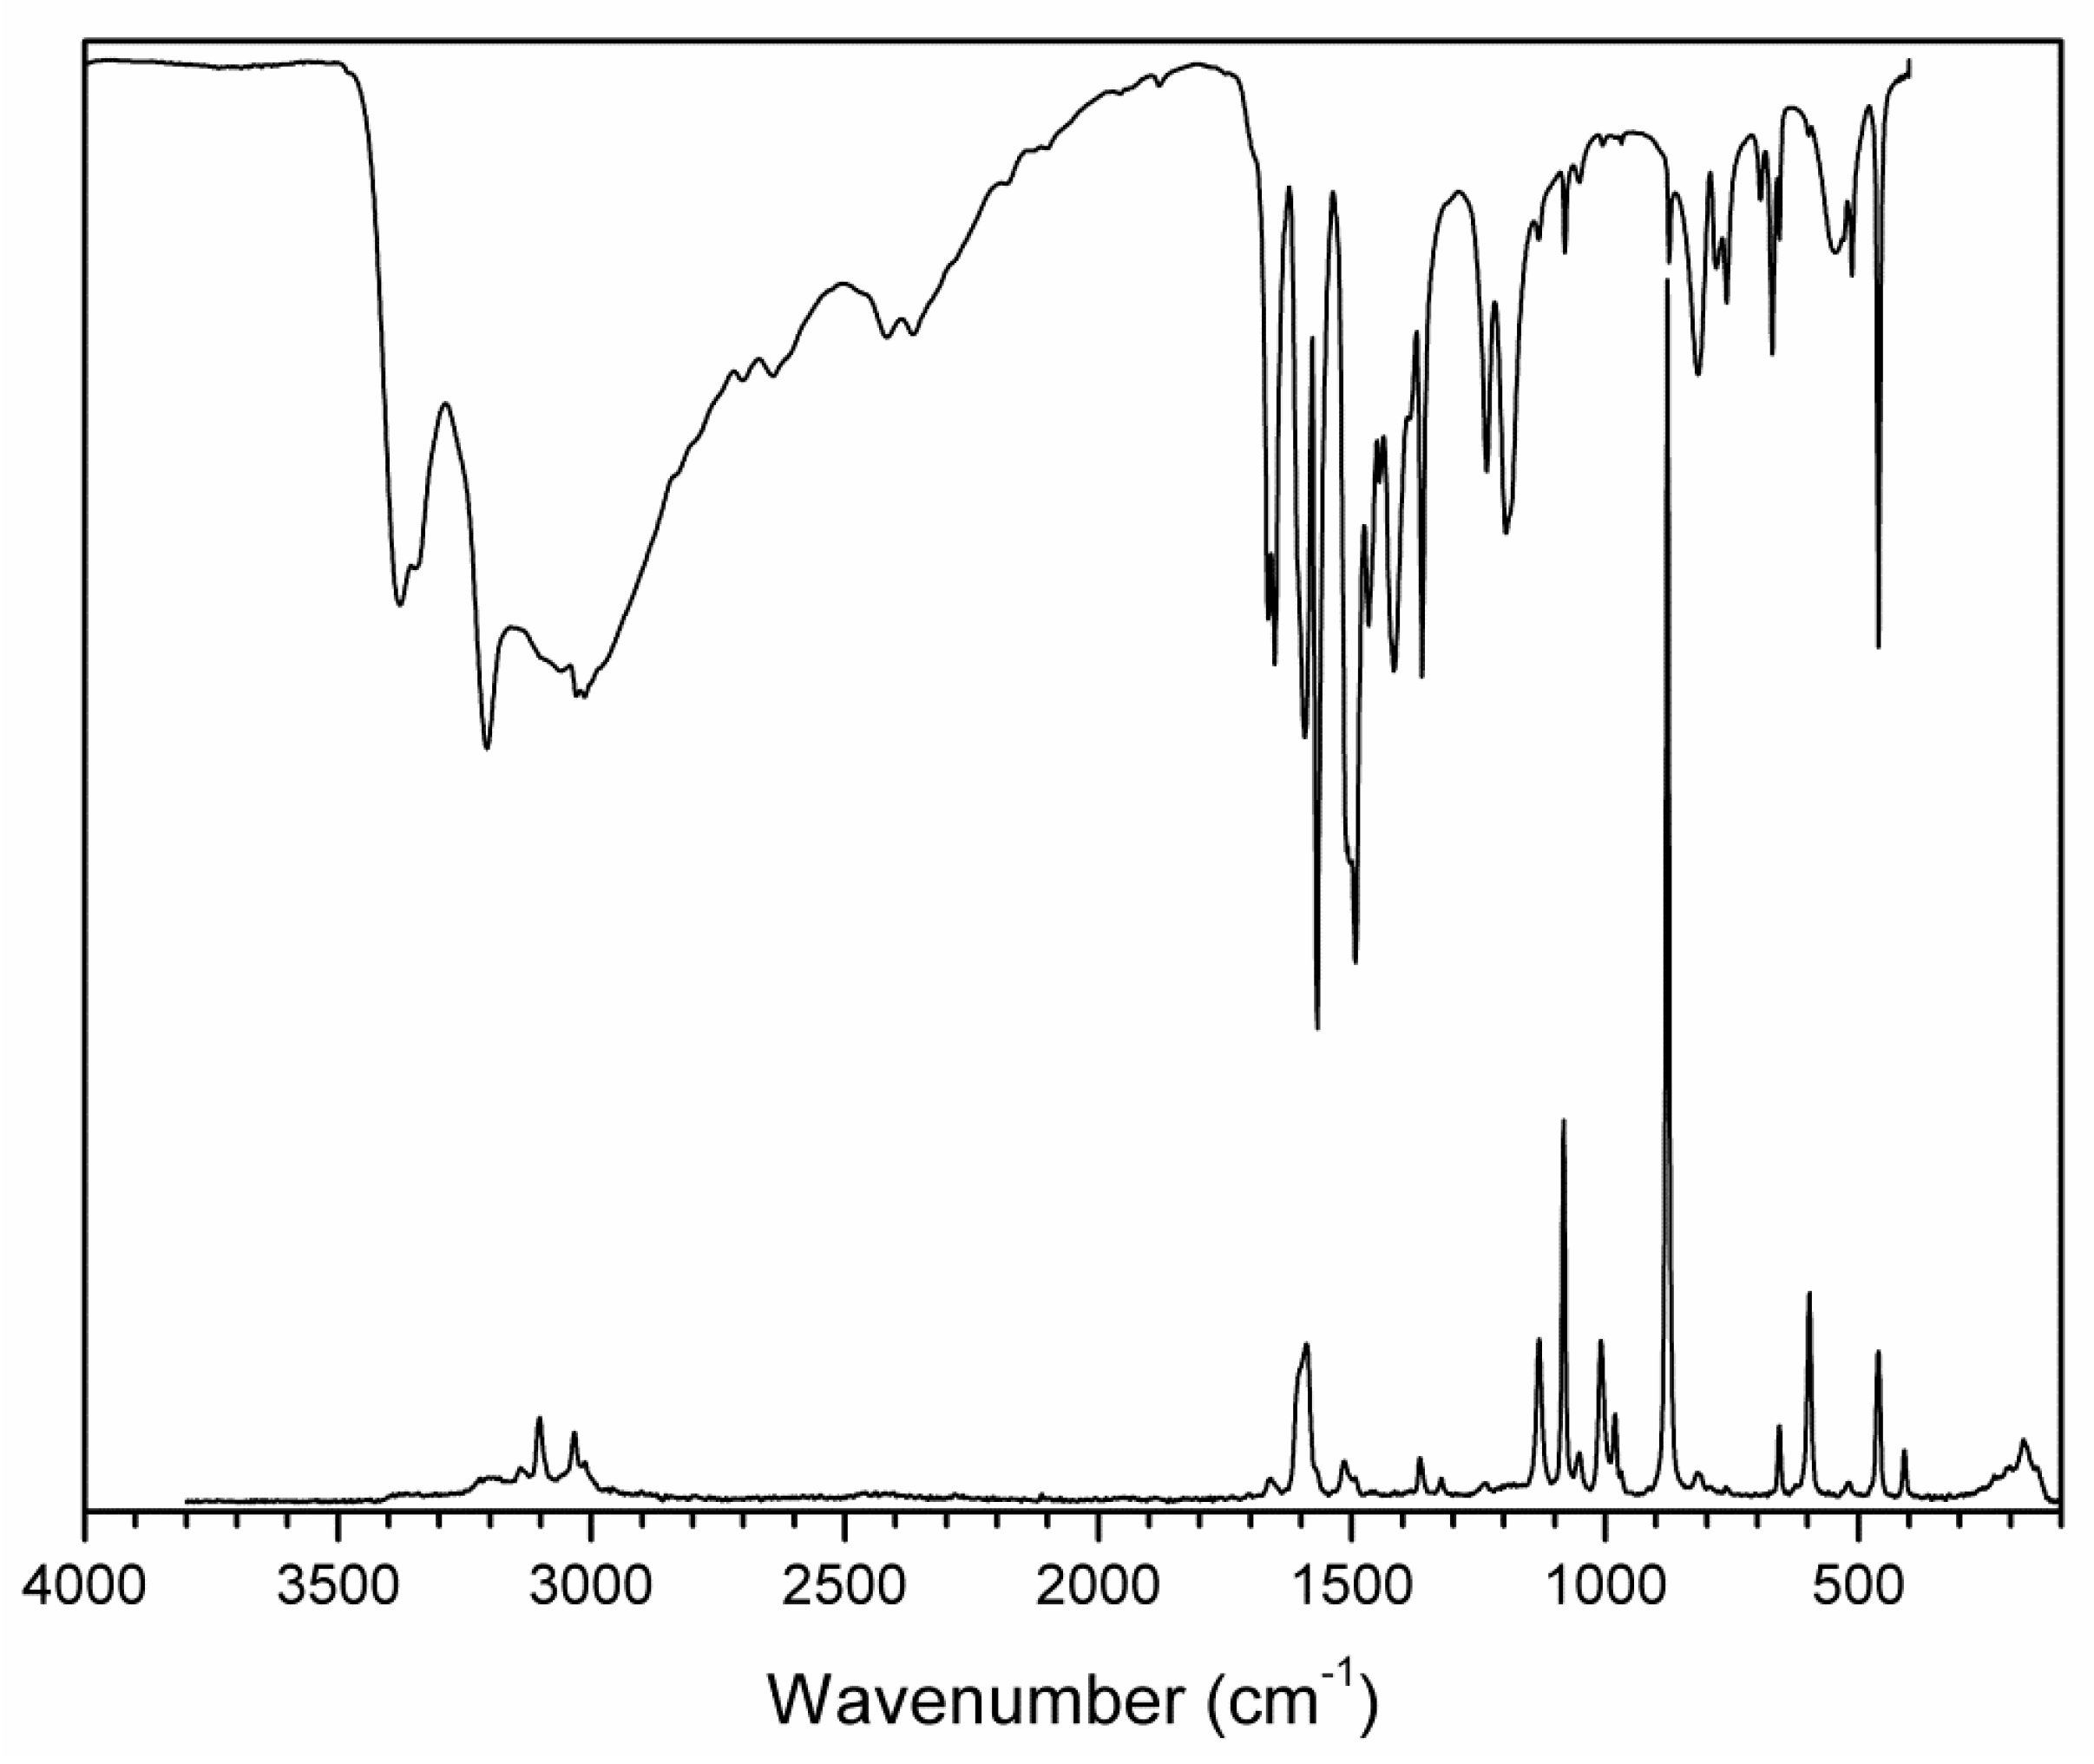
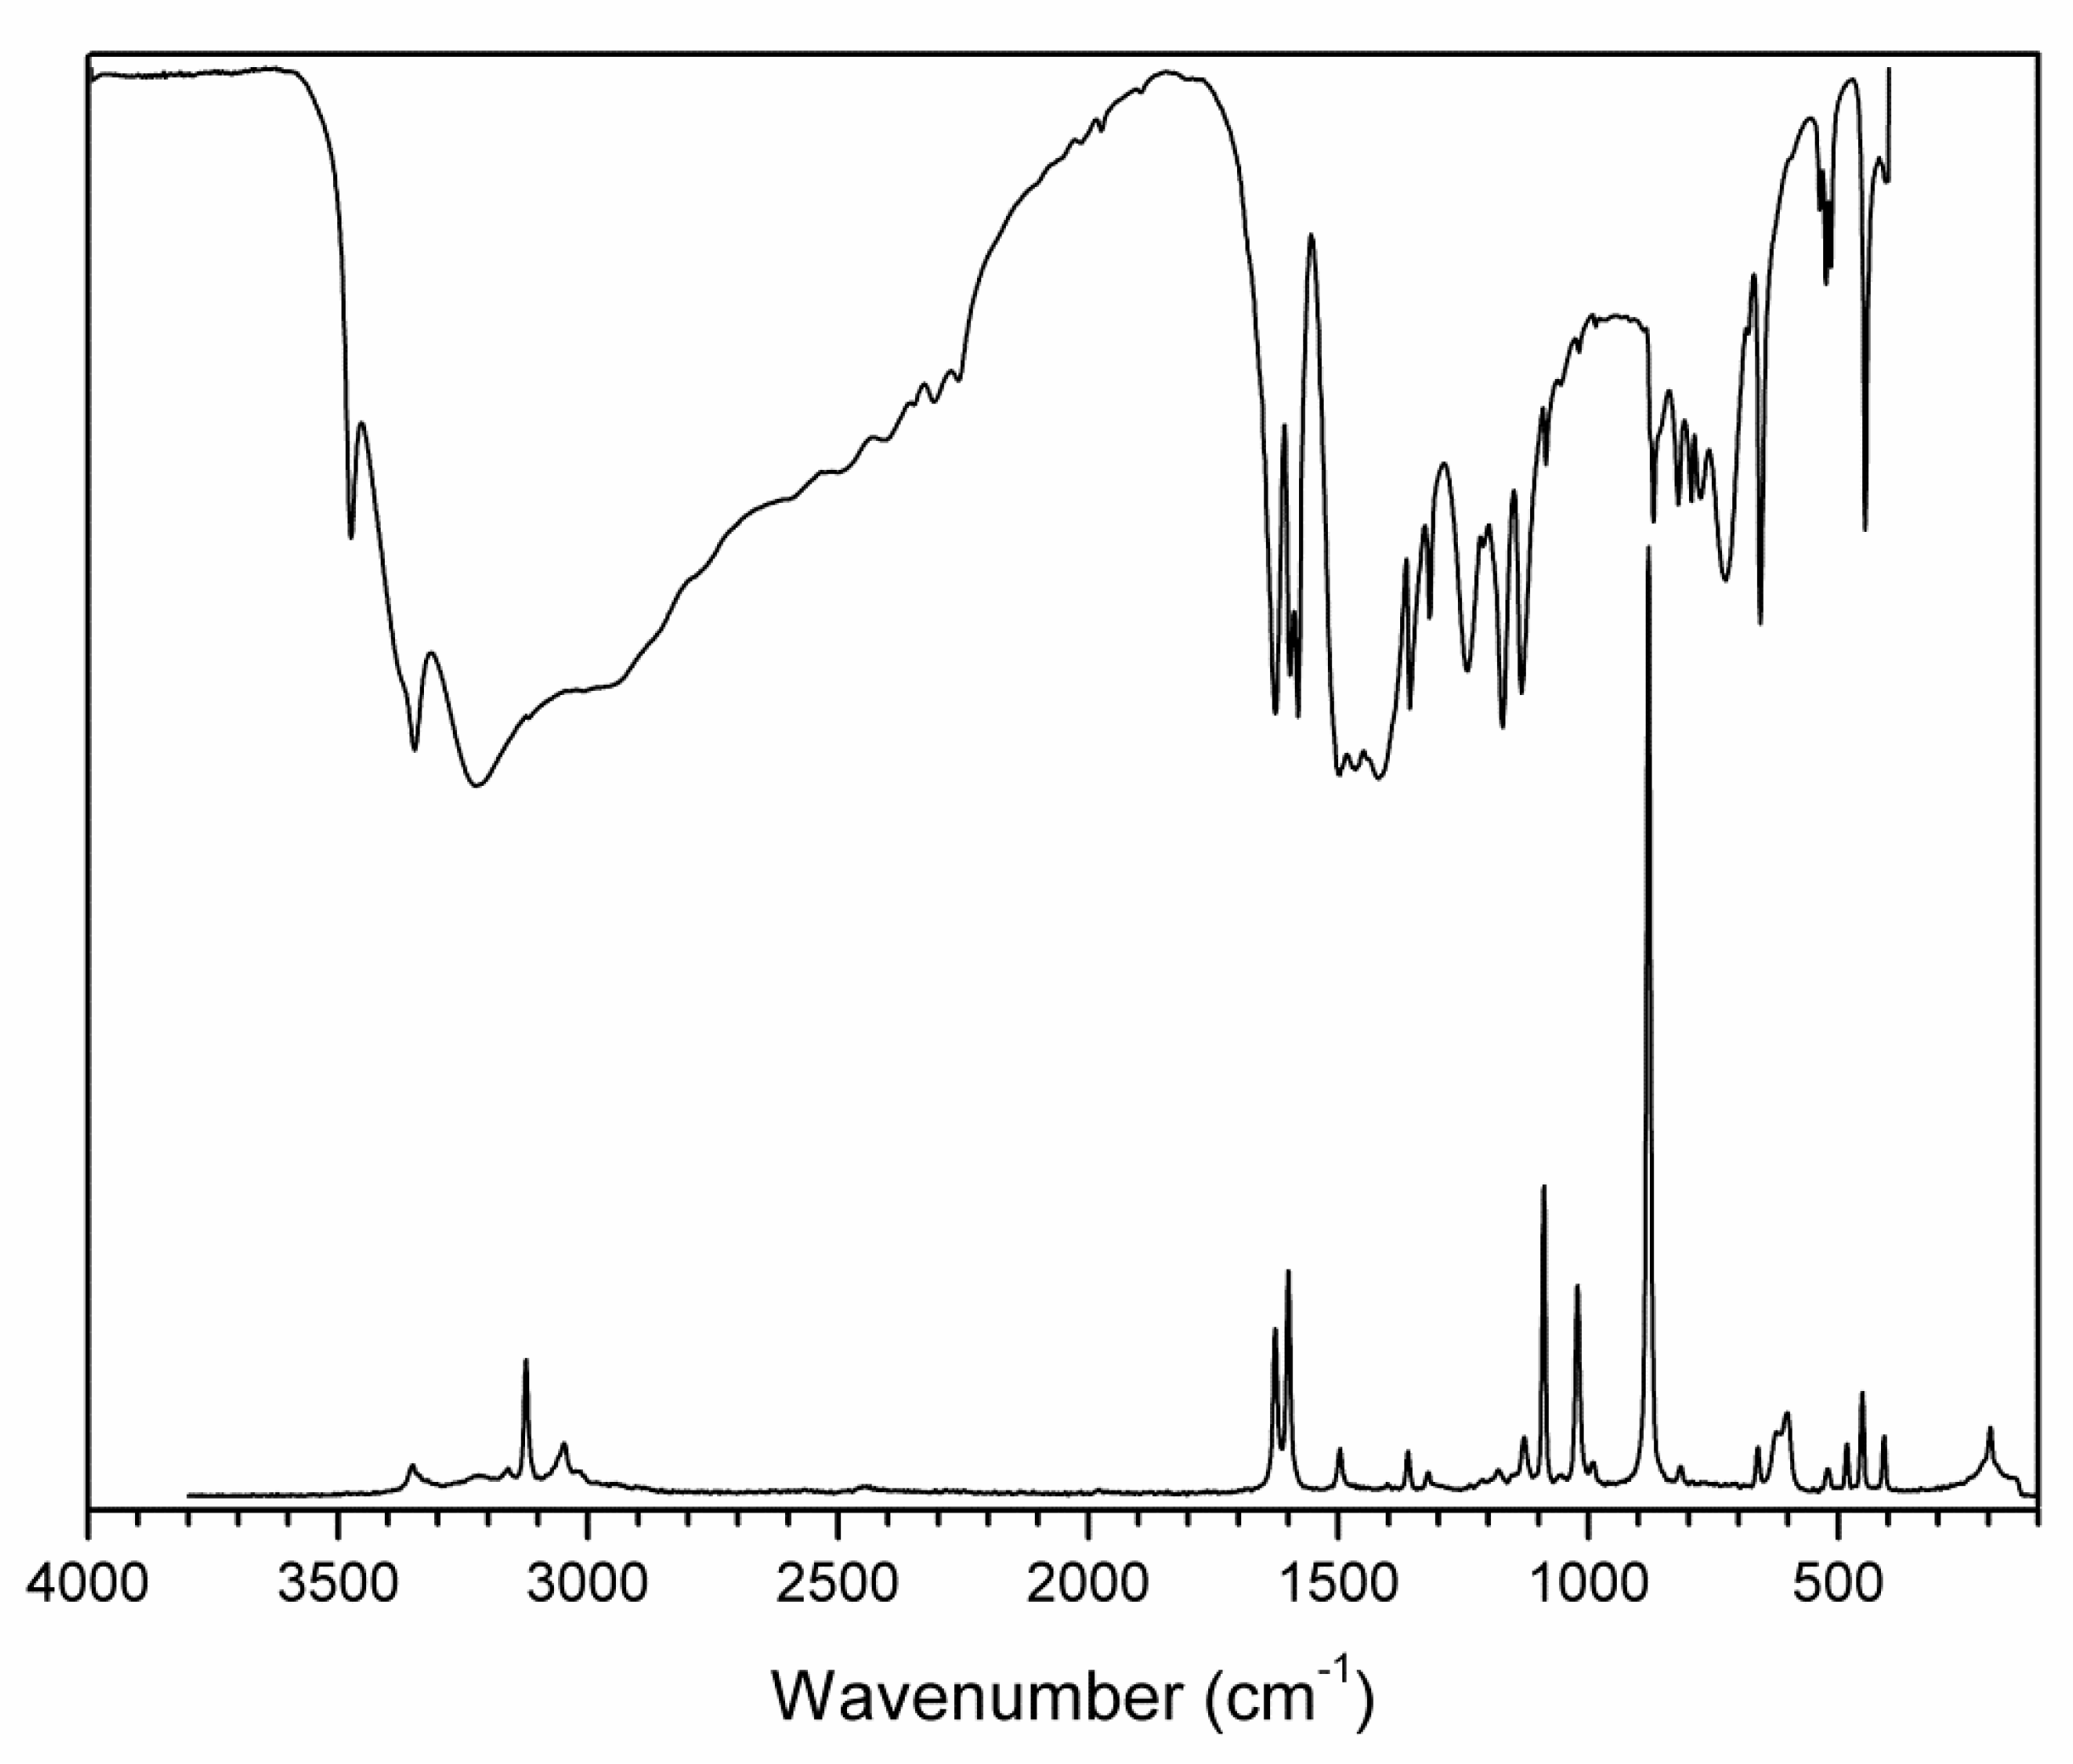
3.2. Vibrational and UV-Vis Spectra

The number of expected normal modes of the studied crystals was determined by nuclear site group analysis [31]. The crystals of (2-AMP)3(H3BO3)2 and 2-AMP(H3BO3)2 belong to the space groups P3221 ( D 3 6 ) and C2/c ( C 2 h 6 ) with 27 atoms (Z = 3) and 15 atoms (Z = 4) per asymmetric unit, respectively. In contrast to atoms N22, C21, C23, and H23 (see Figure 2), which occupy three-fold Wyckoff positions b(C2), all remaining atoms of the asymmetric unit of (2-AMP)3(H3BO3)2 occupy the general six-fold Wyckoff positions c(C1). Most atoms of the asymmetric unit of 2-AMP(H3BO3)2 occupy general eight-fold Wyckoff positions f(C1). Only atoms C1, N2, C3, and H3 (see Figure 4) occupy four-fold Wyckoff positions e(C2).
Symmetry analysis of the optical vibrational modes (see Table 2) gave 14A1(Ra) + 15A2(IR) + 29E(IR,Ra) representations for the external modes, 59A1(Ra) + 61A2(IR) + 120E(IR,Ra) representations for the internal modes of (2-AMP)3(H3BO3)2, and 8Ag(Ra) + 7Au(IR) + 10Bg(Ra) + 8Bu(IR) representations for the external modes and 29Ag(Ra) + 29Au(IR) + 31Bg(Ra) + 31Bu(IR) representations for the internal modes of 2-AMP(H3BO3)2.
IR and Raman spectra (see Figure 7 and Figure 8 and Table 3 and Table 4) were assigned according to results from our quantum chemical calculations and recently published study on boric acid [32]. The assignment of the bands of stretching and out-of-plane bending vibrations of the N–H and O–H groups involved in hydrogen bonding is based on correlation curves [33,34] concerning the position of the vibrational bands and appropriate hydrogen bond lengths.
The overall character of the recorded spectra is fully consistent with the results from the crystal structure determination (i.e., with molecular crystals consisting of hydrogen-bonded uncharged molecules of 2-aminopyrimidine and boric acid). Differences in crystal packing and in hydrogen bonding patterns are mainly reflected in the shape and positions of the bands corresponding to stretching vibrations of N–H and O–H groups involved in O–H…O, O–H…N. and N–H…O hydrogen bonds (3500–2500 cm−1 region in the IR spectra). The presence of boric acid molecules in the crystal structure is clearly evident as strong to medium intensity bands (partly overlapping with 2-aminopyrimidine modes) at 1550–1370 cm−1 and 1250–1150 cm−1 (νBO and δBOH modes), 850–650 cm−1 (γBO3 modes), and 550–510 cm−1 (δOBO and δBOH modes). The shape of these bands, especially in the IR spectrum of AMP(H3BO3)2 (see Figure 8), is very similar to that of crystalline boric acid [32] (see Figure S3, Supplementary Materials).
Characteristic broadening and intensity increase of the IR-active bands of νBO and δBOH modes (1550–1370 cm−1 region) and γBO3 modes (850–650 cm−1 region) is likely related to the existence of O–H…O hydrogen bonds interconnecting boric acid molecules in AMP(H3BO3)2. This interaction is not present in the crystal structure of (2-AMP)3(H3BO3)2 where such bands are much less pronounced (see Figure 7 and Figure S3, Supplementary Materials). Differences in crystal packing and particularly in hydrogen bonding are also reflected in vibrational manifestations of 2-aminopyrimidine molecules in all spectra, especially in the 1680–1560 cm−1 region where highly mixed modes of heteroaromatic ring and amino group are located. The most intense bands in the Raman spectra, corresponding to the mixed modes of δBO3, γBO3, and symmetric stretching/deformation vibrations of the heteroaromatic ring, were recorded at 877 and 879 cm−1 for (2-AMP)3(H3BO3)2 and AMP(H3BO3)2, respectively. The complete assignment of IR and Raman spectra is outlined in Table 3 and Table 4.
The assignment of (2-AMP)3(H3BO3)2 vibrational spectra was also confirmed by solid state quantum-chemical computations using the CRYSTAL17 program. The comparison between recorded spectra and computed vibrational modes is shown in Figures S4 and S5, Supplementary Materials. The predicted positions and intensities of the modes fit to the recorded spectra very well. Some discrepancies can be observed in the computed positions of the IR active modes in the 1260–1150 cm−1 region (representing νrg, δrg, ρNH2 and νBO, δBOH modes) and in intensities of computed modes at 827 and 541 cm−1. In addition, the computed positions of the Raman active modes in the 1620–1580 cm−1 region are slightly shifted to higher wavenumbers.
The UV–Vis spectrum of a polycrystalline sample (see Figure S6, Supplementary Materials) reveals that (2-AMP)3(H3BO3)2 is optically transparent at least down to 375 nm.

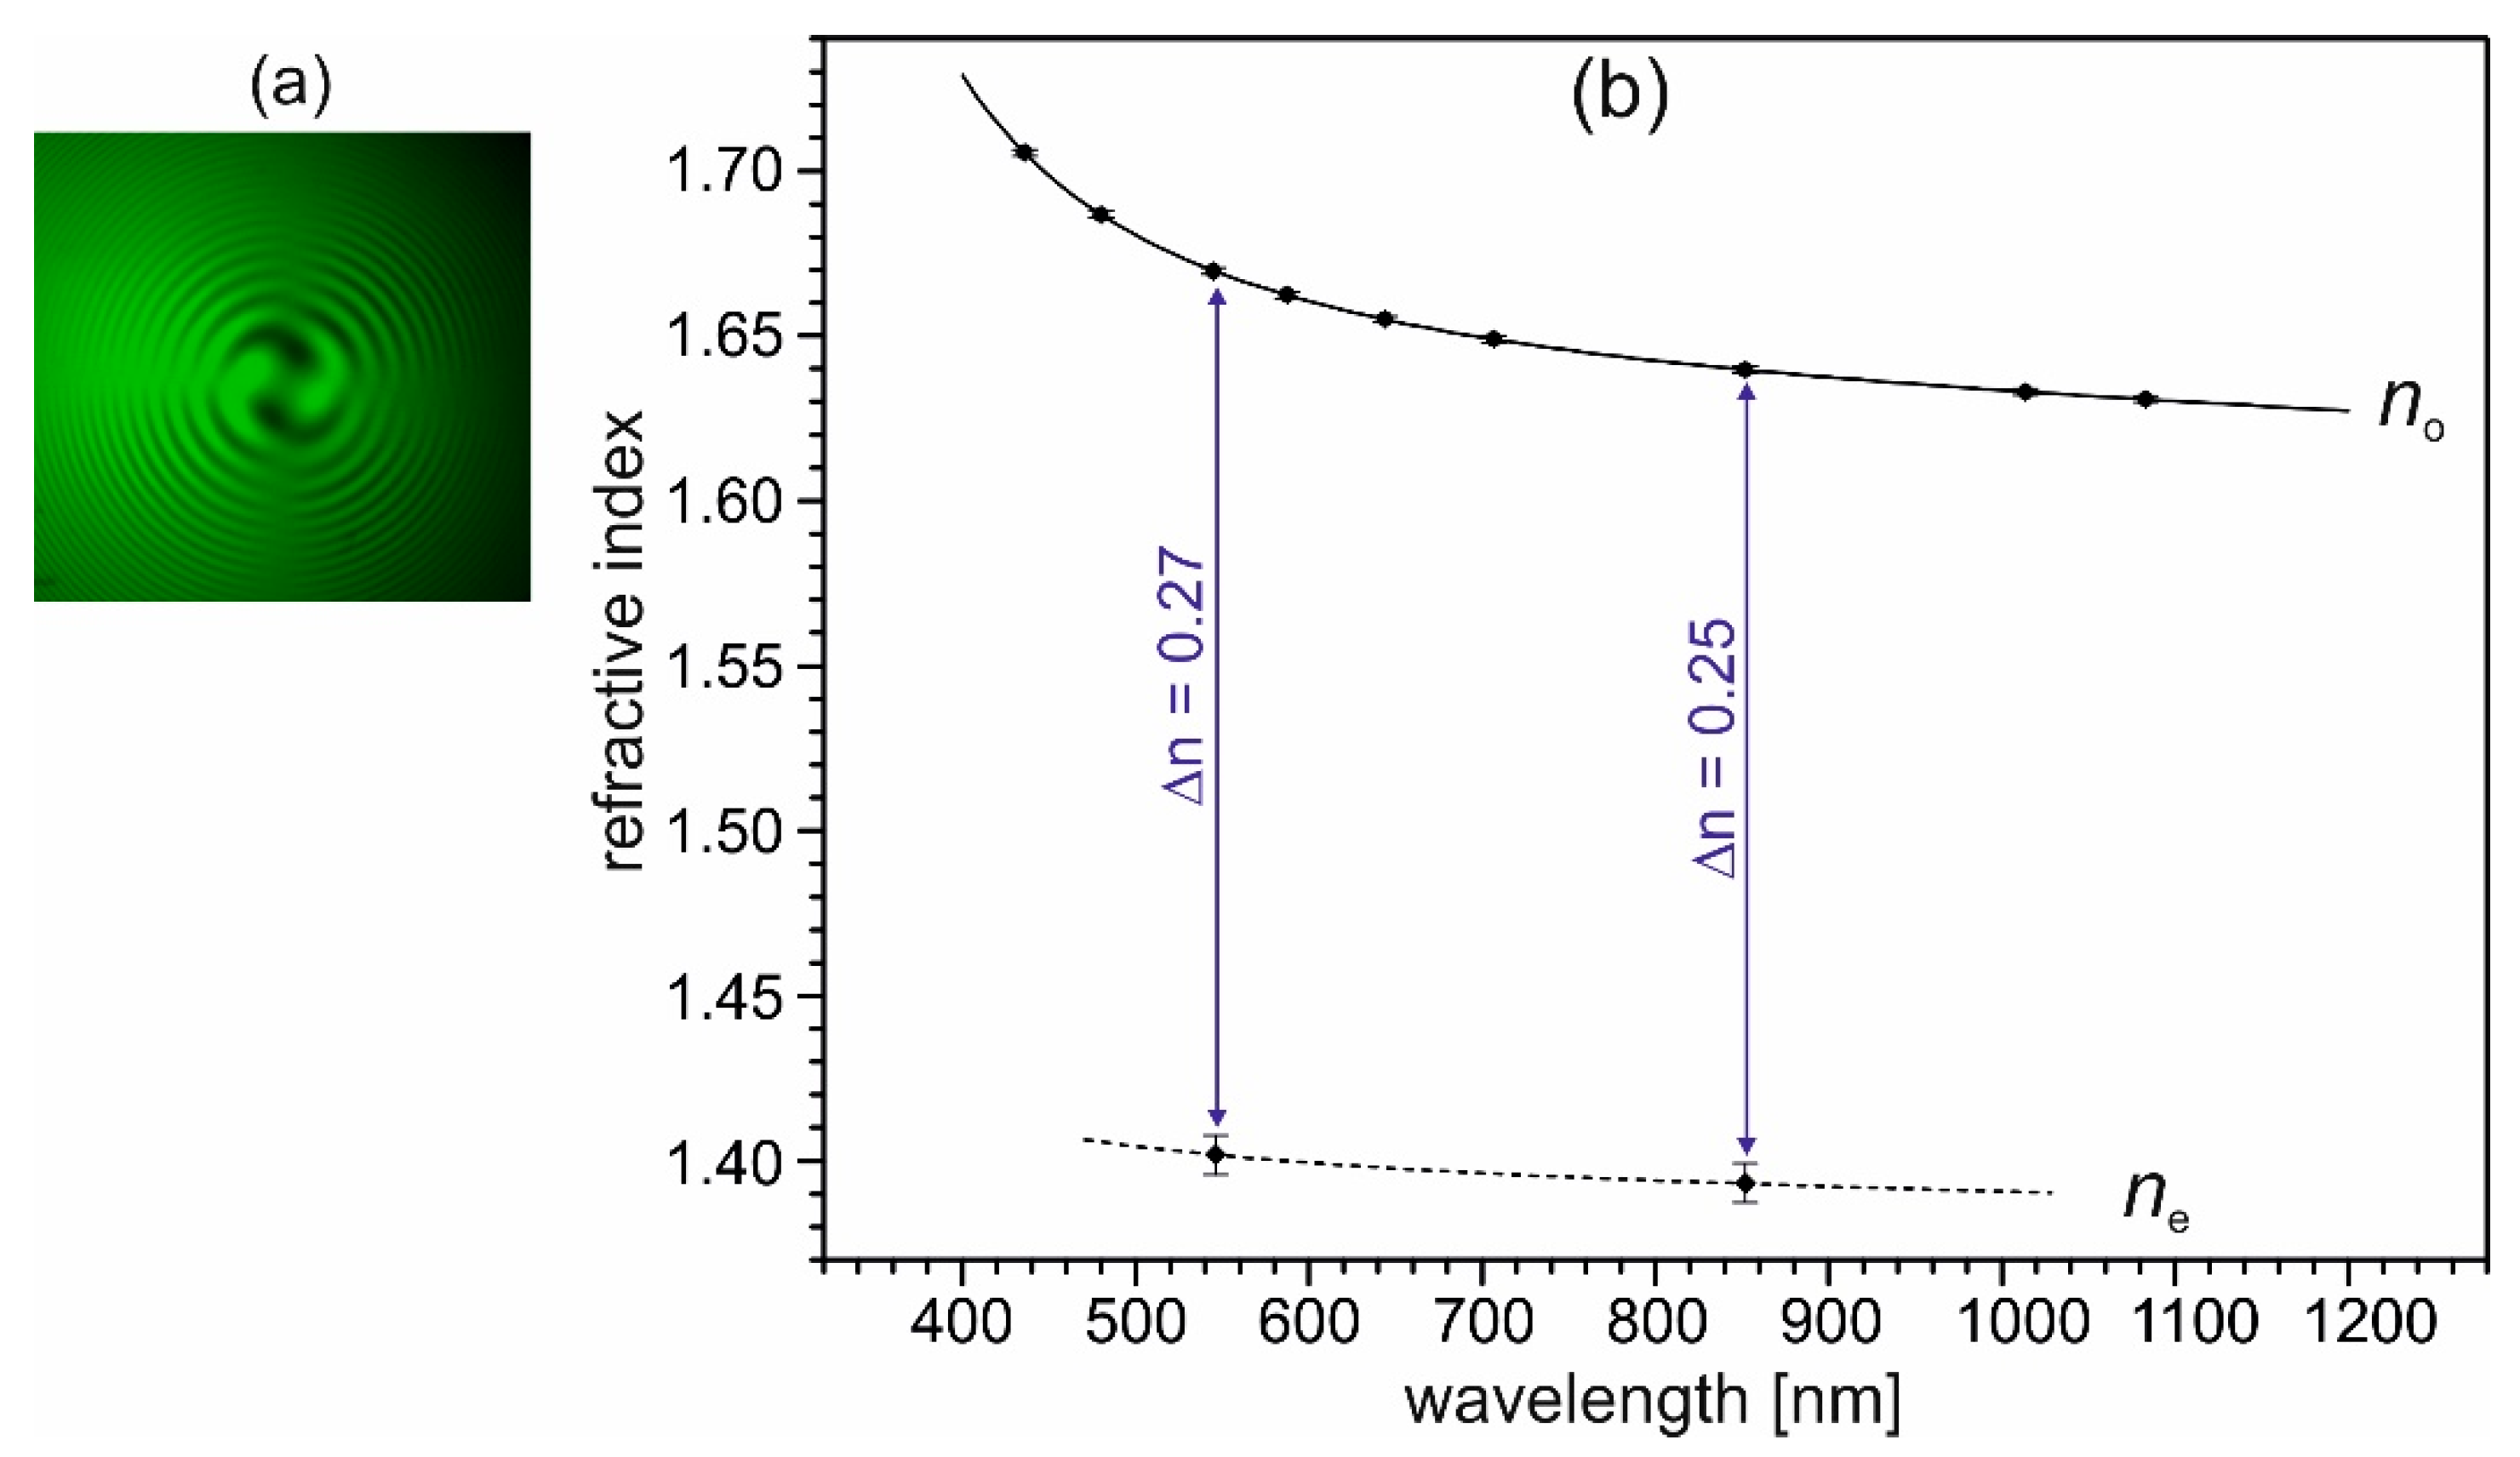
3.3. Optical Properties of (2-AMP)3(H3BO3)2

Crystals of (2-AMP)3(H3BO3)2 show pronounced optical activity, which can be observed in the direction of the optical axis. The rotation of the plane of the linearly polarized light in this direction amounts approximately 22.5°/mm at 546.7 nm wavelength, as measured using three (001) crystal plates of different thicknesses and a polarizing microscope with rotatable polarizer. Since the crystal structure of (2-AMP)3(H3BO3)2 possesses no chiral constituents, the compound can crystallize with equal probability with either of the enantiomorphic space groups P3121 or P3221. In consequence, both levo- and dextro-rotatory optically active crystals of (2-AMP)3(H3BO3)2 can occur with equal probability. In Figure 9a, an interference figure in conoscopic illumination of a (001) plate of about 2 mm thickness, taken with a polarizing microscope and crossed polarizers using monochromatic light of 546.7 nm wavelength and a quarter-wave plate between the crystal and the analyzer of the microscope, is given. The observed spirals indicate levo-rotatory optical activity of the used crystal. The occurrence of optical activity of (2-AMP)3(H3BO3)2 corroborates its chiral symmetry.
The measured refractive indices no and their wavelength dispersion, given in Figure 9b, were fitted with a Sellmeier-type equation (Equation (1)).
n 2 ( λ ) = D 1 + D 2 ( λ 2 D 3 ) D 4 λ 2   ( with   λ   in   μ m )
The Sellmeier coefficients for no are D1 = 2.654(1), D2 = 0.0327(5), D3 = 0.063(1), and D4 = 0.021(1) (sum of the squares of residuals ξ2 = 7 × 10⁻⁹). For ne, no fit was calculated; the dashed line in Figure 9b is a guide to the eye. As can be seen in Figure 9b, crystals of (2-AMP)3(H3BO3)2 possess an exceptionally high birefringence Δn of about 0.25 in the visible range. In comparison, the birefringence Δn of calcite amounts to 0.173 at 560.0 nm [35]. Crystals of (2-AMP)3(H3BO3)2 are uniaxially negative, which corresponds to the layered crystal structure. As a consequence of the large birefringence, phase matching for collinear second harmonic generation (SHG) of type I cannot be realized within the transparency range of the crystal. Also, for the collinear SHG type II process, the possibility for phase matching within the transparency range is improbable. Here, however, a definitive statement is not possible due to the lacking knowledge of the dispersion of the refractive index ne in the shorter wavelength range.

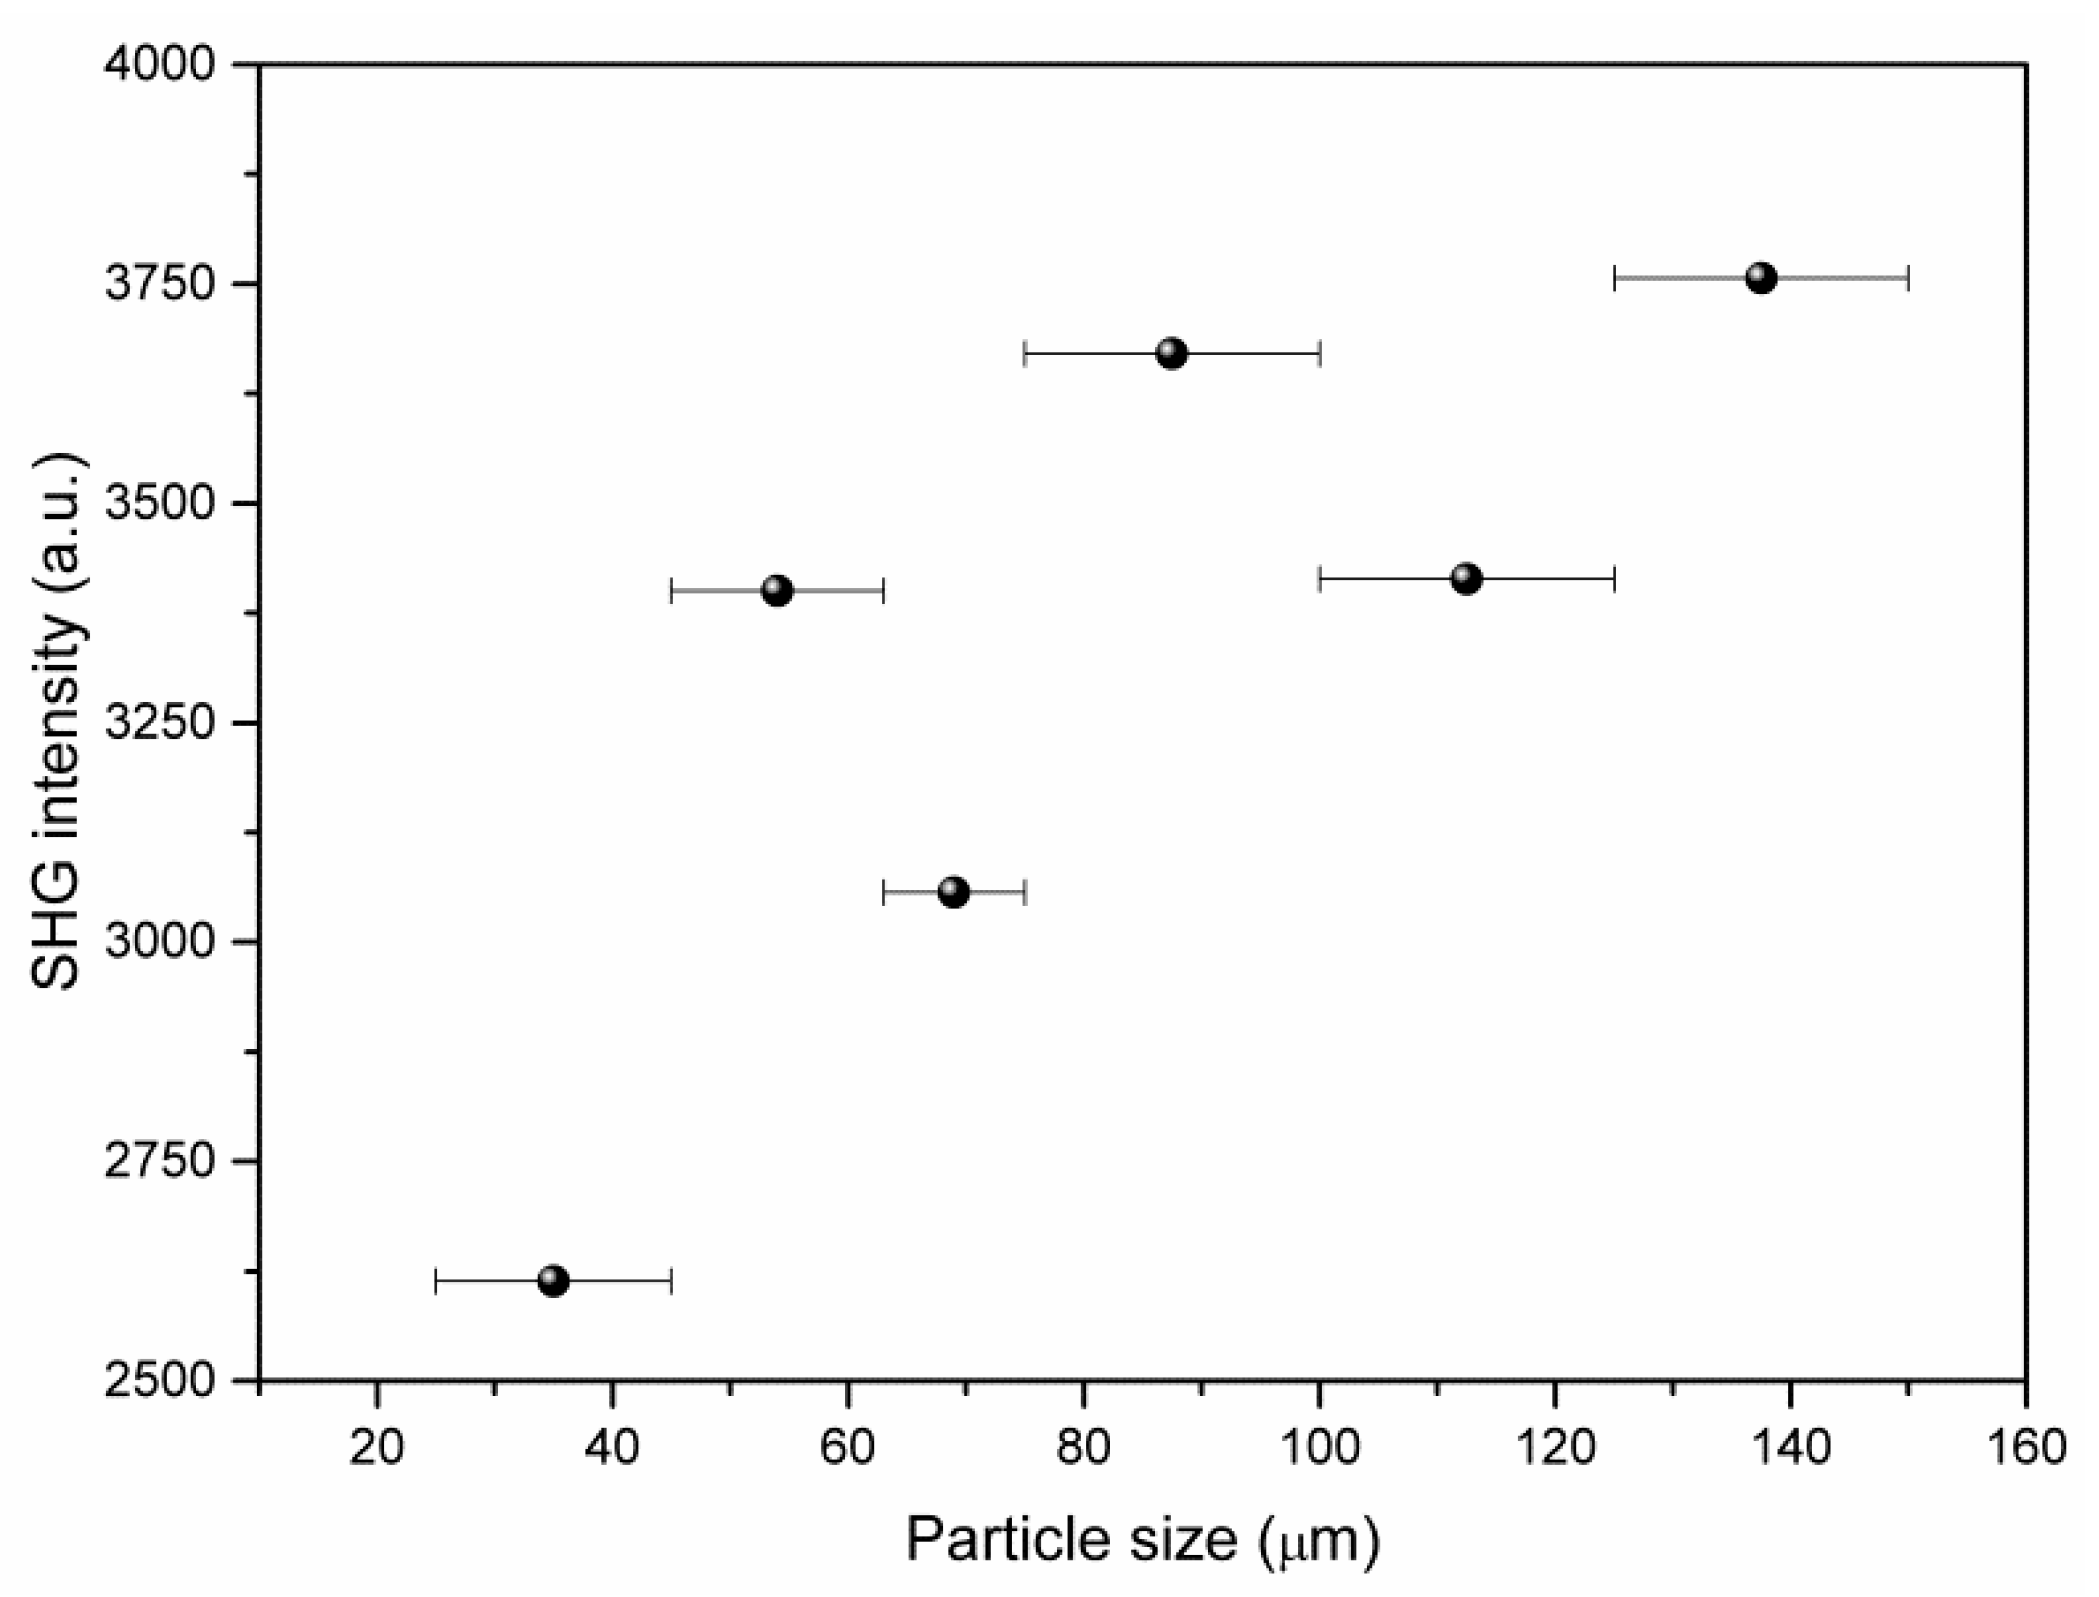
3.4. Second Harmonic Generation (SHG) Measurements of (2-AMP)3(H3BO3)2

SHG measurements of the non-centrosymmetric crystalline compound (2-AMP)3(H3BO3)2 using powder samples revealed marked SHG activity. To quantify this activity, the measurements were compared to the SHG activity of potassium dihydrogen phosphate (KDP). The intensity I2ω of the generated second harmonic with frequency 2ω was I(2ω)((2-AMP)3(H3BO3)2) = 0.43 I(2ω)(KDP). Using particle size dependent measurements, a qualitative check for phase matchability of the compound was performed (see Figure 10). However, these measurements did not yield a clear result because the perfect cleavage of the crystal impeded the preparation of a powder with isometric particles and, therefore, the precise control of the effective particle size.

4. Conclusions

Two cocrystals based on hydrogen-bonded molecules of 2-aminopyrimidine and boric acid, non-centrosymmetric (2-AMP)3(H3BO3)2 and centrosymmetric 2-AMP(H3BO3)2, were prepared and characterized. The formation of these products as cocrystals containing neutral molecules of 2-aminopyrimidine (pKa = 3.54 [36]) and boric acid (pKa(1) = 9.24 [37]) is consistent with the “pKa rule” previously presented for extensive sets of acid–base crystalline complexes [38]. The obtained cocrystals belong to “zone 1”, fulfilling ΔpKa < –1 condition.
The crystal structure of (2-AMP)3(H3BO3)2 consists of twisted 2D layers formed by isolated 2-aminopyrimidine and boric acid molecules interconnected by the system of O–H…N and N–H…O hydrogen bonds. The ribbons of boric acid molecules, formed via O–H…O hydrogen bonds, are present in the crystal structure of 2-AMP(H3BO3)2. These ribbons are interconnected by isolated 2-aminopyrimidine molecules (via O–H…N and N–H…O hydrogen bonds) and form a complex 3D crystal structure.
The overall character of the recorded vibrational spectra is consistent with the results from the crystal structure determination, and they were assigned according to quantum-chemical computations. The IR spectrum of 2-AMP(H3BO3)2 contains characteristic strong- to medium-intensity bands resulting from the vibrational modes of boric acid molecules interconnected by O–H…O hydrogen bonds. Both Raman spectra exhibit a very strong sharp band associated with manifestations of mixed modes of boric acid and aminopyrimidine ring at approximately 880 cm−1.
Although for crystals of (2-AMP)3(H3BO3)2 the refractive indices and the considerable birefringence could perhaps allow collinear SHG phase matching of type II close to the UV absorption edge, the mechanical softness and the perfect cleavage spoils the quality of the crystals obtained from crystal growth and rules out the preparation of high-quality samples. This discourages the use of (2-AMP)3(H3BO3)2 crystals for technical applications. However, this newly discovered cocrystal of 2-aminopyrimidine with boric acid investigated in the present work provides a good example of the effectiveness of the crystal engineering approach that aimed to preserve the neutral 2-aminopyrimidine molecule (because of the amount of its total hyperpolarizability [1]) in a crystal structure with suitable (non-centrosymmetric) symmetry.

Supplementary Materials

The following are available online at https://www.mdpi.com/2073-4352/9/8/403/s1, Figure S1. The comparison of recorded powder diffraction patterns of (2-AMP)3(H3BO3)2 (a), 2-AMP(H3BO3)2 (b), boric acid (c) and 2-aminopyrimidine (d)., Figure S2. The comparison of recorded (298 K) powder diffraction pattern of (2-AMP)3(H3BO3)2 with theoretical diffraction pattern (red lines) calculated from single-crystal X-ray diffraction data (150 K)., Table S1. Experimental powder diffraction data for (2-AMP)3(H3BO3)2, Table S2. Experimental powder diffraction data for 2-AMP(H3BO3)2, Table S3. Calculated and recorded vibrational frequencies (cm-1) of 2-aminopyrimidine, Table S4. Selected bond lengths [Å] and angles [°] for (2-AMP)3(H3BO3)2, Table S5. Selected bond lengths [Å] and angles [°] for 2-AMP(H3BO3)2, Figure S3. The comparison of recorder IR spectra (compiled from nujol and fluorolube mulls) of (2-AMP)3(H3BO3)2 (a), 2-AMP(H3BO3)2 (b) and boric acid (c)., Figure S4. The comparison of calculated (CRYSTAL17 program) vibrational modes (red lines) with recorded IR spectrum (compiled from nujol and fluorolube mulls) of (2-AMP)3(H3BO3)2, Figure S5. The comparison of calculated (CRYSTAL17 program) vibrational modes (green lines) with recorded Raman spectrum of (2-AMP)3(H3BO3)2, Figure S6. The UV-Vis spectrum of polycrystalline (2-AMP)3(H3BO3)2.

Author Contributions

Conceptualization, I.N., I.M., P.B., and L.B.; methodology, I.N., I.M., P.B., L.B., and P.N.; investigation, M.K., I.M., I.C., P.B., L.B., P.N., R.G., and I.N.; resources, I.N., P.B., and L.B.; writing—original draft preparation, I.N., M.K., I.M., I.C., P.B., L.B., P.N., and R.G.; writing—review and editing, I.N., P.B., and L.B.; visualization, M.K., I.M., P.B., L.B., and I.N.; supervision, I.N.

Funding

Financial support from the CUCAM Centre of Excellence (OP VVV “Excellent Research Teams” project No. CZ.02.1.01/0.0/0.0/15_003/0000417) and Charles University Research Centre program No. UNCE/SCI/014 is gratefully acknowledged.

Conflicts of Interest

The authors declare no conflict of interest.

References

  1. Němec, P.; Pasztor, F.; Brajer, M.; Němec, I. Spectrally- and polarization-resolved hyper-Rayleigh scattering measurements with polarization-insensitive detection. Opt. Commun. 2017, 388, 21–28. [Google Scholar] [CrossRef]
  2. Kaminskii, A.A.; Becker, P.; Rhee, H.; Lux, O.; Kaltenbach, A.; Eichler, H.J.; Shirakawa, A.; Yoneda, H.; Němec, I.; Fridrichová, M.; et al. Stimulated Raman scattering in monoclinic non-centrosymmetric guanylurea(1+) hydrogen phosphite (GUHP). Phys. Status Solidi (B) 2013, 250, 1837–1856. [Google Scholar] [CrossRef]
  3. Kaminskii, A.A.; Rhee, H.; Eichler, H.J.; Lux, O.; Němec, I.; Yoneda, H.; Shirakawa, A.; Becker, P.; Bohatý, L. Observation of stimulated Raman scattering in polar tetragonal crystals of barium antimony tartrate trihydrate, Ba[Sb2((+)C4H2O6)2]·3H2O. Ann. Phys. 2017, 529. [Google Scholar] [CrossRef]
  4. Chen, C.; Sasaki, T.; Li, R.; Wu, Y.; Lin, Z.; Mori, Y.; Hu, Z.; Wang, J.; Aka, G.; Yoshimura, M.; et al. Nonlinear Optical Borate Crystals; Wiley-VCH Verlag&Co. KGaA: Weinheim, Germany, 2012. [Google Scholar]
  5. Ilczyszyn, M.M. Vibrational studies of the ferroelastic crystal—Betaine borate. Part I. Vibrational investigation of the paraelastic phase. J. Mol. Struct. 2000, 519, 257–274. [Google Scholar] [CrossRef]
  6. Ilczyszyn, M.M. Vibrational studies of the ferroelastic crystal—Betaine borate. Part II. Vibrational investigations of the paraelastic-ferroelastic phase transition. J. Mol. Struct. 2000, 519, 275–296. [Google Scholar] [CrossRef]
  7. Panicker, C.Y.; Varghese, H.T.; John, A.; Philip, D.; Nogueira, H.I.S. Vibrational spectra of melamine diborate, C3N6H62H3BO3. Spectrochim. Acta A 2002, 58, 1545–1551. [Google Scholar] [CrossRef]
  8. Wang, K.; Duan, D.F.; Wang, R.; Lin, A.L.; Cui, Q.L.; Liu, B.B.; Cui, T.; Zou, B.; Zhang, X.; Hu, J.Z.; et al. Stability of Hydrogen-Bonded Supramolecular Architecture under High Pressure Conditions: Pressure-Induced Amorphization in Melamine-Boric Acid Adduct. Langmuir 2009, 25, 4787–4791. [Google Scholar] [CrossRef] [PubMed]
  9. Aarthi, J.; Gowri, S.; Dilip, C.S. A new metal-organic hybrid crystal with excellent transparency in the visible spectrum: Growth, structure and properties of sodium fumarate—Boric acid tetrahydrate. J. Mol. Struct. 2019, 1181, 660–667. [Google Scholar] [CrossRef]
  10. Rajasekar, G.; Dhatchaiyini, M.K.; Vinitha, G.; Bhaskaran, A. Structural, optical, dielectric, second and third-order nonlinear properties of new semiorganic crystal: Sodium (bis) boro succinate. J. Mol. Struct. 2019, 1177, 594–602. [Google Scholar] [CrossRef]
  11. Bharthasarathi, T.; Arulmozhichelvan, P.; Murugakoothan, P. Crystal growth, thermal and optical studies on a metalorganic nonlinear optical material dipotassium boro maleate (DKBM). Mat. Lett. 2010, 64, 1506–1509. [Google Scholar] [CrossRef]
  12. Dhanuskodi, S.; Mary, P.A.A. Growth and characterization of a new nonlinear optical crystal-ammonium borodilactate. J. Cryst. Growth 2003, 253, 424–428. [Google Scholar] [CrossRef]
  13. Dhanuskodi, S.; Vasantha, K. X-ray diffraction, spectroscopic and thermal studies on a potential semiorganic NLO material: Lithium bis-L-malato borate. Spectrochim. Acta A 2005, 61, 1777–1782. [Google Scholar] [CrossRef] [PubMed]
  14. Mary, S.S.; Kirupavathy, S.S.; Gopalakrishnan, R. Theoretical and experimental analysis on spectral, hyperpolarizibility and dielectric properties of semi-organic nonlinear optical crystal: Potassium boromalate hydrate (PBH). Optik 2014, 125, 3837–3843. [Google Scholar] [CrossRef]
  15. Kurtz, S.K.; Perry, T.T. A powder technique for evaluation of nonlinear optical materials. J. Appl. Phys. 1968, 39, 3798–3814. [Google Scholar] [CrossRef]
  16. Rodrigues-Carvajal, J.; Roisnel, T. FullProf. 98 and WinPLOTR New Windows 95/NT Applications for Diffraction; International Union for Crystallography: Chester, UK, 1998; pp. 35–36. [Google Scholar]
  17. Spek, A.L. Single-crystal structure validation with the program PLATON. J. Appl. Crystallogr. 2003, 36, 7–13. [Google Scholar] [CrossRef]
  18. Blessing, R.H. An empirical correction for absorption anisotropy. Acta Crystallogr. A 1995, 51, 33–38. [Google Scholar] [CrossRef] [PubMed]
  19. Sheldrick, G.M. A short history of SHELX. Acta Crystallogr. A 2008, 64, 112–122. [Google Scholar] [CrossRef]
  20. Sheldrick, G.M. Crystal structure refinement with SHELXL. Acta Crystallogr. C 2015, 71, 3–8. [Google Scholar] [CrossRef]
  21. Frisch, M.J.; Trucks, G.W.; Schlegel, H.B.; Scuseria, G.E.; Robb, M.A.; Cheeseman, J.R.; Scalmani, G.; Barone, V.; Mennucci, B.; Petersson, G.A.; et al. Gaussian 09W, Revision D.01; Gaussian Inc.: Wallingford, CT, USA, 2013. [Google Scholar]
  22. Michalska, D.; Wysokinski, R. The prediction of Raman spectra of platinum(II) anticancer drugs by density functional theory. Chem. Phys. Lett. 2005, 403, 211–217. [Google Scholar] [CrossRef]
  23. Dennington, R.; Keith, T.; Millam, J. GaussView Version 5.0.8; Semichem Inc.: Shawnee Mission, KS, USA, 2009. [Google Scholar]
  24. Merrick, J.P.; Moran, D.; Radom, L. An evaluation of harmonic vibrational frequency scale factors. J. Phys. Chem. A 2007, 111, 11683–11700. [Google Scholar] [CrossRef]
  25. Yoshida, H.; Ehara, A.; Matsuura, H. Density functional vibrational analysis using wavenumber-linear scale factors. Chem. Phys. Lett. 2000, 325, 477–483. [Google Scholar] [CrossRef]
  26. Dovesi, R.; Orlando, R.; Erba, A.; Zicovich-Wilson, C.M.; Civalleri, B.; Casassa, S.; Maschio, L.; Ferrabone, M.; De La Pierre, M.; D’Arco, P.; et al. CRYSTAL14: A Program for the Ab Initio Investigation of Crystalline Solids. Int. J. Quantum Chem. 2014, 114, 1287–1317. [Google Scholar] [CrossRef]
  27. Valenzano, L.; Torres, F.J.; Doll, K.; Pascale, F.; Zicovich-Wilson, C.M.; Dovesi, R. Ab Initio study of the vibrational spectrum and related properties of crystalline compounds; the case of CaCO3 calcite. Z. Phys. Chem. 2006, 220, 893–912. [Google Scholar] [CrossRef]
  28. Ferrero, M.; Rerat, M.; Orlando, R.; Dovesi, R. Coupled perturbed Hartree-Fock for periodic systems: The role of symmetry and related computational aspects. J. Chem. Phys. 2008, 128. [Google Scholar] [CrossRef]
  29. Ferrero, M.; Rerat, M.; Orlando, R.; Dovesi, R. The calculation of static polarizabilities of 1–3D periodic compounds. The implementation in the CRYSTAL code. J. Comput. Chem. 2008, 29, 1450–1459. [Google Scholar] [CrossRef]
  30. Becker, P.; Held, P.; Liebertz, J.; Bohatý, L. Optical properties of the germanate melilites Sr2MgGe2O7, Sr2ZnGe2O7 and Ba2ZnGe2O7. Cryst. Res. Technol. 2009, 44, 603–612. [Google Scholar] [CrossRef]
  31. Rousseau, D.L.; Bauman, R.P.; Porto, S.P.S. Normal mode determination in crystals. J. Raman Spectr. 1981, 10, 253–290. [Google Scholar] [CrossRef]
  32. Da Silva, M.B.; Santos, R.C.R.; Hernandez, J.S.R.; Caetano, E.W.S.; Freire, V.N. Vibrational modes and phonon and thermodynamic properties of the metaboric acid polymorphs alpha-, beta-, and gamma-(BOH)(3)O-3 within a density functional theory framework. J. Phys. Chem. A 2018, 122, 7628–7645. [Google Scholar] [CrossRef]
  33. Novak, A. Hydrogen bonding in solids correlation of spectroscopic and crystallographic data. In Large Molecules. Structure and Bonding; Springer: Berlin, Germany, 1974; Volume 18, pp. 177–216. [Google Scholar]
  34. Lautie, A.; Froment, F.; Novak, A. Relationship between NH stretching frequencies and N...O distances of crystals containing NH...O hydrogen-bonds. Spectrosc. Lett. 1976, 9, 289–299. [Google Scholar] [CrossRef]
  35. Ghosh, G. Dispersion-equation coefficients for the refractive index and birefringence of calcite and quartz crystals. Opt. Commun. 1990, 163, 95–102. [Google Scholar] [CrossRef]
  36. Albert, A.; Goldacre, R.; Phillips, J. The strength of heterocyclic bases. J. Chem. Soc. 1948, 2240–2249. [Google Scholar] [CrossRef]
  37. Smith, R.M.; Martell, A.E. Critical Stability Constants; Plenum Press: New York, NY, USA, 1976; Volume 4, p. 25. [Google Scholar]
  38. Cruz-Cabeza, A.J. Acid–base crystalline complexes and the pKa rule. CrystEngComm 2012, 14, 6362–6365. [Google Scholar] [CrossRef]
Figure 1. (a) Example of cleaved plates of grown crystals of (2-AMP)3(H3BO3)2. (b) Typical, idealized morphology of the trigonal crystals of (2-AMP)3(H3BO3)2, shown in (a).
Crystals 09 00403 g001
Figure 2. ORTEP plot of the asymmetric unit of (2-AMP)3(H3BO3)2 with atom numbering. The displacement parameters are shown at the 50% probability level.
Crystals 09 00403 g002
Figure 3. Packing scheme of (2-AMP)3(H3BO3)2—simplified projection of the ab plane displaying only one layer of the crystal structure. Dashed lines indicate hydrogen bonds.
Crystals 09 00403 g003
Figure 4. ORTEP plot of the asymmetric unit of 2-AMP(H3BO3)2 with atom numbering. The displacement parameters are shown at the 50% probability level.
Crystals 09 00403 g004
Figure 5. Packing scheme of the 2-AMP(H3BO3)2—projection is on the bc plane. Dashed lines indicate hydrogen bonds.
Crystals 09 00403 g005
Figure 6. Comparison of crystal packing between (2-AMP)3(H3BO3)2 (a) and 2-AMP(H3BO3)2 (b). Dashed lines indicate hydrogen bonds.
Crystals 09 00403 g006
Figure 7. FTIR (compiled from nujol and fluorolube mulls) and FT Raman spectra of (2-AMP)3(H3BO3)2.
Crystals 09 00403 g007
Figure 8. FTIR (compiled from nujol and fluorolube mulls) and FT Raman spectra of 2-AMP(H3BO3)2.
Crystals 09 00403 g008
Figure 9. (a) Interference figure of a (001) plate of (2-AMP)3(H3BO3)2, taken with a polarizing microscope in conoscopic illumination with crossed polarizers, using monochromatic (546.7 nm) light and a quarter-wave plate between the crystal and the analyzer. The spirals in the interference figure indicate a levo-rotatory optical activity of the used crystal of (2-AMP)3(H3BO3)2. Note, that dextro-rotatory crystals occur with equal probability during crystal growth. (b) Principal refractive indices no and ne of trigonal (2-AMP)3(H3BO3)2 and their wavelength dispersion. Measured data are indicated by dots (with given error bars), the line for no indicates the fitting curve with a Sellmeier-type equation (see text). The dashed line connecting the two data points of ne is a guide to the eye.
Crystals 09 00403 g009
Figure 10. Observed dependence of second harmonic generation (SHG) intensity (using 800 nm fundamental laser line) on particle size for (2-AMP)3(H3BO3)2.
Crystals 09 00403 g010
Table 1. Crystal data and structure refinement details of the studied cocrystals.
Identification code(2-AMP)3(H3BO3)22-AMP(H3BO3)2
Empirical formulaC12H21B2N9O6C4H11B2N3O6
Formula weight409.00218.78
Temperature (K)150(2)150(2)
a (Å)13.1632(4)3.7634(2)
b (Å)13.1632(4)13.8978(7)
c (Å)9.9288(3)18.2041(8)
α (°)9090
β (°)9091.757(2)
γ (°)12090
Volume (Å3)1489.88(10)951.68(8)
Z34
Calculated density (Mg/m3)1.3681.527
Crystal systemTrigonalMonoclinic
Space groupP3221C2/c
Absoption coefficient (mm-1)0.108 mm−10.134 mm−1
F(000)642456
Crystal size (mm)0.60 × 0.57 × 0.310.58 × 0.17 × 0.16
Diffractometer and radiationNonius Kappa CCD, Mo λ = 0.71073 Å
Scan techniqueω and ψ scans to fill the Ewald sphere
Completeness to θ99.9%99.9%
Range of h, k and l−17→17,
−17→17,
−12→12
−4→3,
−18→18,
−20→23
θ Range for data collection (°)1.79–27.47°2.24–27.48°
Refl. collected/unique (Rint)26047/2287 (0.022)7829/1097 (0.019)
No. of observed reflections2216997
Criterion for observed reflectionsI > 2σ(I)
Absorption correctionmulti-scanmulti-scan
Function minimizedΣ w(Fo2 - Fc2)2
Parameters refined13470
R; wR(F2) (I>2σ(I))0.0267; 0.07520.0293; 0.0769
R; wR(F2) (all data)0.0280; 0.07640.0326; 0.0791
Value of S1.0741.080
Absolut struct. param. (Flack)-0.1(2)
Δρmax and Δρmin (eÅ−3)0.17 and −0.160.18 and –0.19
Weighting schemeW = [σ2(Fo2) + aP2 + bP]−1
P = (Fo2 + 2Fc2)/3
a = 0.0491a = 0.0418
b = 0.1274b = 0.4767
Table 2. Results of the nuclear site group analysis of (2-AMP)3(H3BO3)2 and 2-AMP(H3BO3)2 crystals.
Compound(2-AMP)3(H3BO3)22-AMP(H3BO3)2
P 3 2 21   ( D 3 6 ) C 2 / c   ( C 2 h 6 )
RepresentationsA1A2EAgAuBgBu
Acoustic 11 1 2
External modesTranslational77144353
Librational78154455
Internal modes 596112029293131
Total737715037374141
ActivityIR zx, y x y, z
Ramanαxxyy, αzz xxxyyxxyy), (αxzyyzx)αxxyyzz, αxy αxzyz
Table 3. Recorded FTIR and FT Raman maxima (cm−1) of (2-AMP)3(H3BO3)2 and their assignment.
IRRamanAssignmentIRRamanAssignment
174wγrg, γC-NH21416m νBO, δBOH
409wδNCN1446w δCH, νrg, δNCN
460m460wγrg1467m νC-NH2, δNH2, δNCN, νBO,
513w518wτNH2, δOBO, δBOH1493s δBOH
546w γCH, γrg, δOBO, δBOH1510sh
597wδrg, δNCN1568s νrg, δrg, δNCN, ρNH2, δCH
657w657w 1592m1589wδNH2, νC-NH2, νrg
670w γBO31652m
693w ?1664m1660w
760w γBO3, γXH(…X)2364w ?
779w γCH, γBO3, γXH(…X)2418w
817w818wγrg, γCN3, γBO32641w
874w877vsδBO3, γBO3, νsrg, δsrg2700w
981wγCH3012s3012wνOH(…N), νCH
1008wνrg, δrg3030s3033w
1050w1050wρNH2, δCH3060sb νOH(…N)
1080w1081sδCH, νrg3100sh3102wνOH(…N), νCH
1131w1131wδCH, ρNH2 3140w
1185sh ?3205s3200wbνNH(…O)
1196m νBO, δBOH3345s
1233m νrg, δrg, ρNH23378m
1362m1365wδCH, νC-NH2
Table 4. Recorded FTIR and FT Raman maxima (cm−1) of 2-AMP(H3BO3)2 and their assignment.
IRRamanAssignmentIRRamanAssignment
195wexternal mode1212m νrg, δrg, ρNH2
406w408wδNCN1244m νrg, δrg, ρNH2, νBO, δBOH
446m451wγrg1319m1319wδCH, ρNH2
482wδOBO, δBOH1359m1360wδCH, νC-NH2
515w τNH2, δOBO, δBOH1421s νBO, δBOH
524w520w 1468s νC-NH2, δNH2, δNCN, νBO,
537w γCH, γrg, δOBO, δBOH1501s1496wδBOH
601wδrg, δNCN1582s νrg, δrg, δNCN, ρNH2, δCH
623w 1599m1600mδNH2, νC-NH2, νrg
658m661wδrg, δNCN, γBO31629s1626m
726m γBO3, γXH(…X)2263m ?
777m γCH, γBO32313m
794m 2410m
821m816wγrg, γCN3, γBO33000sb3020wνOH(…N), νCH
870m879vsδBO3, γBO3, νsrg, δsrg 3047wνCH
990wγCH3124sh3124m
1022mνrg, δrg 3159wνOH(…O)
1087m1089mδCH, νrg3230sb3220w
1135m1128wδCH, ρNH23350s νOH(…N), νNH(…O)
1174s1180wδCH, ρNH2, νBO, δBOH3480m
Abbreviations and Greek symbols used for vibrational modes: rg, ring; s, symmetric; ν, stretching; δ, deformation or in-plane bending; γ, out-of-plane bending; ρ, rocking; ω, wagging; τ, twisting; and X = N, O.

