Abstract
The corrosion and mechanical response produced by quenching in the welded joint of a new Nb-doped stainless steel designed by the CALPHAD method and produced by open-atmosphere casting with recycled materials were investigated to contribute to the circular economy and to establish disruptive manufacturing criteria based on metallurgical principles. The steel was initially subjected to solubilization heat treatment and partial solubilization treatment at 1090 °C to obtain an appropriate α/γ balance and carbide solubilization. It was then welded by the SMAW process, quenched, and tempered at three different cooling rates. As a result, a good fit between the phases predicted by the CALPHAD method and those observed by X-ray diffraction and scanning electron microscopy were obtained, with minor differences attributable to the precipitation and diffusion kinetics required for dissolution or nucleation and growth of the phases in the system. The forced air quenching mechanism was identified as providing an α/γ phase equilibrium equivalent to 62/38 as the most effective quenching method for achieving the optimum mechanical and corrosion response, even with the post-weld σ phase and showing superior results to those of the base metal. The outstanding mechanical and corrosion responses resulted from a proper balance of the primary phases in the duplex steel with a precipitation-strengthening mechanism. The damage tolerance obtained by forced air quenching was superior to that obtained by water and air quenching, with a PSE of 24.71 GPa% post-welding.
1. Introduction
Duplex stainless steels (DSS) are key structural materials for highly demanding industrial sectors such as chemical, petrochemical, desalinization, pulp and paper, and the power industry [1,2,3,4,5]. These materials combine high mechanical response and excellent corrosion resistance, mainly due to their biphasic microstructure of austenite (γ) and ferrite (δ) in a proportion close to 50% of each phase [6,7]. However, fusion welding processes, often involved in producing industrial equipment and its maintenance, promote microstructural changes that may alter these alloys’ mechanical properties and corrosion behavior [8,9,10]. Moreover, the existence of non-metallic inclusions, Cr carbides (sensitization), and intermetallic phases (σ, χ, and Laves phase), commonly obtained during the welding procedure, increases the driving force for pitting formation in combination with intergranular corrosion [11,12]. In particular, the heat input of the welding process affects the balance between the austenite and the ferrite, producing the segregation of elements and precipitation of secondary phases. For instance, a low heat input during the welding process would produce ferritization leading to the precipitation of Cr2N [2] due to the low miscibility of N in ferrite. On the other hand, a high heat input during the welding process would increase the diffusion kinetics promoting the stability of precipitates such as the σ phase, χ phase, Cr2N, Cr23C6, and Cr7C3, which would decrease the localized corrosion resistance [2]. Due to the sensitivity of the effect of heat input during the welding process, it should be limited to reduce the adverse effects in DSS materials between 0.5–2 kJ/mm and in SDSS between 0.5–1.5 kJ/mm [2].
The corrosion effect arises from corrosive substances on the alloy surface. The contact area initiates an aggressive chemical reaction, leading to localized sensitization, which promotes metal dissolution. These effects result in significant industrial damage, especially when the microstructure is metallurgically sensitized due to processes like welding, which profoundly influence phase transformation. Additionally, welding induces damage, including the production of microcracks and residual stresses. A notable industrial example is the work of Tavares et al. [13], who analyzed ductile fissure failure in the welding metal zone. The damage was caused by an excess of ferrite with intense Cr2N precipitation, creating an imbalance and potential difference that enhanced corrosion and mechanical damage. Similarly, Yang et al. [14] investigated a reactor failure due to intercolumnar cracks caused by solidification during shielded metal arc welding (SMAW) on duplex stainless steel (DSS). This failure was attributed to cooling, which facilitated an 85% ferrite formation in the metal.
Several authors indicate that the best DSS performance occurs when the volume fraction of significant phases (δ/γ) is in a 50/50 ratio [2,5,6]. Nevertheless, such a narrow phase balance may not achieve the best mechanical and corrosion behavior for heavy alloyed super duplex stainless steels (SDSS) and hyper duplex stainless steels (HDSS), because secondary phases play a fundamental role in the mechanical and corrosion behavior. This statement is consistent with the findings obtained by Ha et al. [15], who found that in a duplex stainless steel, UNS S32205, the highest corrosion resistance occurred for a 57% ferrite fraction approaching a main phase fraction δ/γ 60/40. Therefore, duplex stainless steel’s optimum mechanical and corrosion characteristics are not always obtained for the δ/γ 50/50 phase fraction. The use of scrap from the steel industry for steel production has increased during the last few years due to the high demand for steel worldwide [16,17,18]. An example is the sustained increase in stainless steel, with a growth rate of 5.33% per year [19]. However, its use has not been deeply explored in the fabrication of stainless steels, and its microstructural and functional study in the structural application is reduced [16]. Examples of the production process of stainless steels based on scrap are detailed by Holappa et al. [19], where it is detailed that ordinary recycled steel and additions of ferroalloys such as FeCr, FeMo, and FeNi are used. However, the production process is carried out under controlled atmosphere processes or undergoes decarburization processes. These processes make the steel more expensive and make production logistics more challenging.
Welding parameters such as welding speed, temperature, and cooling rate are crucial in the joining processes of stainless materials [20,21,22,23]. If these parameters are not adequately controlled, the welding process can induce ferritization and intermetallic phase transformations, such as the sigma phase, leading to material sensitization due to potential differences, thereby increasing susceptibility to corrosive damage [21]. Among the parameters mentioned, the cooling rate is one of the most significant factors in achieving the desired microstructure for optimal functional performance during service. Rapid cooling rates are known to increase the likelihood of generating Cr2N, while slower cooling rates can trigger phase transformations, such as the sigma or chi phases, through diffusional mechanisms [20,21]. The study of the effects of welding on duplex stainless steels is extremely important for the industry due to the sensitization it causes in the material, promoting corrosion damage [24,25,26,27].
One of the parameters for assessing sigma phase precipitation is microhardness. This is demonstrated by Putz et al. [28] obtained that the hardness in UNS S32205 duplex steel by four-layer deposition welding was 300 HV. They analyzed the change in hardness upon electric arc heat treatment and observed that harnesses close to 230 HV were obtained in nitrogen-depleted zones. However, the highest hardness values were found next to the depleted zone, reaching 471 HV for a heat treatment duration of 60 min. The temperature reached by the heat treatment in the contact zone was higher than 1400 °C, decreasing as the distance increased from the contact center towards the periphery, reaching 300 °C for a 7 mm radius. The observed increase in hardness was attributed to the sigma phase and ferrite fraction, which was consistent with N impoverishment of the surrounding zones, providing sigma precipitation by CrN and Cr2N. Souza et al. [29] evaluated the mechanical behavior of a UNS S31803 stainless steel welded by MIG/MAG finding hardness values between 235 and 295 HV. These results indicated a higher homogeneity of the phases with controlled metallurgical distortion. Hardness in duplex steels is restricted to limit values after welding to avoid embrittlement. ANSI/NACE MR0103-2012 [30] states that the maximum allowable hardness should be 35 HRC (345.45 HV). On the other hand, ANSI/NACE MR0175 [31] indicates that the maximum allowable hardness should be 28 HRC (286.43 HV) in base metal.
The novelty of the present work is to deepen the understanding of the kinetic mechanisms after the hardening process of welded samples and how these impact the microstructure, altering its corrosion and mechanical response. In the same way, the research work is developed on a new SDSS alloy fabricated in an open atmosphere.
Consequently, it is necessary to deepen the feasibility of production processes of stainless steels based on scrap with functional characteristics and rigorous characterization of their corrosion and mechanical response, enhancing the circular economy at the industrial level. Further studies are required to determine the main factors governing the corrosion response and mechanical properties in DSS and SDSS. In addition, suitable cooling rates for welded joints by the SMAW method in structural components are unknown, which significantly influences the mechanical response and corrosion behavior due to changes in phase volume fraction, precipitation of secondary phases, and segregation, among others. Based on the previous background, this research aims to estimate the influence of cooling rates on the corrosion resistance and mechanical performance after the SMAW process on a high-carbon super duplex stainless steel stabilized by Nb. To achieve the proposed objective, a microstructural analysis was performed using CALPHAD computational simulation and correlated by a complete microstructural characterization of the welding joint. Furthermore, the corrosion response was studied by cyclic potentiodynamic polarization in a 3.5% NaCl solution at 40 and 70 °C, respectively. Finally, the mechanical behavior was investigated by microhardness and quasi-static uniaxial tensile test.
2. Methodology
The alloy was designed based on physical metallurgical principles supported by Thermo-Calc modeling using the TCFe-8 database to obtain a super duplex stainless steel. The alloy was produced by induction melting in the open air, based on a scrap shaft of 329 DSS as base material aiming for metallic waste valorization, plus the addition of ferroalloy elements, such as FeCr, FeNb, Mn, Ni, FeMo, and FeSi. The mass balance resulting from the Thermo-Calc design is shown in Table 1. The raw materials for the melting were dried at 70 °C for 24 h to remove moisture before casting. The chemical composition of the resulting alloy is detailed in Table 2, which was obtained by optical emission spectroscopy using SPECTROMAXX equipment.

Table 1.
Mass balance for free atmosphere melting.
Table 2.
Chemical composition wt.% of the alloy obtained.
The ingot obtained from casting with a mass of about 6 kg was cut into 2 cm pieces to be further processed by thermomechanical treatment. The thermomechanical treatment was carried out in a Nabertherm electric muffle furnace at a solubilization temperature of 1200 °C for 60 min. Subsequently, the samples were hot rolled in a JOLIOT symmetrical rolling mill until a 60% section reduction was obtained, followed by water quenching. Finally, a solution annealing heat treatment was performed at 1090 °C for 60 min on the rolled samples and then quenched in water at 15 °C. The temperature of 1090 °C in the heat treatment was obtained by CALPHAD simulation in Thermo-Calc.
The computational simulations were performed in Thermo-Calc using the chemical composition presented in Table 2, considering atmospheric pressure. Thermo-Calc simulations considered a phase diagram calculation, volume fractions of different phases at interest temperatures, and equilibrium point temperatures. Subsequently, to complement the computational simulation considering the thermal cycling caused by the welding process, simulations were performed in JMatPro V7.0 using the duplex stainless-steel database. The simulations performed in JMatPro consisted of Time-Temperature Transformation (TTT) and Continuous Cooling Transformation (CCT) diagrams, which were used to analyze the phase transformation during heat input in welding and subsequent phase transformation during quenching.
For the welding process, 3.5 cm × 3.5 cm × 1 cm plates were fabricated, which were joined by the SMAW method with E-2209-16 electrode due to the similar characteristics concerning the alloy, ensuring dilution during the process, and obtaining a homogeneous microstructure. The chemical composition of the electrode used can be seen in Table 3. A 65-degree bevel with a root of 2 mm and a separation of 3 mm was used to guarantee a good weld joint (see Figure 1). The current intensity in the welding process was 70 (A) with a voltage of 24 (V) for an electrode diameter of 2.5 mm. The welding feed rate used was 9 cm/min with an efficiency of 80%. The welding temperature reached 1100 °C measured by thermographic camera. The number of steps considered was 2 due to the thickness of the sample. The behavior of the microstructure sensitized by SMAW was analyzed according to AWS D1.1-6 for stainless steels with electrode E2209. The welded samples were processed by three types of quenching: water quenching, air quenching, and forced air quenching.
Table 3.
Chemical composition of consumable E2209-16 wt.%.
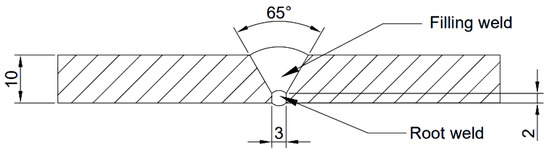
Figure 1.
Scheme of welded joint used in the investigated samples.
Sample preparation for microstructural characterization consisted of grinding using SiC sandpaper with mesh sizes from 240 to 1200. The samples were then polished in a Mecatech 264 metallographic polisher using diamond paste from 6 µm to 1 µm at a speed of 350 RPM for 4000 s. The samples were further polished in an alumina suspension with a particle size of 0.05 µm for 2000 s at 250 RPM. Finally, the samples were microstructurally developed using electrolytic etching using KOH—30% at a potential of 9V for 10 s.
The post-welding microstructure was analyzed by optical microscopy (OM) and scanning electron microscopy with an energy-dispersive X-ray spectrometer (SEM-EDS). Characterization by optical microscopy was performed on a Leica DMi8-M microscope using magnification between 100× and 1000×. Scanning electron microscopy was performed on a TESCAN VEGA 3 EASYPROBE SBU microscope with an accelerating voltage of 20 kV and a 10 mm working distance. The energy dispersive X-ray spectrometer was used to control the number of counts over 25,000 cps to maintain the representativeness of the results. The characterization of the phases present in the welded samples was performed by X-ray diffraction using a Cu Kα filter with a wavelength, = 1.5406 Å. The operating parameters were an accelerating voltage of 40 kV and a current of 20 mA. The diffraction angles were between 20° and 90° with analysis steps of 0.02° with a permanence of 1 s.
The corrosion tests were performed using a cell with a saturated Calomel reference electrode with 244 mV to a hydrogen electrode, a Pt-alloyed stainless steel auxiliary electrode, and the obtained alloy samples as working electrodes. The measurements were performed on a VersaStat three potentiostat with a PolyScience thermostat. The time for each point is 1 s with an open circuit duration of 1000 s. Pitting corrosion was evaluated by a cyclic potentiodynamic polarization test in an aggressive 3.5% NaCl medium using ASTM G-61.
The mechanical characterization considered microhardness measurements and uniaxial tensile tests. The Vickers microhardness tests were performed with a load of 300 g in the base metal area, heat-affected zone, and melting zone. ASTM E8 performed the quasi-static tensile test on specimens with a cross-section in the calibrated section of 7 mm × 4 mm using a 1 mm/min speed in an Instron 8801 universal testing machine with a 100 kN load cell.
3. Results and Discussion
3.1. Thermochemical Simulation Using the CALPHAD Method
For better and simplified naming, the produced alloy was identified as SDSS-Nb (see chemical composition in Table 2). The thermodynamic equilibrium calculations of the phases present in the SDSS-Nb alloy were modeled using Thermo-Calc with the TCFE-8 module, obtaining the phases diagram (T° vs. %C). Figure 2 shows the alloy present below 1000 °C, the M23C6, σ, and Z phases. The M23C6 plays a crucial role in the material’s mechanical strength and in controlling the subgrain’s coarsening, even more so than the MX precipitates. Due to their reduced Gibbs, the free energy is highly stable, generating a high contribution to dislocation locking and creep resistance [32].
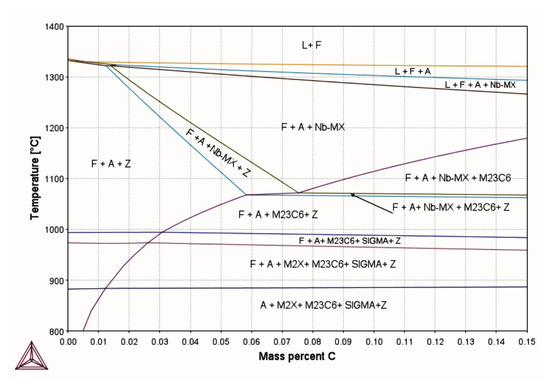
Figure 2.
Phase diagram of SDSS-Nb steel.
The σ phase in welded super duplex steels has a higher precipitation potential in the thermally affected zone for temperatures between 900 °C and 1000 °C due to the decrease in interfacial energy favoring nucleation in this zone, producing a reduction in energy absorption and embrittlement [33]. Figure 3a shows the volume fraction of the phases present in the SDSS-Nb alloy. The approximate fraction α/γ (50/50) is obtained for a temperature of 1040 °C, at which secondary phases are also present. Figure 3b shows the magnification of the volume fraction in the SDSS-Nb alloy. It can be observed that for a temperature of 1040 °C, the stable secondary phases are Cr23C6 carbides and the Z phase. It is also possible to see that for a temperature of 1090 °C, complete dissolution of the Cr23C6 carbides occurs, having its highest energetic stability at temperatures below 1070 °C. Table 4 shows the composition of each phase obtained from Figure 3 for a temperature of 1090 °C, resulting in increased stability between ferrite and austenite with Nb-MX precipitates at 0.223%.
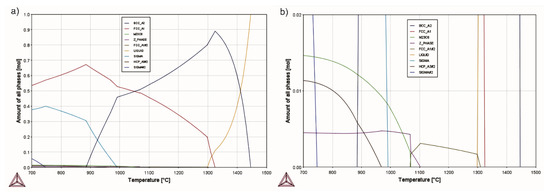
Figure 3.
Volume fraction plots of SDSS-Nb, (a) total volume fraction, and (b) volume fraction magnification in the M23C6 carbide dissolution zone.
Table 4.
ThermoCalc phase fraction simulation at temperature 1090 °C with chemical composition in wt.%.
The achieved results by thermochemical simulation in Thermo-Calc are complemented with the TTT and CCT phase transformation results obtained by JMatPro on the SDSS-Nb alloy. Figure 4 shows no σ phase formation at 1090 °C temperature. However, a stable volume fraction of M23C6 is equivalent to 0.13 wt.% is predicted. It can be determined from the TTT diagram (see Figure 4a) that the welding process would not produce σ phase precipitation because the welding time is less than 1 min in the samples. However, there is σ phase precipitation at approximately 1 wt.%. From Figure 4b, it is possible to determine the secondary phase precipitation during the cooling cycle for the different quenching mechanisms through the CCT diagram. It is possible to observe from the CCT diagram that quenching in water would not produce secondary phase precipitation. However, quenching in forced-air and natural-air will mainly produce σ and chi phase precipitation. The precipitation of the sigma phase will undoubtedly generate an alteration in the mechanical characteristics of the material. However, this alteration can be positive or negative depending on the fraction of the sigma phase present and its size.
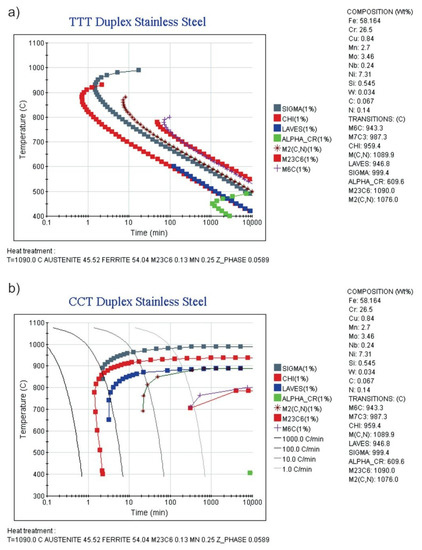
Figure 4.
CALPHAD simulation of the soldering process in SDSS-Nb; (a) TTT diagram for a temperature of 1090 °C; (b) CCT diagram for a temperature of 1090 °C.
To evaluate the formation of oxides during the welding process, an atmosphere of 0.03 wt.% oxygen was considered during the welding process to analyze the activation energy and temperature of oxide formation. The oxygen content used for the simulation is based on the typical ranges of oxygen in welding processes proposed by Dellam et al. [34] not to affect the welded joint’s toughness. These values are also considered in previous studies by Coetsee et al. [35]. The CALPHAD simulation developed in JMatPro resulted in the predominant formation of SiO2. It was found by the simulation that the onset of formation is at a temperature of 1200 °C with an activation energy of −399.677 (kJ/Mol). The SiO2 fraction increases dramatically until it reaches 940 °C and remains stable. Secondary oxides are formed at 370 °C and are mainly composed of Cr and Fe with an activation energy of −318.913 (kJ/mol). These results obtained will be corroborated by scanning electron microscopy with energy-dispersive X-ray spectroscopy to analyze the formation of oxides on the welded samples.
3.2. Optical Microscopy
Figure 5 shows that the optical microscopy (OM) images revealed a microstructure formed by a ferritic matrix with columnar austenite branching in the center of the sample (Figure 5a). These columnar branchings are produced due to the cooling rates obtained in the center of the sample. The microstructure obtained is characteristic of solidification in duplex alloys, starting from the primary ferrite, with nucleation of austenite from the solid in the ferritic matrix preferentially at the grain boundaries. This process occurs via a diffusion-controlled state, where Ni is expelled from the ferrite into the austenite, and Cr is rejected by the advancing interface, producing a Ni enrichment and Cr deficit in the austenite compared to the ferrite. Figure 5b shows the microstructure of the eutectoid decomposition resulting from slow cooling. Figure 5c,d show that the microstructure can be observed with a ferritic-austenitic microstructure after the thermomechanical treatment. It can be observed that the austenite is the elongated product of the rolling direction in an equal proportion with the ferrite. The phase ratio was analyzed using ImageJ software by the fraction of area used by each phase in the micrograph. The assay results indicated that the phases are in a proportion of 45% austenite and 55% ferrite, respectively. These results were further corroborated by thermodynamic simulation by CALPHAD in Thermo-Calc software, obtaining a volume fraction of 46.1% for austenite and 53.29% for ferrite at the temperature of 1090 °C, respectively (see Table 4).
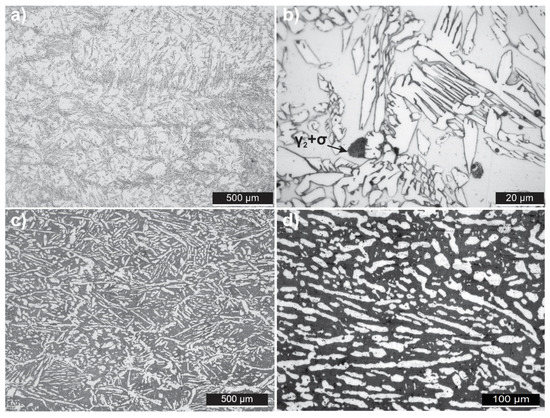
Figure 5.
Results obtained from optical microscopy on SDSS-Nb As-Cast and thermomechanical treatment; (a) SDSS-Nb As-Cast optical microscopy; (b) SDSS-Nb As-Cast optical microscopy; (c) SDSS-Nb optical microscopy with thermomechanical treatment; (d) SDSS-Nb optical microscopy with thermomechanical treatment.
Figure 5b, a transition zone δ→ + σ can be seen. The transition zone noted above is due to the enrichment of the Z phase with Cr, Si, and Mo from the ferrite, thus producing a decomposition of the matrix and the σ and phase is formed [36]. Additionally, the formation of M23C6 or MX carbides is possible due to the high segregation that can occur during the welding process and the activation of carbon diffusion to carbide stabilizing elements such as Cr and Nb. These are consistent with those obtained previously by CALPHAD simulation.
Figure 6 shows the microstructure in the HAZ zone–root weld bead of SDSS-Nb steel with different cooling conditions. Figure 6a shows the microstructure of SDSS-Nb steel cooled in air, Figure 6b shows the microstructure of forced air cooling, and Figure 6c shows the microstructure of water cooling. The change in the microstructure is evident, and its relation is direct to the type of cooling. Due to localized heat input, this change in the microstructure is because the welding process generates a phase transformation in the duplex steels, leading them to a ferritic state when reaching temperatures above 1250 °C [37].
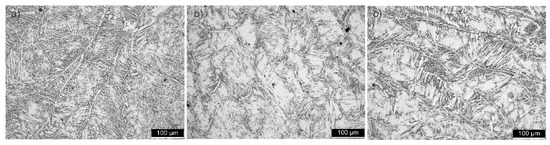
Figure 6.
Results obtained from optical microscopy on SDSS-Nb with SMAW process in the HAZ zone–root weld; (a) SDSS-Nb optical microscopy with air cooling; (b) SDSS-Nb optical microscopy with forced air cooling; (c) SDSS-Nb optical microscopy with water cooling.
Consequently, the austenite will reform again upon cooling, but its size and quantity depend mainly on the cooling rate. Therefore, a higher fraction of austenite can be observed in Figure 6a as it has been subjected to cooling in air. From Figure 6b,c, it can be deduced that the variation of the austenite fraction is due to the cooling process, highlighting, at first sight, the higher fraction of austenite in the sample cooled in forced air concerning the sample cooled in water.
The cooling rate also affected the stabilization of secondary phases. The high cooling rate of water had a remarkable ability to suppress the formation of secondary phases at lower temperatures than that produced by the thermal effect of the solder joint, such as the σ and γ2 phases. In contrast, air cooling generated a kinetic state suitable for long-range diffusion and mobility of chemical elements to zones of lower chemical potential [38], as is the mobility of Cr and Mo towards the χ or Z phase to subsequently form σ [10,36,39]. The above is visualized in Figure 7, corresponding to the air-cooled sample, where a structure of primary austenite, Widmanstatten austenite, and secondary austenite is found. The latter is due to the decomposition reaction of ferrite (δ→γ2 + σ) or austenite (γ→γ2 + σ) [38]. Therefore, it indicates sigma phase formation due to precipitation kinetics granted by natural cooling. These have two effects. Firstly, the controlled form precipitation of secondary phases during cooling will generate attractive mechanical reinforcement by increasing the yield stress and ultimate tensile strength. Secondly, the generation of Cr- and Mo-depleted zones will reduce corrosion resistance. The proportion of primary phases is also relevant since the mechanical and corrosion resistance depends directly on them, determined by the type of cooling used after welding. The corrosion resistance and mechanical response to the proposed cooling conditions will be evaluated later in this research.
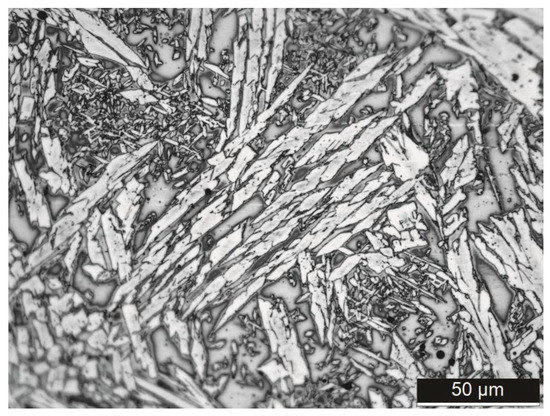
Figure 7.
Optical microscopy of the structure formed due to the thermal effect of soldering on the air-cooled SDSS-Nb sample.
The size of the HAZ zone was also quantified using the three types of cooling. The size was quantified using ImageJ software in Figure 8a–c, respectively. The results indicated that the samples cooled in the air show a larger size of the thermally affected zone, reaching 820 microns. On the other hand, as the cooling rate increases, the thermally affected zone becomes smaller and smaller. This result is demonstrated by the values obtained from the samples cooled in forced air, reaching only 589 microns in the thermally affected zone, while cooling in water reached a thermally affected zone of 271 microns. This phenomenon is due to the remaining diffusive effect during the cooling cycle, which is higher for the naturally cooled samples. The above results are presented in Table 5.
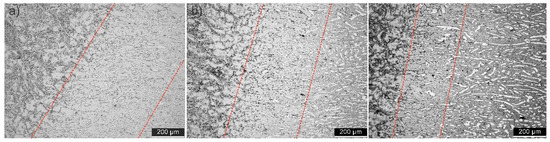
Figure 8.
Effect of cooling kinetics on the size of the thermally affected zone: (a) sample cooled in the air; (b) sample cooled in forced air; (c) sample cooled in water.
Table 5.
HAZ zone sizes were obtained in SDSS-Nb by optical microscopy in different cooling media.
The outcome obtained for each thermally affected zone further indicates a change in the mechanical and corrosion response of the alloy. This change in material response is due to the change in grain sizes, fraction of major phases, and content of secondary phases precipitating during the heating and cooling cycle. The detrimental phase transformations during these processes mainly produce mobility of Cr and Mo from the ferritic phase. Therefore, the ferritic phase content must be controlled to optimize the material’s mechanical and corrosion resistance. Our alloy’s main phase balance was quantified to indirectly analyze each cooling type’s effect on the material’s performance using ImageJ software. These results are presented in Table 6.
Table 6.
Fraction of ferrite obtained in the SDSS-Nb alloy according to its post-weld cooling method.
3.3. Scanning Electron Microscopy and Energy Dispersive X-ray Spectroscopy
Figure 9 corresponds to the SEM-EDS analysis of the air-cooled samples. Figure 9a shows the existence of precipitates mainly in the ferritic matrix produced by the thermal effect of welding. Zone (1) and zone (2) represent the EDS profiles corresponding to the austenite and ferrite (see Figure 9a,b), observing the presence of Cu and higher intensity of Ni in the austenite compared to the ferrite, while in the ferrite the intensity of Cr and Mo is increased. Zones (3) and (4) correspond to Mn oxide in the austenitic phase (see Figure 9d) and Mn sulfide (see Figure 9e). The summary of the chemical composition obtained for each analysis zone can be seen in Table 7. It can be seen that the oxides obtained are predominantly particle oxides. However, the oxides in zones 3 and 4 are film oxides. Film oxides are not recommended in the welded joint because these discontinuities would promote the formation of cracks [40].
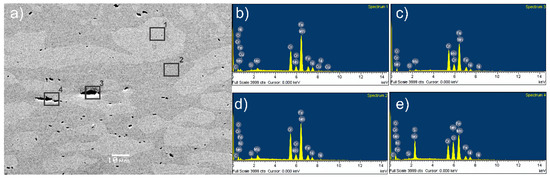
Figure 9.
SEM-EDS analysis of SDSS-Nb, (a) SEM image of SDSS-Nb air-cooled sample; (b) EDS zone 1 austenite; (c) EDS zone 2 ferrite; (d) EDS zone 3 Mn oxide; (e) EDS zone 4 Mn sulfide.
Table 7.
EDS analysis of the chemical composition of each phase in SDSS-Nb wt.% in the air-cooled sample.
Figure 10 shows the outcomes of the SEM-EDS characterization of the sample cooled in forced air. An austenitic–ferritic structure with the presence of oxides and precipitates can be seen. The EDS results indicate that the oxides are mainly silicon and chromium oxides (see Figure 10d,e). The detail of the chemical composition obtained by EDS of the zones analyzed in this sample can be seen in Table 8.
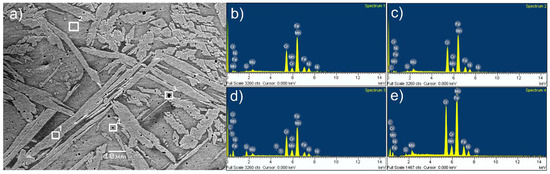
Figure 10.
SEM-EDS analysis of SDSS-Nb, (a) SEM image of SDSS-Nb forced-air-cooled sample; (b) EDS zone 1 austenite; (c) EDS zone 2 ferrite; (d) EDS zone 3 Si oxide; (e) EDS zone 4 Cr oxide.
Table 8.
EDS analysis of the chemical composition of each phase on SDSS-Nb wt.% in forced-air-cooled sample.
Figure 11 shows the SEM-EDS results obtained for the welded and water-cooled samples. The results indicate the presence of chromium and molybdenum oxides (see Figure 11d,e). The findings from the SEM-EDS characterization in Figure 11 are shown in Table 9.
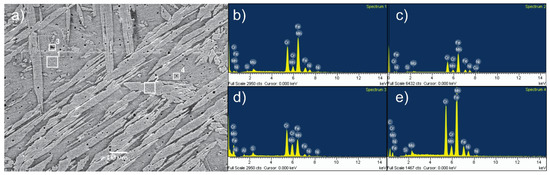
Figure 11.
SEM-EDS analysis of SDSS-Nb, (a) SEM image of SDSS-Nb water-cooled sample; (b) EDS zone 1 austenite; (c) EDS zone 2 ferrite; (d) EDS zone 3 Cr oxide; (e) EDS zone 4 Mo oxide.
Table 9.
EDS analysis of the chemical composition of each phase in SDSS-Nb wt.% in the water-cooled sample.
The oxides found in all the samples are particle-type with isolated film-type oxides. Therefore, the welded joint would not be significantly affected mechanically. The results presented above indicate a large distribution of oxide precipitates in the welded specimens, which increase in size as the cooling process provides a higher diffusion rate. It is important to highlight that as the size of the oxide particles increases, the resistance to fatigue conditions will be negatively influenced [41]. However, the mechanical response of the welded alloy can benefit from the formation of oxides by size and distribution. The above is based on mechanical reinforcement by precipitation. Therefore, if the metal oxides have a homogeneous distribution or adequate dispersion and reduced size, the shear stresses required to mobilize a dislocation anchored in the precipitate increase, favoring the mechanical response of the welded joint. The possible existence of this reinforcement generated by oxides is validated by Sun et al. [41]. They quantified the size of the oxides in 17-4PH stainless steel, which had a size range between 10 nm and 300 nm. Additionally, Terashima et al. [42] indicated that the size should be minimized to delay the possible failure events that the oxides could cause.
Figure 12 shows the metal base structure after the cooling process using different mechanisms investigated in this study. In Figure 12a, the sample quenched in water displays a clean microstructure with no apparent precipitation of the sigma phase. However, there are observed precipitates that are morphologically consistent with chromium nitrides (Cr2N) (see Figure 12a,d) [43]. This is reasonable since it is a rapid partitioning process in ferrite, leading to the instant formation of Cr2N [21]. Similarly, this nitride will enable sigma phase formation over time, as it is a preferential site for nucleation or diffusion-induced formation during slow cooling. This can be observed in Figure 12b, corresponding to the sample quenched in forced air. The precipitates in this case change, preferentially locating at the α/γ interface (see Figure 12e). These precipitates are morphologically consistent with the sigma phase [28,44], and the precipitation mechanism remains the same, as it occurs in the region with the highest diffusion rate (grain boundary) [20,28]. The sample cooled in the air (see Figure 12c), having a cooling mechanism with a wider diffusivity range, exhibits a greater capacity for sigma phase formation (see Figure 12c,f) [20].
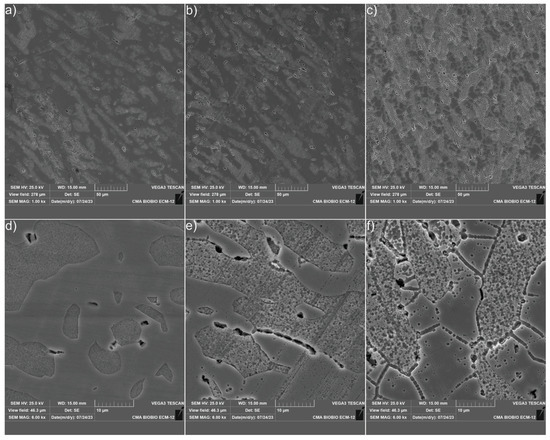
Figure 12.
SEM images of samples welded using different cooling mechanisms: (a) sample cooled in water at 1000× magnification; (b) sample cooled in forced air at 1000× magnification; (c) sample cooled in air at 1000× magnification; (d) sample cooled in water at 6000× magnification; (e) sample cooled in forced air at 6000× magnification; (f) sample cooled in air at 6000× magnification.
3.4. X-ray Diffraction Characterization
The outcome obtained by XRD shows a significant difference in the microstructure of the samples treated in natural air, forced air, and water. The difference is attributed to the cooling kinetics and higher diffusion range of the natural and forced air-cooled samples. From Figure 13a, the naturally cooled sample provides a high diffusion range for the precipitation of secondary phases. Among these secondary phases, silicon oxides stand out, only present in an analyzable volume fraction in the naturally cooled sample. From the point of view of oxide inclusion engineering, this phenomenon enhances the formation of acicular ferrite in the filler zone, which increases the weld metal’s impact toughness [35]. This demonstrates an intense attempt to control hydrogen in the weld zone by utilizing the SiO2 reaction of the flux generated by the protective atmosphere [45]. Based on the above, it is possible to increase the toughness of the molten zone due to the reduction of cracks and porosities produced by hydrogen [35,45]. The difference between SEM-EDS and XRD results in the sighting of SiO2 is mainly attributed to the size. Kultz et al. [46] obtained a large number of nanometric inclusions of SiO2 in a natural (air) cooling process as a result of TEM characterization. These results could explain the lack of SiO2 indexation in the samples cooled in forced air and water because the precipitation kinetics is reduced and generates a SiO2 formation barrier, preventing its visualization in XRD. From the above, a significant reduction in the formation of SiO2 in the samples without natural cooling does not translate into the absolute non-existence of SiO2 in the samples. MnO2 was also found in the naturally cooled sample, characterized by increased wear resistance [47,48].
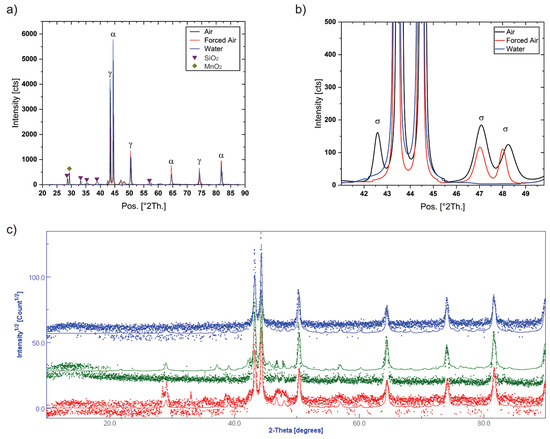
Figure 13.
X-ray diffraction characterization results on welded samples: (a) X-ray diffraction spectrum with background subtraction; (b) amplification of the diffraction zone of the sigma phase; (c) results obtained from Rietveld refinement on welded samples where the water-quenched sample can be seen in blue, the forced air-quenched sample in green and the air-quenched sample in red.
The kinetics and slow diffusion not only affect the formation of carbides and oxides as represented in Figure 13a. These time-mobility effects also favored the sigma phase formation, which can be observed in detail in the diffraction peaks in Figure 13b. As a result of the precipitation kinetics, a higher intensity in the sigma phase peaks is observed for the naturally cooled sample, indicating a higher volume fraction of this phase in the sample. However, the sigma phase was also found in the sample cooled by forced air, but with a lower peak intensity. On the other hand, the peak width of the naturally cooled sample is appreciably larger, which translates into a larger precipitate size compared to those represented by forced air cooling. These results are consistent with the theoretically expected precipitation kinetics phenomenology and with the mobility of Cr and Mo to the Z-phase to finally form the sigma phase. These results are consistent with those presented previously by CALPHAD thermodynamic simulation in the phase diagram, point equilibrium analysis, and continuous cooling transformation diagram (CCT). The water-cooled sample corroborates the kinetic effect on sigma phase formation because it does not show the characteristic sigma phase peaks in the diffraction pattern. However, this does not mean that no sigma phase will form during this cooling process because, by the time-temperature transformation diagram, it can be corroborated that the formation of a 1% sigma phase will occur for less than two minutes during the welding process, and first the metastable phase Chi will be formed, which will be a nucleation point of the sigma phase during the cooling cycle. The reduced volume fraction of the sigma phase for the applied welding time would not be represented in the XRD patterns for the water-quenched sample. However, the computational simulation and XRD results indicate that the sigma phase volume fraction and size increase occur only during the sample cooling process. The findings obtained of the Rietveld refinement on the XRD results without background removal to quantify the phases present can be seen in Figure 13c. This would allow us better to clarify the phases present in each tempered sample. It is possible to observe the clear presence of the sigma phase in the samples cooled in air and forced air. These findings corroborate the results obtained previously. However, it was possible to obtain a semi-quantification of 0.48% of the sigma phase in the water-cooled sample, which is camouflaged in the background. Additionally, it was possible to corroborate the existence of SiO2 in the samples cooled in air and forced air and of MnO2 in the sample cooled in air, which shows that MnO2 requires a longer formation time due to the slow diffusion of Mn. The details of the semi-quantification obtained by Rietveld analysis in the tempered samples can be seen in Table 10.
Table 10.
Results of semi-quantification of phases in %Wt by Rietveld analysis.
The sigma phase is characterized as an intermetallic with the ability to reduce corrosion resistance and embrittle the material. However, it can have positive effects if its volume and size fraction is controlled, optimizing the mechanical response due to precipitation reinforcement. Corrosion resistance, on the other hand, does not depend only on the sigma phase, but is also directly related to the ferrite–austenite fraction and composition in the alloy. It is also important to highlight that the metastable phase that favors the precipitation of the sigma phase is the Chi phase and generates localized corrosion sensitization with similar volta potential to the sigma phase [49]. From the above, it is hypothesized that a low amount of sigma phase, with an adequate ratio of austenite to ferrite, could result in a material with adequate corrosion resistance and improved mechanical properties. Additionally, it is questionable to attribute the decrease in corrosion resistance only to the sigma phase in stainless steel since carbides also have an adverse effect.
Investigations carried out by Phuah et al. [50] and Chan et al. [51] showed evidence of pitting corrosion at the periphery of NbC. The cathodic potential of NbC was studied by Clark et al. [52] by Scanning Kelvin Probe Force Microscopy (SKPFM), obtaining result potentials of 35 mV above those of austenite. The Cr carbides also act actively in the sensitization of the material to corrosion, mainly by the Cr impoverishment of the surrounding phase and its precipitation at the grain boundaries, which increases the rate of sensitization of the material by the diffusion of carbon along this linear defect. Clark et al. [52] also evaluated the potential of Cr carbides by SKPFM, obtaining as results potentials of 65 mV above those of austenite. The potentials obtained in Cr carbides by Clark et al. are close to those obtained by Ramirez et al. [53] in the sigma phase, who obtained potential differences of 75 mV between the sigma phase and austenite. These results indicate that the nobility of the precipitates is higher, weakening the zones surrounding the present phases and generating an actively sensitized zone, which would explain the sightings discovered by Phuah et al. [50] and Chan et al. [51] regarding the corrosion produced at the edge of NbC precipitates.
Additionally, it should be noted that the heat treatment at 1090 °C performed on the samples before welding seeks to avoid sigma phase precipitation, delaying the precipitation kinetics and reducing phase growth by reducing nucleation sites such as carbides. This effect was previously analyzed by Chen et al. [54], who obtained a delay in sigma precipitation for cooling rates of 0.1 °C/s for solution temperatures between 1080 °C to 1200 °C. By this process of kinetic control of phase transformation, we seek to increase the mechanical strength of SDSS-Nb with reduced sigma content and adequate size control, not to reduce the damage tolerance.
3.5. Corrosion Characterization
To evaluate the corrosion resistance representatively, the base metal was characterized in a 3.5% NaCl solution at a temperature of 40 °C and 70 °C, respectively. The different cooling cycles were characterized under the same conditions and compared with the assay results for the base metal. Figure 14 shows the results of cyclic polarization in the base metal. The curves indicate good behavior, with no evidence of pitting. Two important phenomena occur as the temperature increases. Firstly, the increase in temperature provides a shift of the curve to areas with higher current potential, which indicates a higher corrosion rate for the sample at 70 °C. The second important phenomenon highlights the behavior in the passivation zone of the curves. For the sample subjected to 40 °C, high stability in the passive layer is observed. However, for the samples subjected to a temperature of 70 °C, the passivation zone is very unstable, which is attributed to metastable pitting [55]. Nevertheless, the passive layer endures the effect of chloride ions and temperature, this is corroborated due to the repassivation of the base material in the high potential section of the loop of the polarization curve. The presence of metastable pitting can be attributed to the critical pitting temperature (CPT) approach of the SDSS-Nb presented in this investigation. This effect means that the acidification effect produced by the migration of chloride ions to the breakage of the passive layer is producing metastable pitting. However, a passive layer is produced again, thus preventing stable pitting and dissolution of the material. Therefore, there is no severe diffusion rate of Fe2+ and Cr3+. In [56], a cyclic thermometry test was performed to evaluate the temperature-dependent metastable pitting effect, discovering that when the temperature decreases, the diffusion coefficient of the aqueous cation also decreases, increasing the passivation capacity.
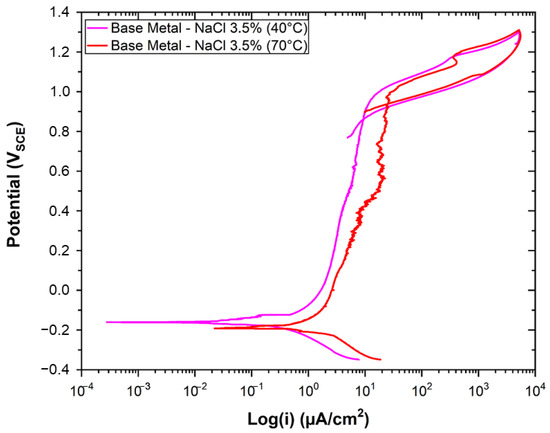
Figure 14.
Cyclic polarization curve of SDSS-Nb base metal with solubilization heat treatment at 1090 °C.
Bo Deng et al. [56] observed the presence of metastable pitting with increasing solution temperature during the cyclic polarization test. They observed that with increasing solution temperature during the cyclic polarization test above CPT, the current density increased abruptly and continuously, indicating the occurrence of stable pitting. However, when they were under CPT, a transition state occurred in the passive zone, which is attributed to metastable pitting, increasing the size of these with increasing temperature. This effect occurs because the passivation rate is higher than the metastable pitting rate at lower temperatures, implying that at lower temperatures, the acidifying effect due to the migration of chloride ions to the surface pitting zones is inhibited by the self-healing of the material. The change may influence this change in the alloy passivation rate in the composition and structure of the passive film [56]. As the analyzed sample corresponds to the base metal with a complete solubilization heat treatment at 1090 °C, the metastable pitting is related to possible secondary Cr23C6 phases in the SDSS-Nb alloy that failed to solubilize completely. It is essential to note the increase in passivation current density with increasing test temperature. This phenomenon is attributed to the increase in the chemical and electrochemical potential of the sputtering reactions, a finding consistent with the results of Deng et al. [56].
The curve of the base metal with a solution at a temperature of 40 °C (see Figure 14) presents a stable passivity zone. In contrast, for the curve with a solution at 70 °C. This result is a clear indicator of pitting stabilization, increasing the corrosion rate due to the stable breakdown of the passive layer of the alloy where the critical point should be close to 90 °C because this temperature corresponds to the unsensitized CPT of the base alloy UNS32750. The summary of results obtained for Figure 14 can be seen in Table 11.
Table 11.
Result of potentials determined by electrochemical cyclic polarization test in base metal.
The results presented above for the base metal will be used to compare the corrosion behavior of the welded samples with cooling in water, air, and forced air. Figure 15 shows the cyclic polarization curves of the samples with different cooling conditions and the base metal with a solution at 40 °C and 70 °C, respectively. From both figures, it can be observed that at lower temperatures, there is higher stability of the passive layer and that increasing the temperature of the 3.5% NaCl solution increases the metastable pitting condition increases, indicating that it is close to CPT. Figure 15 shows that the cooling condition with the worst response to corrosion is the sample cooled in water. This result is attributed to the residual stress in the ferritic structure and the non-homogeneity of Cr, Mo, and W in the matrix due to the slow diffusion presented by the BCC structure. Additionally, the low miscibility of N and C in the ferrite and the low fraction of austenite present with water quenching could induce the formation of CrN, Cr2N, Cr23C6, and Cr7C3 at the grain boundary with nanometer size due to the low diffusion range for precipitate growth [57,58]. This result is consistent with the findings of Hsieh et al. [59], who indicated that the formation rate of carbides and nitrides is faster than in the sigma phase because C and N cannot dissolve in the sigma phase. Due to the above reasons, the worse corrosion response of water-quench welded SDSS-Nb is justified.
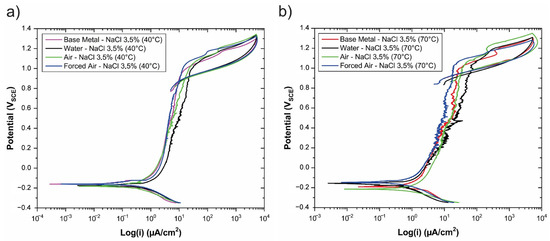
Figure 15.
Cyclic polarization curve of base metal and SDSS-Nb welded samples with different cooling; (a) Test with solution temperature at 40 °C; (b) Test with solution temperature at 70 °C.
In summary, the worst result obtained as a corrosion response in the water-cooled sample is attributed to the possible Cr2N and CrN precipitates due to the low ferrite miscibility and low austenite fraction obtained, to the residual stresses that increase the corrosion energy potential at the grain boundary due to a high energy non-homogeneity and finally the non-homogeneity of noble elements in the ferrite, generating potential differences that favor a galvanic pile. This effect of susceptibility to corrosion in the water-cooled sample can be observed by analyzing the temperature of the test solution. Therefore, at 40 °C, no evidence of metastable pitting was observed because it was in the passive layer stability zone. However, the water-cooled sample, in addition to the increase in current indicating susceptibility to corrosion, has the presence of metastable pitting at 40 °C, indicating low passive layer stability for this condition due to the increase in the galvanic pile.
The air-cooled, welded SDSS-Nb sample significantly improved over the water-cooled sample. However, its performance is slightly worse than the base metal sample. The improvement of the corrosion response in the air-cooled sample with respect to the water-cooled sample is attributed to a significant reduction of residual stresses due to natural cooling and greater homogeneity in the ferrite, with an increase in the miscibility of N in the austenite, which would decrease the formation of CrN and Cr2N, but not its growth and future transformation. The growth and higher diffusion range of CrN and Cr2N, as well as the increase in the diffusion range due to the cooling in the ferritic phase, would allow the formation of the sigma phase due to the migration of Cr and Mo to zones of higher energy forming intermetallic phases such as Chi and Z phase. The transformation kinetics during prolonged cooling times would allow the transformation of Chi, Z, Cr2N, and CrN phases to the sigma phase [60]. This effect was corroborated by X-ray diffraction and CALPHAD CCT simulation results, which indicate the presence of the sigma phase in the air-cooled alloy. The presence of mild metastable pitting in the air-cooled sample with a solution at 40 °C can be attributed to the sigma phase due to the potential difference it produces with austenite and ferrite at the grain boundary and secondary phases observed in SEM-EDS.
Finally, the cooling condition that shows the best results is the forced-air-cooled one, presenting a better corrosion response than the base metal. This response is essentially attributed to two main factors. Firstly, the ferrite content in the sample cooled in forced air was 62%, slightly higher than the ferrite content in the base metal (60%). This allows a slight increase in the corrosion resistance of the material. Secondly, a structure with a more controlled diffusion time is obtained due to the reduction of the transformation kinetics. These factors allow a decrease in sigma phase formation and a structure free of residual stresses, optimizing the corrosion response of the material observed in the cyclic polarization plots. The decrease in sensitization obtained by the sigma phase for this condition by improving the proportion of ferrite and austenite phases without residual stresses can be seen in Figure 15A. In Figure 15B, metastable pitting is observed even when they are below CPT for the air and water-cooled samples. This effect was attributed to energetic and chemical inhomogeneity and nitride formation in the water-cooled sample. In contrast, in the air-cooled sample, this behavior was attributed to sigma phase formation and α/γ phase fraction distribution below the base metal. For the sample cooled with forced air, no metastable pitting was observed under CPT, which indicates the correct stability of the passive layer without the presence of high corrosion sensitization because the α/γ fraction and homogeneity of the material compensate for the galvanic cell that could produce the sigma phase in the material.
Usually, it is recommended that the fraction of α/γ in duplex stainless steels is 50/50 to optimize the ductility and corrosion properties of the material because it is considered the optimal phase balance [10,15,61]. Several researchers agree with this assertion and have verified it experimentally. The outcomes obtained by them are discussed below. Yang et al. [62] discovered that the corrosion resistance in a stainless steel, UNS S82441, was better for 48% ferrite volume, evaluating its behavior in a range between 48–66% and observing that as the ferrite increases, the pitting resistance decreases. Zhang et al. [63] observed that the best corrosion response in a UNS S31803 steel was for a ferrite fraction of 53.6%, with an evaluation range between 53.6 and 62.5% in ferrite volume. Tan et al. [64] obtained that the best corrosion resistance in a UNS S32750 steel was for a ferrite fraction of 49% for an evaluation range between 44 to 62% ferrite by volume. However, this research allows evaluation that a 50/50 phase fraction between ferrite and austenite does not always optimize the corrosion response of the material and that it is complicated to obtain in a welding process. These results are consistent with the research of Heon-Young et al. [15], who showed optimized corrosion response results for a ferrite fraction of 57%, which is close to a 60/40 α/γ phase fraction. Our investigation showed that the best corrosion response corresponds to a ferrite fraction of 62% by volume, corresponding to an α/γ fraction of 60/40, respectively. However, a higher increase in the amount of ferrite could mean a loss of corrosion resistance due to the precipitation of carbides, nitrides, and intermetallic by the low miscibility with N and the decrease in Cr, Mo, and W by the increase in this phase [15,43,65]. Additionally, it is important to note that the ferrite range for welded joints is limited so as not to affect the corrosion or mechanical characteristics of super duplex stainless steels [66]. The API 938-C standard [67] indicates that the ferrite fraction should not exceed 70%. The summary results of Figure 15 can be seen in Table 12.
Table 12.
Result of potentials determined by electrochemical cyclic polarization test in base metal.
3.6. Mechanics Characterization
The material’s mechanical response after the welding process will be determined by the precipitation of secondary phases, segregation, inhomogeneity, and metallurgical changes. The study of these phenomena in duplex materials is highly relevant due to their operation in pipelines, thermal systems, desalination plants, and the naval sector [10]. The precipitation of secondary phases could cause an increase in the strength of the material, increasing its brittleness. However, if the phase fraction is controlled, it could increase the tensile strength without significantly compromising the ductility and corrosion response. The above discussion is closely related to the ferrite fraction resulting from the welding process since it is the stable primary phase and responsible for regulating the precipitation of carbides and nitrides, as well as secondary phases, such as the sigma and chi phases. The precipitation of these secondary phases causes corrosion sensitization and can embrittle the alloy if not adequately controlled.
Figure 16 shows the microhardness profile obtained from the samples welded with different hardening mechanisms. It can be observed that the harnesses are very similar, obtaining a minor alteration in the base metal for the water-quenched sample. This alteration in hardness is attributed to the residual stresses obtained throughout the material due to the significant thermal distortion. This thermal distortion generates structures with a higher density, which is reflected in the base metal zones metallurgically affected by water quenching. Samples cooled in forced air and natural air have very similar harnesses for the zone farthest from the weld. A clear trend is observed in all samples with quenching mechanisms in the thermally affected zone. The hardness in the air-cooled sample is higher, which is attributed to sigma formation due to precipitation kinetics. The hardness of the forced air increases and is positioned slightly above the hardness of the water-cooled sample in the molten metal zone. This variation in the hardness of the sample cooled in forced air is attributed to sigma, as in natural cooling. However, the field of action of the sigma phase in the sample cooled in natural air is more significant than that cooled by forced air. The high diffusion range explains this during post-weld air cooling, resulting in a more extensive intermetallic phase transformation range. These results are consistent with the CALPHAD computational simulation in the phase diagram and the CCT and TTT kinetic stability diagrams, respectively. The findings obtained from microstructural characterization and corrosion analysis support the mechanical response. Their differences are attributed to the ferrite/austenite fraction and the presence of a controlled sigma phase reinforcement mechanism.
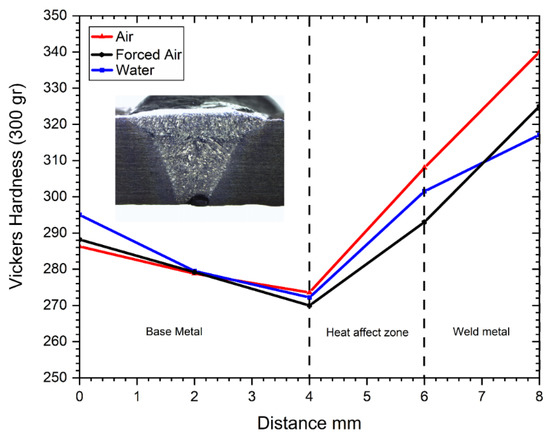
Figure 16.
Hardness profile obtained from samples with different hardening mechanisms.
The results presented in this study agree with those obtained by Putz et al. [28] and Souza et al. [29], who indicate that the hardness is maintained in the zones of the base metal and the thermally affected zone hardness is between approximately 230 and 300 HV. In our investigation, the hardness between the base metal and the thermally affected zone is between 270 and 308 HV. However, upon entering the weld zone, the hardness increases to 340 HV for air cooling, 317 HV for water cooling, and 325 HV for forced air cooling. It should be noted that the hardness obtained are within the maximum allowable requirements established by the ANSI/NACE MR0175 [31] and ANSI/NACE MR0103 standards. [30]. Putz et al. [28] reported that the sigma phase reached a hardness of 471 HV after heat treatment of 60 min and that with 10 min of heat treatment, the sample exhibited harnesses between 350 and 380 HV. This change in the hardness of the sigma phase with respect to time is due to the kinetics of precipitation and growth. This effect was also observed by Da Fonseca et al. [68], who observed that for heat treatments between 700 °C and 800 °C, the hardness varied with respect to time in a UNS S32750 steel. They discovered that the hardness for 30 min in the evaluated temperature ranges was between 210 and 305 HV. However, after one hour of heat treatment, the hardness increased significantly between 240 and 340 HV, respectively.
The findings presented above validate those obtained in our research, which indicate that with air and forced air cooling, there is a sigma phase in the material, but in a low percentage. The difference between the hardness obtained in our study and those presented in [28,29,68] is due to the interaction between the surrounding phases. It is understood that the hardness itself is not absolute because it depends on the chemical composition of the material and the phase. However, the fraction of phases present also fulfills a fundamental role observed in this investigation. An adequate balance of α/γ phases would increase the material’s mechanical and corrosion response even with a small fraction of the sigma phase during cooling in the welded joint.
Figure 17 shows the tensile test results performed on the samples analyzed. It is possible to observe that the sample cooled in water has the lowest resistance, which is attributed to the fact that the samples cooled in air and forced air contain the mechanical contribution provided by the sigma phase. The air-cooled sample exhibits significantly higher strength than the water-cooled sample, with slightly lower ductility. This higher strength is essentially attributed to the primary phase balance and the contribution of the sigma phase in the alloy. First, the α/γ phase fraction in the water-cooled sample is 71%/29%, while in the air-cooled sample, it is 53%/47%. Based on the phase balance alone, the air-cooled sample should exhibit lower strength than the water-cooled sample, with significantly higher ductility. This response is only considering the austenite content in the sample. The explanation for these results is attributed to the sigma phase because it significantly increases its strength and decreases its ductility. The above analysis shows the attractively improved mechanical response of the SDSS-Nb steel with a forced air quenching mechanism. A significantly improved mechanical response is observed in the latter sample, with a higher ductility range and a slight loss in mechanical strength. The increase in ductility is attributed to a significantly lower sigma phase fraction than natural air quenching. Not finding large drastic embrittlement in the sample can be observed. The α/γ phase balance in the sample cooled by forced air corresponds to 62/38. Therefore, the significant contribution of the sigma phase in the naturally cooled sample is evident when comparing the rest of the samples.
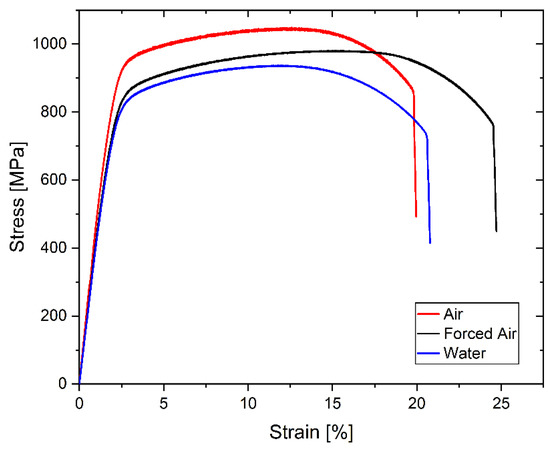
Figure 17.
Mechanical stress–strain response of SDSS-Nb specimens welded with different quenching mechanisms.
The mechanical characteristics resulting from the tensile test are summarized in Table 13. It is possible to observe that the indirect energy absorption (PSE) is higher in the sample cooled in forced air, thus having the best response to toughness. On the other hand, the air-cooled and water-cooled specimens have a PSE of 20.77 GPa% and 19.27 GPa%, respectively, so the toughness response of the material is not significant. The damage tolerance obtained can be compared with that obtained by Zhao et al. [69], who obtained for a seamless SDSS 2507 alloy a PSE of 26.32 GPa%. Kumar et al. [6] evaluated the mechanical response of an SDSS 2507 subjected to a pulsed current gas tungsten arc welding (PCGTAW) process obtaining a PSE of 25.92% in the welded joint. Helan et al. [70] found a PSE of 27.50 GPa% in a DSS 2205 and a PSE of 12.43 GPa% in an SDSS 2207 welded by SMAW. Based on the above, it can be observed that the findings obtained in our research for water and air quenching indicate a considerable reduction in damage concerning SDSS 2507 without welding or welding processes by advanced technologies. However, the damage tolerance is superior to the SDSS 2507 sample welded by SMAW [70]. Additionally, it could be corroborated that the sample tempered in forced air maintains a damage tolerance within the range of values presented by [6,69,70], characteristic of an SDSS without thermal effects by welding and with thermal effects by advanced welding methods.
Table 13.
Uniaxial tensile test results.
Figure 18 shows the fracture zone of each mechanically tested sample. It is possible to observe that the characteristic fracture in all three samples corresponds to a ductile fracture type, identified by the presence of microvoids caused by coalescence as the damage mechanism. This mechanism indicates high energy during the fracture process. The damage in all samples occurred beneath the welded joint, concentrating between the HAZ (Heat-Affected Zone) and the base metal. The fracture zone of the sample quenched in water and quenched in air displayed a 45° shear (see Figure 18a,e), while the fracture in the sample cooled by forced air showed a double damage region with cuts at ±45° (see Figure 18c). The angle of damage macroscopically indicates that the fracture in all samples exhibits ductile characteristics, primarily experiencing shear damage and following a preferential plane for dislocation glide. The microvoids, characteristic of ductile damage, can be observed in Figure 18b,d,f for each tempering condition.
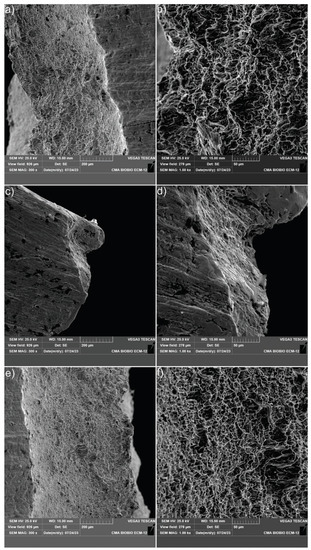
Figure 18.
Fracture zones of mechanically tested welded specimens: (a) water-cooled specimen fracture zone at 300× magnification; (b) water-cooled specimen fracture zone at 1000× magnification; (c) air-cooled specimen fracture zone at 300× magnification; (d) water-cooled specimen fracture zone at 1000× magnification; (e) forced-air-cooled specimen fracture zone at 300× magnification; (f) forced-air-cooled specimen fracture zone at 1000× magnification.
4. Conclusions
The present work studied the influence of three different cooling rates in Nb-stabilized super duplex stainless steel (SDSS-Nb) SMAW samples as regards the influence of phase equilibrium between ferrite and austenite and the presence of sigma phase correlated to the localized corrosion behavior and the mechanical properties. The conclusions of the study are summarized as follows:
- The findings obtained from CALPHAD thermochemical computational simulation indicate that the sigma phase and Cr23C6 are solubilized for a temperature of 1090 °C. However, the diffusive thermochemical stability simulation for temperature–time constant condition TTT and continuous cooling condition CCT indicate that the Cr23C6 phase is at a fraction of 0.13 wt.%. This fraction of Cr23C6 in the base metal is assumed to cause the base metal’s sensitization and produce metastable corrosion at temperatures below CPT.
- The welded and air-quenched samples exhibited the highest sigma phase fraction, followed by the forced air-quenched samples and water. These findings are consistent with those obtained from the CALPHAD simulation on the CCT and TTT diagrams, which indicated that the highest sigma phase fraction is produced mainly by the cooling kinetics and not by the heating kinetics during the welding process. XRD experimentally corroborated these results with Rietveld refinement.
- The corrosion response obtained by cyclic polarization revealed that the α/γ phase fraction and residual stresses produced by the cooling mechanism produce higher sensitization than the sigma phase. This effect is evident from the fraction of phases obtained by X-ray diffraction and optical microscopy. Additionally, it was discovered that using the sigma phase as a precipitation-strengthening mechanism is strongly related to the sigma phase fraction. It is recommended in super duplex stainless steels to keep under 3 wt.% with an α/γ ratio of 60/40.
Author Contributions
Á.O.: investigation; writing—original draft; E.T.: investigation; methodology; analysis; data curation; D.O.: data curation; J.R.: analysis; methodology; C.M.: data curation; review; J.P.S.: analysis; review; M.M.: conceptualization; review; V.T.: writing—review and editing D.R.: conceptualization; supervision; validation; writing—review and editing. All authors have read and agreed to the published version of the manuscript.
Funding
Proyecto VRID N° 220.098.005-INV of the Universidad de Concepción, Proyecto Fondecyt Regular N° 1221600.
Data Availability Statement
The data presented in this study are available on request from the corresponding author.
Acknowledgments
The financial support from the VRID project N° 220.098.005-INV of the Universidad de Concepción, and Fondecyt Regular Project N° 1221600 are acknowledged. We also gratefully acknowledge the support of the Universidad de Concepción for the advanced microscopy and X-ray diffraction center. In addition, we thank the Department of Materials Engineering and the Department of Mechanical Engineering of the Universidad de Concepción for their facilities and laboratories.
Conflicts of Interest
The authors declare that they have no known competing financial interests or personal relationships that could have appeared to influence the work reported in this paper.
References
- El-Yazgi, A.; Hardie, D. Stress corrosion cracking of duplex and super duplex stainless steels in sour environments. Corros. Sci. 1998, 40, 909–930. [Google Scholar] [CrossRef]
- Sadeghian, M.; Shamanian, M.; Shafyei, A. Effect of heat input on microstructure and mechanical properties of dissimilar joints between super duplex stainless steel and high strength low alloy steel. Mater. Des. 2014, 60, 678–684. [Google Scholar] [CrossRef]
- Cui, Z.; Wu, S.; Zhu, S.; Yang, X. Study on corrosion properties of pipelines in simulated produced water saturated with supercritical CO2. Appl. Surf. Sci. 2006, 252, 2368–2374. [Google Scholar] [CrossRef]
- Tavares, S.; Pardal, J.; Lima, L.; Bastos, I.; Nascimento, A.; de Souza, J. Characterization of microstructure, chemical composition, corrosion resistance and toughness of a multipass weld joint of superduplex stainless steel UNS S32750. Mater. Charact. 2007, 58, 610–616. [Google Scholar] [CrossRef]
- Muthupandi, V.; Srinivasan, P.B.; Seshadri, S.; Sundaresan, S. Effect of weld metal chemistry and heat input on the structure and properties of duplex stainless steel welds. Mater. Sci. Eng. A 2003, 358, 9–16. [Google Scholar] [CrossRef]
- Kumar, S.; Vimal, K.; Karpagaraj, A. Mechanical characterization and simulation of PCGTAW welded thin sheet of SDSS material. Mater. Today Proc. 2022, 60, 452–458. [Google Scholar] [CrossRef]
- Elhoud, A.; Renton, N.; Deans, W. Hydrogen embrittlement of super duplex stainless steel in acid solution. Int. J. Hydrogen Energy 2010, 35, 6455–6464. [Google Scholar] [CrossRef]
- Bansod, A.V.; Patil, A.P. Effect of Welding Processes on Microstructure, Mechanical Properties, and Corrosion Behavior of Low-Nickel Austenitic Stainless Steels. Met. Microstruct. Anal. 2017, 6, 304–314. [Google Scholar] [CrossRef]
- Wang, Q.; Gu, G.; Jia, C.; Li, K.; Wu, C. Investigation of microstructure evolution, mechanical and corrosion properties of SAF 2507 super duplex stainless steel joints by keyhole plasma arc welding. J. Mater. Res. Technol. 2023, 22, 355–374. [Google Scholar] [CrossRef]
- Verma, J.; Taiwade, R.V. Effect of welding processes and conditions on the microstructure, mechanical properties and corrosion resistance of duplex stainless steel weldments—A review. J. Manuf. Process. 2017, 25, 134–152. [Google Scholar] [CrossRef]
- Siow, K.; Song, T.; Qiu, J. Pitting corrosion of duplex stainless steels. Anti-Corros. Methods Mater. 2001, 48, 31–37. [Google Scholar] [CrossRef]
- Man, C.; Dong, C.; Xiao, K.; Yu, Q.; Li, X. The Combined Effect of Chemical and Structural Factors on Pitting Corrosion Induced by MnS-(Cr, Mn, Al)O Duplex Inclusions. Corrosion 2018, 74, 312–325. [Google Scholar] [CrossRef] [PubMed]
- Tavares, S.; Scandian, C.; Pardal, J.; Luz, T.; da Silva, F. Failure analysis of duplex stainless steel weld used in flexible pipes in off shore oil production. Eng. Fail. Anal. 2010, 17, 1500–1506. [Google Scholar] [CrossRef]
- Yang, J.; Wang, Q.; Wei, Z.; Guan, K. Weld failure analysis of 2205 duplex stainless steel nozzle. Case Stud. Eng. Fail. Anal. 2014, 2, 69–75. [Google Scholar] [CrossRef]
- Ha, H.-Y.; Jang, M.-H.; Lee, T.-H.; Moon, J. Interpretation of the relation between ferrite fraction and pitting corrosion resistance of commercial 2205 duplex stainless steel. Corros. Sci. 2014, 89, 154–162. [Google Scholar] [CrossRef]
- Broadbent, C. Steel’s recyclability: Demonstrating the benefits of recycling steel to achieve a circular economy. Int. J. Life Cycle Assess. 2016, 21, 1658–1665. [Google Scholar] [CrossRef]
- Falsafi, M.; Fornasiero, R. Explorative Multiple-Case Research on the Scrap-Based Steel Slag Value Chain: Opportunities for Circular Economy. Sustainability 2022, 14, 2284. [Google Scholar] [CrossRef]
- Nakamura, S.; Kondo, Y.; Nakajima, K.; Ohno, H.; Pauliuk, S. Quantifying Recycling and Losses of Cr and Ni in Steel Throughout Multiple Life Cycles Using MaTrace-Alloy. Environ. Sci. Technol. 2017, 51, 9469–9476. [Google Scholar] [CrossRef]
- Holappa, L.; Kekkonen, M.; Jokilaakso, A.; Koskinen, J. A Review of Circular Economy Prospects for Stainless Steelmaking Slags. J. Sustain. Met. 2021, 7, 806–817. [Google Scholar] [CrossRef]
- Kordatos, J.; Fourlaris, G.; Papadimitriou, G. The effect of cooling rate on the mechanical and corrosion properties of SAF 2205 (UNS 31803) duplex stainless steel welds. Scr. Mater. 2001, 44, 401–408. [Google Scholar] [CrossRef]
- Paulraj, P.; Garg, R. Effect of welding parameters on pitting behavior of GTAW of DSS and super DSS weldments. Eng. Sci. Technol. Int. J. 2016, 19, 1076–1083. [Google Scholar] [CrossRef]
- Cui, S.; Pang, S.; Pang, D.; Zhang, Z. Influence of Welding Speeds on the Morphology, Mechanical Properties, and Microstructure of 2205 DSS Welded Joint by K-TIG Welding. Materials 2021, 14, 3426. [Google Scholar] [CrossRef] [PubMed]
- Ostovan, F.; Hasanzadeh, E.; Toozandehjani, M.; Shafiei, E.; Jamaluddin, K.R.; Amrin, A. Microstructure, Hardness and Corrosion Behavior of Gas Tungsten Arc Welding Clad Inconel 625 Super Alloy over A517 Carbon Steel Using ERNiCrMo3 Filler Metal. J. Mater. Eng. Perform. 2020, 29, 6919–6930. [Google Scholar] [CrossRef]
- Miranda-Pérez, A.F.; Rodríguez-Vargas, B.R.; Calliari, I.; Pezzato, L. Corrosion Resistance of GMAW Duplex Stainless Steels Welds. Materials 2023, 16, 1847. [Google Scholar] [CrossRef]
- Hou, Y.; Nakamori, Y.; Kadoi, K.; Inoue, H.; Baba, H. Initiation mechanism of pitting corrosion in weld heat affected zone of duplex stainless steel. Corros. Sci. 2022, 201, 110278. [Google Scholar] [CrossRef]
- Zhang, Z.; Jing, H.; Xu, L.; Han, Y.; Zhao, L. Investigation on microstructure evolution and properties of duplex stainless steel joint multi-pass welded by using different methods. Mater. Des. 2016, 109, 670–685. [Google Scholar] [CrossRef]
- Chacón-Fernández, S.; García, A.P.; Labanda, G.R. Analysis of the Influence of GMAW Process Parameters on the Properties and Microstructure of S32001 Steel. Materials 2022, 15, 6498. [Google Scholar] [CrossRef]
- Putz, A.; Hosseini, V.A.; Westin, E.M.; Enzinger, N. Microstructure investigation of duplex stainless steel welds using arc heat treatment technique. Weld. World 2020, 64, 1135–1147. [Google Scholar] [CrossRef]
- De Souza, D.D.B.G.; Vilarinho, L.O. Influence of present phases in corrosion and mechanical behavior of UNS S31803 duplex stainless steel welded by conventional short circuit MIG/MAG process. J. Mater. Res. Technol. 2020, 9, 11244–11254. [Google Scholar] [CrossRef]
- ANSI/NACE Standard MR0103-2012—Materials Resistant to Sulfide Stress Cracking in Corrosive Petroleum Refining Environments, (n.d.). Available online: https://webstore.ansi.org/Standards/NACE/ansinacestandardmr01032012 (accessed on 24 October 2022).
- NACE MR0175: Standard Material Requirements—Sulfide Stress Cracking Resistant Metallic Materials For Oilfield Equipment. 2002. Available online: https://webstore.ansi.org/Search/Find?in=1&st=MR0175%E2%80%902002 (accessed on 24 October 2022).
- Godec, M.; Balantič, D.A.S. Coarsening behaviour of M23C6 carbides in creep-resistant steel exposed to high temperatures. Sci. Rep. 2016, 6, 29734. [Google Scholar] [CrossRef]
- Nishimoto, K.; Saida, K.; Katsuyama, O. Prediction of Sigma Phase Precipitation in Super Duplex Stainless Steel Weldments. Weld. World 2006, 50, 13–28. [Google Scholar] [CrossRef]
- Dallam, C.B.; Liu, S.; Olson, D.L. Flux composition dependence of microstructure and toughness of submerged arc HSLA weldments. Weld J. 1985, 64, 140–151. Available online: http://files.aws.org/wj/supplement/WJ_1985_05_s140.pdf (accessed on 19 July 2022).
- Coetsee, T.; Mostert, R.J.; Pistorius, P.G.H.; Pistorius, P.C. The effect of flux chemistry on element transfer in Submerged Arc Welding: Application of thermochemical modelling. J. Mater. Res. Technol. 2021, 11, 2021–2036. [Google Scholar] [CrossRef]
- Zhang, B.; Jiang, Z.; Li, H.; Zhang, S.; Feng, H.; Li, H. Precipitation behavior and phase transformation of hyper duplex stainless steel UNS S32707 at nose temperature. Mater. Charact. 2017, 129, 31–39. [Google Scholar] [CrossRef]
- Menezes, A.J.W.; Abreu, H.; Kundu, S.; Bhadeshia, H.K.D.H.; Kelly, P.M. Crystallography of Widmanstätten austenite in duplex stainless steel weld metal. Sci. Technol. Weld. Join. 2009, 14, 4–10. [Google Scholar] [CrossRef]
- Dos Santos, D.C.; Magnabosco, R. Kinetic Study to Predict Sigma Phase Formation in Duplex Stainless Steels. Metall. Mater. Trans. A. Phys. Metall. Mater. Sci. 2016, 47, 1554–1565. [Google Scholar] [CrossRef]
- Voort, G.F.V.; Lucas, G.M.; Manilova, E.P.; ASM Handbook Committee; Aliya, D.; Lampman, S.; Stefanescu, D.M.; Ruxanda, R.; Marder, A.R.; Epler, M.; et al. Metallography and Microstructures of Stainless Steels and Maraging Steels. In Metallography and Microstructures; ASM International: Almere, The Netherlands, 2004; Volume 8, pp. 670–700. [Google Scholar] [CrossRef]
- Yusof, F.; Jamaluddin, M. Welding Defects and Implications on Welded Assemblies. Compr. Mater. Process. 2014, 6, 125–134. [Google Scholar] [CrossRef]
- Sun, Y.; Hebert, R.J.; Aindow, M. Non-metallic inclusions in 17-4PH stainless steel parts produced by selective laser melting. Mater. Des. 2018, 140, 153–162. [Google Scholar] [CrossRef]
- Terashima, S.; Bhadeshia, H.K.D.H. Size distribution of oxides and toughness of steel weld metals. Sci. Technol. Weld. Join. 2006, 11, 580–582. [Google Scholar] [CrossRef]
- Wang, R. Precipitation of sigma phase in duplex stainless steel and recent development on its detection by electrochemical potentiokinetic reactivation:A review. Corros. Commun. 2021, 2, 41–54. [Google Scholar] [CrossRef]
- Warren, A.D.; Harniman, R.L.; Guo, Z.; Younes, C.M.; Flewitt, P.E.J.; Scott, T.B. Quantification of sigma-phase evolution in thermally aged 2205 duplex stainless steel. J. Mater. Sci. 2015, 51, 694–707. [Google Scholar] [CrossRef]
- Park, J.-Y.; Chang, W.-S.; Sohn, I. Effect of MnO to hydrogen dissolution in CaF2–CaO–SiO2based welding type fluxes. Sci. Technol. Weld. Join. 2012, 17, 134–140. [Google Scholar] [CrossRef]
- Kultz Unti, L.; Aota, L.; Jardini, A.; Tschiptschin, A.; Sandim, H.; Jägle, E.; Zilnyk, K. Microstructural characterization of 15-5PH stainless steel processed by laser powder-bed fusion. Mater. Charact. 2021, 181, 111485. [Google Scholar] [CrossRef]
- Rojacz, H.; Katsich, C.; Kirchgaßner, M.; Kirchmayer, R.; Badisch, E. Impact-abrasive wear of martensitic steels and complex iron-based hardfacing alloys. Wear 2022, 492–493, 204183. [Google Scholar] [CrossRef]
- Elsawy, E.; El-Hebeary, M.; El Mahallawi, I. Effect of manganese, silicon and chromium additions on microstructure and wear characteristics of grey cast iron for sugar industries applications. Wear 2017, 390–391, 113–124. [Google Scholar] [CrossRef]
- Örnek, C.; Engelberg, D.L. Correlative EBSD and SKPFM characterisation of microstructure development to assist determination of corrosion propensity in grade 2205 duplex stainless steel. J. Mater. Sci. 2016, 51, 1931–1948. [Google Scholar] [CrossRef]
- Phuah, C. Heng, Corrosión del Revestimiento de Combustible del Reactor Avanzado Refrigerado por Gas Envejecido Térmicamente. 2012. Available online: https://core.ac.uk/download/pdf/9833215.pdf (accessed on 5 July 2022).
- Chan, C.; Engelberg, D. Performance Characterisation of AGR Fuel Cladding Relevant to Long-term in-Pond Storage in pH-moderated Aqueous Environment. In Reactor Fuel Performance—TopFuel 2015 Proceedings—Part II: Reactor Fuel Performance—TopFuel 2015; Zurich, Switzerland, 13–17 September 2015; The University of Manchester Library: Manchester, UK, 2015; pp. 120–129. Available online: https://www.escholar.manchester.ac.uk/uk-ac-man-scw:263176 (accessed on 5 July 2022).
- Clark, R.; Searle, J.; Martin, T.; Walters, W.; Williams, G. The role of niobium carbides in the localised corrosion initiation of 20Cr-25Ni-Nb advanced gas-cooled reactor fuel cladding. Corros. Sci. 2020, 165, 108365. [Google Scholar] [CrossRef]
- Ramírez-Salgado, J.; Domínguez-Aguilar, M.; Castro-Domínguez, B.; Hernández-Hernández, P.; Newman, R. Detection of secondary phases in duplex stainless steel by magnetic force microscopy and scanning Kelvin probe force microscopy. Mater. Charact. 2013, 86, 250–262. [Google Scholar] [CrossRef]
- Chen, T.; Yang, J. Effects of solution treatment and continuous cooling on σ-phase precipitation in a 2205 duplex stainless steel. Mater. Sci. Eng. A 2001, 311, 28–41. [Google Scholar] [CrossRef]
- Frankel, G.S.; Stockert, L.; Hunkeler, F.; Boehni, H. Metastable Pitting of Stainless Steel. Corrosion 1987, 43, 429–436. [Google Scholar] [CrossRef]
- Deng, B.; Jiang, Y.; Gong, J.; Zhong, C.; Gao, J.; Li, J. Critical pitting and repassivation temperatures for duplex stainless steel in chloride solutions. Electrochim. Acta 2008, 53, 5220–5225. [Google Scholar] [CrossRef]
- Folkhard, E. Welding Metallurgy of Stainless Steels; Springer: Vienna, Austria, 1988. [Google Scholar] [CrossRef]
- Knyazeva, M.; Pohl, M. Duplex Steels. Part II: Carbides and Nitrides. Metallogr. Microstruct. Anal. 2013, 2, 343–351. [Google Scholar] [CrossRef]
- Hsieh, C.-C.; Wu, W. Overview of Intermetallic Sigma (σ) Phase Precipitation in Stainless Steels. ISRN Met. 2012, 2012, 732471. [Google Scholar] [CrossRef]
- Murkute, P.; Sarfo, K.O.; McGieson, I.; Santala, M.K.; Zhang, Y.; Árnadóttir, L.; Tucker, J.D.; Isgor, O.B. Effect of thermal aging on corrosion behavior of duplex stainless steels. SN Appl. Sci. 2022, 4, 97. [Google Scholar] [CrossRef]
- Iacoviello, F.; Di Cocco, V.; D’Agostino, L. Integranular corrosion susceptibility analysis in austeno-ferritic (duplex) stainless steels. Procedia Struct. Integr. 2017, 3, 276–282. [Google Scholar] [CrossRef]
- Yang, Y.; Tan, H.; Wang, Z.; Jiang, Y.; Jiang, L.; Yang, H.T.Y.; Michalska, J.; Chmiela, B.; Simka, W.; Zanotto, F.; et al. Effect of Annealing Temperature on the Pitting Corrosion Behavior of UNS S82441 Duplex Stainless Steel. Corrosion 2013, 69, 167–173. [Google Scholar] [CrossRef]
- Zhang, Z.; Wang, Z.; Jiang, Y.; Tan, H.; Han, D.; Guo, Y.; Li, J. Effect of post-weld heat treatment on microstructure evolution and pitting corrosion behavior of UNS S31803 duplex stainless steel welds. Corros. Sci. 2012, 62, 42–50. [Google Scholar] [CrossRef]
- Tan, H.; Jiang, Y.; Deng, B.; Sun, T.; Xu, J.; Li, J. Effect of annealing temperature on the pitting corrosion resistance of super duplex stainless steel UNS S32750. Mater. Charact. 2009, 60, 1049–1054. [Google Scholar] [CrossRef]
- Schofield, M.J. Corrosion. In Plant Engineer’s Handbook; Elsevier: Amsterdam, The Netherlands, 2001; pp. 961–985. [Google Scholar] [CrossRef]
- Hosseini, V.A.; Hurtig, K.; Eyzop, D.; Östberg, A.; Janiak, P.; Karlsson, L. Ferrite content measurement in super duplex stainless steel welds. Weld. World 2018, 63, 551–563. [Google Scholar] [CrossRef]
- API Technical Report 938-C; Use of Duplex Stainless Steels in the Oil Refining Industry. American Petroleum Institute: Washington, DC, USA, 2011.
- Da Fonseca, G.S.; de Oliveira, P.M.; Diniz, M.G.; Bubnoff, D.V.; de Castro, J.A. Sigma Phase in Superduplex Stainless Steel: Formation, Kinetics and Microstructural Path. Mater. Res. 2017, 20, 249–255. [Google Scholar] [CrossRef]
- Zhao, Y.; Wang, Y.; Tang, S.; Zhang, W.; Liu, Z. Edge cracking prevention in 2507 super duplex stainless steel by twin-roll strip casting and its microstructure and properties. J. Mater. Process. Technol. 2019, 266, 246–254. [Google Scholar] [CrossRef]
- Omiogbemi, I.M.-B.; Gupta, R.K.; Yawas, D.S.; Afolayan, M.O.; Dauda, E.T. Brief Survey of the Microstructural, Mechanical and Corrosion Properties of Duplex Stainless Steels SMAW Weldments. IOP Conf. Ser. Mater. Sci. Eng. 2021, 1185, 012026. [Google Scholar] [CrossRef]


Disclaimer/Publisher’s Note: The statements, opinions and data contained in all publications are solely those of the individual author(s) and contributor(s) and not of MDPI and/or the editor(s). MDPI and/or the editor(s) disclaim responsibility for any injury to people or property resulting from any ideas, methods, instructions or products referred to in the content. |
© 2023 by the authors. Licensee MDPI, Basel, Switzerland. This article is an open access article distributed under the terms and conditions of the Creative Commons Attribution (CC BY) license (https://creativecommons.org/licenses/by/4.0/).