Article

Hydrothermal Synthesis of Well-Defined Red-Emitting Eu-Doped GdPO4 Nanophosphors and Investigation of Their Morphology and Optical Properties

Institute of Chemistry, Faculty of Chemistry and Geosciences, Vilnius University, Naugarduko 24, LT-03225 Vilnius, Lithuania
*
Authors to whom correspondence should be addressed.
Crystals 2023, 13(2), 174; https://doi.org/10.3390/cryst13020174
Submission received: 17 December 2022 / Revised: 12 January 2023 / Accepted: 14 January 2023 / Published: 19 January 2023

Abstract

:
Rare-earth-doped GdPO4 nanoparticles have recently attracted much scientific interest due to the simultaneous optical and magnetic properties of these materials and their possible application in bio-imaging. Herein, we report the hydrothermal synthesis of GdPO4:Eu3+ nanoparticles by varying different synthesis parameters: pH, <Gd>:<P> molar ratio, and Eu3+ concentration. It turned out that the Eu3+ content in the synthesized nanoparticles had little effect on particle shape and morphology. The synthesis media pH, however, has showed a pronounced impact on particle size and distribution, i.e., the nanoparticle length can be adjusted from hundreds to tens of nanometers by changing the pH from 2 to 11, respectively. Increasing the <Gd>:<P> molar ratio resulted in a decrease in nanoparticle length and an increase in its width. The temperature-dependent measurements in the 77–500 K range revealed that the GdPO4:50%Eu3+ sample maintains half of its emission intensity, even at room temperature (TQ1/2 = 291 ± 19 K).

1. Introduction

Inorganic nanosized materials, doped with various lanthanide ions, have distinctive chemical and optical properties; thus, they are applied in multiple fields, including catalysis [1,2], temperature sensing [3], magnetic resonance imaging [4,5], biomedicine [6,7], anti-counterfeiting [8,9], dye-sensitized solar cells [10], etc. Such luminescent nanomaterials should possess the following characteristics if they are to be applied practically, i.e., particles should be non-toxic to humans and the environment [11], stable in colloidal suspensions [12], possess the desired morphology and narrow particle size distribution (PSD) [13], possess strong absorption and efficient emission, etc. [14,15]. The inorganic nanosized phosphors are usually synthesized via sol–gel, precipitation, or other wet chemistry routes [16]. Unfortunately, many of these synthesis methods often yield agglomerated or even bulk materials (especially if post-synthesis annealing is performed); therefore, additional milling or crashing is required to obtain nanosized particles. The thermal decomposition or hot-injection synthesis methods are more suitable for nanoparticle preparation, ensuring the reproducibility and narrow PSD of various inorganic nanophosphors [17]. However, such synthesis approaches ignore the principles of green chemistry since they depend on environmentally hazardous precursors and solvents. These methods also lead to the formation of hydrophobic nanoparticles, narrowing down their potential fields of application (e.g., biomedicine) [18,19]. In order to apply such nanoparticles in the biomedical field, additional surface modification is essential to transfer such hydrophobic nanoparticles into the aqueous colloids. There are numerous approaches reporting stabilization of optically active nanoparticles in aqueous dispersions: utilization of surfactants, such as TWEEN or SPAN [20], exchange of ligands using citric acid [21], usage of low molecular weight functional phosphates [22], usage of phosphoryl-PEG derivatives [23], or commercially available polymers, e.g., PVP [24]. Meanwhile, the hydrothermal synthesis method allows researchers to obtaining nanophoshors with various morphologies (both nano- and microrods [25], wires [26], prisms [13], cubes [27], spheres [28], etc.) by altering the synthesis parameters. This method meets the fundamentals of green chemistry since no volatile or toxic materials are released into the environment during and after the synthesis process. Moreover, the luminescent phosphors, synthesized via the hydrothermal method, are hydrophilic, indicating that the solid form of these phosphors can be effortlessly redispersed into an aqueous media. This, in turn, heightens the odds of these materials finding practical use in the biomedical field [12]. Therefore, the hydrothermal synthesis method is considered as a high-ranking chemical engineering tool for synthesizing novel luminescent, electronic, magnetic, and catalytic materials [29]. Recently, the REPO4 nanoparticles, possessing a rhabdophane crystal structure, have gained much scientific interest, especially in the field of luminescent materials [30,31]. Among all rare-earth orthophosphates, GdPO4 shows the most exceptional properties. Gd3+ stands out from other trivalent lanthanide ions by having seven unpaired electrons in the 4f orbital ([Xe]4f7 electronic configuration) and demonstrating magnetic properties. Materials containing trivalent gadolinium ions are widely used as MRI agents, host lattices for fluorescent lamp phosphors, X-ray intensifying screens, scintillators for X-ray tomography, etc. [32,33,34,35]. In the meantime, luminophores doped with trivalent europium are utilized in red fluorescent lamps, LEDs, and as bio-imaging or anti-counterfeit pigments [36,37,38]. Eu3+ possesses six electrons in 4f orbital (adopts [Xe]4f6 electronic configuration). When excited, europium(III) ions emit red to reddish-orange light caused by 5D07F0–4 optical transitions [36]. Moreover, due to the spin-forbidden nature of emission transitions, Eu3+ possesses longer photoluminescence (PL) lifetimes (in the order from several to a few hundred milliseconds [36,39]) if compared to other rare-earth ions emitting in the red spectral region (for instance, Er3+ (4F9/24I15/2 transition at about 650 nm) τ ≈ 550 μs; Tm3+ (3H43H6 transition at about 790 nm) τ ≈ 700 μs; Ho3+ (5F55I8 transition at about 660 nm) τ ≈ 1 ms [40]). This is an exceptionally advantageous feature, since long lifetimes allow researchers to avoid an undesirable protein autofluorescence (of a short lifetime) by employing time-resolved detection methods. Thus, Eu3+-doped luminescent nanoparticles could be easily detected in biological tissues. Ergo, doping the GdPO4 host lattice with Eu3+ could extend the application fields of such unique materials. The combination of both trivalent Gd and Eu ions empowers the creation of dual-modal opto-magnetic inorganic nanoprobes for theranostics. Several interesting papers were published recently regarding the hydrothermal synthesis of GdPO4 nanoparticles; however, most of them yielded long (more than 500 nm) nanorods or nanowires. Such materials are unsuitable for biological applications, requiring sizes < 100 nm [41]. Zhang et al., for instance, reported the hydrothermal synthesis of GdPO4 nanowires 20–200 nm in width and 1−3 μm in length [42]. Interestingly, the monoclinic (P21/n, #14) phase was obtained even after performing the synthesis in water, which was assigned to a high synthesis temperature (240 °C). Hernandes et al. [43], on the other hand, performed the hydrothermal synthesis of GdPO4:Eu3+ nanowires at 160 °C using glycerol as a co-solvent. In this case, nanowires possessing trigonal structure were obtained with width in tens of nanometers and length in hundreds of nanometers (reaction media pH = 1.6). The authors also showed that increasing pH to 12 yields irregularly shaped nanoparticles which were tens of nanometers in diameter. Yan et al., in turn, demonstrated that the GdPO4:Eu3+ nanoparticle size and shape could be controlled by selecting the appropriate solvent or mixture of solvents [44]. They showed that 50−500 nm and 20−50 nm spheres of GdPO4:Eu3+ can be obtained using dimethylaniline (DMA) and N-methyl-2pyrrolidone as a solvent. On the other hand, rod-like particles were obtained when water was used as a solvent. However, the synthesis duration was three days, which is not in favor of practical applications. It is also interesting to note that the GdPO4 nanowires, obtained by the hydrothermal synthesis method, can be converted into magnetic GdPO4 aerogel, as recently reported by Janulevius et al. [26]. There are only a few techniques that were developed to yield smaller lanthanide orthophosphate nanoparticles in the form of nanospheres [13], nanorods [13,45], or less uniform elongated nanoparticles (length in the range from 100 to 200 nm) [46,47], hexagons (ca. 15 nm) [48], and nanocubes (ca. 75 nm) [49]. Besides the hydrothermal synthesis, the GdPO4 nanoparticles can also be prepared by co-precipitation or sol–gel methods. For instance, Di et al. reported the synthesis of GdPO4 by the aqueous co-precipitation method (80 °C for 12 h), yielding nanowires from 30 to 100 nm in diameter and from several hundred nanometers to several micrometers in length [50]. Unfortunately, such particles are too large for bio-applications. Huang et al., in turn, reported the co-precipitation synthesis of GdPO4 nanorods employing water/alcohol as synthesis media [51]. Surprisingly, the urchin-like structures were obtained at the beginning, consisting of ca. 120 nm needle-shaped particles radiating from the center. However, after several minutes, the urchin-like structure started to collapse, and GdPO4·H2O hydrogel was formed in the end. The synthesis of urchin-like GdPO4:Eu3+ hollow spheres was also reported by Xu et al. The two-step procedure first involved the co-precipitation synthesis of Gd(OH)CO3:Eu3+ colloidal spheres followed by hydrothermal synthesis at 180 °C for 24 h, yielding relatively large (ca. 250 nm in diameter) hollow spheres [52]. In 2018, Rosas Camacho et al. reported the sol–gel synthesis of GdPO4 phosphors doped with lanthanide ions [53]. Unfortunately, in order to obtain single-phase materials and eliminate the organic reagents, the annealing step at 1000 °C was performed, resulting in highly agglomerated particles. It should also be noted that Kumar et al. reported the Pechini-type sol–gel synthesis of GdPO4 nanowires (20−50 nm in diameter and from several hundreds of nanometers to several micrometers in length) [54]. However, a mixture of hexagonal and monoclinic phases was obtained. Subsequently, the monoclinic phase was obtained after annealing at 1000 °C for two hours, but the particle size increased even further.
In this study, the manipulation of GdPO4 nanoparticle morphology via the different synthesis parameters, such as the pH of the reaction media, and the initial molar ratio of gadolinium to phosphorus (<Gd>:<P>) were reported. The evolution of the emission and excitation spectra, as well as the average PL lifetime values as a function of Eu3+ concentration in the GdPO4 host lattice, was investigated in detail. The temperature-dependent photoluminescence properties of the sample exhibiting the highest PL intensity (GdPO4:50%Eu3+) were also examined and presented in this study.

2. Materials and Methods

Materials used were as follows: Gd2O3 (99.99%, Tailorlux, Münster, Germany), Eu2O3 (99.99%, Tailorlux, Münster, Germany), NH4H2PO4 (≥99%, Carl Roth, Karlsruhe, Germany), tartaric acid (99.99%, Eurochemicals, Vilnius, Lithuania), nitric acid (70%, Eurochemicals, Vilnius, Lithuania), and ammonium hydroxide (30%, Chempur, Karlsruhe, Germany). Ln(NO3)3 was prepared by dissolving Ln2O3 in diluted nitric acid.
All samples were prepared via the hydrothermal synthesis method manipulating only two parameters, i.e., <Gd>:<P> molar ratio and the pH of the reaction mixture. Firstly, two series of undoped GdPO4 samples were produced as follows:
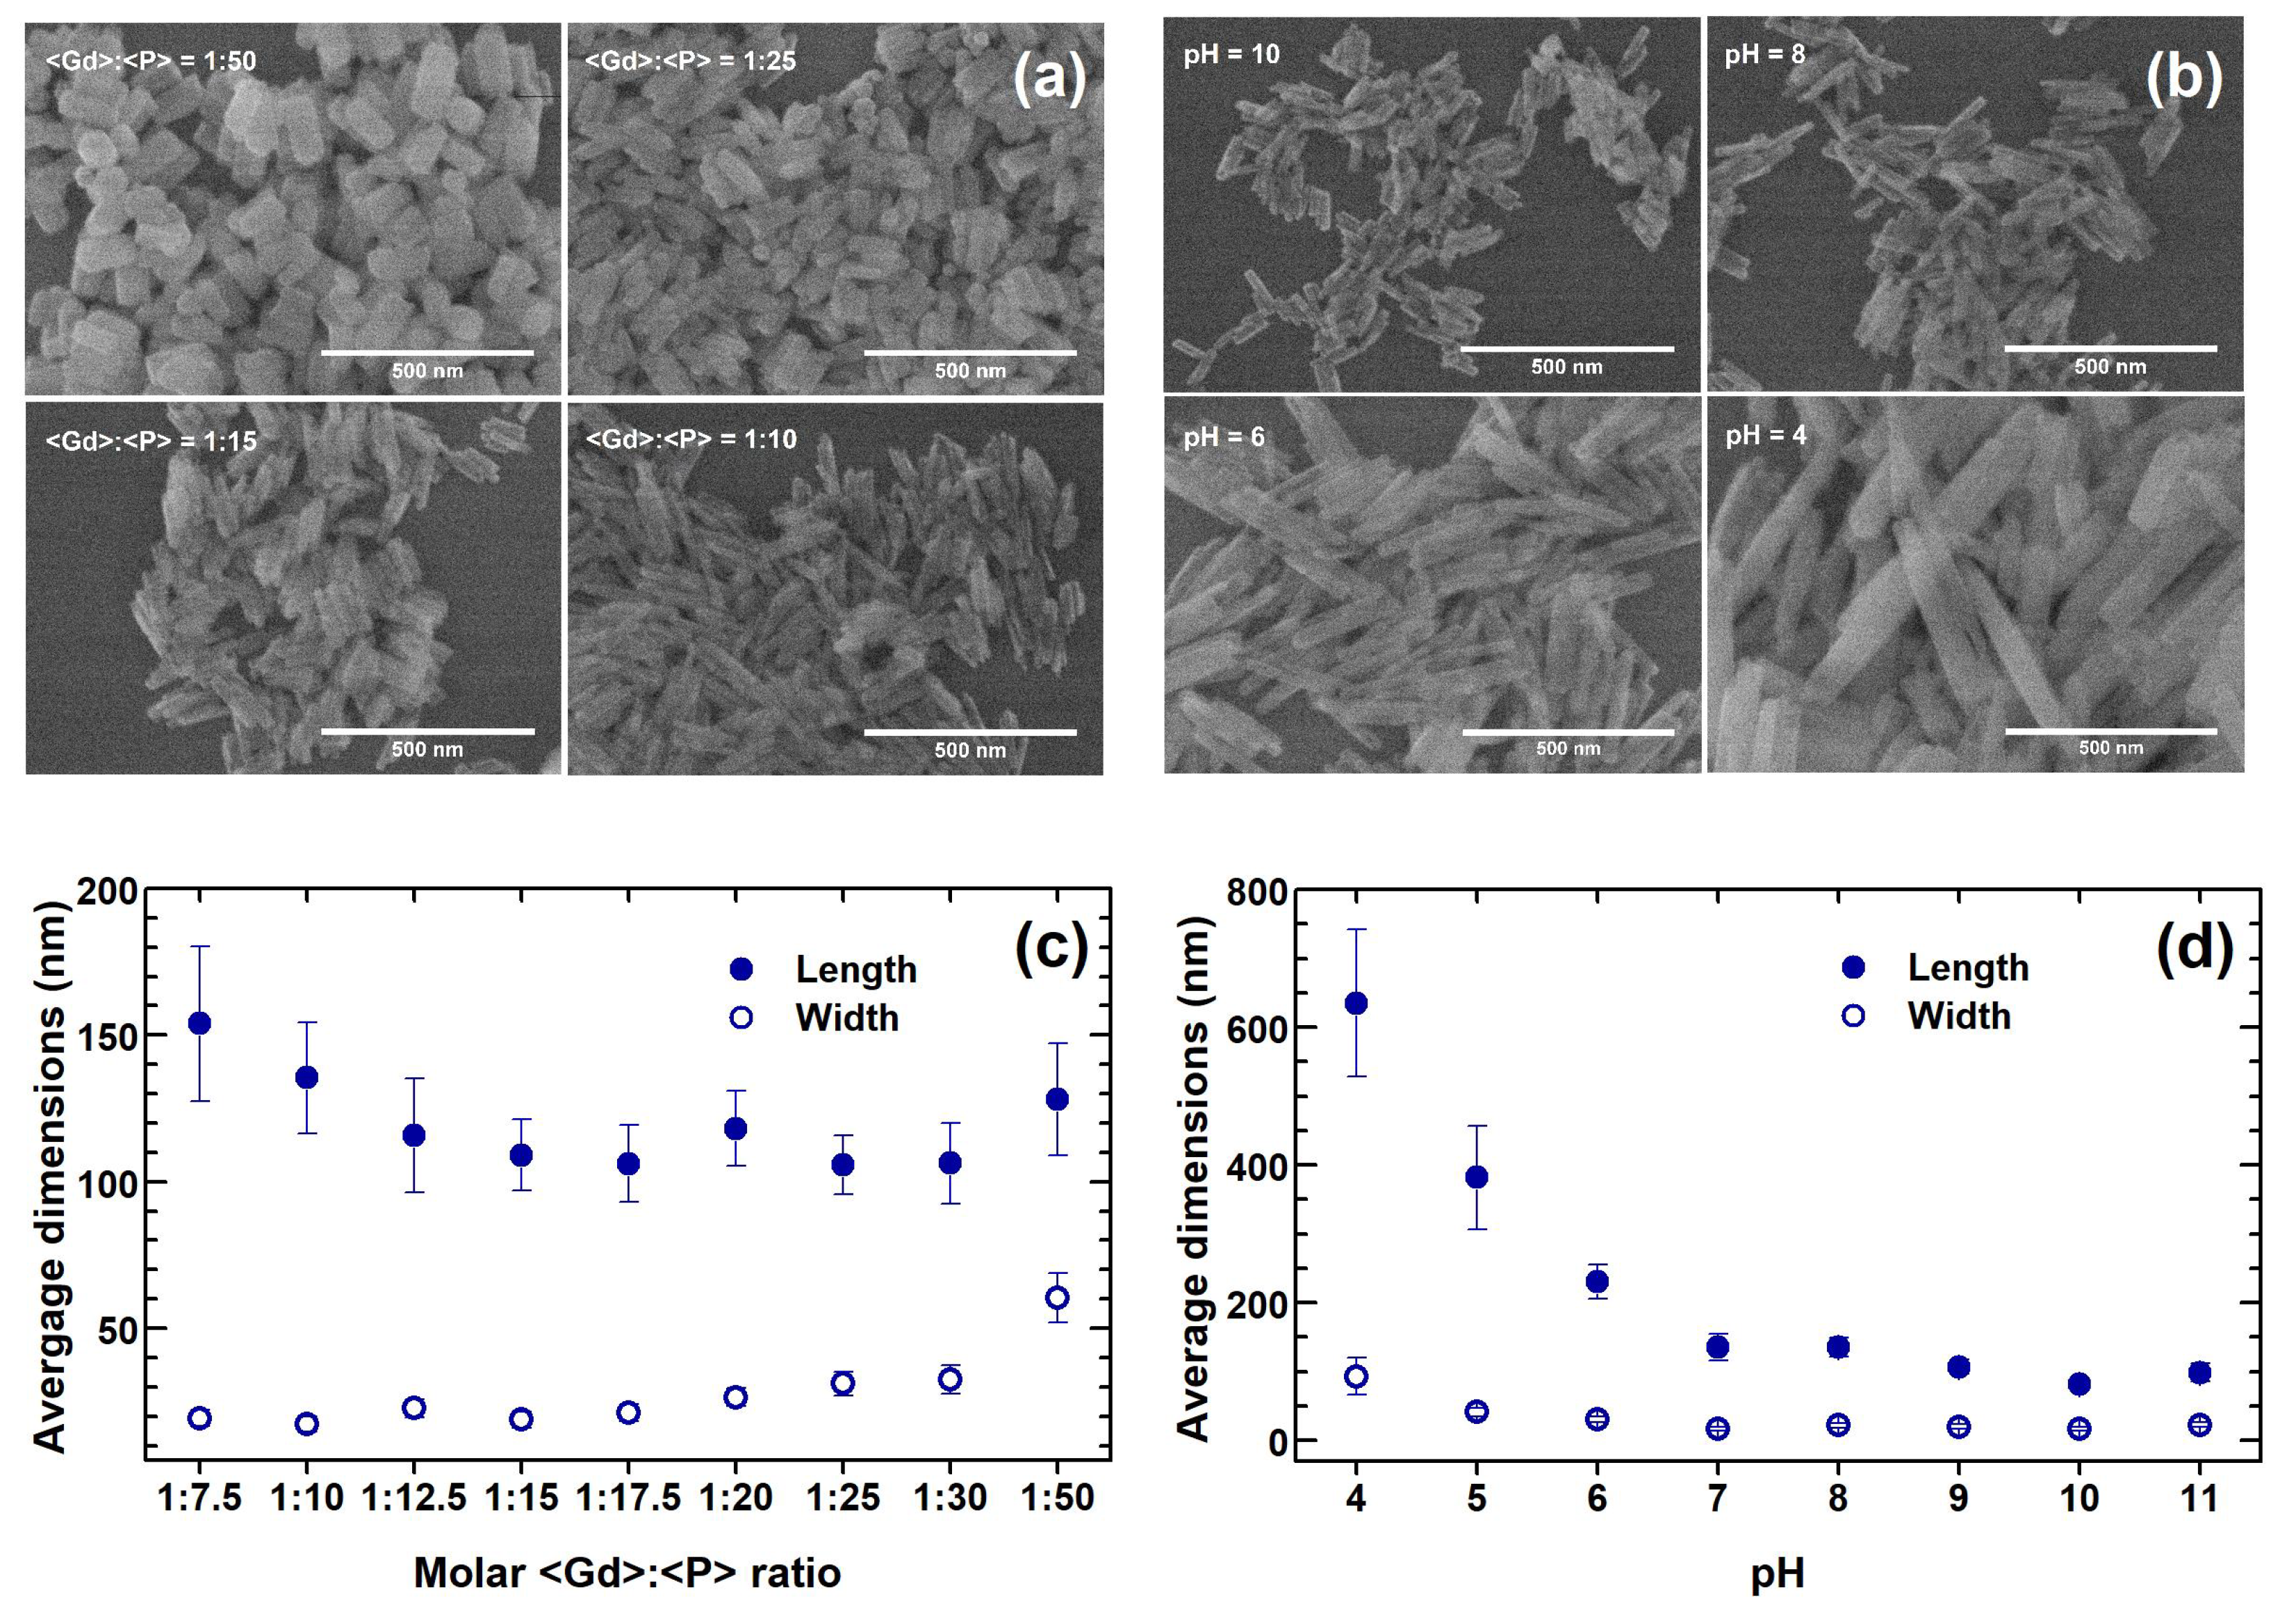
  • nine samples were synthesized under a neutral reaction media (pH = 7) using different <Gd>:<P> molar ratios (1:7.5, 1:10, 1:12.5, 1:15, 1:17.5, 1:20, 1:25, 1:30, 1:50);
  • nine samples were synthesized under a molar ratio of <Gd>:<P> = 1:10 and different pH of the reaction mixture (2, 3, 4, 5, 6, 8, 9, 10, 11).
The detailed synthesis procedure of GdPO4 samples, doped with Eu3+ in alkaline media (pH = 10) at a molar ratio <Gd>:<P> = 1:10, is presented below [13]. Overall, a set of ten GdPO4:Eu3+ nanoparticles was prepared where the Eu3+ concentration was 0.5, 1, 2.5, 5, 7.5, 10, 20, 50, 75, and 100%.
The synthesis procedure starts with the formation of tartaric acid–Ln3+ complex, which was induced by mixing stoichiometric amounts of Ln(NO3)3 (0.4 M) and tartaric acid (30 mL 0.3 M) aqueous solutions. The obtained mixture was left under magnetic stirring conditions for 30 min at room temperature. Afterward, the pH of the produced solution was adjusted to 10 by adding an NH4OH solution. Subsequently, 20 mL of freshly prepared aqueous NH4H2PO4 solution was poured at once, instantly turning the transparent reaction mixture into the turbid one. The morphology of the GdPO4 nanoparticles depends on the <Gd>:<P> molar ratio; therefore, a different concentration of NH4H2PO4 solution was prepared each time since the volume of the solution was kept constant, i.e., 20 mL. Furthermore, the pH of the obtained reaction mixture was again adjusted to 10 using NH4OH solution and then diluted to 80 mL by adding DI water, followed by adjusting the pH value once again, if required. Consequently, the produced solution was left under magnetic stirring conditions for 30 min at room temperature. Finally, the reaction mixture was poured into a Teflon liner and placed inside the stainless-steel autoclave. The hydrothermal reaction took place at a 160 °C for 24 h. The synthesized particles were centrifuged four times at 10,000 rpm for ten minutes. In between centrifugation cycles, particles were washed under ultrasound conditions using deionized (DI) water. The obtained powders were either dried at 70 °C for 24 h or stored in an aqueous media.
The phase purity of prepared GdPO4 or Eu-doped GdPO4 samples was examined by the X-ray diffraction (XRD) technique. XRD patterns were recorded using a Rigaku MiniFlexII diffractometer operating in Bragg–Brentano geometry in a 5° ≤ 2θ ≤ 80° range under a Ni-filtered Cu Kα radiation. The scanning step width was 0.02°, and the scanning speed was 5°/min. A zero-diffraction plate made from Si crystal (MTI Corporation, Richmond, CA, USA) was used as a sample holder.
To determine the morphology and size of the synthesized phosphate particles, scanning electron microscope (SEM) images were taken on a field-emission Hitachi SU-70 electron microscope. The electron acceleration voltage was 5 kV. Particle size and particle size distribution (PSD) were evaluated manually (by taking 50 random particles per sample) using ImageJ (v1.8.0) software.
The Eu3+/Gd3+ ratio in the GdPO4:Eu3+ samples was determined by inductively coupled plasma–optical emission spectroscopy (ICP−OES), using Perkin-Elmer Optima 7000DV spectrometer. The samples were dissolved in nitric acid (Rotipuran® Supra 69%, Carl Roth) and diluted to the required volume with DI water. The calibration solutions were prepared by the appropriate dilution of the stock standard solutions (single-element ICP standards, 1000 mg/L, Carl Roth).
Excitation and emission spectra were recorded with an Edinburgh Instruments FLS980 spectrometer (double grating Czerny-Turner excitation and emission monochromators, 450 W Xe arc lamp, single-photon counting photomultiplier Hamamatsu R928P). When measuring excitation spectra, λem was set to 587.5 nm (excitation and emission slits being 0.50 and 3.50 nm, respectively). Analogously, when measuring emission spectra, λex was set to 393 nm (excitation and emission slits being 3.50 and 0.50 nm, respectively). Each spectrum was recorded with 0.5 nm step width and 0.2 s dwell (integration) time. Emission spectra were corrected for instrument response using the correction file provided by Edinburgh Instruments. Excitation spectra were corrected by a reference detector.
Color coordinates (in CIE 1931 color space) of the synthesized samples were calculated using F980 Spectrometer Software (v.1.3.1) from Edinburgh Instruments.
PL decay curves were recorded with Edinburgh Instruments FLS980 spectrometer using a μ-flash lamp (μF2) as an excitation source. The pulse repetition rate was 25 Hz; λex and λem were set to 393 and 587.5 nm, respectively.
The temperature-dependent excitation and emission spectra and PL decay curves were also recorded with Edinburgh Instruments FLS980 spectrometer, employing cryostat “MicrostatN” from Oxford Instruments (cooling agent–liquid nitrogen) for the temperature control. All measurements were conducted at 77 K and in the range from 100 to 500 K in 50 K intervals (stabilization time was 120 s, and temperature tolerance was set to ±5 K).
TQ1/2 (the temperature at which a luminescent material loses half of its emission intensity) and Ea (activation energy–the amount of energy that must be given to induce thermal quenching) values for the synthesized samples were calculated using the following equations:
I ( T ) = I 0 1 + B e E a k B T
T Q 1 / 2 = E a k B ln 1 B
where I(T)—normalized integrated emission value at a certain temperature (T); I0—the highest normalized integrated emission value (in this case equal to 1); B—quenching frequency factor; kB—Boltzmann constant, equal to 8.6173 · 10−5 eV/K [55].

3. Results and Discussion

XRD patterns of the produced undoped GdPO4 samples match well with the reference pattern at any chosen <Gd>:<P> molar ratio or pH of the reaction mixture (Figure 1). This indicates that phase pure particles with the trigonal crystal structure (space group P3121 (#152)) were obtained.
Figure 2a presents the SEM images of GdPO4 particles, synthesized at neutral reaction media (pH = 7), changing only the <Gd>:<P> molar ratio. These images show that wider nanorods are obtained with decreasing <Gd>:<P> molar ratio (i.e., increasing <P> concentration). The results obtained from the SEM images are in good agreement with the XRD patterns (see Figure 1a). Clearly, the peaks in the XRD pattern of the smallest particles are broader if compared to the XRD patterns of the larger particles. SEM images depicted in Figure 2b reveal that the length of GdPO4 rods tends to decrease from sub-micro to nano-dimensions, with pH values changing from acidic to alkaline. Thus, the pH of the reaction media has a substantially greater effect on the size of the synthesized phosphates than the effect of the <Gd>:<P> molar ratio.
Figure 1 also shows that the ratio of (200) (ca. 30°) and (102) (ca. 32°) peak intensity is sensitive to changes in <Gd>:<P> (please refer to Figure 1a) and synthesis media pH (please refer to Figure 1b). These changes can be explained by analyzing the particle size and shape. For instance, the relative intensity of (200) peak increases with increasing <P> content in the reaction media. The relevant SEM images also show that the particles get wider with increasing <P> concentration. Keeping in mind that the particles grow along the c-axis direction [56], the relative (200) peak intensity must increase since there are more facets on the particle surface related to this lattice plane. Furthermore, Figure 2b shows that the relative intensity of the (200) peak increases with decreasing reaction media pH. It was already discussed that the length of the particles increases with decreasing media pH. At the same time, the width of the nanoparticles barely changes. Therefore, more and more facets related to the (200) lattice plane are on the particle surface, resulting in the increase in the (200) peak intensity. One should also keep in mind that the rod-shaped particles are subject to the preferred orientation, which is also in favor of (200) intensity. The double unit cell (along the c-axis) of the GdPO4 crystal structure, together with (200) and (102) planes, is shown in Figure S1 for better visualization.
SEM images of the synthesized GdPO4 samples were also used to calculate the average size of the produced particles (please refer to Figures S2 and S3 in Electronic Supplementary Information (ESI)). The obtained results are depicted graphically as a function of <Gd>:<P> molar ratio (please refer to Figure 2c) and as a function of the reaction mixture pH (please refer to Figure 2d). With increasing <Gd>:<P> molar ratio, the average particle length and dispersion slightly decreased. On the contrary, the average particle width and PSD tend to increase with increasing <Gd>:<P> molar ratio (please refer to Table S1). As for increasing the pH value of the reaction media, both the length and the width of the phosphate particles and their PSD tend to decrease (please refer to Table S2). This behavior relies on the complexation ability of different phosphate anion species. It is established that the stronger ability of PO43− than H2PO4 and HPO42− to coordinate with RE3+ leads to the preferential formation of REPO4 nuclei. In alkaline media, the dominant phosphate anion species are HPO42− and PO43−. Thus, under such conditions, significantly faster formation of REPO4 nuclei occurs compared to nuclei formation under acidic media. This behavior was also observed by Wang et al. [57].
The smallest and the most monodisperse GdPO4 nanorods were obtained under a molar ratio <Gd>:<P> = 1:10 (pH = 10). Their average length is equal to ca. 81 nm, and their average width is ca. 17 nm. Therefore, these conditions were selected for the synthesis of GdPO4 nanoparticles doped with Eu3+. Moreover, such particles are small enough for biomedical applications since studies show that even larger nanoparticles are successfully accumulated in the cells [19,41].
Figure 3a is the XRD patterns of three out of ten synthesized GdPO4:Eu3+ samples (the Eu3+ concentration in eight samples was 0.5, 1, 2.5, 5, 7.5, 10, 20, 50, 75, and 100%). The given XRD patterns match well with the reference pattern, indicating that produced materials are characterized by trigonal crystal structure with no impurity phases present (the VIII coordinated Gd3+ (R = 1.053 Å) are replaced by VIII coordinated Eu3+ (R = 1.066 Å), which is only 1.23% larger [58] than Gd3+; therefore, such an ionic radii difference falls within the limits of the solid solution formation range determined by Vegard’s law [59]).
SEM images of GdPO4 nanorods containing 1, 10, 20, and 50% Eu3+ are shown in Figure 3b–e, respectively. The SEM images of GdPO4 nanorods, doped with other Eu3+ concentrations, are provided in Figure S4. The calculated average particle sizes are plotted in Figure 3f and tabulated in Table S3. The average length and the width of orthophosphate nanorods vary between ca. 74 to 93 nm and between ca. 16 to 23 nm, respectively. Nevertheless, particle length and thickness variation fall within the standard deviation limits. Therefore, the incorporation of Eu3+ into GdPO4 NPs does not cause significant changes in the size of the obtained nanorods. To confirm that the actual Eu3+ concentration in the GdPO4:Eu3+ samples is the same as the nominal one, the Eu3+ and Gd3+ concentrations were determined by ICP−OES. The nominal and measured values of Eu3+ and Gd3+ concentrations are given in Table S4 and match well with each other. Therefore, we can conclude that Eu3+ easily replaces Gd3+ in the GdPO4 structure.
The excitation spectra (λem = 587.5 nm) of GdPO4:Eu3+ samples doped with 1%, 10%, and 50% Eu3+ are given in Figure 4a. All spectra contain the typical sets of Eu3+ excitation lines originating from the intraconfigurational [Xe]4f6 ↔ [Xe]4f6 transitions: ca. 295 nm (7F05FJ), ca. 317 nm (7F05HJ), ca. 360 nm (7F05D4), ca. 370–390 nm (7F0,15L7,8;5GJ), ca. 395 nm (7F05L6) (the strongest transition), ca. 415 nm (7F15D3), ca. 465 nm (7F05D2), ca. 525 nm (7F05D1), and ca. 532 nm (7F15D1) [36]. The broad excitation band in the range of 250–280 nm is associated with the ligand-to-metal charge transfer (CT) band (O2− → Eu3+) [60]. Moreover, the optical transitions of Gd3+ (ca. 272 nm 8S → 6IJ and ca. 309 nm 8S → 6PJ) are also observed in the excitation spectra of GdPO4:Eu3+ samples when monitoring Eu3+ emission. Therefore, it can be concluded that Gd3+ → Eu3+ energy transfer occurs in these phosphors. This can be confirmed by analyzing the intensity of Gd3+ lines in the excitation spectra. The intensity of Gd3+ excitation lines (ca. 272 nm) is the highest when Eu3+ concentration is the lowest, i.e., 1%. Furthermore, the intensity of Gd3+ excitation lines gradually decreases with increasing Eu3+ concentration. At the same time, the concentration of Gd3+ decreases; thus, there is less Gd3+ that could transfer the energy to Eu3+, resulting in a decline of Gd3+ excitation line intensity. The intensity of Eu3+ excitation lines increases with increasing Eu3+ concentration and reaches the maximum in 50% Eu3+ sample.
The emission spectra (λex = 393 nm) of GdPO4:Eu3+ samples doped with 1%, 10%, and 50% Eu3+ are given in Figure 4b (for the emission spectra of all Eu3+-doped samples, please refer to Figure S5). All the spectra contain the typical sets of Eu3+ emission lines at ca. 578 nm (5D07F0), ca. 590 nm (5D07F1), ca. 615 nm (5D07F2), ca. 650 nm (5D07F3), and ca. 695 nm (5D07F4). Typically, the strongest Eu3+ emission transitions are 5D07F1 (magnetic dipole (MD)) and 5D07F2 (electric dipole (ED)). However, in rare-earth orthophosphates, garnets, and some europium complexes (for instance, Eu(Tp)3 (Tp = hydrotris(pyrazol-1-yl)borate), [Eu(4-picoline-N-oxide)8](PF6)3, etc.), the strongest intensity is observed for the 5D07F4 transition. The high intensity of 5D07F4 transitions in these materials is attributed to the specific symmetry (like D4d) of the compounds or the optical basicity of these materials [36]. This was also the case in our study. Similar to the excitation spectra, the emission line intensity in emission spectra increased with increasing Eu3+ concentration and reached a maximum for the 50% Eu3+-doped sample. This is also the case with the overall emission intensity, which gradually increased, following the same trend (please refer to Figure 4d). Since the excitation spectra of GdPO4:Eu3+ samples (please refer to Figure 4a) also contained the Gd3+ lines, we have also measured the Eu3+ emission spectra upon Gd3+ excitation (λex = 273 nm). The recorded spectra are given in Figure S6. The Eu3+ emission intensity increases up to 10% Eu3+ concentration and then abruptly decreases with a further Eu3+ concentration increase. It is worth mentioning that samples doped with 0.5 and 50% Eu3+ possess virtually the same emission intensity. Since Gd3+ concentration decreases with increasing Eu3+ concentration, the decrease in Eu3+ emission intensity at higher Eu3+ concentrations is caused by lower Gd3+ concentration, leading to a less efficient Gd3+ → Eu3+ energy transfer.
The PL decay curves (λex = 393 nm, λem = 587.5 nm) of GdPO4:Eu3+ samples are shown in Figure 4c. The PL lifetime values were calculated using the following equation [61]:
τ 1 / e = 0 I ( t ) t d t 0 I ( t ) d t
Here, I(t) stands for PL intensity at time t. The change in average τ1/e values as a function of Eu3+ concentration is plotted in Figure 4d, whereas the exact calculated τ1/e values are summarized in Table S7. The PL decay curves get steeper with increasing Eu3+ concentration, indicating that the PL lifetime values decrease. The average PL lifetime values of Eu3+ emission at 587.5 nm decrease from ca. 3043 μs to ca. 173 μs as the concentration of Eu3+ in the NPs increase from 0.5 to 100% (please refer to Figure 4d and Table S5).
The color coordinates in CIE 1931 color space were calculated for each sample doped with Eu3+. The obtained color coordinates are located directly on the edge of the CIE 1931 color space diagram (please refer to Figure 4e), indicating that the red emission of the produced NPs would be perceived as a rich and monochromatic light by the human eye. In addition, with increasing Eu3+ concentration in the samples, a slight red shift of color coordinates is observed. However, this shift is relatively insignificant (especially in heavier Eu3+-doped samples), and color coordinates can be considered stable regardless of the amount of Eu3+ (please refer to Table S5 for the precise calculated color coordinate values).
As was discussed above, the GdPO4:50%Eu3+ phosphor exhibited the highest emission intensity and, therefore, was selected for temperature-dependent measurements. Figure 5a,b shows that the intensity of both excitation and emission spectra of the GdPO4:50%Eu3+ sample drops dramatically when the temperature increases from 77 to 500 K. It is also interesting to note that the excitation spectrum recorded at 77 K does not contain any excitation lines originating from the 7F1 level, indicating that thermal population of this level is significantly suppressed at such low temperature. The normalized integrated emission intensity as a function of temperature is presented in the inset of Figure 5b. These data were used to calculate TQ1/2 and Ea, and the obtained values are equal to 291 ± 19 K and 0.049 ± 0.007 eV, respectively. The TQ1/2 value (in the 77 to 500 K range) showed that this phosphor maintained half of its emission intensity even at room temperature.
The PL decay curves (please refer to Figure 5c) of the GdPO4:50%Eu3+ sample got steeper with increasing temperature, indicating the decreasing average PL lifetime values of Eu3+. This indeed was confirmed after calculating the average PL lifetime values, which are plotted in Figure 5d, and their exact values are given in Table S6. It turned out that the average PL lifetime values of GdPO4:50%Eu3+ phosphor decreased from ca. 871 μs to ca. 257 μs with the temperature increase from 77 to 500 K, which can be related to the decreasing internal efficiency of the phosphor.
The temperature-dependent emission spectra of GdPO4:50%Eu3+ phosphor were also used to calculate the temperature-dependent color coordinates, which are plotted in Figure 5e. The exact calculated values of color coordinates are summarized in Table S6. A slight red shift of calculated color coordinates is observed with the increasing temperature; however, this shift is relatively insignificant, and color coordinates can be considered temperature-stable, especially at higher temperatures.

4. Conclusions

In summary, we have demonstrated that the aqueous hydrothermal synthesis method is highly suitable for preparing GdPO4:Eu3+ nanoparticles possessing hydrophilic surfaces. The nanoparticle size and morphology can be controlled by selecting the appropriate pH and <Gd>:<P> molar ratio. The width of GdPO4 nanoparticles decreased from 93 to 23 nm, and the length decreased from 635 to 99 nm when the pH of reaction media was increased from 4 to 11. Furthermore, the width of GdPO4 nanoparticles increased from 19 to 60 nm, and the length decreased from 154 to 128 nm when the <Gd>:<P> molar ratio was changed from 1:7.5 to 1:50. The nanoparticle size and particle size distribution of the Eu3+-doped samples, on the other hand, remained virtually the same, regardless of the Eu3+ concentration. The PL measurements showed that the emission intensity of GdPO4:Eu3+ samples increased with increasing Eu3+ concentration and reached the maximum for the GdPO4:50%Eu3+ sample. The temperature-dependent measurements in a 77–500 K range revealed that the GdPO4:50%Eu3+ sample possesses relatively high luminescence thermal stability. This sample maintained half of its emission intensity, even at room temperature (TQ1/2 = 291 ± 19 K). The determined thermal optical stability of the Eu3+-doped samples is sufficient for various applications, including luminescent security inks, bio-imaging probes, etc. Recent studies also showed the magnetic properties of GdPO4 nanoparticles. Therefore, the combination of Gd3+ magnetic properties and Eu3+ distinctive luminescence properties extends the possible application field of these nanomaterials even further. Such unique opto-magnetic nanoparticles could be applied in biomedicine as selective bio-imaging probes or MRI contrast materials.

Supplementary Materials

The following supporting information can be downloaded at: https://www.mdpi.com/article/10.3390/cryst13020174/s1, Figure S1: The double unit cell (along c-axis) of GdPO4 crystal structure with (102) plane and (200) plane family (b); Figure S2: SEM images of GdPO4 nanoparticles prepared under different molar <Gd>:<P> ratio at a neutral reaction media (pH = 7); Figure S3: SEM images of GdPO4 nanoparticles prepared under different pH of the reaction media at a fixed <Gd>:<P> = 1:10 molar ratio; Figure S4: SEM images of the GdPO4:Eu3+ samples as a function of Eu3+ concentration. Synthesis conditions: pH = 10; <Gd/Eu>:<P> = 1:10; Figure S5: Emission spectra (λex = 393 nm) of GdPO4:Eu3+ phosphors (a) and 5D07F4 optical transition zoomed in (b); Figure S6: Emission spectra (λex = 273 nm) of GdPO4:Eu3+ phosphors (a) and integrated emission intensity as a function of Eu3+ concentration (b); Table S1: The average dimensions of produced GdPO4 samples at a neutral reaction media (pH = 7) as a function of <Gd>:<P> molar ratio; Table S2: The average dimensions of produced GdPO4 samples using molar ratio <Gd>:<P> = 1:10 at different pH of the reaction media.; Table S3: The average dimensions of produced GdPO4:Eu3+ nanoparticles as a function of Eu3+ concentration. Synthesis conditions: pH = 10; <Gd/Eu>:<P> = 1:10; Table S4: Theoretical and actual (detected using ICP−OES) amounts of Gd3+ and Eu3+ in the prepared samples.; Table S5: PL lifetime values (λex = 393 nm, λem = 587.5 nm) and CIE 1931 color coordinates of GdPO4:Eu3+ nanophosphors.; Table S6: The temperature-dependent PL lifetime values (λex = 393 nm, λem = 587.5 nm) and CIE 1931 color coordinates of GdPO4:50%Eu3+ nanophosphor.

Author Contributions

Conceptualization, V.K. and A.K.; methodology, E.E. and V.K.; investigation, E.E. and A.Z.; resources, A.K.; data curation, E.E.; writing—original draft preparation, E.E. and V.K.; writing—review and editing, A.Z. and A.K.; visualization, E.E. and V.K.; supervision, V.K. and A.K.; funding acquisition, A.K. All authors have read and agreed to the published version of the manuscript.

Funding

This project has received funding from the Research Council of Lithuania (LMTLT), agreement No [S-MIP-22-68].

Institutional Review Board Statement

Not applicable.

Informed Consent Statement

Not applicable.

Data Availability Statement

The data presented in this study are available on request from the corresponding author.

Conflicts of Interest

The authors declare no conflict of interest.

References

  1. Ryoo, R.; Kim, J.; Jo, C.; Han, S.W.; Kim, J.C.; Park, H.; Han, J.; Shin, H.S.; Shin, J.W. Rare-earth-platinum alloy nanoparticles in mesoporous zeolite for catalysis. Nature 2020, 585, 221–224. [Google Scholar] [CrossRef] [PubMed]
  2. Lu, Y.F.; Li, J.; Ye, T.N.; Kobayashi, Y.; Sasase, M.; Kitano, M.; Hosono, H. Synthesis of Rare-Earth-Based Metallic Electride Nanoparticles and Their Catalytic Applications to Selective Hydrogenation and Ammonia Synthesis. ACS Catal. 2018, 8, 11054–11058. [Google Scholar] [CrossRef]
  3. Runowski, M.; Wozny, P.; Martin, I.R. Optical pressure sensing in vacuum and high-pressure ranges using lanthanide-based luminescent thermometer-manometer. J. Mater. Chem. C 2021, 9, 4643–4651. [Google Scholar] [CrossRef]
  4. Sahu, N.K.; Singh, N.S.; Ningthoujam, R.S.; Bahadur, D. Ce3+-Sensitized GdPO4:Tb3+ Nanorods: An Investigation on Energy Transfer, Luminescence Switching, and Quantum Yield. ACS Photonics 2014, 1, 337–346. [Google Scholar] [CrossRef]
  5. Wei, Z.; Liu, Y.W.; Li, B.; Li, J.J.; Lu, S.; Xing, X.W.; Liu, K.; Wang, F.; Zhang, H.J. Rare-earth based materials: An effective toolbox for brain imaging, therapy, monitoring and neuromodulation. Light-Sci. Appl. 2022, 11, 19. [Google Scholar] [CrossRef]
  6. Wu, Y.L.; Xu, X.Z.; Li, Q.L.; Yang, R.C.; Ding, H.X.; Xiao, Q. Synthesis of bifunctional Gd2O3:Eu3+ nanocrystals and their applications in biomedical imaging. J. Rare Earth 2015, 33, 529–534. [Google Scholar] [CrossRef]
  7. Tang, Y.X.; Mei, R.; Yang, S.K.; Tang, H.X.; Yin, W.Z.; Xu, Y.C.; Gao, Y.P. Hollow GdPO4:Eu3+ microspheres: Luminescent properties and applications as drug carrier. Superlattices Microstruct. 2016, 92, 256–263. [Google Scholar] [CrossRef]
  8. Lin, F.; Sun, Z.; Jia, M.C.; Zhang, A.Q.; Fu, Z.L.; Sheng, T.Q. Core-shell mutual enhanced luminescence based on space isolation strategy for anti-counterfeiting applications. J. Lumin. 2020, 218, 6. [Google Scholar] [CrossRef]
  9. Pushpendra; Suryawanshi, I.; Srinidhi, S.; Singh, S.; Kalia, R.; Kunchala, R.K.; Mudavath, S.L.; Naidu, B.S. Downshifting and upconversion dual mode emission from lanthanide doped GdPO4 nanorods for unclonable anti-counterfeiting. Mater. Today Commun. 2021, 26, 10. [Google Scholar] [CrossRef]
  10. Wang, G.F.; Peng, Q.; Li, Y.D. Lanthanide-Doped Nanocrystals: Synthesis, Optical-Magnetic Properties, and Applications. Acc. Chem. Res. 2011, 44, 322–332. [Google Scholar] [CrossRef]
  11. Choi, S.J.; Lee, J.K.; Jeong, J.; Choy, J.H. Toxicity evaluation of inorganic nanoparticles: Considerations and challenges. Mol. Cell. Toxicol. 2013, 9, 205–210. [Google Scholar] [CrossRef]
  12. Klimkevicius, V.; Janulevicius, M.; Babiceva, A.; Drabavicius, A.; Katelnikovas, A. Effect of Cationic Brush-Type Copolymers on the Colloidal Stability of GdPO4 Particles with Different Morphologies in Biological Aqueous Media. Langmuir 2020, 36, 7533–7544. [Google Scholar] [CrossRef] [PubMed]
  13. Janulevicius, M.; Klimkevicius, V.; Vanetsev, A.; Plausinaitiene, V.; Sakirzanovas, S.; Katelnikovas, A. Controlled hydrothermal synthesis, morphological design and colloidal stability of GdPO4·nH2O particles. Mater. Today Commun. 2020, 23, 8. [Google Scholar] [CrossRef]
  14. Cui, X.X.; Fan, Q.; Shi, S.J.; Wen, W.H.; Chen, D.F.; Guo, H.T.; Xu, Y.T.; Gao, F.; Nie, R.Z.; Ford, H.D.; et al. A novel near-infrared nanomaterial with high quantum efficiency and its applications in real time in vivo imaging. Nanotechnology 2018, 29, 11. [Google Scholar] [CrossRef]
  15. Ezerskyte, E.; Grigorjevaite, J.; Minderyte, A.; Saitzek, S.; Katelnikovas, A. Temperature-Dependent Luminescence of Red-Emitting Ba2Y5B5O17: Eu3+ Phosphors with Efficiencies Close to Unity for Near-UV LEDs. Materials 2020, 13, 13. [Google Scholar] [CrossRef] [Green Version]
  16. Priya, R.; Mariappan, R.; Karthikeyan, A.; Palani, E.; Krishnamoorthy, E.; Gowrisankar, G. Review on rare earth metals doped LaPO4 for optoelectronic applications. Solid State Commun. 2021, 339, 26. [Google Scholar] [CrossRef]
  17. Zheng, B.Z.; Fan, J.Y.; Chen, B.; Qin, X.; Wang, J.; Wang, F.; Deng, R.R.; Liu, X.G. Rare-Earth Doping in Nanostructured Inorganic Materials. Chem. Rev. 2022, 122, 5519–5603. [Google Scholar] [CrossRef]
  18. Zhou, J.; Liu, Q.; Feng, W.; Sun, Y.; Li, F.Y. Upconversion Luminescent Materials: Advances and Applications. Chem. Rev. 2015, 115, 395–465. [Google Scholar] [CrossRef]
  19. Klimkevicius, V.; Voronovic, E.; Jarockyte, G.; Skripka, A.; Vetrone, F.; Rotomskis, R.; Katelnikovas, A.; Karabanovas, V. Polymer brush coated upconverting nanoparticles with improved colloidal stability and cellular labeling. J. Mat. Chem. B 2022, 10, 625–636. [Google Scholar] [CrossRef]
  20. Bagheri, A.; Arandiyan, H.; Boyer, C.; Lim, M. Lanthanide-Doped Upconversion Nanoparticles: Emerging Intelligent Light-Activated Drug Delivery Systems. Adv. Sci. 2016, 3, 25. [Google Scholar] [CrossRef]
  21. Cichos, J.; Karbowiak, M. Spectroscopic characterization of ligands on the surface of water dispersible NaGdF4:Ln3+ nanocrystals. Appl. Surf. Sci. 2012, 258, 5610–5618. [Google Scholar] [CrossRef]
  22. Alonso-de Castro, S.; Ruggiero, E.; Fernandez, A.L.; Cossio, U.; Baz, Z.; Otaegui, D.; Gomez-Vallejo, V.; Padro, D.; Llop, J.; Salassa, L. Functionalizing NaGdF4:Yb,Er Upconverting Nanoparticles with Bone-Targeting Phosphonate Ligands: Imaging and In Vivo Biodistribution. Inorganics 2019, 7, 12. [Google Scholar] [CrossRef] [Green Version]
  23. Liu, C.Y.; Gao, Z.Y.; Zeng, J.F.; Hou, Y.; Fang, F.; Li, Y.L.; Qiao, R.R.; Shen, L.; Lei, H.; Yang, W.S.; et al. Magnetic/Upconversion Fluorescent NaGdF4:Yb,Er Nanoparticle-Based Dual-Modal Molecular Probes for Imaging Tiny Tumors in Vivo. ACS Nano 2013, 7, 7227–7240. [Google Scholar] [CrossRef]
  24. Dong, C.H.; Korinek, A.; Blasiak, B.; Tomanek, B.; van Veggel, F. Cation Exchange: A Facile Method To Make NaYF4:Yb,Tm-NaGdF4 Core-Shell Nanoparticles with a Thin, Tunable, and Uniform Shell. Chem. Mat. 2012, 24, 1297–1305. [Google Scholar] [CrossRef]
  25. Song, H.J.; Zhou, L.Q.; Li, L.; Hong, F.; Luo, X.R. Hydrothermal synthesis, characterization and luminescent properties of GdPO4·H2O:Tb3+ nanorods and nanobundles. Mater. Res. Bull. 2013, 48, 5013–5018. [Google Scholar] [CrossRef]
  26. Janulevicius, M.; Klimkevicius, V.; Mikoliunaite, L.; Vengalis, B.; Vargalis, R.; Sakirzanovas, S.; Plausinaitiene, V.; Zilinskas, A.; Katelnikovas, A. Ultralight Magnetic Nanofibrous GdPO4 Aerogel. ACS Omega 2020, 5, 14180–14185. [Google Scholar] [CrossRef] [PubMed]
  27. Cao, Y.Y.; Sun, P.; Liang, Y.M.; Wang, R.R.; Zhang, X. Sol-precipitation-hydrothermal synthesis and luminescence of GdPO4:Tb3+ submicron cubes. Chem. Phys. Lett. 2016, 651, 80–83. [Google Scholar] [CrossRef]
  28. Yang, R.; Qin, J.; Li, M.; Liu, Y.H.; Li, F. Redox hydrothermal synthesis of cerium phosphate microspheres with different architectures. Crystengcomm 2011, 13, 7284–7292. [Google Scholar] [CrossRef]
  29. Feng, S.H.; Xu, R.R. New materials in hydrothermal synthesis. Acc. Chem. Res. 2001, 34, 239–247. [Google Scholar] [CrossRef]
  30. Buissette, V.; Moreau, M.; Gacoin, T.; Boilot, J.P.; Chane-Ching, J.Y.; Le Mercier, T. Colloidal synthesis of luminescent rhabdophane LaPO4:Ln3+·xH2O (Ln = Ce, Tb, Eu; x ≈ 0.7) nanocrystals. Chem. Mater. 2004, 16, 3767–3773. [Google Scholar] [CrossRef]
  31. Huong, N.T.; Van, N.D.; Tien, D.M.; Tung, D.K.; Binh, N.T.; Anh, T.K.; Minh, L.Q. Structural and luminescent properties of (Eu,Tb)PO4·H2O nanorods/nanowires prepared by microwave technique. J. Rare Earths 2011, 29, 1170–1173. [Google Scholar] [CrossRef]
  32. Li, J.G.; Sakka, Y. Recent progress in advanced optical materials based on gadolinium aluminate garnet (Gd3Al5O12). Sci. Technol. Adv. Mater. 2015, 16, 18. [Google Scholar] [CrossRef] [PubMed] [Green Version]
  33. Matos, M.G.; Calefi, P.S.; Ciuffi, K.J.; Nassar, E.J. Synthesis and luminescent properties of gadolinium aluminates phosphors. Inorg. Chim. Acta 2011, 375, 63–69. [Google Scholar] [CrossRef]
  34. Maldiney, T.; Doan, B.T.; Alloyeau, D.; Bessodes, M.; Scherman, D.; Richard, C. Gadolinium-Doped Persistent Nanophosphors as Versatile Tool for Multimodal In Vivo Imaging. Adv. Funct. Mater. 2015, 25, 331–338. [Google Scholar] [CrossRef]
  35. Mahakhode, J.G.; Nande, A.; Dhoble, S.J. A review: X-ray excited luminescence of gadolinium based optoelectronic phosphors. Luminescence 2021, 36, 1344–1353. [Google Scholar] [CrossRef]
  36. Binnemans, K. Interpretation of europium(III) spectra. Coordin. Chem. Rev. 2015, 295, 1–45. [Google Scholar] [CrossRef] [Green Version]
  37. Sun, C.; Pratx, G.; Carpenter, C.M.; Liu, H.G.; Cheng, Z.; Gambhir, S.S.; Xing, L. Synthesis and Radioluminescence of PEGylated Eu3+-doped Nanophosphors as Bioimaging Probes. Adv. Mater. 2011, 23, H195–H199. [Google Scholar] [CrossRef] [Green Version]
  38. Grigorjevaite, J.; Ezerskyte, E.; Minderyte, A.; Stanionyte, S.; Juskenas, R.; Sakirzanovas, S.; Katelnikovas, A. Optical Properties of Red-Emitting Rb2Bi(PO4)(MoO4):Eu3+ Powders and Ceramics with High Quantum Efficiency for White LEDs. Materials 2019, 12, 14. [Google Scholar] [CrossRef] [Green Version]
  39. Díaz García, M.E.; Badía-Laíño, R. Fluorescence | Time-Resolved Fluorescence☆. In Encyclopedia of Analytical Science, 3rd ed.; Worsfold, P., Poole, C., Townshend, A., Miró, M., Eds.; Academic Press: Oxford, UK, 2019; pp. 327–340. [Google Scholar]
  40. Skripka, A.; Cheng, T.; Jones, C.M.S.; Marin, R.; Marques-Hueso, J.; Vetrone, F. Spectral characterization of LiYbF4 upconverting nanoparticles. Nanoscale 2020, 12, 17545–17554. [Google Scholar] [CrossRef]
  41. Kim, D.K.; Dobson, J. Nanomedicine for targeted drug delivery. J. Mater. Chem. 2009, 19, 6294–6307. [Google Scholar] [CrossRef]
  42. Zhang, Y.W.; Yan, Z.G.; You, L.P.; Si, R.; Yan, C.H. General synthesis and characterization of monocrystalline lanthanide orthophosphate nanowires. Eur. J. Inorg. Chem. 2003, 2003, 4099–4104. [Google Scholar] [CrossRef]
  43. Hernandez, A.G.; Boyer, D.; Potdevin, A.; Chadeyron, G.; Murillo, A.G.; Romo, F.D.C.; Mahiou, R. Hydrothermal synthesis of lanthanide-doped GdPO4 nanowires and nanoparticles for optical applications. Phys. Status Solidi A Appl. Mat. 2014, 211, 498–503. [Google Scholar] [CrossRef]
  44. Yan, B.; Gu, J.F.; Xiao, X.Z. LnPO4:RE3+ (La = La, Gd; RE = Eu, Tb) nanocrystals: Solvo-thermal synthesis, microstructure and photoluminescence. J. Nanopart. Res. 2010, 12, 2145–2152. [Google Scholar] [CrossRef]
  45. Ren, W.L.; Tian, G.; Zhou, L.J.; Yin, W.Y.; Yan, L.; Jin, S.; Zu, Y.; Li, S.J.; Gu, Z.J.; Zhao, Y.L. Lanthanide ion-doped GdPO4 nanorods with dual-modal bio-optical and magnetic resonance imaging properties. Nanoscale 2012, 4, 3754–3760. [Google Scholar] [CrossRef]
  46. Budrevicius, D.; Skaudzius, R. Volume dependence of the size of GdPO4:15%Eu particles synthesized by the hydrothermal method. J. Alloys Compd. 2022, 911, 5. [Google Scholar] [CrossRef]
  47. Yaiphaba, N.; Ningthoujam, R.S.; Singh, N.R.; Vatsa, R.K. Luminescence Properties of Redispersible Tb3+-Doped GdPO4 Nanoparticles Prepared by an Ethylene Glycol Route. Eur. J. Inorg. Chem. 2010, 2010, 2682–2687. [Google Scholar] [CrossRef]
  48. Huo, Z.Y.; Chen, C.; Chu, D.; Li, H.H.; Li, Y.D. Systematic synthesis of lanthanide phosphate nanocrystals. Chem. Eur. J. 2007, 13, 7708–7714. [Google Scholar] [CrossRef]
  49. Rodriguez-Liviano, S.; Becerro, A.I.; Alcantara, D.; Grazu, V.; de la Fuente, J.M.; Ocana, M. Synthesis and Properties of Multifunctional Tetragonal Eu:GdPO4 Nanocubes for Optical and Magnetic Resonance Imaging Applications. Inorg. Chem. 2013, 52, 647–654. [Google Scholar] [CrossRef] [Green Version]
  50. Di, W.H.; Wang, X.J.; Zhao, H.F. Synthesis and characterization of LnPO4·nH2O (Ln = La, Ce, Gd, Tb, Dy) nanorods and nanowires. J. Nanosci. Nanotechnol. 2007, 7, 3624–3628. [Google Scholar] [CrossRef]
  51. Huang, C.C.; Lo, Y.W.; Kuo, W.S.; Hwu, J.R.; Su, W.C.; Shieh, D.B.; Yeh, C.S. Facile preparation of self-assembled hydrogel-like GdPO4·H2O nanorods. Langmuir 2008, 24, 8309–8313. [Google Scholar] [CrossRef]
  52. Xu, Z.H.; Cao, Y.; Li, C.X.; Ma, P.A.; Zhai, X.F.; Huang, S.S.; Kang, X.J.; Shang, M.M.; Yang, D.M.; Dai, Y.L.; et al. Urchin-like GdPO4 and GdPO4:Eu3+ hollow spheres—hydrothermal synthesis, luminescence and drug-delivery properties. J. Mater. Chem. 2011, 21, 3686–3694. [Google Scholar] [CrossRef]
  53. Camacho, A.R.; Romo, F.D.C.; Murillo, A.G.; Oliva, J.; Garcia, C.R. Sol-gel synthesis and up-conversion luminescence of GdPO4·Gd3PO7:Yb3+, Ln3+ (Ln = Er, Ho, Tm) phosphor. Mater. Lett. 2018, 226, 34–37. [Google Scholar] [CrossRef]
  54. Kumar, V.; Rani, P.; Singh, D.; Chawla, S. Efficient multiphoton upconversion and synthesis route dependent emission tunability in GdPO4:Ho3+,Yb3+ nanocrystals. RSC Adv. 2014, 4, 36101–36105. [Google Scholar] [CrossRef] [Green Version]
  55. Baur, F.; Glocker, F.; Jüstel, T. Photoluminescence and energy transfer rates and efficiencies in Eu3+ activated Tb2Mo3O12. J. Mater. Chem. C 2015, 3, 2054–2064. [Google Scholar] [CrossRef] [Green Version]
  56. Wang, X.J.; Gao, M.Y. A facile route for preparing rhabdophane rare earth phosphate nanorods. J. Mater. Chem. 2006, 16, 1360–1365. [Google Scholar] [CrossRef]
  57. Wang, Z.H.; Shi, X.F.; Wang, X.J.; Zhu, Q.; Kim, B.N.; Sun, X.D.; Li, J.G. Breaking the strong 1D growth habit to yield quasi-equiaxed REPO4 nanocrystals (RE = La-Dy) via solvothermal reaction and investigation of photoluminescence. Crystengcomm 2018, 20, 796–806. [Google Scholar] [CrossRef] [Green Version]
  58. Shannon, R.D. Revised effective ionic radii and systematic studies of interatomic distances in halides and chalcogenides. Acta Crystallogr. A 1976, 32, 751–767. [Google Scholar] [CrossRef]
  59. Ropp, R.C. Luminescence and the Solid State; Elsevier Science: Amsterdam, The Netherlands, 2004. [Google Scholar]
  60. Jubera, V.; Chaminade, J.P.; Garcia, A.; Guillen, F.; Fouassier, C. Luminescent properties of Eu3+-activated lithium rare earth borates and oxyborates. J. Lumin. 2003, 101, 1–10. [Google Scholar] [CrossRef]
  61. Lahoz, F.; Martin, I.R.; Mendez-Ramos, J.; Nunez, P. Dopant distribution in a Tm3+-Yb3+ codoped silica based glass ceramic: An infrared-laser induced upconversion study. J. Chem. Phys. 2004, 120, 6180–6190. [Google Scholar] [CrossRef]
Figure 1. XRD patterns of the synthesized GdPO4 particles under different synthesis conditions: neutral reaction media (pH = 7) with different <Gd>:<P> molar ratio (a) and molar ratio <Gd>:<P> = 1:10 with different pH of the reaction mixture (b).
Crystals 13 00174 g001
Figure 2. SEM images of GdPO4 nanoparticles prepared under different molar <Gd>:<P> ratios in a neutral reaction medium (a). SEM images of GdPO4 nanoparticles prepared at different pH of the reaction mixture at a fixed <Gd>:<P> = 1:10 molar ratio (b). Average dimensions of GdPO4 particles as a function of <Gd>:<P> molar ratio (pH = 7) (c) and as a function of the reaction mixture’s pH (<Gd>:<P> = 1:10) (d).
Crystals 13 00174 g002
Figure 3. XRD patterns of GdPO4:Eu3+ samples as a function of Eu3+ concentration (a). SEM images of GdPO4:Eu3+ samples doped with 1%, 10%, 20%, and 50% Eu3+ (be, respectively). The average dimensions of GdPO4:Eu3+ particles as a function of Eu3+ concentration (f). Synthesis conditions: pH = 10; <Gd/Eu>:<P> = 1:10.
Crystals 13 00174 g003
Figure 4. Excitation (λem = 587.5 nm) (a) and emission (λex = 393 nm) (b) spectra of GdPO4:Eu3+ samples. PL decay curves (λex = 393 nm, λem = 587.5 nm) of GdPO4:Eu3+ particles (c) and calculated τ1/e values together with normalized integrated emission intensity values as a function of Eu3+ concentration (d). CIE 1931 color space coordinates of GdPO4:Eu3+ phosphors (e). Synthesis conditions: pH = 10; <Gd/Eu>:<P> = 1:10.
Crystals 13 00174 g004
Figure 5. Temperature-dependent excitation (λem = 587.5 nm) (a) and emission (λex = 393 nm) (b) spectra with normalized integrated emission intensity as a function of temperature (inset); temperature-dependent PL decay curves (λex = 393 nm, λem = 587.5 nm) (c), average τ1/e values (d) and CIE 1931 color coordinates (e) as a function of the temperature of GdPO4:50%Eu3+ phosphor.
Crystals 13 00174 g005
Disclaimer/Publisher’s Note: The statements, opinions and data contained in all publications are solely those of the individual author(s) and contributor(s) and not of MDPI and/or the editor(s). MDPI and/or the editor(s) disclaim responsibility for any injury to people or property resulting from any ideas, methods, instructions or products referred to in the content.

