1. Introduction
Structural biology has always been on a relentless pursuit to unravel the intricate details of molecular architecture and its implications for function [
1]. For decades, traditional experimental techniques like X-ray crystallography, nuclear magnetic resonance, and cryo-electron microscopy have paved the way for groundbreaking discoveries. However, despite their invaluable contributions, these techniques come with inherent limitations, often centered around resolution constraints, laborious sample preparation, and time-intensive analysis. This is changing thanks to artificial intelligence (AI)—a transformative force that is reshaping many scientific disciplines, including structural biology.
AlphaFold2, developed by DeepMind, stands as a paragon in this AI-driven revolution, showcasing unprecedented accuracy in predicting protein structures [
2]. Its success in the 14th Critical Assessment of Structure Prediction (CASP14) elucidated the potential of machine learning models in decoding the protein folding problem, a challenge that had remained enigmatic for nearly half a century. The beauty of AlphaFold2 lies not just in its predictive precision but also in its capability to offer estimations of prediction confidence that limit the risk of overinterpretation.
Yet, the accessibility to such high-level AI models remained a barrier for many researchers, a gap that ColabFold sought to bridge [
3], making predictions considerably faster and available to a broader spectrum of scientists irrespective of their computational expertise.
Evolutionary Scale Modeling (ESM) provides an additional approach, leveraging evolutionary data to create embeddings that capture protein sequence relationships and their structural implications through a large language model [
4]. This melding of evolutionary biology with deep learning showcases the potential synergy of interdisciplinary integration in advancing our understanding of biomolecular systems.
Nevertheless, it is crucial to exercise prudence and avoid undue excitement [
5]. Indeed, AI has the potential to generate unforeseen advancements that are now beyond our collective imagination. Consequently, it becomes imperative to undertake a rigorous assessment of AI-driven computational models to ensure their reliability and accuracy [
6]. Several articles have recently emerged that have started to examine this particular issue. Numerous critical aspects of the AlphaFold2 models have been examined by Akdel and colleagues [
7]. It was remarked that only half of the chalcogen bonds observed in high-resolution crystal structures are discernible in the corresponding models deposited in the AlphaFold protein structure database [
8]. Additionally, Holcomb and colleagues have explored the potential application of these models in computational docking [
9]. Buel and Walters have observed that AlphaFold2 appears to be unsuitable for predicting the structure of mutants [
10]. Recently, Podvalnaya and colleagues were able to phase a protein crystal structure with an AlphaFold2 model [
11]. Stevens and He examined the reliability of loops’ structure predictions [
12]. The performance of AlphaFold2 in predicting VHH structures has been compared to those of several other methods [
13]. It is plausible to anticipate that a multitude of further studies of this kind will be undertaken and disseminated in future research.
This communication is centered on protein flexibility and on the information that ColabFold/AlphaFold2 models can provide on it.
All molecules, including proteins, are flexible, which has an obvious impact on both their thermodynamic stability and on their reactivity [
14,
15,
16,
17,
18,
19,
20]. In crystal and cryo-EM structures, the local flexibility of globular proteins is monitored though the B-factors [
21,
22]. Regions characterized by high B-factors are considered to be more flexible and less rigid.
ColabFold/AlphaFold2 does not predict B-factors but computes a score for each residue named pLDDT, which indicates the estimated level of confidence of the predicted structure [
2]. It is the predicted value of the Local Distance Difference Test (lDDT), which is the score that evaluates local distance differences of all atoms in a model [
23]. Being based on internal coordinates—it compares the inter-atomic distances of one structure to the same distances in the other structure—it does not require the superposition of the two structures that are compared and it is, consequently, a robust tool for the assessment of structure predictions without manual intervention. pLDDT values range from 0 to 100 and pLDDT ≥ 90 indicates residues predicted with extremely high confidence, whereas residues with 90 > pLDDT ≥ 70 are classified as confident. Residues with 70 > pLDDT ≥ 50 are considered to be predicted with low confidence, and those whose pLDDT is less than 50 are predicted with extremely low confidence, which could mean that the prediction is impossible [
2,
24].
A correlation between pLDDT and conformational disorder has been recently observed. Ordered protein regions have, in general, pLDDT values larger than 80 while low pLDDT values are often observed in intrinsically disordered regions—pLDDT values below 50 are present in approximately half of them [
25]. This is not surprising, since AlphaFold2 was designed to reproduce experimental observations. These AI-based methods, such as the well-known ChatGPT, reproduce the information encapsulated in the enormous amounts of data that were utilized in their training. The inherent scope of these methods allows for greater confidence in predicting the positions of well-ordered atoms/residues compared to disordered atoms/residues, for which structural information is limited.
Atoms that oscillate little around a unique equilibrium position exhibit a sharp and distinct electron density and their positions can be determined with high accuracy and small B-factors. On the contrary, atoms that oscillate with high amplitude around two or more equilibrium positions exhibit a blurry electron density and their position can be determined with lower accuracy and large B-factors. B-factors have actually been used, despite not being portable amongst structures [
21], to estimate the positional standard errors of individual atoms in protein crystal structures [
26,
27]. It can be expected that the positions of well-ordered atoms are more reproducible than those of atoms that are more flexible. Consequently, one can expect that AlphaFold2 can predict the position of well-ordered atoms better than the positions of less-ordered atoms, and this should be reflected in greater pLDDT values for well-ordered atoms and in lower pLDDT values for less-ordered atoms. In other words, one may postulate that diminished levels of confidence may be associated with local molecular flexibly.
In order to verify the hypothesis that pLDDT values relate to local conformational flexibility, in this study, the B-factor and the pLDDT values were systematically compared. Two distinct sets of protein crystal structures were compiled using the data archived in the Protein Data Bank (PDB) [
28,
29,
30]. These sets consist of high-quality structures that are both non-redundant. One set comprises structures obtained at ambient temperature within the range of 288–298 K, while the second set encompasses structures obtained at low temperature within the range of 95–105 K. Both the B-factors in their original form as deposited in the Protein Data Bank (PDB) and the B-factors normalized to have a zero mean and unit variance were used. Nevertheless, it was observed that the B-factors exhibited no correlation with the pLDDT value. This suggests that the pLDDT values do not convey any substantive physical information, but rather serve only their intended purpose of estimating the confidence in internal predictions.
Obviously, this does not imply that models made with ColabFold/AlphaFold2 are intrinsically unreliable. It simply means that the prediction confidence suggested by the pLDDT values is unrelated to local conformational flexibility.
2. Methods
All the X-ray crystal structures were taken from the Protein Data Bank—structures determined using other techniques were discarded [
28,
29,
30]. They were divided into two groups: one, named the “room set”, containing structures determined at room temperature in the 288–298 K range; and the other, named “cryo set”, containing the structures determined at low temperature in the 95–105 K range. Each group was then processed as follows.
Structures refined at a resolution lower than 2 Å were discarded as well as the multi-model of Cα-only refinements. Since individual atomic B-factors must be analyzed, TLS-refined structures and structures refined using non-crystallographic symmetry restraints were discarded. Since experimental protein structures must be compared to computational models, structures containing nucleic acids were discarded as well as structures containing too many (more than 5%) heteroatoms different to water and structures containing missing residues—those that are undetectable in the electron density maps.
Redundancy was then reduced at the sequence level by using CD-HIT (maximal pairwise sequence identity 40%) [
31]. Only proteins of up to 150 residues were retained.
Since it is well known that B-factors reflect numerous structural features [
21], ranging from atomic oscillation around the equilibrium position to conformational disorder, and since they depend on the crystallographic resolution too, it is necessary to normalize them when different crystal structures are compared. Here, the normalized BN-factors were computed as
where
Bave and
Bstd are the average value of the B-factors of the n protein atoms and the standard deviation of their distribution, respectively.
Thanks to this normalization, the BN-factors have zero mean and unit variance in each protein crystal structure.
The construction of all computational models was accomplished via ColabFold [
3], employing AlphaFold2 [
2] for the purpose of structure prediction, employing a total of three prediction cycles. ColabFold exhibits enhanced computational efficiency compared to the original version of AlphaFold2 due to the use of a faster homology search methodology (MMseqs2) [
32]. In all other aspects, ColabFold remains comparable to AlphaFold2. The use of templates sourced from the Protein Data Bank was permitted, followed by the application of Amber energy minimization. The model that achieved the highest ranking was selected for the purpose of comparing it with the experimental structure.
An invaluable feature of AlphaFold2 is the residue-based estimation of the prediction confidence. This is the pLDDT, which ranges from 0 to 100—though I have never seen this extreme value in reality. According to the AlphaFold2 manual, when the pLDDT value exceeds 90, it indicates that the predictions for both main-chain and side-chain atoms are regarded reliable. On the other hand, if the pLDDT value falls between 70 and 90, there is a higher likelihood of mistakes occurring essentially in the side-chain atoms. If the value of pLDDT falls in the range of 50 to 70, mistakes may occur in the main-chain atoms, and if the value of pLDDT is less than 50, the predictions might be considered very untrustworthy, indicating that making accurate predictions becomes unfeasible.
Secondary structures were assigned using Stride [
33] and DSSP [
34] and, since the results were substantially independent of the assignment procedure, those only produced using Stride are discussed.
Atomic solvent-accessible surface areas, measured in squared Å employing NACCESS [
35], were used to monitor the level of solvent accessibility (
SASA_atom) of each individual atom. Using the same tools, the relative solvent-accessible surface areas were calculated for residues when all of their atoms are taken into account (
rel_SASA_residue). It is a dimensionless quantity, it spans from 0 to around 100, and it is defined as the ratio (multiplied by 100) between the solvent-accessible surface area of residue X and the solvent-accessible surface area of the same residue in a G-X-G three-peptide in the extended conformation.
Crystal packing contacts were identified as previously described [
36] with an inter-atomic distance threshold of 4.5 Å.
3. Results and Discussion
Some correlation between pLDDT and conformational disorder has been recently observed, since ordered protein regions have, in general, pLDDT values larger than 80 while low pLDDT values are often observed in intrinsically disordered regions [
25]. Moreover, long segments of residues with poor confidence in the predicted structure are thought to be conformationally disordered [
7]. This is of crucial importance because structural flexibility is essential to the thermodynamic stability and reactivity of proteins [
14,
15,
16,
17,
18,
19,
20].
The pLDDT parameter, which has a range of 0 to 100, is used to estimate prediction confidence [
2]. When the value is less than 50, it indicates that the forecast is not achievable, or that it is totally unreliable. Structural moieties with values in the 50–70 range should be carefully examined since they may significantly differ from the experimental structure. Particularly for the main-chain atoms, values in the 70–90 range suggest that the structure is probably comparable to an experimental structure. Values greater than 90 eventually suggest that the structure is probably almost exactly the same as the experimental structure.
Since B-factors in crystal and cryo-EM structures monitor protein flexibility [
21,
22], it is important to calculate the degree of correlation between B-factor and pLDDT values to confirm whether computational models offer a straightforward way to gain knowledge about local flexibility in globular proteins.
In order to achieve this goal, a high-quality set of non-redundant protein must be examined. However, as the temperature at which experiments are conducted has significant effects on flexibility, two non-redundant sets of protein structures were built: one at room temperature (288–298 K) and the other at a low temperature (95–105 K). In both cases, only proteins up to 150 residues were retained. The latter is larger because, in modern times, diffraction measurements are usually conducted at 100 K. However, no particular discrepancies were found between the two sets of data, as can be seen below.
Furthermore, B-factors were normalized to have mean values equal to zero and a standard deviation equal to one because they are not very transferable from structure to structure and may depend on a variety of parameters, such as the crystallographic resolution [
21,
37]. However, no particular differences were found, by using raw B-factors of normalized B-factors, as can be seen below.
Pearson correlation coefficients were used to quantify the degree of correlation between pLDDT and B-factors. I start by quickly going over the examination of the relationship between the B-factor and pLDDT for every protein atom in each structure. Subsequently, I focus only on atoms for which the structure is highly confidently predicted (pLDDT > 70). Then, in order to rule out the impacts of data aggregation, I concentrate on 48 distinct types of atoms. Eventually, normalized B-factors are used for the analyses where all atoms of all proteins can be mixed into a unique large set of data.
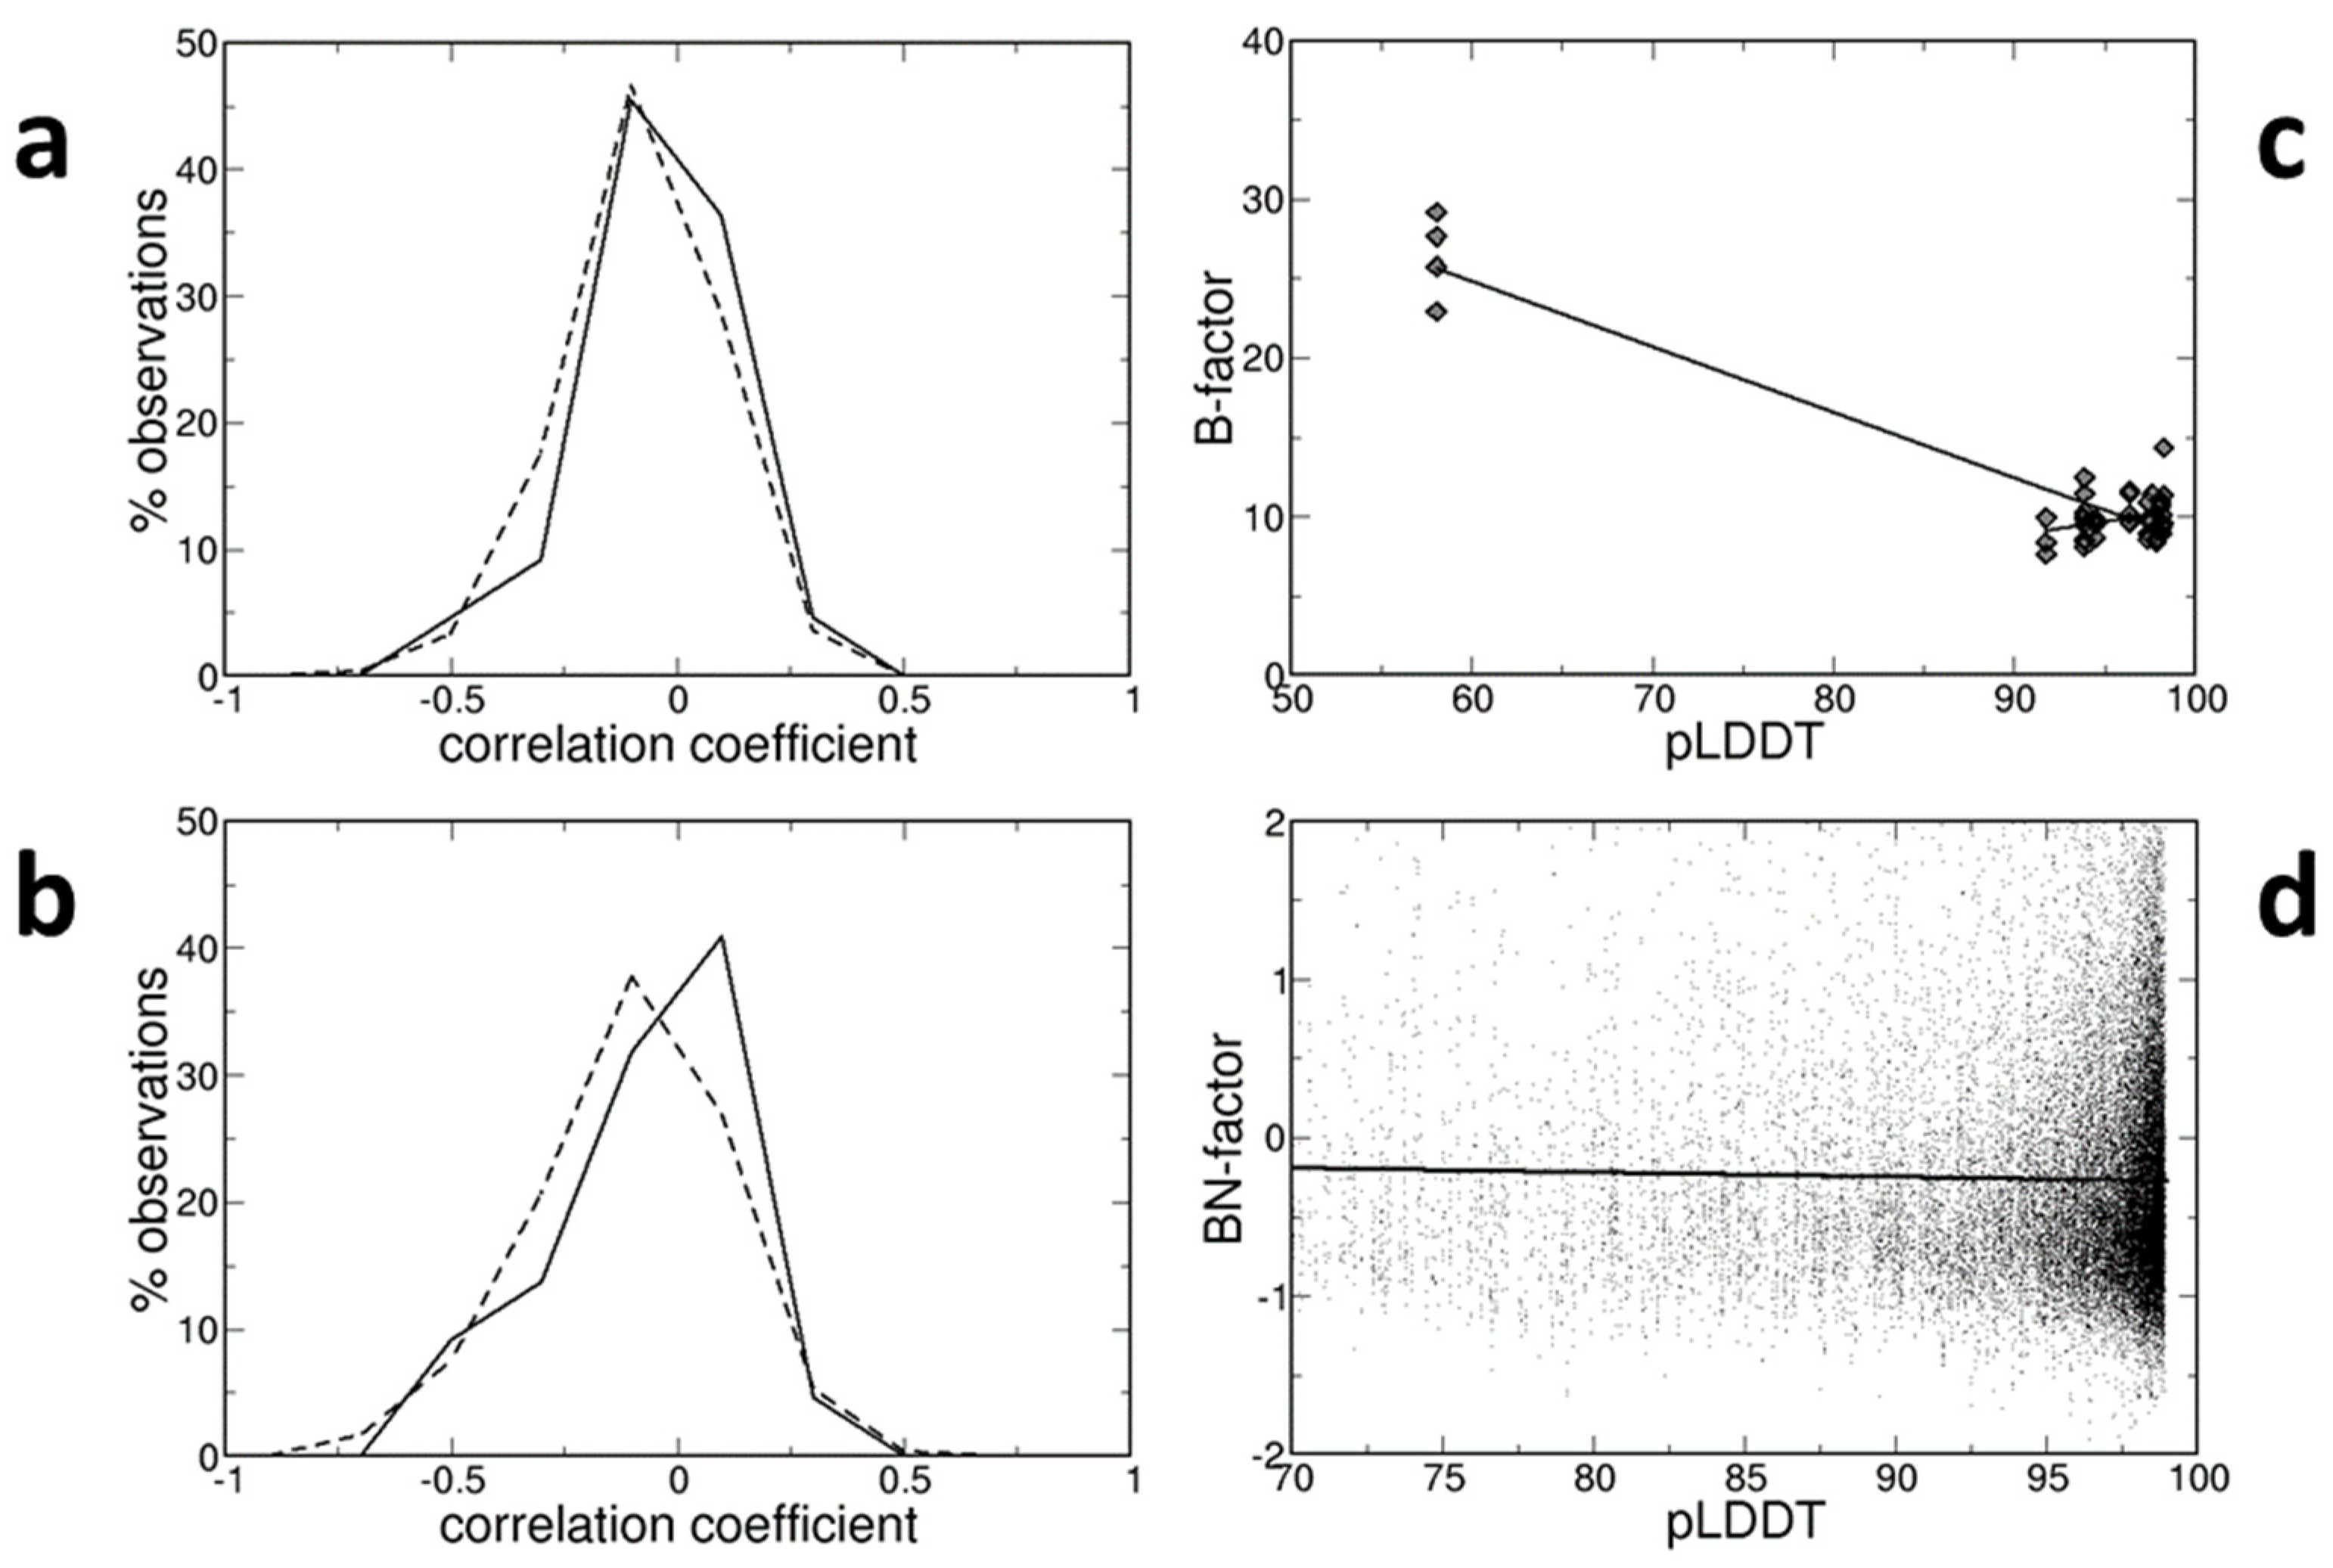
Pearson correlation coefficients between B-factors and pLDDT values were computed for all atoms in each structure. Their distributions are shown in
Figure 1a for both room-temperature and low-temperature structures. They are very similar and symmetric around 0. For room-temperature structures, they range from −0.431 to +0.242 with a mean value of −0.056 (±0.036). For low-temperature structures, they range from −0.612 to +0.364 with a mean value of −0.067 (±0.009). In both cases, the average correlation coefficient is negative, indicating that the smaller B-factors tend to be observed at increasing pLDDT values. However, the correlation is extremely week.
The same analysis was conducted with a smaller group of atoms. Just one atom, the Cα atom, was kept for each residue since the pLDDTs are linked to residues rather than atoms and because residues include a variety of atom types, some of which are even quite distinct from one another. In addition, atoms whose position was predicted with low confidence (pLDDT < 70) were discarded, since it is reasonable to assume that B-factors cannot monitor positional flexibility for completely incorrect positions—this would be experimentally observed in regions where there is no electron density.
The distributions of correlation coefficients, shown in
Figure 1b, are not very different from those of
Figure 1a. They are quite symmetric around 0. For room-temperature structures, they range from −0.493 to +0.286 with a mean value of −0.069 (±0.044). For low-temperature structures, they range from −0.685 to +0.401 with a mean value of −0.105 (±0.012). Therefore, both mean values are negative, indicating that B-factors tend to be smaller at larger pLDDTs, but their absolute values are very small and close to 0, indicating that such a correlation, if it exists, is very weak.
The correlation between B-factors and pLDDT values has been examined individually for 48 atom types, according to the following categorizations:
Main- or side-chains atoms (two categories).
Secondary structure of the residue to which it belongs (three categories: helix, strand, loop).
Solvent accessibility of the residue to which it belongs (two categories: accessible if rel_SASA_residue > 5 and inaccessible if relative rel_SASA_residue ≤ 5).
Atomic solvent accessibility (two categories: accessible if atomic SASA_atom > 2 Å2 and inaccessible if SASA_atom ≤ 2 Å2).
Presence of interatomic contacts with other chains in the crystal structure, either within the same asymmetric unit or crystal packing contacts (two categories: presence or absence of inter-chain contacts).
Usually, the correlation coefficients are small and close to 0. Occasionally, they are surprisingly large. For example, in the PDB entry 2py0 (chain A), the correlation coefficient is equal to −0.925, very close to the minimal possible value, if the attention is focused on the main-chain and solvent-accessible atoms involved in inter-chain contacts and belonging to solvent-accessible residues located in loops. However, this is essentially due (see
Figure 1c) to the presence of a small group of atoms with pLDDT ≈ 60 and B-factor ≈ 25 Å
2 and another set of atoms grouped at larger pLDDT values (≈95) and smaller B-factors (≈10 Å
2). The regression line (B = 49.51 − 0.41 pLDDT), therefore, simply links the two groups of atoms and does not indicate a genuine relationship between the two variables. If the analysis is limited to the atoms of the second, larger group, the correlation coefficient is much closer to 0 (0.292) and the regression line even has a slope with different sign (B = −7.10 + 0.18 pLDDT).
Due to the effect of resolution and other variables, B-factors are not portable and must be normalized for quantitative comparisons between different crystal structures [
20]. The normalized BN-factors (see Methods) were computed for all Cα atoms, the positions of which were predicted with high confidence (pLDDT > 70). There is no correlation between BN-factors and pLDDT values (see
Figure 1d). Despite the fact that the correlation coefficient is negative (−0.020), indicating that BN-factors decrease as pLLDT values rise, the regression line (B = 0.010 − 0.003 pLDDT) is essentially flat and horizontal. Note that only the information retrieved from the structures determined at low temperatures is shown in
Figure 1d, though room-temperature structures provide the same findings.
4. Conclusions
Understanding protein stability and reactivity requires knowledge of globular protein flexibility [
14,
15,
16,
17,
18,
19,
20]. Since residues predicted with low confidence may be more flexible than residues predicted with high confidence, it was recently suggested that AI-based protein structure predictions made using AlphaFold2/ColabFold might provide information on protein flexibility [
25]. This might be possible thanks to the pLDDT values, which were designed to estimate the degree of confidence of the predictions [
2,
3]. In fact, pLDDT values larger than 80 are usually associated with ordered protein regions, while intrinsically disordered regions have low pLDDT values, often lower than 50 [
25]. For this reason, the pLDDT values can be compared to the B-factors, which reflect local flexibility [
21,
22]. Unfortunately, the comparison detailed in the present scientific communication revealed no relationship between pLDDT and the B-factor. This is not to say that AI-based models are unreliable; rather, it just means that, in contrast to experimental structures, they are unable to provide direct information on local flexibility for time. This limitation does not lessen their value in structural biology, but it should be considered as a future challenge for AI-based structural bioinformatics. Nevertheless, it is plausible to assume that they may provide some insights into dynamics by allowing structure-based predictions of B-factor values [
38,
39,
40,
41].
This does not mean that artificial intelligence cannot be involved in the study of protein flexibility and dynamics. Machine learning, in particular, has been used to construct force fields based on the analysis of large amounts of data obtained through traditional and expensive molecular fdynamics methods [
42]. For example, in recent times, several research groups have collaborated in order to develop coarse-grained molecular potentials that are founded upon statistical mechanics by using artificial neural networks [
43]. Based on a series of molecular dynamics simulations of approximately 9 ms for twelve proteins and polypeptides with different folds, a potential was constructed that allows for coarse-grained simulations, which are much faster than traditional methods based on examining all atoms. Even if the results of this study are still of modest practical use, it is reasonable to think that this is the way in which artificial intelligence can make a revolutionary contribution to the stage of protein flexibility.


