Abstract
New aquamarine deposits have been found around the world in recent years, and how to compare and distinguish aquamarines of different origin has become a significant problem. Aquamarines from Koktokay, Minas Gerais, and Namaqualand were collected for standard gemology tests, spectroscopy, and chemical analysis in this paper. The spectroscopy experiment included infrared spectroscopy and Raman spectroscopy. Chemical composition analysis comprises electron microprobe and laser ablation–inductively coupled plasma–mass spectrometry (LA-ICP-MS). The results show that infrared absorption peaks related to [Fe2(OH)4] and NaH are found in Koktokay and Minas Gerais aquamarines, respectively. Compared with other two origins, Namaqualand aquamarine have strongest type II water Raman peak related to alkali metal content. Compared with aquamarines from other sources, aquamarines from Xinjiang and Minas Gerais are characterized by relatively high aluminum and low alkali contents in chemical composition, while Namaqualand aquamarine have a high scandium content.
1. Introduction
Beryl is one of the most common beryllium-containing minerals, and is formed only in particular geological environments. There are several types of beryllium ore deposits, but three are predominant: granitic pegmatite deposits, volcanogenic, and carbonate-hosted pegmatite deposits. These deposits are distributed throughout the world and the presence of beryl, especially in large crystals, is typically associated with granitic pegmatites [1,2].
The chemical formula of beryl is Be3Al2Si6O18. In beryl crystal, the [Si6O18] hexagonal rings consist of [SiO4] tetrahedron (T1 site) arranged perpendicular to the C-axis, and a channel structure parallel to the C-axis is formed. The hexagonal rings are connected to each other by [BeO4] tetrahedra and [AlO6] octahedra [3]. In [BeO4] (T2 site), the Be2+ ion is mainly replaced by Li+, and the charge deficiency from this is compensated by the entry of other alkali metal ions (Na+, K+, Rb+, and Cs+), which preferentially localize in the channel (CH site). In [AlO6] octahedrons (O site), Al3+ can be replaced by Fe3+, Cr3+, Fe2+, Mn2+, Ca2+, and Mg2+. When Al3+ cations are replaced by divalent cations, the charge deficiency is also compensated by the entry of alkali metal ions [4]. The channels also incorporate water molecules, which arrange themselves in two ways: type I water, with a H-H direction parallel to the C-axis, and type II water, with a H-H direction perpendicular to the C-axis (Figure 1) [5].
Based on its color, beryl is divided into different varieties, such as emerald, aquamarine, heliodor, morganite, red beryl, and goshenite [6]; in particular, the aquamarine shows a blue color similar to that of the sea and a high transparency. As new deposits of aquamarine are continuously being discovered [2,7,8,9], it has become important to establish parameters to ascertain the different origins of this species when present on the market.
The spectroscopic measurements are nondestructive and can determine some basic information related to chemical composition [10]. The EMPA and LA-ICP-MS techniques are the ones mainly used for in situ mineralogical analysis [11,12,13,14,15], and for the determination of the origin of the gem [10,16,17,18]. Thus, the combination study of spectroscopic signature and chemical composition can provide more comprehensive information about the gemstone. In this study, we investigated aquamarine samples from three countries which are the most representative in terms of provenance and are commonly found in business: Xinjiang in China, Minas Gerais in Brazil, and Namaqualand in South Africa. Gemology, spectroscopy, and major and trace element analyses were performed to determine their characteristics and differences. The result of this study will provide indications for determining the properties of Xinjiang, Minas Gerais, and Namaqualand aquamarines and distinguishing their origins.
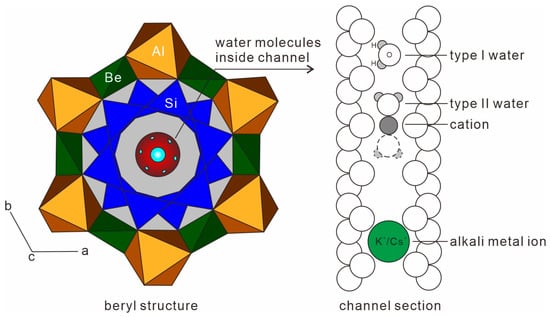
Figure 1.
Beryl crystal structure and channel section, modified from [19,20].
2. Materials and Methods
Four aquamarines were selected randomly from samples of different origins for further analysis. Those four samples from Xinjiang, China (XJ-1, XJ-2), Minas Gerais, Brazil (MG), and Namaqualand, South Africa (NA) were examined using standard gemological tests, infrared spectroscopy, Raman spectroscopy, electron microprobe (EMPA), and laser ablation–inductively coupled plasma–mass spectrometry (LA-ICP-MS) (Figure 2 and Figure 3).
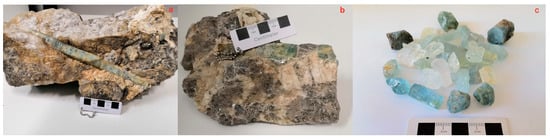
Figure 2.
(a,b) Aquamarine crystals in pegmatite from Koktokay, Xinjiang (XJ-1 and XJ-2). (c) Aquamarine samples from multiple origins.
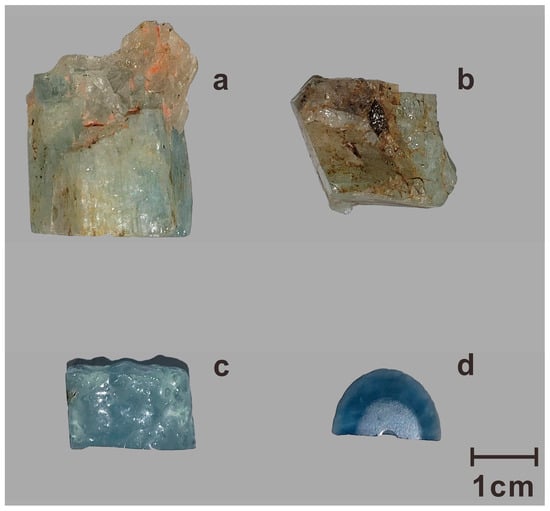
Figure 3.
The four samples of aquamarine investigated in this work: (a) XJ-1. (b) XJ-2. (c) MG. (d) NA.
Aquamarines from Xinjiang were obtained from Koktokay pegmatite, which is the largest of Li-Be-Nb-Ta-Cs pegmatitic rare metal deposit of the Chinese Altai orogenic. The Koktokay pegmatite includes a metagabbro pluton, and can be classified into nine internal zones. The graphic pegmatite zone is mainly composed of microcline, albite, quartz; and muscovite. Aquamarines are a characteristic accessory mineral [21].
Minas Gerais Aquamarine was selected from Araçuai region, which is located in northern Minas Gerais states. Pegmatites with aquamarine in Araçuai region contain mostly microcline, quartz, albite, and muscovite. Two-mica leucogranites are the source of pegmatites and aquamarine is the subordinate mineral in pegmatites [22].
Namaqualand Aquamarine was collected from Noumas pegmatite; such pegmatite mainly consists of aplite border, wall zone, intermediate zone, and quartz-K-feldspar zone. Beryl is commonly found in wall zone and intermediate zone. The wall zone was mainly composed of albite, microcline, quartz, and muscovite, while quartz, microcline, and plagioclase are predominant in intermediate zone [23].
Standard gemological analyses included optical properties, ultraviolet fluorescence, and specific gravity. Refractive index (RI) and birefringence index (DR) were tested in polish surfaces of samples and measured using refractometer (Xueyuan Jewelry Technologies, Wuhan, China) Each sample was observed from different crystal direction using calcite dichroscope and Chelsea color filter (CCF) (Baoguang Technologies, Nanjing, China). Ultraviolet fluorescence (UV) was observed under ultraviolet lamp at longwave (365 nm) and shortwave (254 nm). Specific gravity (SG) was obtained using hydrostatic weighing method. Samples were weighed in air and water.
Infrared spectra were collected using Bruker Tensor 27 Fourier Infrared spectrometer with scanning time of 32 s, resolution of 4 cm−1, and wavenumber between 400 and 4000 cm−1. The sample was investigated using reflection and transmission method. Raman spectra were collected using Horiba HR Evolution-type micro-confocal laser Raman spectrometer, which ranged from 0 to 4000 cm−1. Laser source was 532 nm and there were 3 acquisition cycles. Standard gemological and spectroscopy analyses were performed at the Gemmological Research Laboratory of the China University of Geosciences (Beijing). When the infrared spectroscopy and Raman spectroscopy test was performed, each sample was tested perpendicular and parallel to C-axis, except NA, which cannot be oriented.
EMPA analyses were performed at the Key Laboratory of Submarine Geosciences, State Oceanic Administration, Second Institute of Oceanography, Ministry of Natural Resources using four-spectrometer Jeol JXA 8100 electron probe microanalyzer. Accelerating voltage was 15 kV, beam current was 20 nA, and spot size was 5 μm. The standards used were as follows: plagioclase (Al), diopside (Si, Ca), rutile (Ti), rhodonite (Mn), chromite (Fe), albite (Na), olivine (Mg), sanidine (K), apatite (P), pentlandite (Ni), and willemite (Zn). ZAF correction scheme was used for correction.
LA-ICP-MS analyses were performed at the Mineral Laser Microprobe Analysis Laboratory, China University of Geoscience (Beijing). The laser ablation system was NewWave193 UC and quadruple rod mass spectrometer was Agilent 7900. Helium was used as carrier gas in ablation system. Spot size was 50 μm, repetition rate was 6 Hz, and ablation time was 90 s. Multiple external standards, including NIST 610, BCR-2G, and internal standard (Al), were used for quantitative calculation. The detection limit of each element can be found in Table A4. All samples were tested in the perpendicular direction during EMPA and LA-ICP-MS analyses, except NA.
3. Results
3.1. Gemological Properties
The color of aquamarines from Xinjiang varies from blue-green to light blue. Due to the large number of fissures, it is difficult to observe the internal characteristics of the samples. The NA sample from South Africa shows a darker blue color and is more transparent than that from Xinjiang. The sample MG from Brazil is the most transparent and its color is intense blue. The refractive index values are as follows: XJ-1: 1.573–1.581, XJ-2: 1.562–1.569, MG: 1.561–1.570, NA: 1.582–1.590; the birefringence index ranges from 0.007 to 0.009. All samples show weak-to-moderate dichroism. Under the CCF, all the samples are pale blue-green. XJ-1, XJ-2, and NA are inert under ultraviolet fluorescence, while MG has a weak blue-white fluorescence at longwave. The specific gravity of the samples is as follows: XJ-1:2.64, XJ-2:2.62, MG:2.61, and NA:2.65. The results of standard gemological analyses are listed in Table 1.

Table 1.
Gemological characteristics of aquamarine samples.
3.2. Spectral Characteristics
3.2.1. Infrared Spectrum
The reflectance spectra are shown in Figure 4a. The absorption of aquamarine is concentrated in the 400–1300 cm−1 range. The absorption peaks at 528 and 597 cm−1 are generated by Si-O bending vibration, and the weak absorption at 650 cm−1 is caused by Be-O symmetric stretching vibration. The peaks at 684, 748, and 812 cm−1 are generated by Si-O-Si symmetric stretching vibration, and the peak at 962 cm−1 is caused by O-Si-O symmetric stretching vibration. The peaks at 1024 and 1072 cm−1 are related to O-Si-O asymmetric stretching vibration, and the wide absorption peaks at 1248 cm−1 are related to Si-O-Si asymmetric stretching vibration [24,25].
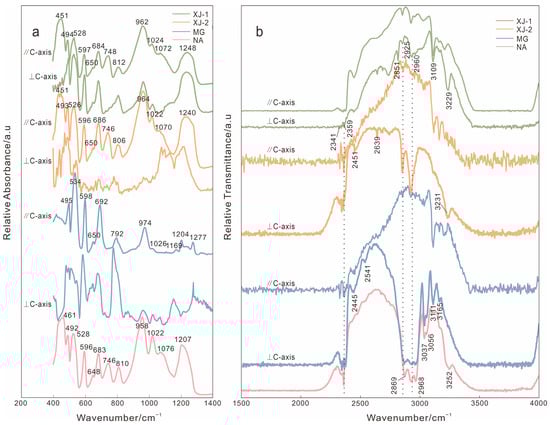
Figure 4.
(a) Reflectance spectra of four samples. (b) Transmittance spectra of four samples.
The transmittance spectra are shown in Figure 4b. XJ-1, XJ-2, and NA have several absorptions around 2341 cm−1 and 2359 cm−1, which are caused by the asymmetric stretching vibration of CO2 [5]. The 3111 and 3165 cm−1 peaks in MG are related to the reaction between Na and H when forming NaH in a channel structure [26]. The 3229 cm−1 and 3231 cm−1 peaks in XJ-1 and XJ-2 are attributed to [Fe2(OH)4]2+ ions, which are formed by the hydrolysis between Fe3+ and water molecules in the channel with the participation of alkali metal [26]. In addition, the peaks related to [Fe2(OH)4]2+ ions of samples perpendicular to the C-axis are more obvious than those of samples parallel to the c-axis.
The representative peaks’ absorbance (or transmittance) and full width at the half maximum (FWHM) of the infrared spectrum are listed in Table A1.
3.2.2. Raman Spectrum
The spectra of the Raman spectroscopy test are shown in Figure 5. The characteristic peaks of aquamarine are concentrated at 300–1500 and 3500–3700 cm−1. Two moderate peaks at 321 and 398 cm−1 are caused by Al-O bending vibration, and the strong peak at 686 cm−1 is due to Si-O-Si bending vibration. The weak peak at 1004 cm−1 is related to Be-O stretching vibration, and the peak at 1068 cm−1 is caused by Si-O stretching vibration. The peak at 1242 cm−1 was related to CO2 in the channel [27].
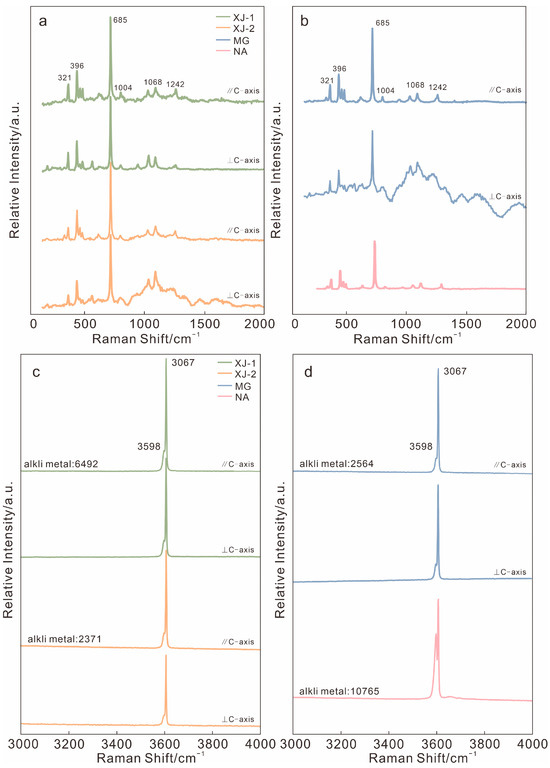
Figure 5.
(a,b) Raman spectra of four aquamarine samples. (c,d) Raman spectrum related to channel water. Alkali metal content (Li, Na, K, Rb, and Cs, in ppm) analyzed using LA-ICP-MS.
The band in the range of 3500–3700 cm−1 is dominated by the vibration of water in channel. The 3608 cm−1 band is the absorption of type I water, which is narrow and strong, and it is not affected by alkali content. The weak 3598 cm−1 band is related to type II H2O and associated with alkali content, but this band is almost undetectable [28].
It can be seen that those peaks around 1242 cm−1, as well as the 3608 cm−1 band, have relatively higher FWHM when the aquamarine samples were tested parallel to the C-axis. This may result from CO2 and type I water molecules being incorporated into the channel structure, they demonstrate stronger vibration when tested in parallel C-axis directions (Table A2).
3.3. Major and Trace Elements
The major element analytical results of four crystals are listed in Table A3. The major element chemical composition of the investigated aquamarine samples is mostly composed of SiO2 (61.14–66.40 wt.%) and Al2O3 (17.04–20.08 wt.%), followed by chromophore element FeO (0.35–2.17 wt.%). The trace elements found include Na, Li, K, and Cs. Beryllium is also major element in aquamarine, but it cannot be detected using EMPA. Thus, EMPA data calculation based on O = 18 and Be2+ is assumed to be 3-Li+ [18]. The crystal chemical formulas of each sample are listed in Table 2 [29]. After being calculated, the sum of analysis was still less than 100%; this may result from the amount of water in the composition of aquamarine samples.
Table 2.
Ideal chemical formula of aquamarine samples.
In beryl crystal, Al in the octahedral site can be substituted by divalent or trivalent cations, including Fe2+, Fe3+, Mg2+, Mn2+, and Cr3+ [3,4]. From major element composition, it can be seen that Fe is the most important substituent at the octahedral site, and ranges from 0.026 to 0.174 apfu. Na+ ranges from to 0.037 to 0.299 apfu, which is much higher than K+ (up to 0.020), Cr3+ (up to 0.010), Mn2+ (up to 0.008), Ca2+ (up to 0.007), Ti+ (up to 0.007), and Ni+ (up to 0.004). Na+ typically occupies the channel site to balance the charge difference through isomorphous substitution. NA has relatively high Fe (0.147 to 0.174), Na (0.209 to 0.299), and Mg (0.141 to 0.157) content compared with the other three samples analyzed in this study.
Data from LA-ICP-Ms were used to determine Li+ and other trace elements. The results of four crystals are listed in Table A4, with calculated apfu values based on assuming Si = 6 (data obtained from EMPA) [2]. Consistent with the EMPA results, Li+ (0.008 to 0.060) and Fe (0.040 to 0.169) are major substituents at the tetrahedral and octahedral sites, respectively. Na+ ranges from to 0.039 to 0.227 apfu, compare to minor Cs+ (up to 0.017), Sc3+ (<0.007), Rb+ (<0.001), V3+ (<0.001). NA was characterized by a relatively high Sc (from 537.2 to 574.2 ppm) and V (from 61 to 66 ppm) content compared with the other three samples.
4. Discussion
4.1. Gemological Properties
The standard gemological investigation showed that the color of aquamarines of different origin investigated in this work varies from almost colorless to light-greenish-blue to dark blue. It did not show significant distinction in refractive index or specific gravity. This suggests that when aquamarines show similar properties, standard gemological tests alone are not sufficient to distinguish their origin.
4.2. Spectroscopy Analysis
In the infrared spectrum (Figure 4), the band around 1020 cm−1 tended to become broad and strong with the increase in substitution at the octahedral site [25]. NA has the strongest band in 1020 cm−1, while XJ-1 and XJ-2 are weaker. This denotes that octahedral substitution in NA is higher than aquamarine from Xinjiang. Each sample show vibrations around 700 cm−1 and 1070 cm−1, indicating that all samples have substitution of Be2+ by Li+ at the tetrahedral site [25,30]. In addition, the absorption peaks around 746 cm−1 are absent when the samples are perpendicular to the C-axis (XJ-1 and XJ-2). In the spectrum of samples perpendicular to the C-axis, the absorption peak around 1200 cm−1 is the strongest, while the strongest peak in samples parallel to C-axis is around 964 cm−1 (Table A1).
In the Raman spectroscopy test, the intensities at 3607 cm−1 in different samples are almost the same, and NA shows the strongest absorption at 3598 cm−1 due to type II water, indicating that its alkali content is the highest out of the four samples. The result of FWHM at 3598 cm−1 absorption is also in good agreement with alkali content. The FWHM value of NA was highest, while XJ-2 and MG were lower (Figure 5c,d).
Above all, in the spectroscopy tests, the aquamarines from three origins show distinctions mostly related to their chemical composition. It can be inferred that through the analysis of major and trace element contents of aquamarine, we can verify the conclusions obtained through the spectroscopy test and further distinguish the aquamarines from different regions.
4.3. Chemical Compositions
Figure 6 shows the negative correlation of divalent/trivalent cations with Al content based on the EMPA value of four aquamarine samples in comparison with the ideal correlation line of Al = 2 apfu to total substituent = 1 apfu. The points of XJ-2 and MG are distributed almost along the ideal correlation line, while that the fact that those of XJ-1 are offset to the right of the ideal line is probably due to high Al EMPA values, and NA’s points lying above the expect trend may result from Fe2+ being present as Fe3+.
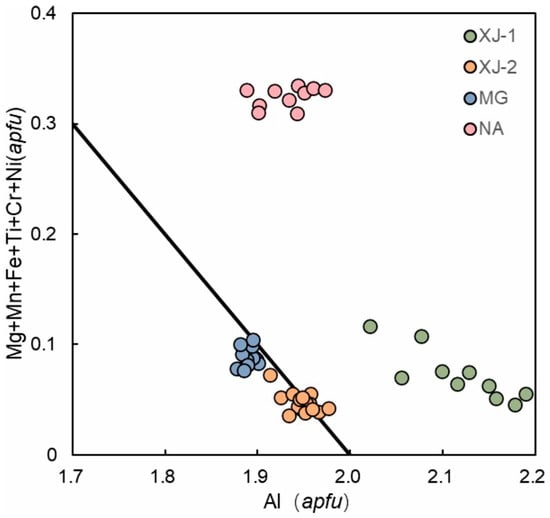
Figure 6.
Plot of major octahedral ion (Al) versus its substituent in aquamarine samples. Ideal correlation line defined by Al = 2 apfu; total substituent = 1 apfu.
NA has a relatively high Sc content among the four samples (up to 500 ppm); a comparative analysis of the ratios of the content of Sc and Fe in the aquamarine samples has shown a tendency towards their positive correlation (Figure 7). Borzenko and Yurgenson [31] carried out a comparative study of the content of Sc in variously colored beryl crystals of the Sherlovogorsk ore deposit, and the maximum concentrations of Sc typical for aquamarine samples were revealed. They concluded that Sc content may be connected with Fe3+ content.
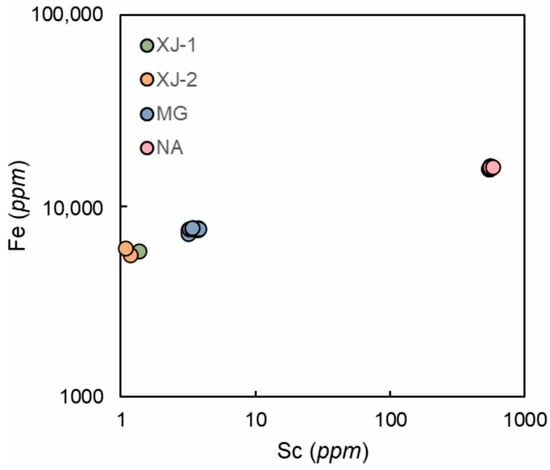
Figure 7.
Plot of Sc vs. Fe content in aquamarine samples. Positive correlation between scandium and iron can be found in each sample.
The alkali element contents obtained by LA-ICP-MS are plotted in Figure 8. The relative concentrations of each alkali element showed similar variation in all samples. This tendency may result from the fact that when the charge deficiency initiated by Li+ substitutes Be2+, it is compensated by a proportional amount of Na+ and Cs+ and a minor amount of K+ and Rb+ [20]. NA has the highest alkali content, which is consistent with the conclusion obtained through the Raman spectrum.
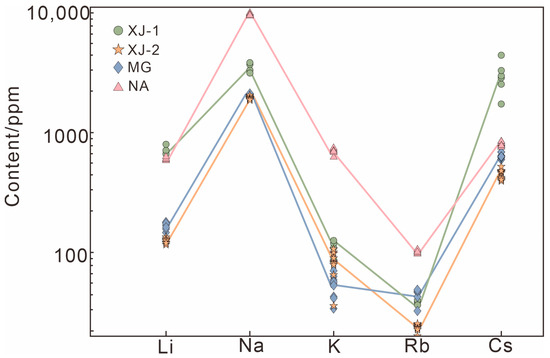
Figure 8.
Alkali metal content in aquamarines have similar tendencies.
Figure 9a shows that the positive correlation of Na+ and Li+ is consistent with Na+ being predominant in charge balancing, as Li+ substitutes Be2+. Those points offset upward from the line suggest that the remaining Na+ is used for charge balance, substituting Al3+ with divalent cations. Figure 9b plots other alkalis vs. divalent cations at the octahedral site (excluding Fe2+). The great deviation of NA data suggests that K+, Rb+, and Cs+ are insufficient to balance the charge deficiency which arises from the substitution of divalent cations, so extra Na+ is needed; this is consistent with Figure 9a. The datapoints of XJ-2 and MG are slightly offset, but the data of the XJ-1 plots follow the line. This indicates a certain number of other divalent cations present in XJ-1 (e.g., Fe2+).
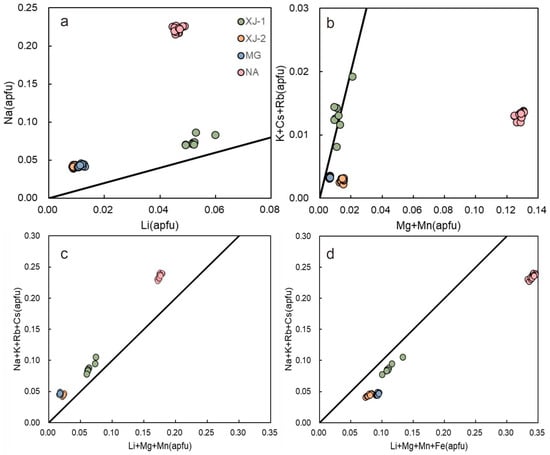
Figure 9.
Correlations and trends in major and trace element variations (base on LA-ICP-MS data). (a) Correlation between Li+ substitution of Be2+ with Na+ charge balancing at the channel site. (b) Monovalent (excluding Na+) vs. divalent cations which substitute Al3+ (excluding Fe2+). (c,d) Combined tetrahedral and octahedral substitution expressed as alkali cations vs. Li++ divalent cations. Black lines represent the ideal substitution or charge balance relationship, (a) Li+ = Na+; (b) R+ − Na+ = X2+; (c) R+ = Li+ + X2+ − Fe3+; (d) R+ = Li+ + X2+.
In Figure 9c, we assumed that Fetot was present as Fe2+, and it combined both substitutions of the Li+ for Be2+ at the tetrahedral site and the sum of all divalent cations that replaced Al3+ at the octahedral site. It can be seen that the data of each sample have a right lateral offset to the expected trend. This suggest that divalent cations may be overestimated, and some Fe cations should present as Fe3+. If we assumed Fetot present as Fe3+ (Figure 9d), NA still has a great deviation from the correlation line, followed by XJ-2 and MG. XJ-1 shows less deviation in both Figure 9c,d.
The color mechanism of aquamarine is not well understood. One suggestion for blue-tone in beryl is that it is the result of different Fe2+/Fe3+ ratios [3,32,33]. Viana et al. [34] proposed that the color of beryl is dictated by the relative proportions of both Fe3+ at the octahedral site and Fe2+ at the channel site, and demonstrated that deep blue beryls have little Fe3+. Another suggestion is that the intervalence charge transfer (IVTC) occurs between Fe2+ and Fe3+, whereby the Fe2+ is located at the octahedral site and the Fe3+ is located at an interstitial octahedral position [35,36].
Owing to the absence of exact Fe2+/Fe3+ analyses, we assumed that all Fe2+/Fe3+ ions occupy the octahedral site. The combined results of Figure 9c,d can be summarized as follows: NA has highest Fe3+ content among the four samples, followed by XJ-2, which is closed to MG. XJ-1 may has lowest content of Fe3+ (NA > XJ-2 ≈ MG > XJ-1). Due to the complex substitutions in beryl, further experimental work would be necessary to interpret the relationship of Fe2+/Fe3+ ions accurately.
4.4. Chemical Composition Comparison with Other Localities
Figure 10a shows the content of the major octahedral site ion (Al) and its principal substituent (Fe) in aquamarines of different origin. Comparing aquamarine samples from the literature, the Yukon Territory, Canada aquamarine is easy to distinguish due to its high Fe content, while other producing areas and the four aquamarine samples investigated in this paper are characterized by a relatively high Al content. Aquamarine from Ghorveh, Iran and Xinjiang, China may have higher Al contents than those of other origins.
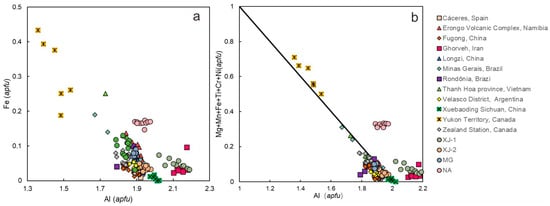
Figure 10.
(a) Plot of Al versus Fe (apfu) in aquamarines from across the globe, showing the negative relationship between them. (b) Al versus substituent at the octahedral site (apfu) in aquamarines from across the globe. Ideal correlation line: Al = 2 apfu to total substituent = 1 apfu. Data from [1,2,7,9,29,34,36,37,38,39,40,41].
A negative relationship between Al and other mutual substituents at the octahedral site is observed in Figure 10b. In most cases, the substitutional trends in worldwide samples are comparable to the theoretical correlation line. XJ-1, NA, and aquamarines from Canada and Iran are plotted above the ideal correlation line. The high value of substituents at the octahedral site is characteristic of Canadian aquamarines. XJ-1, XJ-2, and MG have a low number of octahedral substituents, while NA has slightly more octahedral substituents than aquamarines from other provenances.
A negative correlation between the content of Sc versus Fe in aquamarines of different origin can be seen in Figure 11, in which two clusters of data emerge.
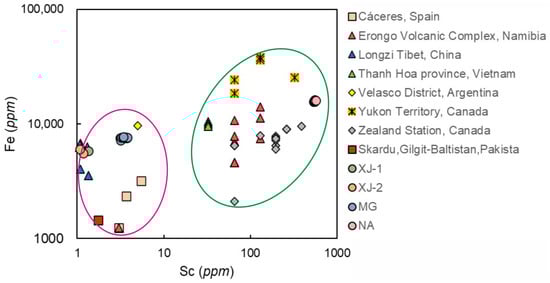
Figure 11.
Sc versus Fe content in beryls from across the globe. Data from [7,28,29,36,37,40,41,42].
An Fe content up to 42,000 ppm and Sc up to 570 ppm are characteristic of the first group, while Fe content up to 9700 ppm and Sc from 1 to 7 ppm are typical for the second group. The first group includes aquamarines from Canada, Namibia, and Vietnam, and the second consists of aquamarines from Spain, Pakistan, Argentina, and China. The points of XJ-1, XJ-2, and MG lie in the second group, while the points of NA in first group are characterized by relatively high Sc content.
According to Hu and Lu [20], beryl can be divided into the “high-alkali beryl” group and the “low-alkali beryl” group base on Li vs. Cs content (Figure 12). Beryls from most origins belong to the low-alkali group, including four samples analyzed in this study, and only a few types of aquamarine belong to the high-alkali group (Mogok, Myanmar, and Brazil). Though alkali content cannot distinguish aquamarine origin directly, it can roughly separate types of aquamarine and provide a reference for origin determination.
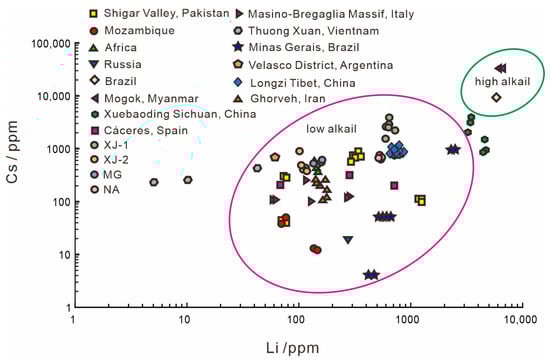
Figure 12.
Li versus Cs content in beryls from across the globe. Beryls were classified as low-alkali group or high-alkali group. Data from [1,2,7,20,28,29,34,37,43].
5. Conclusions
Aquamarines from Xinjiang show weaker substitution at the octahedral site and lower alkali content than aquamarines from Namaqualand, according to spectroscopy analysis. The absorption of NaH and [Fe2(OH)4]2+ ions can be found in the infrared spectrum of Minas Gerais and Xinjiang aquamarines, respectively. Raman spectroscopy revealed that Namaqualand aquamarine has the strongest type II water absorption. However, there still much overlap between the infrared and Raman spectra of aquamarines. It is thus suggested that spectroscopy analysis can be used as supplemental data during aquamarine origin determination, rather than distinguishing aquamarines’ origins independently.
Major and trace element results show that octahedral substitution is predominant in aquamarines from three origins, and their alkali contents have similar proportional tendency. Comparing aquamarines from other origins, aquamarines from Xinjiang and Minas Gerais have a relatively high Al content and low Fe content, and they belong to the low-alkali group. The Namaqualand aquamarine is characterized by its high Sc content. Though verifying the certain origin of aquamarine is not easy, it is suggested that spectroscopy characteristics and major and trace elements composition should be considered comprehensively in origin identification.
Author Contributions
Writing—original draft, S.C.; writing—review and editing, S.C., B.X., J.S., Z.M. and Z.W.; investigation, S.C. and J.S.; data curation, S.C. and J.S.; software, S.C. and J.S.; methodology, B.X.; resources, B.X. All authors have read and agreed to the published version of the manuscript.
Funding
This research was funded by the National Natural Science Foundation of China (42222304, 42073038), the “Deep-time Digital Earth” Science and Technology Leading Talents Team Funds for the Central Universities for the Frontiers Science Center for Deep-time Digital Earth, China University of Geosciences (Beijing) (Fundamental Research Funds for the Central Universities; grant number: 2652023001 and 265QZ2021012), and IGCP-662.
Data Availability Statement
The data presented in this study are available within the article.
Acknowledgments
We sincerely thank the editor and anonymous reviewers for their constructive comments, which greatly contributed to enhancing the quality of our paper. This is the 20th contribution of B.X. for the National Mineral Rock and Fossil Specimens Resource Center.
Conflicts of Interest
The authors declare no conflict of interest.
Appendix A
Table A1.
Representative peaks’ absorbance (or transmittance) and FWHM of infrared spectrum.
Table A1.
Representative peaks’ absorbance (or transmittance) and FWHM of infrared spectrum.
| XJ-1//C | XJ-1⊥C | XJ-2//C | XJ-2⊥C | BX//C | BX⊥C | NF | ||||||||
|---|---|---|---|---|---|---|---|---|---|---|---|---|---|---|
| Peak (cm−1) | Absorbance | FWHM | Absorbance | FWHM | Absorbance | FWHM | Absorbance | FWHM | Absorbance | FWHM | Absorbance | FWHM | Absorbance | FWHM |
| 684 | 0.2805 | 0.134 | 0.1632 | 0.122 | 0.0365 | 0.156 | 0.2789 | 0.016 | 0.1566 | 0.117 | 0.2518 | 0.116 | 0.3220 | 0.184 |
| 748 | 0.2453 | 0.140 | 0.0398 | 0.001 | 0.0225 | 0.128 | 0.2238 | 0.005 | 0.0327 | 0.038 | 0.0795 | 0.299 | 0.2450 | 0.130 |
| 962 | 0.4830 | 0.223 | 0.1578 | 0.126 | 0.0400 | 0.226 | 0.4628 | 0.009 | 0.0925 | 0.063 | 0.1221 | 0.050 | 0.6021 | 0.336 |
| 1024 | 0.3338 | 0.037 | 0.0599 | 0.030 | 0.0400 | 0.050 | 0.3163 | 0.007 | 0.0317 | 0.004 | 0.0861 | 0.033 | 0.4552 | 0.136 |
| 1072 | 0.2651 | 0.040 | 0.0247 | 0.002 | 0.0726 | 0.024 | 0.2341 | 0.015 | 0.0212 | 0.001 | 0.0528 | 0.023 | 0.3304 | 0.049 |
| 1248 | 0.2694 | 0.206 | 0.2000 | 0.154 | 0.0649 | 0.252 | 0.3131 | 0.040 | 0.0566 | 0.026 | 0.2862 | 0.128 | 0.3872 | 0.287 |
| 3231 | 0.0633 | 0.006 | 0.0122 | 0.007 | 0.0022 | 0.001 | 0.0152 | 0.005 | ||||||
FWHM = full width at half maximum.
Table A2.
Representative peaks’ absorbance and FWHM of Raman spectrum.
Table A2.
Representative peaks’ absorbance and FWHM of Raman spectrum.
| XJ-1//C | XJ-1⊥C | XJ-2//C | XJ-2⊥C | BX//C | BX⊥C | NF | ||||||||
|---|---|---|---|---|---|---|---|---|---|---|---|---|---|---|
| Shift (cm−1) | Intensity | FWHM | Intensity | FWHM | Intensity | FWHM | Intensity | FWHM | Intensity | FWHM | Intensity | FWHM | Intensity | FWHM |
| 1243 | 174.872 | 88.516 | 114.567 | 66.595 | 230.673 | 70.238 | 382.072 | 69.447 | 184.364 | 194.734 | 1161.451 | 85.750 | 226.127 | 4.052 |
| 3598 | 1769.940 | 66.976 | 1486.210 | 99.910 | 2749.440 | 146.693 | 945.105 | 35.649 | 850.065 | 49.907 | 1678.470 | 39.167 | 2607.280 | 919.442 |
| 3609 | 7288.890 | 5795.524 | 5365.190 | 4085.822 | 8139.720 | 5725.512 | 5679.880 | 1739.932 | 5905.450 | 3257.087 | 5677.110 | 1524.773 | 3781.540 | 1479.543 |
FWHM = full width at half maximum.
Table A3.
EMPA analyses of aquamarine samples (wt.%).
Table A3.
EMPA analyses of aquamarine samples (wt.%).
| XJ-1-1 | XJ-1-2 | XJ-1-3 | XJ-1-4 | XJ-1-5 | XJ-1-6 | XJ-1-7 | XJ-1-8 | XJ-1-9 | XJ-1-10 | XJ-2-1 | XJ-2-2 | XJ-2-3 | XJ-2-4 | XJ-2-5 | XJ-2-6 | |
| SiO2 | 63.19 | 63.77 | 63.52 | 62.87 | 62.65 | 63.26 | 62.81 | 63.07 | 62.64 | 62.92 | 65.76 | 65.88 | 65.76 | 66.40 | 65.96 | 65.71 |
| Na2O | 0.49 | 0.61 | 0.43 | 0.48 | 0.64 | 0.46 | 0.45 | 0.47 | 0.53 | 0.46 | 0.46 | 0.42 | 0.39 | 0.34 | 0.35 | 0.33 |
| K2O | 0.03 | 0.03 | 0.01 | 0.03 | 0.04 | 0.02 | 0.02 | 0.00 | 0.02 | bdl | 0.03 | 0.01 | 0.02 | 0.01 | 0.01 | 0.00 |
| Cr2O3 | bdl | 0.05 | bdl | bdl | 0.04 | 0.04 | 0.01 | bdl | 0.03 | 0.06 | bdl | 0.03 | 0.01 | bdl | 0.03 | bdl |
| Al2O3 | 18.65 | 18.51 | 19.42 | 19.39 | 18.80 | 19.19 | 19.60 | 19.75 | 19.87 | 20.08 | 17.87 | 18.05 | 18.24 | 18.39 | 18.16 | 18.15 |
| MgO | 0.17 | 0.24 | 0.04 | 0.11 | 0.26 | 0.10 | 0.05 | 0.02 | 0.04 | 0.08 | 0.08 | 0.06 | 0.03 | 0.05 | 0.04 | 0.01 |
| CaO | 0.01 | 0.02 | 0.01 | 0.00 | 0.00 | 0.02 | 0.02 | 0.01 | 0.02 | bdl | 0.00 | 0.01 | 0.01 | 0.07 | 0.01 | bdl |
| MnO | bdl | 0.06 | bdl | bdl | 0.04 | 0.00 | 0.01 | 0.05 | bdl | 0.03 | bdl | bdl | 0.07 | 0.01 | bdl | 0.02 |
| P2O5 | 0.04 | bdl | 0.02 | bdl | 0.00 | 0.05 | bdl | bdl | 0.03 | bdl | bdl | 0.01 | 0.03 | 0.01 | bdl | 0.01 |
| FeO | 0.57 | 0.95 | 0.58 | 0.73 | 0.82 | 0.63 | 0.55 | 0.56 | 0.45 | 0.41 | 0.53 | 0.57 | 0.59 | 0.48 | 0.45 | 0.50 |
| TiO2 | bdl | bdl | bdl | bdl | bdl | bdl | 0.09 | 0.01 | bdl | bdl | bdl | 0.03 | 0.01 | 0.04 | 0.01 | 0.02 |
| NiO | 0.04 | 0.04 | 0.18 | 0.03 | 0.03 | 0.13 | 0.07 | bdl | 0.04 | 0.10 | bdl | bdl | bdl | 0.01 | bdl | 0.05 |
| Li2O | 0.14 | 0.14 | 0.14 | 0.14 | 0.16 | 0.13 | 0.14 | 0.13 | 0.13 | 0.13 | 0.02 | 0.02 | 0.02 | 0.02 | 0.02 | 0.03 |
| BeO * | 13.13 | 13.25 | 13.28 | 13.18 | 13.07 | 13.24 | 13.19 | 13.26 | 13.20 | 13.27 | 13.62 | 13.67 | 13.68 | 13.80 | 13.68 | 13.64 |
| Total | 96.44 | 97.66 | 97.62 | 96.95 | 96.54 | 97.27 | 97.00 | 97.32 | 96.99 | 97.53 | 98.38 | 98.75 | 98.85 | 99.62 | 98.73 | 98.47 |
| cation (apfu) | ||||||||||||||||
| Si | 5.909 | 5.908 | 5.872 | 5.857 | 5.872 | 5.872 | 5.845 | 5.847 | 5.827 | 5.821 | 6.011 | 6.000 | 5.986 | 5.992 | 6.003 | 5.998 |
| Na | 0.089 | 0.110 | 0.076 | 0.086 | 0.116 | 0.083 | 0.082 | 0.085 | 0.096 | 0.082 | 0.082 | 0.074 | 0.068 | 0.060 | 0.062 | 0.058 |
| K | 0.003 | 0.003 | 0.002 | 0.003 | 0.005 | 0.002 | 0.002 | 0.000 | 0.002 | 0.000 | 0.003 | 0.001 | 0.002 | 0.001 | 0.002 | 0.000 |
| Cr | 0.000 | 0.003 | 0.000 | 0.000 | 0.003 | 0.003 | 0.000 | 0.000 | 0.002 | 0.004 | 0.000 | 0.002 | 0.001 | 0.000 | 0.002 | 0.000 |
| Al | 2.055 | 2.021 | 2.115 | 2.128 | 2.077 | 2.100 | 2.149 | 2.157 | 2.178 | 2.189 | 1.925 | 1.938 | 1.957 | 1.956 | 1.948 | 1.952 |
| Mg | 0.023 | 0.033 | 0.006 | 0.016 | 0.036 | 0.014 | 0.007 | 0.003 | 0.006 | 0.011 | 0.011 | 0.008 | 0.004 | 0.007 | 0.005 | 0.002 |
| Ca | 0.001 | 0.002 | 0.001 | 0.000 | 0.000 | 0.002 | 0.002 | 0.000 | 0.002 | 0.000 | 0.000 | 0.001 | 0.001 | 0.007 | 0.001 | 0.000 |
| Mn | 0.000 | 0.004 | 0.000 | 0.000 | 0.003 | 0.000 | 0.001 | 0.004 | 0.000 | 0.002 | 0.000 | 0.000 | 0.005 | 0.000 | 0.000 | 0.002 |
| P | 0.003 | 0.000 | 0.001 | 0.000 | 0.000 | 0.004 | 0.000 | 0.000 | 0.002 | 0.000 | 0.000 | 0.001 | 0.002 | 0.001 | 0.000 | 0.001 |
| Fe | 0.044 | 0.074 | 0.045 | 0.057 | 0.065 | 0.049 | 0.043 | 0.043 | 0.035 | 0.032 | 0.041 | 0.044 | 0.045 | 0.036 | 0.034 | 0.038 |
| Ti | 0.000 | 0.000 | 0.000 | 0.000 | 0.000 | 0.000 | 0.007 | 0.001 | 0.000 | 0.000 | 0.000 | 0.002 | 0.000 | 0.002 | 0.000 | 0.002 |
| Ni | 0.003 | 0.003 | 0.014 | 0.002 | 0.002 | 0.010 | 0.005 | 0.000 | 0.003 | 0.007 | 0.000 | 0.000 | 0.000 | 0.001 | 0.000 | 0.004 |
| Li | 0.051 | 0.051 | 0.050 | 0.051 | 0.058 | 0.048 | 0.051 | 0.048 | 0.050 | 0.050 | 0.009 | 0.008 | 0.008 | 0.009 | 0.009 | 0.009 |
| Be | 2.949 | 2.949 | 2.950 | 2.949 | 2.942 | 2.952 | 2.949 | 2.952 | 2.950 | 2.950 | 2.991 | 2.992 | 2.992 | 2.991 | 2.991 | 2.991 |
| XJ-2-7 | XJ-2-8 | XJ-2-9 | XJ-2-10 | XJ-2-11 | XJ-2-12 | XJ-2-13 | XJ-2-14 | XJ-2-15 | MG-1 | MG-2 | MG-3 | MG-4 | MG-5 | MG-6 | MG-7 | |
| SiO2 | 65.82 | 65.42 | 65.81 | 64.99 | 66.00 | 66.06 | 65.34 | 65.97 | 65.58 | 65.48 | 65.09 | 65.37 | 65.73 | 65.43 | 64.97 | 65.36 |
| Na2O | 0.37 | 0.38 | 0.36 | 0.44 | 0.37 | 0.38 | 0.30 | 0.36 | 0.39 | 0.23 | 0.25 | 0.21 | 0.24 | 0.21 | 0.23 | 0.24 |
| K2O | 0.00 | 0.01 | 0.02 | 0.01 | 0.01 | 0.01 | 0.01 | bdl | 0.01 | bdl | 0.02 | 0.01 | 0.00 | 0.01 | 0.01 | 0.00 |
| Cr2O3 | 0.01 | bdl | bdl | bdl | 0.04 | bdl | 0.02 | bdl | bdl | 0.01 | bdl | 0.01 | bdl | bdl | 0.06 | bdl |
| Al2O3 | 18.32 | 17.97 | 18.16 | 17.56 | 18.16 | 18.02 | 18.31 | 18.29 | 18.08 | 17.48 | 17.41 | 17.22 | 17.47 | 17.51 | 17.33 | 17.35 |
| MgO | 0.04 | 0.04 | 0.03 | 0.14 | 0.04 | 0.05 | 0.04 | 0.04 | 0.06 | 0.01 | 0.04 | 0.04 | 0.07 | 0.05 | 0.03 | 0.06 |
| CaO | 0.01 | bdl | 0.01 | bdl | 0.02 | 0.00 | bdl | 0.01 | 0.02 | bdl | 0.01 | 0.01 | 0.01 | 0.00 | 0.00 | bdl |
| MnO | bdl | 0.03 | 0.01 | bdl | 0.03 | bdl | 0.02 | 0.01 | 0.00 | 0.04 | bdl | 0.03 | 0.01 | 0.01 | bdl | bdl |
| P2O5 | bdl | 0.03 | 0.01 | 0.00 | bdl | 0.02 | bdl | 0.01 | 0.00 | bdl | 0.02 | bdl | 0.01 | 0.01 | 0.01 | 0.01 |
| FeO | 0.43 | 0.47 | 0.41 | 0.64 | 0.50 | 0.35 | 0.44 | 0.47 | 0.57 | 1.02 | 1.04 | 0.90 | 1.02 | 0.94 | 1.00 | 1.02 |
| TiO2 | bdl | bdl | 0.03 | 0.04 | bdl | 0.04 | 0.02 | bdl | 0.01 | bdl | 0.01 | 0.00 | 0.01 | 0.02 | 0.02 | bdl |
| NiO | bdl | bdl | bdl | 0.03 | 0.01 | bdl | bdl | bdl | 0.01 | 0.06 | 0.01 | bdl | bdl | 0.02 | 0.01 | bdl |
| Li2O | 0.02 | 0.02 | 0.02 | 0.02 | 0.02 | 0.03 | 0.02 | 0.02 | 0.02 | 0.03 | 0.03 | 0.03 | 0.03 | 0.03 | 0.03 | 0.03 |
| BeO * | 13.68 | 13.57 | 13.66 | 13.46 | 13.70 | 13.68 | 13.60 | 13.70 | 13.62 | 13.52 | 13.45 | 13.45 | 13.57 | 13.51 | 13.41 | 13.48 |
| Total | 98.72 | 97.94 | 98.52 | 97.34 | 98.91 | 98.63 | 98.13 | 98.87 | 98.35 | 97.89 | 97.36 | 97.28 | 98.17 | 97.76 | 97.11 | 97.55 |
| cation (apfu) | ||||||||||||||||
| Si | 5.991 | 6.003 | 6.001 | 6.009 | 6.000 | 6.014 | 5.984 | 5.996 | 5.996 | 6.026 | 6.022 | 6.046 | 6.029 | 6.025 | 6.025 | 6.033 |
| Na | 0.066 | 0.068 | 0.064 | 0.079 | 0.066 | 0.068 | 0.054 | 0.063 | 0.069 | 0.041 | 0.044 | 0.037 | 0.043 | 0.038 | 0.041 | 0.043 |
| K | 0.000 | 0.002 | 0.002 | 0.001 | 0.002 | 0.002 | 0.001 | 0.000 | 0.001 | 0.000 | 0.002 | 0.001 | 0.000 | 0.002 | 0.001 | 0.000 |
| Cr | 0.001 | 0.000 | 0.000 | 0.000 | 0.003 | 0.000 | 0.001 | 0.000 | 0.000 | 0.001 | 0.000 | 0.001 | 0.000 | 0.000 | 0.004 | 0.000 |
| Al | 1.965 | 1.943 | 1.951 | 1.914 | 1.945 | 1.933 | 1.976 | 1.959 | 1.948 | 1.896 | 1.898 | 1.877 | 1.889 | 1.900 | 1.894 | 1.887 |
| Mg | 0.006 | 0.006 | 0.005 | 0.019 | 0.006 | 0.007 | 0.005 | 0.005 | 0.008 | 0.002 | 0.005 | 0.006 | 0.010 | 0.007 | 0.004 | 0.008 |
| Ca | 0.001 | 0.000 | 0.001 | 0.000 | 0.002 | 0.000 | 0.000 | 0.000 | 0.001 | 0.000 | 0.001 | 0.001 | 0.001 | 0.000 | 0.000 | 0.000 |
| Mn | 0.000 | 0.002 | 0.000 | 0.000 | 0.002 | 0.000 | 0.001 | 0.001 | 0.000 | 0.003 | 0.000 | 0.002 | 0.001 | 0.000 | 0.000 | 0.000 |
| P | 0.000 | 0.002 | 0.001 | 0.000 | 0.000 | 0.001 | 0.000 | 0.001 | 0.000 | 0.000 | 0.001 | 0.000 | 0.001 | 0.000 | 0.000 | 0.001 |
| Fe | 0.033 | 0.036 | 0.031 | 0.049 | 0.038 | 0.026 | 0.033 | 0.036 | 0.043 | 0.078 | 0.081 | 0.069 | 0.078 | 0.072 | 0.078 | 0.079 |
| Ti | 0.000 | 0.000 | 0.002 | 0.003 | 0.000 | 0.003 | 0.002 | 0.000 | 0.000 | 0.000 | 0.001 | 0.000 | 0.000 | 0.002 | 0.002 | 0.000 |
| Ni | 0.000 | 0.000 | 0.000 | 0.002 | 0.001 | 0.000 | 0.000 | 0.000 | 0.000 | 0.004 | 0.000 | 0.000 | 0.000 | 0.002 | 0.001 | 0.000 |
| Li | 0.009 | 0.009 | 0.009 | 0.010 | 0.009 | 0.009 | 0.009 | 0.009 | 0.009 | 0.011 | 0.011 | 0.013 | 0.011 | 0.012 | 0.013 | 0.012 |
| Be | 2.991 | 2.991 | 2.991 | 2.990 | 2.991 | 2.991 | 2.991 | 2.991 | 2.991 | 2.989 | 2.989 | 2.987 | 2.989 | 2.988 | 2.987 | 2.988 |
| MG-8 | MG-9 | MG-10 | MG-11 | MG-12 | MG-13 | NA-1 | NA-2 | NA-3 | NA-4 | NA-5 | NA-6 | NA-7 | NA-8 | NA-9 | NA-10 | |
| SiO2 | 65.33 | 65.29 | 65.58 | 65.44 | 64.58 | 65.56 | 62.51 | 62.64 | 61.65 | 61.54 | 61.54 | 61.96 | 61.55 | 62.50 | 61.14 | 61.59 |
| Na2O | 0.21 | 0.25 | 0.27 | 0.26 | 0.31 | 0.27 | 1.27 | 1.16 | 1.30 | 1.63 | 1.30 | 1.30 | 1.31 | 1.16 | 1.15 | 1.23 |
| K2O | 0.01 | 0.01 | 0.01 | bdl | 0.01 | 0.01 | 0.08 | 0.09 | 0.09 | 0.17 | 0.07 | 0.08 | 0.09 | 0.05 | 0.12 | 0.08 |
| Cr2O3 | bdl | 0.02 | bdl | 0.02 | 0.13 | 0.11 | bdl | 0.01 | 0.00 | bdl | bdl | bdl | 0.01 | 0.05 | 0.01 | bdl |
| Al2O3 | 17.30 | 17.34 | 17.38 | 17.47 | 17.28 | 17.37 | 17.07 | 17.21 | 17.17 | 17.36 | 17.42 | 17.04 | 17.50 | 17.63 | 17.49 | 17.76 |
| MgO | 0.03 | 0.01 | 0.02 | 0.02 | 0.10 | 0.05 | 1.09 | 1.04 | 1.09 | 1.07 | 1.11 | 1.00 | 1.09 | 1.12 | 1.09 | 1.10 |
| CaO | 0.01 | bdl | bdl | 0.00 | 0.08 | bdl | 0.00 | bdl | 0.00 | 0.02 | 0.01 | 0.01 | bdl | 0.02 | 0.03 | 0.01 |
| MnO | 0.02 | 0.04 | 0.02 | 0.02 | 0.01 | bdl | 0.04 | 0.01 | 0.04 | 0.03 | 0.02 | 0.03 | 0.09 | 0.01 | 0.05 | 0.07 |
| P2O5 | 0.01 | bdl | bdl | 0.01 | bdl | bdl | 0.01 | bdl | bdl | 0.04 | bdl | 0.02 | 0.01 | 0.02 | bdl | 0.03 |
| FeO | 1.11 | 0.91 | 0.92 | 1.17 | 1.02 | 1.04 | 2.17 | 2.16 | 2.09 | 2.11 | 2.20 | 2.10 | 2.11 | 1.88 | 2.13 | 2.16 |
| TiO2 | bdl | 0.03 | 0.00 | 0.02 | bdl | 0.05 | 0.05 | 0.00 | bdl | bdl | 0.01 | 0.01 | bdl | 0.01 | 0.01 | bdl |
| NiO | bdl | 0.03 | 0.01 | 0.01 | 0.00 | 0.04 | 0.02 | 0.00 | 0.09 | 0.04 | 0.02 | bdl | bdl | 0.01 | 0.05 | 0.00 |
| Li2O | 0.03 | 0.03 | 0.03 | 0.03 | 0.03 | 0.03 | 0.12 | 0.12 | 0.12 | 0.12 | 0.12 | 0.12 | 0.11 | 0.12 | 0.12 | 0.12 |
| BeO * | 13.47 | 13.47 | 13.52 | 13.53 | 13.37 | 13.54 | 13.10 | 13.12 | 12.98 | 13.02 | 12.99 | 13.00 | 13.02 | 13.16 | 12.93 | 13.04 |
| Total | 97.52 | 97.43 | 97.76 | 98.00 | 96.93 | 98.06 | 97.54 | 97.57 | 96.62 | 97.14 | 96.81 | 96.67 | 96.89 | 97.74 | 96.30 | 97.20 |
| cation (apfu) | ||||||||||||||||
| Si | 6.034 | 6.033 | 6.038 | 6.019 | 6.009 | 6.025 | 5.867 | 5.872 | 5.845 | 5.816 | 5.824 | 5.865 | 5.820 | 5.842 | 5.816 | 5.805 |
| Na | 0.037 | 0.044 | 0.048 | 0.045 | 0.056 | 0.048 | 0.232 | 0.210 | 0.239 | 0.299 | 0.238 | 0.239 | 0.240 | 0.209 | 0.213 | 0.224 |
| K | 0.001 | 0.001 | 0.001 | 0.000 | 0.001 | 0.001 | 0.010 | 0.010 | 0.011 | 0.020 | 0.009 | 0.010 | 0.011 | 0.006 | 0.015 | 0.010 |
| Cr | 0.000 | 0.002 | 0.000 | 0.002 | 0.010 | 0.008 | 0.000 | 0.001 | 0.000 | 0.000 | 0.000 | 0.000 | 0.001 | 0.004 | 0.001 | 0.000 |
| Al | 1.883 | 1.889 | 1.885 | 1.894 | 1.895 | 1.881 | 1.888 | 1.901 | 1.918 | 1.933 | 1.943 | 1.901 | 1.951 | 1.942 | 1.960 | 1.973 |
| Mg | 0.004 | 0.002 | 0.003 | 0.003 | 0.014 | 0.006 | 0.153 | 0.145 | 0.154 | 0.150 | 0.157 | 0.141 | 0.154 | 0.156 | 0.155 | 0.155 |
| Ca | 0.001 | 0.000 | 0.000 | 0.000 | 0.007 | 0.000 | 0.000 | 0.000 | 0.000 | 0.002 | 0.001 | 0.001 | 0.000 | 0.002 | 0.003 | 0.001 |
| Mn | 0.001 | 0.003 | 0.002 | 0.002 | 0.001 | 0.000 | 0.003 | 0.001 | 0.003 | 0.002 | 0.002 | 0.003 | 0.008 | 0.001 | 0.004 | 0.005 |
| P | 0.001 | 0.000 | 0.000 | 0.001 | 0.000 | 0.000 | 0.001 | 0.000 | 0.000 | 0.003 | 0.000 | 0.002 | 0.001 | 0.002 | 0.000 | 0.002 |
| Fe | 0.086 | 0.070 | 0.071 | 0.090 | 0.080 | 0.080 | 0.170 | 0.169 | 0.166 | 0.166 | 0.174 | 0.166 | 0.167 | 0.147 | 0.169 | 0.170 |
| Ti | 0.000 | 0.002 | 0.000 | 0.001 | 0.000 | 0.004 | 0.003 | 0.000 | 0.000 | 0.000 | 0.001 | 0.000 | 0.000 | 0.001 | 0.001 | 0.000 |
| Ni | 0.000 | 0.002 | 0.000 | 0.001 | 0.000 | 0.003 | 0.002 | 0.000 | 0.007 | 0.003 | 0.002 | 0.000 | 0.000 | 0.001 | 0.004 | 0.000 |
| Li | 0.012 | 0.011 | 0.010 | 0.011 | 0.012 | 0.011 | 0.046 | 0.045 | 0.044 | 0.044 | 0.047 | 0.045 | 0.043 | 0.045 | 0.044 | 0.047 |
| Be | 2.988 | 2.989 | 2.990 | 2.989 | 2.988 | 2.989 | 2.954 | 2.955 | 2.956 | 2.956 | 2.953 | 2.955 | 2.957 | 2.955 | 2.956 | 2.953 |
* = calculated on the basis of O = 18, Be = 3-Li. Li2O recalculated from LA-ICP-MS data. bdl = below detection limit.
Table A4.
LA-ICP-MS analyses of aquamarine samples (ppm).
Table A4.
LA-ICP-MS analyses of aquamarine samples (ppm).
| XJ-1-1 | XJ-1-2 | XJ-1-3 | XJ-1-4 | XJ-1-5 | XJ-1-6 | XJ-1-7 | XJ-1-8 | XJ-2-1 | XJ-2-2 | XJ-2-3 | XJ-2-4 | XJ-2-5 | XJ-2-6 | XJ-2-7 | XJ-2-8 | XJ-2-9 | ||
| Li | 630 | 641 | 630 | 631 | 721 | 598 | 639 | 596 | 112 | 106 | 108 | 113 | 112 | 117 | 114 | 112 | 110 | |
| Na | 2948 | 3002 | 2890 | 2840 | 3327 | 2851 | 3470 | 2807 | 1768 | 1738 | 1770 | 1742 | 1634 | 1689 | 1688 | 1680 | 1815 | |
| Mg | 407 | 440 | 380 | 378 | 523 | 492 | 869 | 441 | 612 | 582 | 609 | 590 | 536 | 580 | 578 | 580 | 646 | |
| K | 78.9 | 90.7 | 77.5 | 97.8 | 107 | 90.8 | 113.1 | 84.3 | 90.1 | 87.5 | 71.2 | 75.2 | 67.7 | 96.0 | 70.8 | 74.5 | 81.7 | |
| Sc | bdl | 0.43 | 0.28 | bdl | 0.30 | 0.57 | 1.36 | 0.31 | 0.93 | 0.96 | 0.70 | 0.89 | 0.69 | 0.87 | 0.77 | 0.92 | 0.87 | |
| Ti | 79.2 | 71.2 | 71.8 | 66.7 | 63.1 | 70.6 | 73.9 | 68.7 | 67.7 | 61.3 | 66.9 | 64.2 | 63.5 | 66.3 | 69.5 | 70.1 | 70.1 | |
| V | 2.27 | 2.51 | 2.16 | 2.25 | 2.26 | 2.48 | 8.01 | 1.32 | 1.45 | 1.42 | 1.39 | 1.44 | 1.11 | 1.44 | 1.22 | 1.29 | 1.53 | |
| Mn | 36.6 | 36.6 | 35.9 | 35.8 | 32.3 | 37.0 | 44.3 | 28.8 | 73.9 | 70.9 | 68.4 | 70.3 | 62.2 | 61.1 | 58.9 | 65.6 | 72.2 | |
| Fe | 4492 | 4751 | 4550 | 4655 | 4159 | 4535 | 5782 | 3907 | 5805 | 5774 | 5723 | 5698 | 5293 | 5388 | 5401 | 5472 | 5985 | |
| Zn | 371 | 370 | 360 | 375 | 346 | 373 | 356 | 348 | 201 | 202 | 199 | 204 | 201 | 202 | 201 | 199 | 202 | |
| Rb | 33.3 | 35.9 | 30.3 | 35.7 | 33.3 | 34.4 | 41.4 | 30.4 | 22.5 | 23.1 | 21.8 | 21.7 | 20.7 | 21.6 | 20.2 | 21.6 | 22.4 | |
| Cs | 2623 | 2989 | 2593 | 2969 | 2278 | 2683 | 4000 | 1562 | 427 | 424 | 404 | 412 | 357 | 378 | 377 | 366 | 468 | |
| cation (apfu) | ||||||||||||||||||
| Li | 0.052 | 0.052 | 0.052 | 0.052 | 0.060 | 0.049 | 0.053 | 0.049 | 0.009 | 0.008 | 0.008 | 0.009 | 0.009 | 0.009 | 0.009 | 0.009 | 0.009 | |
| Na | 0.073 | 0.074 | 0.071 | 0.071 | 0.083 | 0.071 | 0.087 | 0.070 | 0.042 | 0.041 | 0.042 | 0.041 | 0.039 | 0.040 | 0.040 | 0.040 | 0.043 | |
| Mg | 0.010 | 0.010 | 0.009 | 0.009 | 0.012 | 0.012 | 0.021 | 0.010 | 0.014 | 0.013 | 0.014 | 0.013 | 0.012 | 0.013 | 0.013 | 0.013 | 0.015 | |
| K | 0.001 | 0.001 | 0.001 | 0.001 | 0.002 | 0.001 | 0.002 | 0.001 | 0.001 | 0.001 | 0.001 | 0.001 | 0.001 | 0.001 | 0.001 | 0.001 | 0.001 | |
| Sc | - | 0.000 | 0.000 | - | 0.000 | 0.000 | 0.000 | 0.000 | 0.000 | 0.000 | 0.000 | 0.000 | 0.000 | 0.000 | 0.000 | 0.000 | 0.000 | |
| Ti | 0.001 | 0.001 | 0.001 | 0.001 | 0.001 | 0.001 | 0.001 | 0.001 | 0.001 | 0.001 | 0.001 | 0.001 | 0.001 | 0.001 | 0.001 | 0.001 | 0.001 | |
| V | 0.000 | 0.000 | 0.000 | 0.000 | 0.000 | 0.000 | 0.000 | 0.000 | 0.000 | 0.000 | 0.000 | 0.000 | 0.000 | 0.000 | 0.000 | 0.000 | 0.000 | |
| Mn | 0.000 | 0.000 | 0.000 | 0.000 | 0.000 | 0.000 | 0.000 | 0.000 | 0.001 | 0.001 | 0.001 | 0.001 | 0.001 | 0.001 | 0.001 | 0.001 | 0.001 | |
| Fe | 0.046 | 0.048 | 0.046 | 0.048 | 0.043 | 0.046 | 0.059 | 0.040 | 0.057 | 0.057 | 0.056 | 0.055 | 0.052 | 0.053 | 0.053 | 0.054 | 0.059 | |
| Zn | 0.003 | 0.003 | 0.003 | 0.003 | 0.003 | 0.003 | 0.003 | 0.003 | 0.002 | 0.002 | 0.002 | 0.002 | 0.002 | 0.002 | 0.002 | 0.002 | 0.002 | |
| Rb | 0.000 | 0.000 | 0.000 | 0.000 | 0.000 | 0.000 | 0.000 | 0.000 | 0.000 | 0.000 | 0.000 | 0.000 | 0.000 | 0.000 | 0.000 | 0.000 | 0.000 | |
| Cs | 0.011 | 0.013 | 0.011 | 0.013 | 0.010 | 0.012 | 0.017 | 0.007 | 0.002 | 0.002 | 0.002 | 0.002 | 0.001 | 0.002 | 0.002 | 0.002 | 0.002 | |
| XJ-2-10 | XJ-2-11 | XJ-2-12 | XJ-2-13 | MG-1 | MG-2 | MG-3 | MG-4 | MG-5 | MG-6 | MG-7 | MG-8 | MG-9 | MG-10 | MG-11 | MG-12 | MG-13 | ||
| Li | 119 | 112 | 116 | 109 | 135 | 144 | 158 | 136 | 144 | 161 | 151 | 145 | 137 | 131 | 135 | 147 | 135 | |
| Na | 1828 | 1853 | 1829 | 1732 | 1764.2 | 1778 | 1857 | 1731 | 1779 | 1728 | 1770 | 1905 | 1732 | 1723 | 1735 | 1849 | 1721 | |
| Mg | 631 | 648 | 632 | 600 | 212 | 220 | 222 | 225 | 225 | 221 | 227 | 230 | 228 | 230 | 230 | 230 | 230 | |
| K | 32.2 | 58.3 | 69.5 | 83.8 | 63 | 39.4 | 38.0 | 48.7 | 63.5 | 31.0 | 39.3 | 63.2 | 73.8 | 71.5 | 53.3 | 49.7 | 57.2 | |
| Sc | 1.18 | 0.74 | 1.08 | 0.69 | 3.25 | 3.14 | 3.32 | 3.52 | 3.22 | 3.18 | 3.76 | 3.45 | 3.43 | 3.22 | 3.45 | 3.76 | 3.36 | |
| Ti | 68.9 | 70.5 | 70.3 | 73.1 | 65.8 | 67.9 | 66.3 | 69.4 | 64.6 | 64.4 | 64.4 | 66.7 | 70.9 | 70.8 | 67.5 | 68.5 | 72.8 | |
| V | 1.64 | 1.53 | 1.11 | 1.34 | 7.29 | 7.37 | 7.50 | 7.34 | 7.27 | 7.25 | 7.72 | 7.40 | 7.00 | 7.63 | 7.72 | 7.12 | 7.71 | |
| Mn | 61.0 | 75.8 | 73.0 | 74.2 | 105 | 102 | 95.0 | 107 | 104 | 104 | 111 | 117 | 117 | 119 | 118 | 122 | 120 | |
| Fe | 5529 | 6026 | 5992 | 5826 | 7546 | 7504 | 7457 | 7503 | 7547 | 7204 | 7522 | 7585 | 7575 | 7633 | 7663 | 7649 | 7634 | |
| Zn | 191 | 206 | 199 | 207 | 87.6 | 85.3 | 84.9 | 86.0 | 85.1 | 82.1 | 89.7 | 87.0 | 90.5 | 86.0 | 89.2 | 88.1 | 89.1 | |
| Rb | 18.2 | 21.2 | 20.9 | 21.9 | 43.5 | 39.1 | 29.7 | 42.5 | 42.2 | 29.1 | 39.1 | 42.1 | 43.3 | 42.6 | 38.7 | 42.1 | 43.2 | |
| Cs | 395 | 465 | 464 | 431 | 543 | 555 | 578 | 543 | 555 | 621 | 563 | 556 | 542 | 546 | 546 | 559 | 548 | |
| cation (apfu) | ||||||||||||||||||
| Li | 0.009 | 0.009 | 0.009 | 0.009 | 0.011 | 0.011 | 0.013 | 0.011 | 0.011 | 0.013 | 0.012 | 0.012 | 0.011 | 0.010 | 0.011 | 0.012 | 0.011 | |
| Na | 0.044 | 0.044 | 0.043 | 0.042 | 0.042 | 0.043 | 0.045 | 0.041 | 0.043 | 0.042 | 0.042 | 0.046 | 0.042 | 0.041 | 0.042 | 0.045 | 0.041 | |
| Mg | 0.014 | 0.015 | 0.014 | 0.014 | 0.005 | 0.005 | 0.005 | 0.005 | 0.005 | 0.005 | 0.005 | 0.005 | 0.005 | 0.005 | 0.005 | 0.005 | 0.005 | |
| K | 0.000 | 0.001 | 0.001 | 0.001 | 0.001 | 0.001 | 0.001 | 0.001 | 0.001 | 0.000 | 0.001 | 0.001 | 0.001 | 0.001 | 0.001 | 0.001 | 0.001 | |
| Sc | 0.000 | 0.000 | 0.000 | 0.000 | 0.000 | 0.000 | 0.000 | 0.000 | 0.000 | 0.000 | 0.000 | 0.000 | 0.000 | 0.000 | 0.000 | 0.000 | 0.000 | |
| Ti | 0.001 | 0.001 | 0.001 | 0.001 | 0.001 | 0.001 | 0.001 | 0.001 | 0.001 | 0.001 | 0.001 | 0.001 | 0.001 | 0.001 | 0.001 | 0.001 | 0.001 | |
| V | 0.000 | 0.000 | 0.000 | 0.000 | 0.000 | 0.000 | 0.000 | 0.000 | 0.000 | 0.000 | 0.000 | 0.000 | 0.000 | 0.000 | 0.000 | 0.000 | 0.000 | |
| Mn | 0.001 | 0.001 | 0.001 | 0.001 | 0.001 | 0.001 | 0.001 | 0.001 | 0.001 | 0.001 | 0.001 | 0.001 | 0.001 | 0.001 | 0.001 | 0.001 | 0.001 | |
| Fe | 0.055 | 0.059 | 0.059 | 0.058 | 0.074 | 0.074 | 0.074 | 0.074 | 0.074 | 0.072 | 0.074 | 0.075 | 0.075 | 0.075 | 0.076 | 0.076 | 0.075 | |
| Zn | 0.002 | 0.002 | 0.002 | 0.002 | 0.001 | 0.001 | 0.001 | 0.001 | 0.001 | 0.001 | 0.001 | 0.001 | 0.001 | 0.001 | 0.001 | 0.001 | 0.001 | |
| Rb | 0.000 | 0.000 | 0.000 | 0.000 | 0.000 | 0.000 | 0.000 | 0.000 | 0.000 | 0.000 | 0.000 | 0.000 | 0.000 | 0.000 | 0.000 | 0.000 | 0.000 | |
| Cs | 0.002 | 0.002 | 0.002 | 0.002 | 0.002 | 0.002 | 0.002 | 0.002 | 0.002 | 0.003 | 0.002 | 0.002 | 0.002 | 0.002 | 0.002 | 0.002 | 0.002 | |
| MG-14 | MG-15 | NA-1 | NA-2 | NA-3 | NA-4 | NA-5 | NA-6 | NA-7 | NA-8 | NA-9 | NA-10 | NA-11 | NA-12 | NA-13 | NA-14 | NA-15 | DL | |
| Li | 134 | 139 | 563 | 561 | 540 | 542 | 573 | 548 | 527 | 558 | 537 | 578 | 578 | 538 | 537 | 555 | 564 | 0.4 |
| Na | 1710 | 1796 | 8658 | 8691 | 8469 | 8587 | 8854 | 8731 | 8860 | 8870 | 8855 | 8886 | 8996 | 8850 | 8683 | 8806 | 8832 | 0.4 |
| Mg | 229.4 | 230.2 | 5102 | 5122 | 5099 | 5203 | 5263 | 5181 | 5232 | 5310 | 5210 | 5261 | 5322 | 5303 | 5266 | 5210 | 5265 | 0.06 |
| K | 50.4 | 49.2 | 639 | 641 | 560 | 560.4 | 664 | 644 | 635 | 659 | 633 | 643 | 670 | 658 | 615 | 654 | 649 | 0.15 |
| Sc | 3.80 | 3.40 | 549 | 553 | 539 | 537 | 544 | 550 | 557 | 556 | 542 | 547 | 551 | 555 | 548 | 552 | 574 | 0.2 |
| Ti | 68.1 | 68.4 | 87.8 | 85.2 | 87.8 | 77.3 | 81.1 | 81.2 | 83.9 | 77.0 | 83.4 | 81.6 | 86.8 | 83.1 | 78.5 | 81.0 | 80.1 | 1.3 |
| V | 7.41 | 7.74 | 61.5 | 61.0 | 61.0 | 62.3 | 63.2 | 62.7 | 63.2 | 63.2 | 62.9 | 62.8 | 66.0 | 64.9 | 63.3 | 63.9 | 65.1 | 0.001 |
| Mn | 117 | 119 | 338 | 330 | 332 | 314 | 340 | 342 | 339 | 355 | 294 | 332 | 343 | 349 | 302 | 318 | 320 | 0.01 |
| Fe | 7620 | 7696 | 15,800 | 15,686 | 15,631 | 15,650 | 15,748 | 15,771 | 15,898 | 15,958 | 15,798 | 15,918 | 16,145 | 16,220 | 15,896 | 15,988 | 16,100 | 0.05 |
| Zn | 86.7 | 87.7 | 84.8 | 87.4 | 87.9 | 85.5 | 88.0 | 87.6 | 90.3 | 86.7 | 86.3 | 90.5 | 86.5 | 87.4 | 82.8 | 84.3 | 88.4 | 0.02 |
| Rb | 421.0 | 44.0 | 89.7 | 88.5 | 87.5 | 87.4 | 89.8 | 90.1 | 92.0 | 91.0 | 91.4 | 92.5 | 93.4 | 94.1 | 90.9 | 93.7 | 93.8 | 0.003 |
| Cs | 550 | 549 | 696 | 706 | 692 | 691 | 750 | 712 | 724 | 712 | 716 | 719 | 717 | 716 | 683 | 711 | 718 | 0.001 |
| cation (apfu) | ||||||||||||||||||
| Li | 0.011 | 0.011 | 0.047 | 0.047 | 0.046 | 0.046 | 0.048 | 0.046 | 0.044 | 0.046 | 0.046 | 0.049 | 0.048 | 0.045 | 0.045 | 0.047 | 0.047 | |
| Na | 0.041 | 0.044 | 0.217 | 0.218 | 0.215 | 0.219 | 0.226 | 0.221 | 0.226 | 0.223 | 0.227 | 0.226 | 0.226 | 0.225 | 0.220 | 0.224 | 0.223 | |
| Mg | 0.005 | 0.005 | 0.121 | 0.121 | 0.123 | 0.125 | 0.127 | 0.124 | 0.126 | 0.126 | 0.126 | 0.127 | 0.127 | 0.127 | 0.126 | 0.125 | 0.126 | |
| K | 0.001 | 0.001 | 0.009 | 0.009 | 0.008 | 0.008 | 0.010 | 0.010 | 0.010 | 0.010 | 0.010 | 0.010 | 0.010 | 0.010 | 0.009 | 0.010 | 0.010 | |
| Sc | 0.000 | 0.000 | 0.007 | 0.007 | 0.007 | 0.007 | 0.007 | 0.007 | 0.007 | 0.007 | 0.007 | 0.007 | 0.007 | 0.007 | 0.007 | 0.007 | 0.007 | |
| Ti | 0.001 | 0.001 | 0.001 | 0.001 | 0.001 | 0.001 | 0.001 | 0.001 | 0.001 | 0.001 | 0.001 | 0.001 | 0.001 | 0.001 | 0.001 | 0.001 | 0.001 | |
| V | 0.000 | 0.000 | 0.001 | 0.001 | 0.001 | 0.001 | 0.001 | 0.001 | 0.001 | 0.001 | 0.001 | 0.001 | 0.001 | 0.001 | 0.001 | 0.001 | 0.001 | |
| Mn | 0.001 | 0.001 | 0.004 | 0.003 | 0.004 | 0.003 | 0.004 | 0.004 | 0.004 | 0.004 | 0.003 | 0.004 | 0.004 | 0.004 | 0.003 | 0.003 | 0.003 | |
| Fe | 0.076 | 0.077 | 0.163 | 0.162 | 0.164 | 0.164 | 0.165 | 0.164 | 0.167 | 0.165 | 0.167 | 0.167 | 0.167 | 0.169 | 0.166 | 0.167 | 0.167 | |
| Zn | 0.001 | 0.001 | 0.001 | 0.001 | 0.001 | 0.001 | 0.001 | 0.001 | 0.001 | 0.001 | 0.001 | 0.001 | 0.001 | 0.001 | 0.001 | 0.001 | 0.001 | |
| Rb | 0.000 | 0.000 | 0.001 | 0.001 | 0.001 | 0.001 | 0.001 | 0.001 | 0.001 | 0.001 | 0.001 | 0.001 | 0.001 | 0.001 | 0.001 | 0.001 | 0.001 | |
| Cs | 0.002 | 0.002 | 0.003 | 0.003 | 0.003 | 0.003 | 0.003 | 0.003 | 0.003 | 0.003 | 0.003 | 0.003 | 0.003 | 0.003 | 0.003 | 0.003 | 0.003 | |
DL = detection limit, bdl = below detection limit.
References
- Daneshvar, N.; Azizi, H.; Asahara, Y.; Tsuboi, M.; Minami, M.; Mohammad, Y.O. Geochemistry and Genesis of Beryl Crystals in the LCT Pegmatite Type, Ebrahim-Attar Mountain, Western Iran. Minerals 2021, 11, 717. [Google Scholar] [CrossRef]
- Wang, P.; Gray, T.P.; Li, Z.; Anderson, E.J.D.; Allaz, J.; Smyth, J.R.; Koenig, A.E.; Qi, L.j.; Zhou, Y.; Raschke, M.B. Mineralogical classification and crystal water characterisation of beryl from the W–Sn–Be occurrence of Xuebaoding, Sichuan province, western China. Mineral. Mag. 2021, 85, 172–188. [Google Scholar] [CrossRef]
- Černý, P. Mineralogy of Beryllium in Granitic Pegmatites. Rev. Mineral. Geochem. 2002, 50, 405–444. [Google Scholar] [CrossRef]
- Aurisicchio, C.; Fioravanti, G.; Grubessi, O.; Zanazzi, P.F. Reappraisal of the crystal chemistry of beryl. Am. Miner. 1988, 73, 826–837. [Google Scholar]
- Wood, D.L.; Nassau, K. Infrared Spectra of Foreign Molecules in Beryl. J. Chem. Phys. 1967, 47, 2220–2228. [Google Scholar] [CrossRef]
- Yu, X.Y. Colored Gemmology, 2nd ed.; Geological Publishing House: Beijing, China, 2019; pp. 150–151. [Google Scholar]
- Shen, J.Q.; Hu, Z.K.; Cui, S.Y.; Zhang, Y.F.; Li, E.Q.; Liang, W.; Xu, B. A Study on Beryl in the Cuonadong Be-W-Sn Polymetallic Deposit, Longzi County, Tibet, China. Crystals 2021, 11, 777. [Google Scholar] [CrossRef]
- Bhandari, S.; Qin, K.; Zhou, Q.; Evans, N.J. Geological, Mineralogical and Geochemical Study of the Aquamarine-Bearing Yamrang Pegmatite, Eastern Nepal with Implications for Exploration Targeting. Minerals 2022, 12, 564. [Google Scholar] [CrossRef]
- Hoyer, I.d.S.; Souza, V.d.S.; Debowski, B.P. Aquamarine from Massangana batholith, Rondônia State: Mineral chemistry and fluid inclusion data. REM-Int. Eng. J. 2020, 73, 319–327. [Google Scholar] [CrossRef]
- Groat, L.A.; Giuliani, G.; Stone-Sundberg, J.; Sun, Z.; Renfro, N.D.; Palke, A.C. A Review of Analytical Methods Used in Geographic Origin Determination of Gemstones. Gems Gemol. 2019, 55, 512–535. [Google Scholar] [CrossRef]
- Xu, B.; Hou, Z.-Q.; Griffin, W.L.; Lu, Y.; Belousova, E.; Xu, J.-F.; O’Reilly, S.Y. Recycled volatiles determine fertility of porphyry deposits in collisional settings. Am. Mineral. 2021, 106, 656–661. [Google Scholar] [CrossRef]
- Xu, B.; Hou, Z.-Q.; Griffin, W.L.; O’Reilly, S.Y.; Zheng, Y.-C.; Wang, T.; Bin, F.; Xu, J.-F. In-situ mineralogical interpretation of the mantle geophysical signature of the Gangdese Cu-porphyry mineral system. Gondwana Res. 2022, 111, 53–63. [Google Scholar] [CrossRef]
- Xu, B.; Hou, Z.-Q.; Griffin, W.L.; Zheng, Y.-C.; Wang, T.; Guo, Z.; Hou, J.; Santosh, M.; O’Reilly, S.Y. Cenozoic lithospheric architecture and metallogenesis in Southeastern Tibet. Earth-Sci. Rev. 2021, 214, 103472. [Google Scholar] [CrossRef]
- Xu, B.; Hou, Z.-Q.; Griffin, W.L.; Yu, J.-X.; Long, T.; Zhao, Y.; Wang, T.; Fu, B.; Belousova, E.; O’Reilly, S.Y. Apatite halogens and Sr-O and zircon Hf-O isotopes: Recycled volatiles in Jurassic porphyry ore systems in southern Tibet. Chem. Geol. 2022, 605, 120924. [Google Scholar] [CrossRef]
- Xu, B.; Griffin, W.L.; Xiong, Q.; Hou, Z.-Q.; O’Reilly, S.Y.; Guo, Z.; Pearson, N.J.; Gréau, Y.; Yang, Z.-M.; Zheng, Y.-C. Ultrapotassic rocks and xenoliths from South Tibet: Contrasting styles of interaction between lithospheric mantle and asthenosphere during continental collision. Geology 2017, 45, 51–54. [Google Scholar] [CrossRef]
- Saeseaw, S.; Renfro, N.D.; Palke, A.C.; Sun, Z.; McClure, S.F. Geographic Origin Determination of Emerald. Gems Gemol. 2019, 55, 614–646. [Google Scholar] [CrossRef]
- Palke, A.C.; Saeseaw, S.; Renfro, N.D.; Sun, Z.; McClure, S.F. Geographic Origin Determination of Ruby. Gems Gemol. 2019, 55, 580–613. [Google Scholar] [CrossRef]
- Palke, A.C.; Saeseaw, S.; Renfro, N.D.; Sun, Z.; McClure, S.F. Geographic Origin Determination of Blue Sapphire. Gems Gemol. 2019, 55, 536–579. [Google Scholar] [CrossRef]
- Fukuda, J.; Shinoda, K. Water molecules in beryl and cordierite: High-temperature vibrational behavior, dehydration, and coordination to cations. Phys. Chem. Miner. 2011, 38, 469–481. [Google Scholar] [CrossRef]
- Hu, Y.; Lu, R. Color Characteristics of Blue to Yellow Beryl from Multiple Origins. Gems Gemol. 2020, 56, 54–65. [Google Scholar] [CrossRef]
- Zhou, Q.; Qin, K.; Tang, D.; Wang, C.; Tian, Y.; Sakyi, P.A. Mineralogy of the Koktokay No. 3 pegmatite, Altai, NW China: Implications for evolution and melt–fluid processes of rare-metal pegmatites. Eur. J. Mineral. 2015, 27, 433–457. [Google Scholar] [CrossRef]
- Pedrosa-Soares, A.C.; De Campos, C.P.; Noce, C.; Silva, L.C.; Novo, T.; Roncato, J.; Medeiros, S.; Castañeda, C.; Queiroga, G.; Dantas, E.; et al. Late Neoproterozoic-Cambrian granitic magmatism in the Araçuaí orogen (Brazil), the Eastern Brazilian Pegmatite Province and related mineral resources. Geol. Soc. Lond. Spec. Publ. 2022, 350, 25–51. [Google Scholar] [CrossRef]
- Ballouard, C.; Elburg, M.A.; Tappe, S.; Reinke, C.; Ueckermann, H.; Doggart, S. Magmatic-hydrothermal evolution of rare metal pegmatites from the Mesoproterozoic Orange River pegmatite belt (Namaqualand, South Africa). Ore Geol. Rev. 2020, 116, 103252. [Google Scholar] [CrossRef]
- Wen, L.; Liang, W.X.; Zhang, Z.G.; Huang, J.C. The Infrared Spectroscopy of Minerals; Chongqing University Press: Chongqing, China, 1988; pp. 79–81. [Google Scholar]
- Aurisicchio, C.; Grubessi, O.; Zecchini, P. Infrared spectroscopy and crystal chemistry of the beryl group. Can. Mineral. 1994, 32, 55–68. [Google Scholar]
- Zhou, K.C.; Qi, L.J.; Xiang, C.J. Study on gemology of beryl gem from Pingwu Sichuan and mechanism of irradiation inducing coloration. China Min. Mag. 2005, 14, 30–32. [Google Scholar]
- Jehlička, J.; Culka, A.; Bersani, D.; Vandenabeele, P. Comparison of seven portable Raman spectrometers: Beryl as a case study. J. Raman Spectrosc. 2017, 48, 1289–1299. [Google Scholar] [CrossRef]
- Pisutha-Arnond, V.; Atichat, W.; Nhung, N.T.; Khoi, N.N.; Häger, T.; Hofmeister, W.; Huong, L.T.-T. Aquamarine from the Thuong Xuan District, Thanh Hoa Province, Vietnam. Gems Gemol. 2011, 47, 42–48. [Google Scholar] [CrossRef]
- Sardi, F.G.; Heimann, A. Pegmatitic Beryl as Indicator of Melt Evolution: Example from the Velasco District, Pampeana Pegmatite Province, Argentina, and Review of Worldwide Occurrences. Can. Mineral. 2014, 52, 809–836. [Google Scholar] [CrossRef]
- Hamis, A.; Kesraoui, M.; Boutaleb, A.; Fuchs, Y.; Marignac, C. Beryl occurrences in the granitic complex of Guerioune, Laouni, Southeastern Algeria: Electron microprobe, infrared spectroscopy, and fluid inclusions data. Arab. J. Geosci. 2021, 14, 357. [Google Scholar] [CrossRef]
- Borzenko, A.A.; Yurgenson, G.A. Scandium, Yttrium and Lanthanids in the Beryl of the Sherlovaya Gora Deposit. In Minerals: Structure, Properties, Methods of Investigation. Springer Proceedings in Earth and Environmental Sciences; Springer: Cham, Switzerland, 2020; pp. 37–42. [Google Scholar] [CrossRef]
- Rossman, G.R. Color in Gems: The New Technologies. Gems Gemol. 1981, 17, 60–71. [Google Scholar] [CrossRef]
- Goldman, D.S.; Rossman, G.R.; Parkin, K.M. Channel constituents in beryl. Phys. Chem. Miner. 1978, 3, 225–235. [Google Scholar] [CrossRef]
- Viana, R.R.; da Costa, G.M.; De Grave, E.; Stern, W.B.; Jordt-Evangelista, H. Characterization of beryl (aquamarine variety) by Mösssbauer spectroscopy. Phys. Chem. Miner. 2002, 29, 78–86. [Google Scholar] [CrossRef]
- Taran, M.N.; Rossman, G.R. Optical spectroscopic study of tuhualite and a re-examination of the beryl, cordierite, and osumilite spectra. Am. Mineral. 2001, 86, 937–980. [Google Scholar] [CrossRef]
- Lum, J.E.; Viljoen, F.; Cairncross, B.; Frei, D. Mineralogical and geochemical characteristics of BERYL (AQUAMARINE) from the Erongo Volcanic Complex, Namibia. J. Afr. Earth Sci. 2016, 124, 104–125. [Google Scholar] [CrossRef]
- Merino, E.; Villaseca, C.; Orejana, D.; Jeffries, T. Gahnite, chrysoberyl and beryl co-occurrence as accessory minerals in a highly evolved peraluminous pluton: The Belvís de Monroy leucogranite (Cáceres, Spain). Lithos 2013, 179, 137–156. [Google Scholar] [CrossRef]
- Ding, P. Study on Mineralogical Characteristic and Fluid Inclusions of Aquamarine from Fugong, Yunnan Province. Master’s Thesis, China University of Geosciences, Beijing, China, 2012. [Google Scholar]
- Fridrichová, J.; Bačík, P.; Rusinová, P.; Antal, P.; Škoda, R.; Bizovská, V.; Miglierini, M. Optical and crystal-chemical changes in aquamarines and yellow beryls from Thanh Hoa province, Vietnam induced by heat treatment. Phys. Chem. Miner. 2014, 42, 287–302. [Google Scholar] [CrossRef]
- Groat, L.A.; Rossman, G.R.; Dyar, M.D.; Turner, D.; Piccoli, P.M.B.; Schultz, A.J.; Ottolini, L. Crystal Chemistry of Dark Blue Aquamarine from the True Blue Showing, Yukon Territory, Canada. Can. Mineral. 2010, 48, 597–613. [Google Scholar] [CrossRef]
- Beal, K.L.; Lentz, D.R. Aquamarine beryl from Zealand Station, Canada: A mineralogical and stable isotope study. J. Geosci. 2012, 55, 57–67. [Google Scholar] [CrossRef]
- Kim, S.J.; Shin, D.W.; Shon, S.H.; Jang, Y.D. Gemological Characteristics of Aquamarine from the Gilgit-Baltistan of Northern Areas, Pakistan. J. Mineral. Soc. Korea 2015, 28, 51–60. [Google Scholar] [CrossRef]
- Bocchio, R.; Adamo, I.; Caucia, F. Aquamarine from the Masino-Bregaglia Massif, Central Alps, Italy. Gems Gemol. 2009, 45, 204–207. [Google Scholar] [CrossRef]
Disclaimer/Publisher’s Note: The statements, opinions and data contained in all publications are solely those of the individual author(s) and contributor(s) and not of MDPI and/or the editor(s). MDPI and/or the editor(s) disclaim responsibility for any injury to people or property resulting from any ideas, methods, instructions or products referred to in the content. |
© 2023 by the authors. Licensee MDPI, Basel, Switzerland. This article is an open access article distributed under the terms and conditions of the Creative Commons Attribution (CC BY) license (https://creativecommons.org/licenses/by/4.0/).