
Gemology, Spectroscopy, and Mineralogy Study of Aquamarines of Three Different Origins


Abstract
:1. Introduction
2. Materials and Methods
3. Results
3.1. Gemological Properties
3.2. Spectral Characteristics
3.2.1. Infrared Spectrum
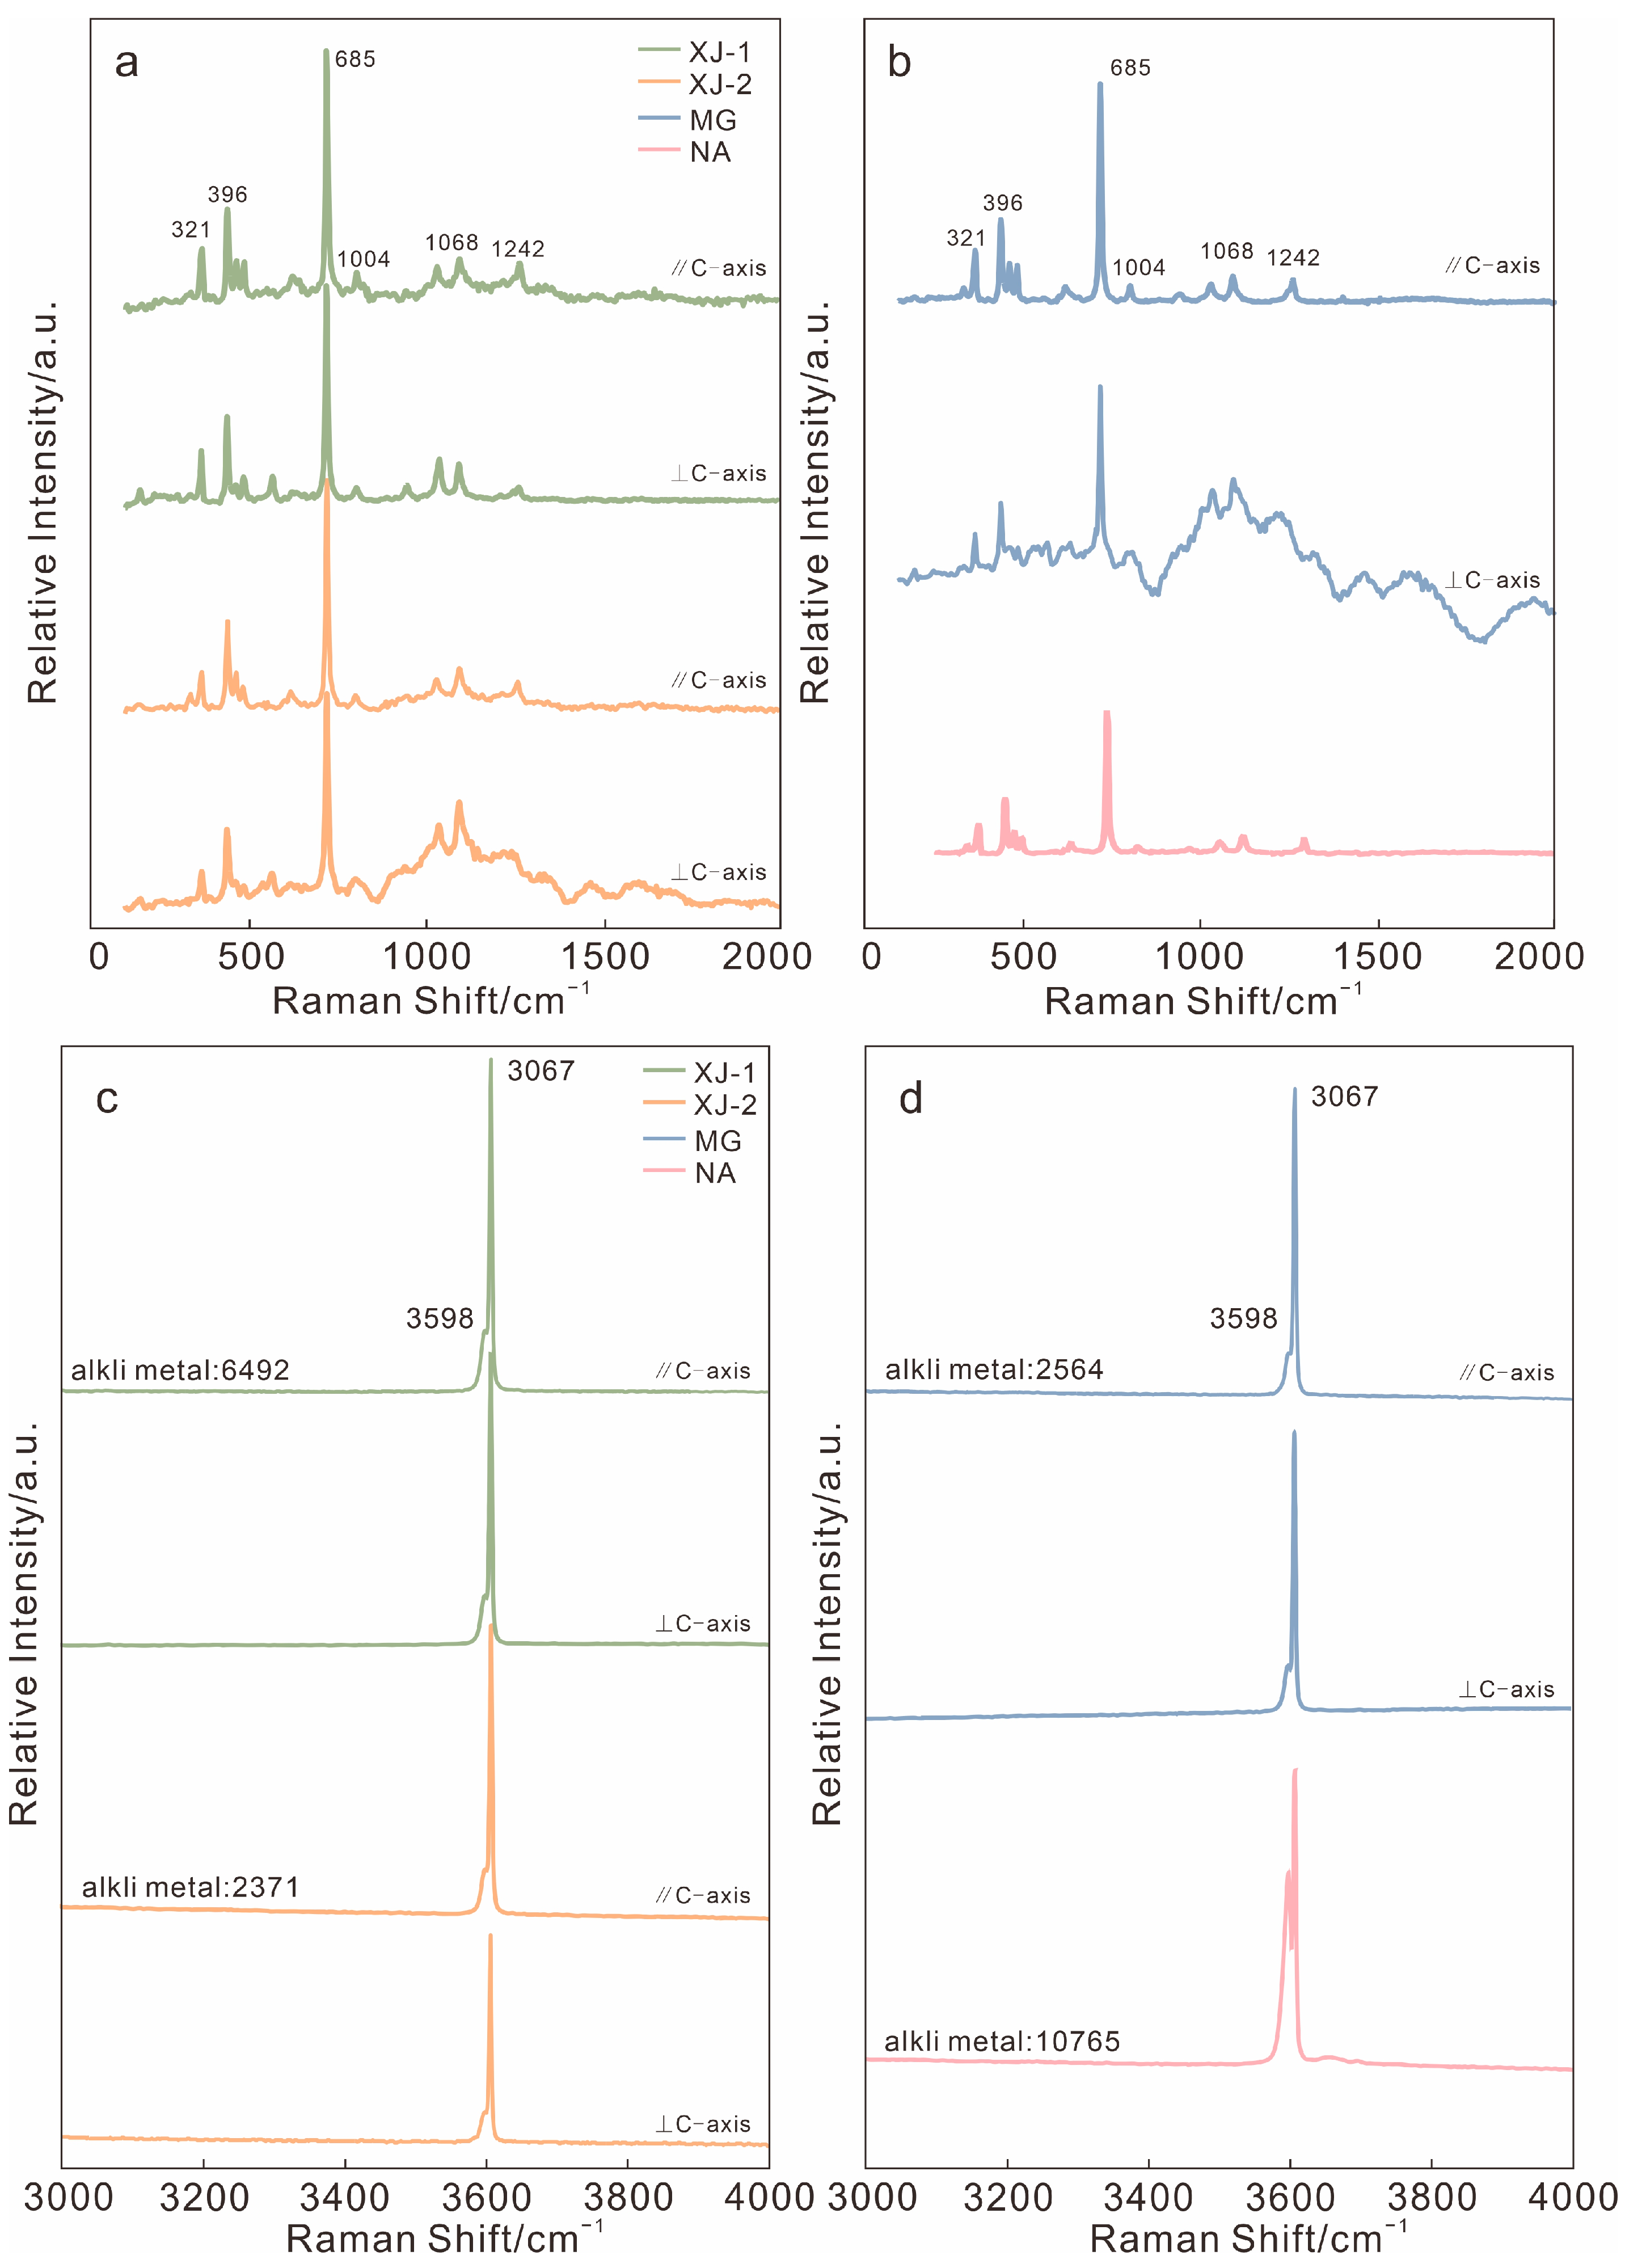
3.2.2. Raman Spectrum
3.3. Major and Trace Elements
4. Discussion
4.1. Gemological Properties
4.2. Spectroscopy Analysis
4.3. Chemical Compositions
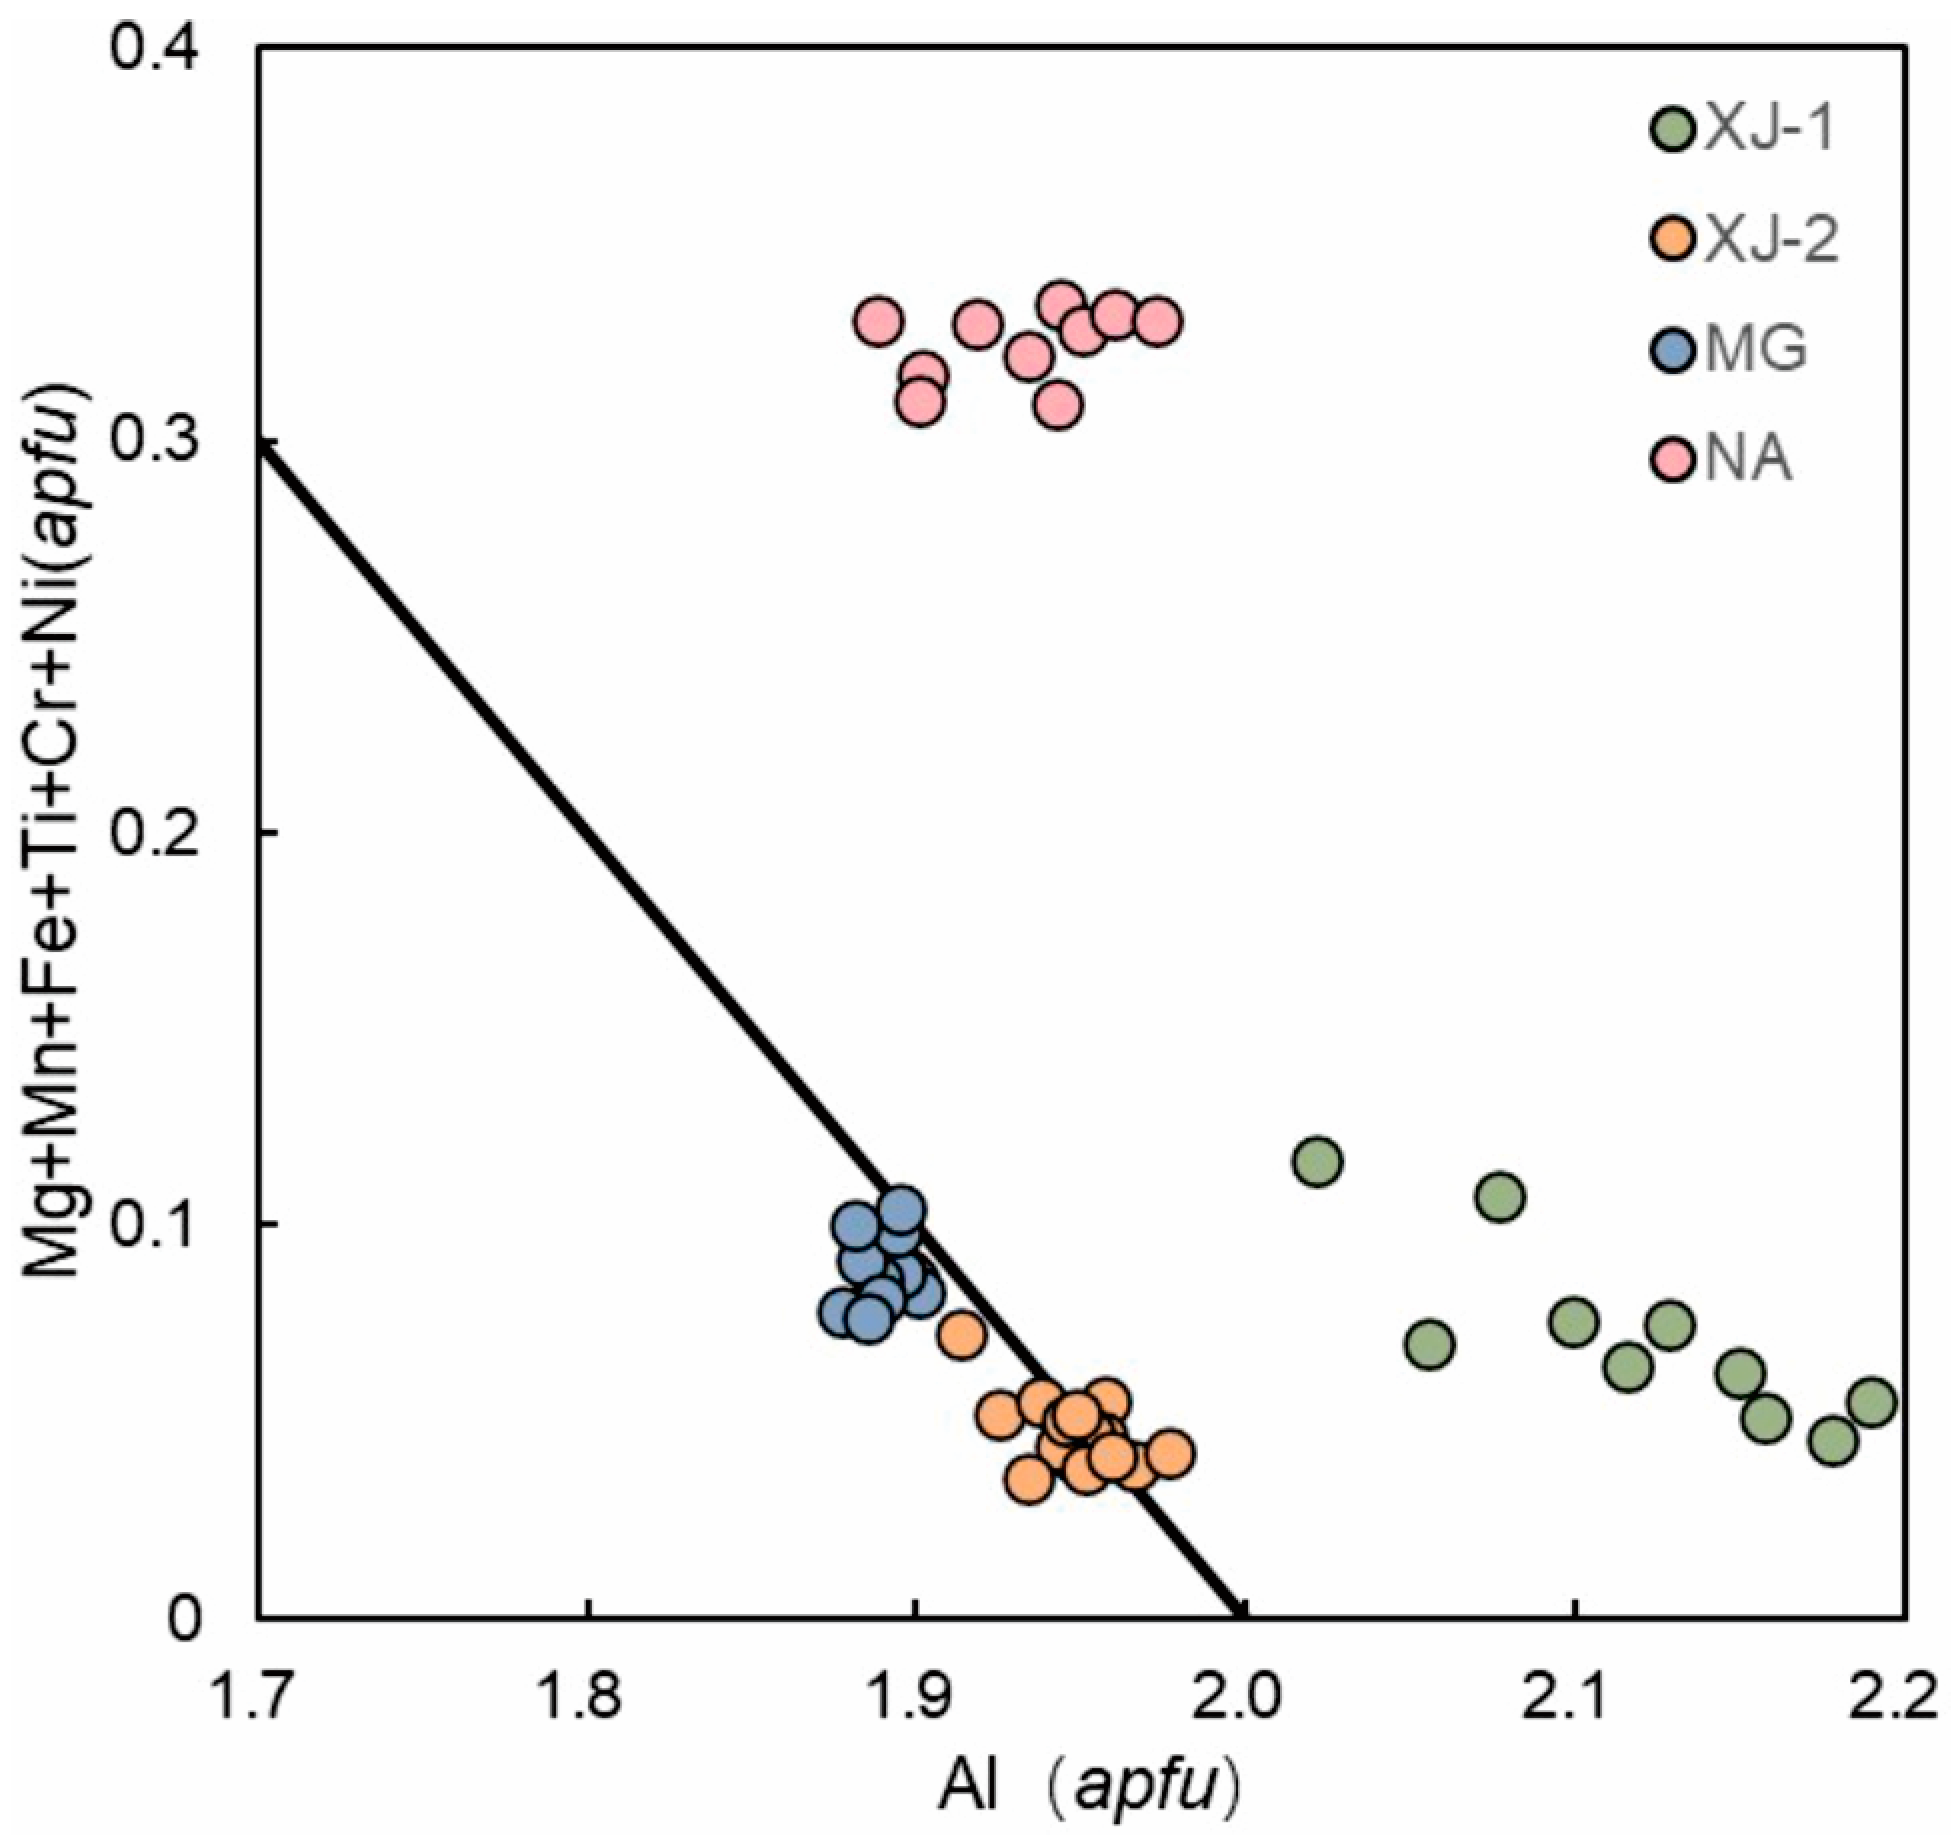
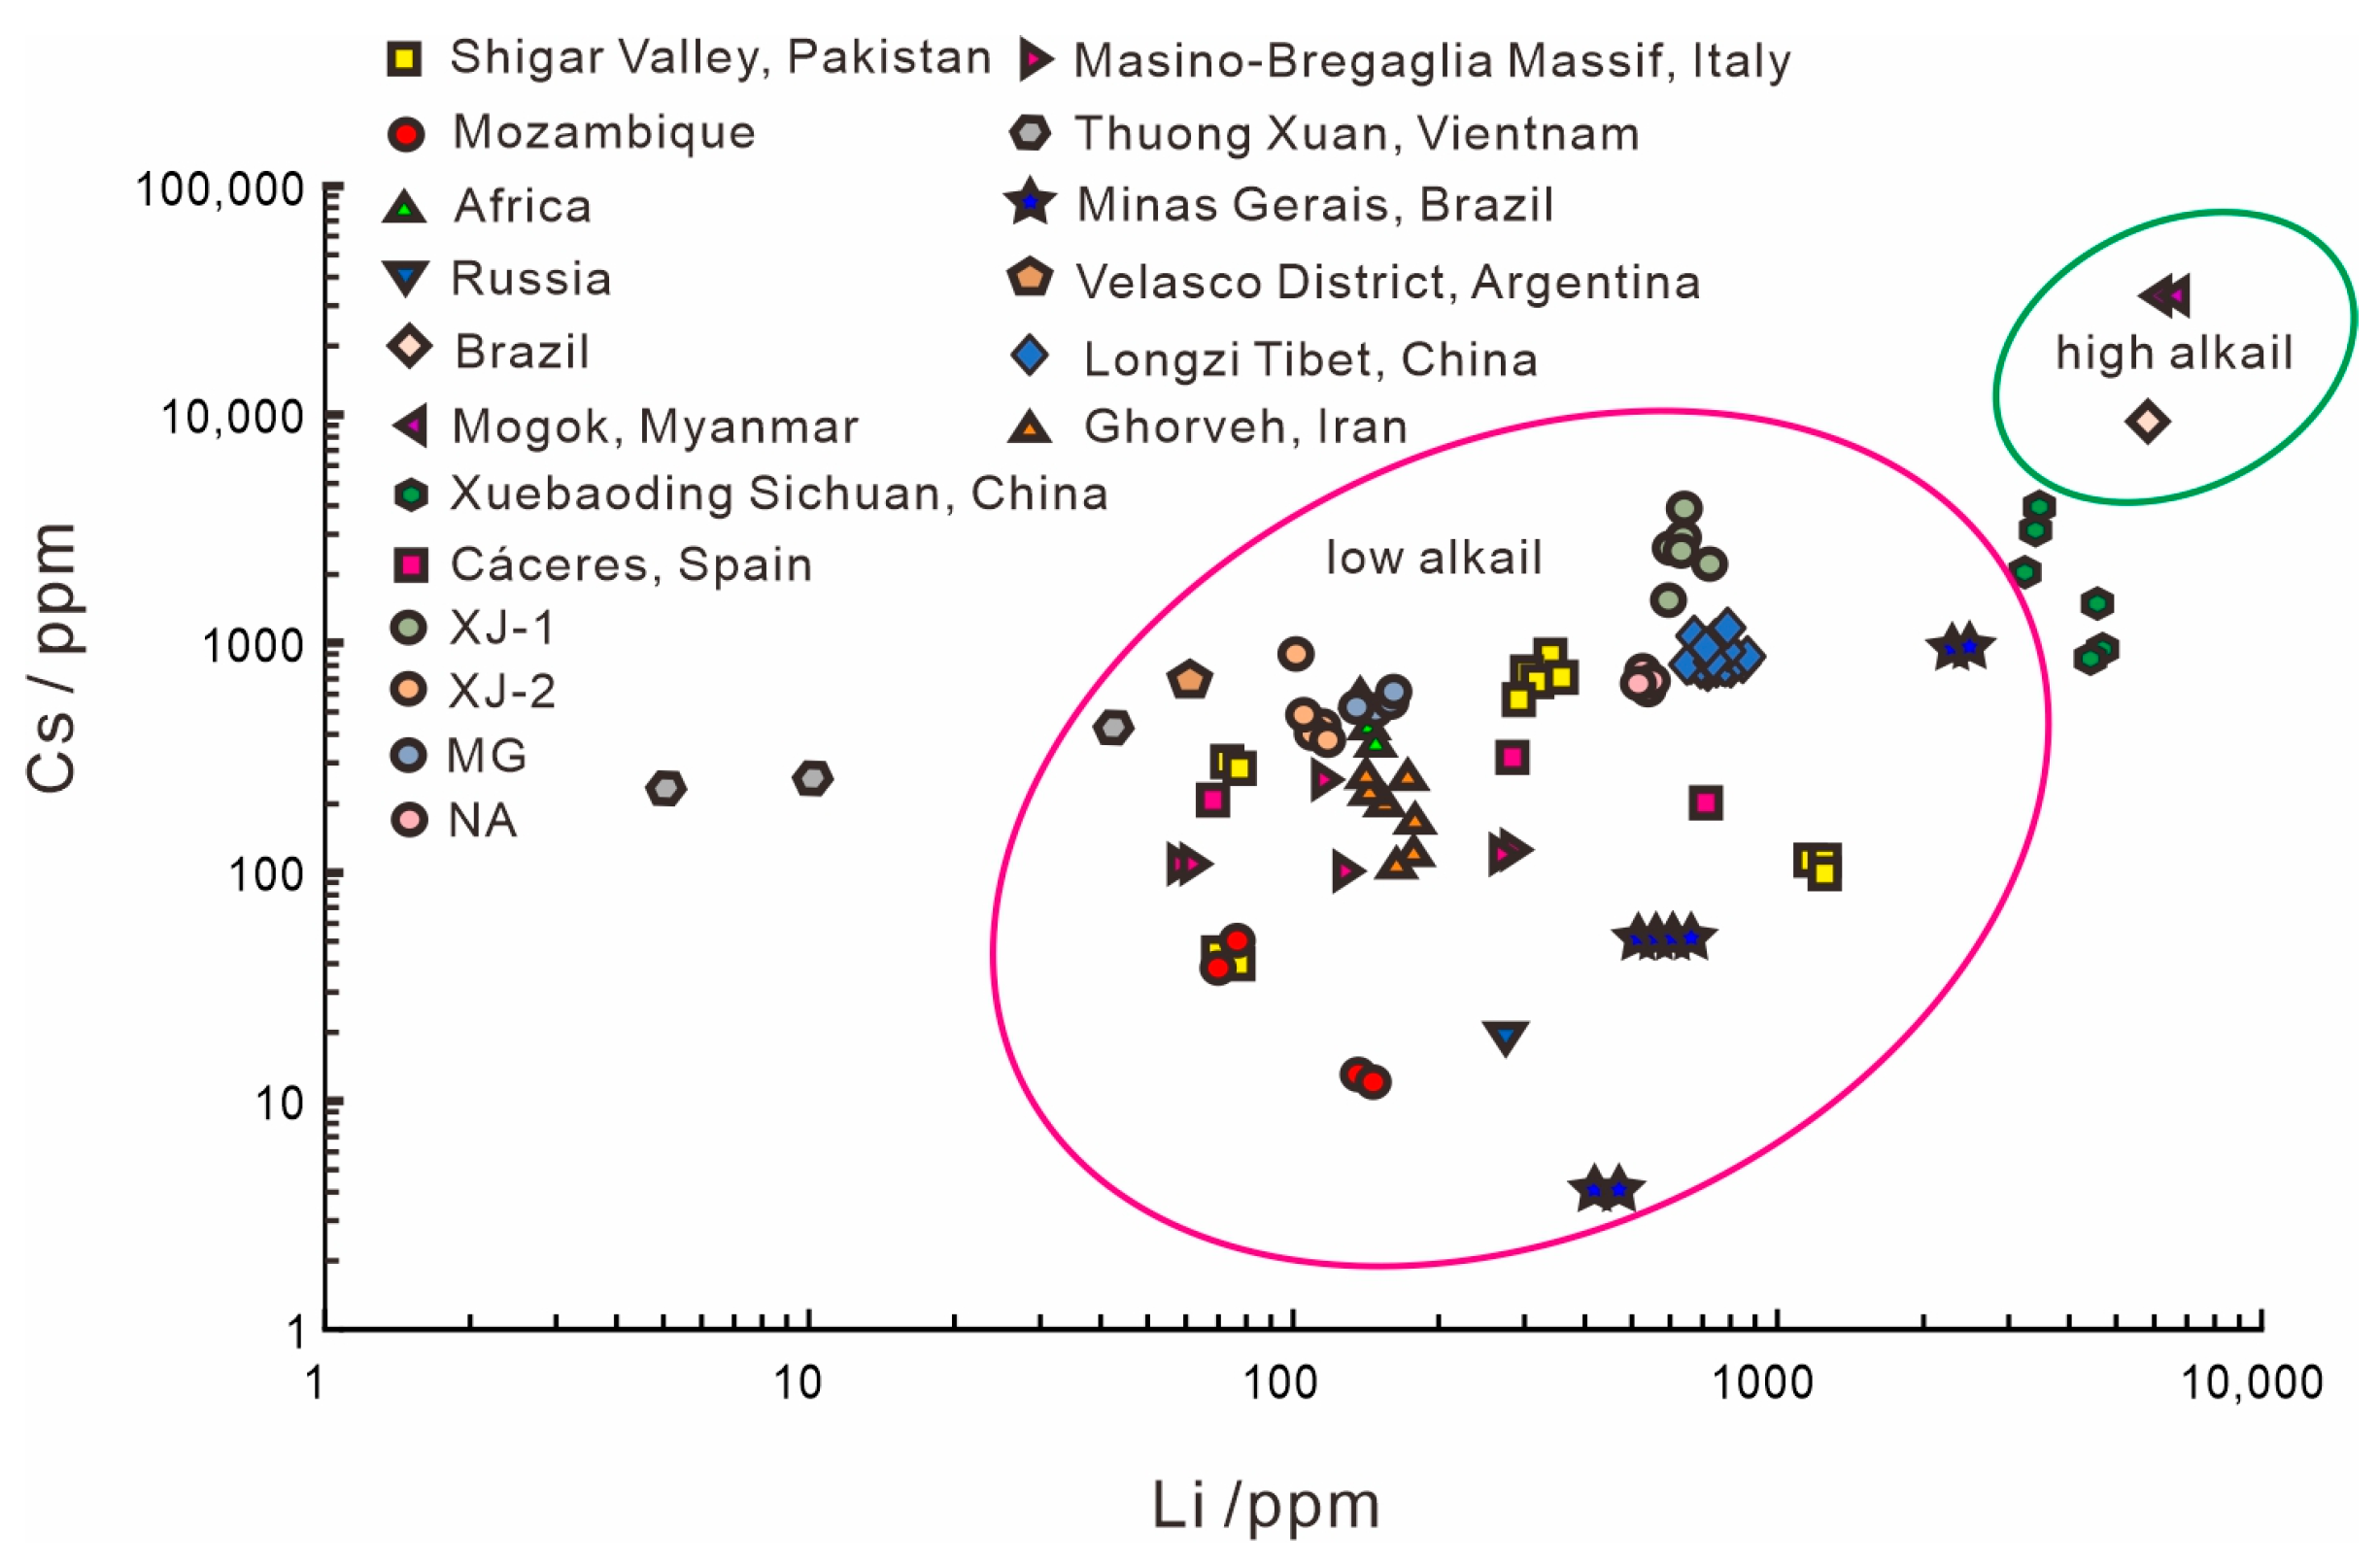
4.4. Chemical Composition Comparison with Other Localities
5. Conclusions
Author Contributions
Funding
Data Availability Statement
Acknowledgments
Conflicts of Interest
Appendix A

| XJ-1//C | XJ-1⊥C | XJ-2//C | XJ-2⊥C | BX//C | BX⊥C | NF | ||||||||
|---|---|---|---|---|---|---|---|---|---|---|---|---|---|---|
| Peak (cm−1) | Absorbance | FWHM | Absorbance | FWHM | Absorbance | FWHM | Absorbance | FWHM | Absorbance | FWHM | Absorbance | FWHM | Absorbance | FWHM |
| 684 | 0.2805 | 0.134 | 0.1632 | 0.122 | 0.0365 | 0.156 | 0.2789 | 0.016 | 0.1566 | 0.117 | 0.2518 | 0.116 | 0.3220 | 0.184 |
| 748 | 0.2453 | 0.140 | 0.0398 | 0.001 | 0.0225 | 0.128 | 0.2238 | 0.005 | 0.0327 | 0.038 | 0.0795 | 0.299 | 0.2450 | 0.130 |
| 962 | 0.4830 | 0.223 | 0.1578 | 0.126 | 0.0400 | 0.226 | 0.4628 | 0.009 | 0.0925 | 0.063 | 0.1221 | 0.050 | 0.6021 | 0.336 |
| 1024 | 0.3338 | 0.037 | 0.0599 | 0.030 | 0.0400 | 0.050 | 0.3163 | 0.007 | 0.0317 | 0.004 | 0.0861 | 0.033 | 0.4552 | 0.136 |
| 1072 | 0.2651 | 0.040 | 0.0247 | 0.002 | 0.0726 | 0.024 | 0.2341 | 0.015 | 0.0212 | 0.001 | 0.0528 | 0.023 | 0.3304 | 0.049 |
| 1248 | 0.2694 | 0.206 | 0.2000 | 0.154 | 0.0649 | 0.252 | 0.3131 | 0.040 | 0.0566 | 0.026 | 0.2862 | 0.128 | 0.3872 | 0.287 |
| 3231 | 0.0633 | 0.006 | 0.0122 | 0.007 | 0.0022 | 0.001 | 0.0152 | 0.005 | ||||||
| XJ-1//C | XJ-1⊥C | XJ-2//C | XJ-2⊥C | BX//C | BX⊥C | NF | ||||||||
|---|---|---|---|---|---|---|---|---|---|---|---|---|---|---|
| Shift (cm−1) | Intensity | FWHM | Intensity | FWHM | Intensity | FWHM | Intensity | FWHM | Intensity | FWHM | Intensity | FWHM | Intensity | FWHM |
| 1243 | 174.872 | 88.516 | 114.567 | 66.595 | 230.673 | 70.238 | 382.072 | 69.447 | 184.364 | 194.734 | 1161.451 | 85.750 | 226.127 | 4.052 |
| 3598 | 1769.940 | 66.976 | 1486.210 | 99.910 | 2749.440 | 146.693 | 945.105 | 35.649 | 850.065 | 49.907 | 1678.470 | 39.167 | 2607.280 | 919.442 |
| 3609 | 7288.890 | 5795.524 | 5365.190 | 4085.822 | 8139.720 | 5725.512 | 5679.880 | 1739.932 | 5905.450 | 3257.087 | 5677.110 | 1524.773 | 3781.540 | 1479.543 |
| XJ-1-1 | XJ-1-2 | XJ-1-3 | XJ-1-4 | XJ-1-5 | XJ-1-6 | XJ-1-7 | XJ-1-8 | XJ-1-9 | XJ-1-10 | XJ-2-1 | XJ-2-2 | XJ-2-3 | XJ-2-4 | XJ-2-5 | XJ-2-6 | |
| SiO2 | 63.19 | 63.77 | 63.52 | 62.87 | 62.65 | 63.26 | 62.81 | 63.07 | 62.64 | 62.92 | 65.76 | 65.88 | 65.76 | 66.40 | 65.96 | 65.71 |
| Na2O | 0.49 | 0.61 | 0.43 | 0.48 | 0.64 | 0.46 | 0.45 | 0.47 | 0.53 | 0.46 | 0.46 | 0.42 | 0.39 | 0.34 | 0.35 | 0.33 |
| K2O | 0.03 | 0.03 | 0.01 | 0.03 | 0.04 | 0.02 | 0.02 | 0.00 | 0.02 | bdl | 0.03 | 0.01 | 0.02 | 0.01 | 0.01 | 0.00 |
| Cr2O3 | bdl | 0.05 | bdl | bdl | 0.04 | 0.04 | 0.01 | bdl | 0.03 | 0.06 | bdl | 0.03 | 0.01 | bdl | 0.03 | bdl |
| Al2O3 | 18.65 | 18.51 | 19.42 | 19.39 | 18.80 | 19.19 | 19.60 | 19.75 | 19.87 | 20.08 | 17.87 | 18.05 | 18.24 | 18.39 | 18.16 | 18.15 |
| MgO | 0.17 | 0.24 | 0.04 | 0.11 | 0.26 | 0.10 | 0.05 | 0.02 | 0.04 | 0.08 | 0.08 | 0.06 | 0.03 | 0.05 | 0.04 | 0.01 |
| CaO | 0.01 | 0.02 | 0.01 | 0.00 | 0.00 | 0.02 | 0.02 | 0.01 | 0.02 | bdl | 0.00 | 0.01 | 0.01 | 0.07 | 0.01 | bdl |
| MnO | bdl | 0.06 | bdl | bdl | 0.04 | 0.00 | 0.01 | 0.05 | bdl | 0.03 | bdl | bdl | 0.07 | 0.01 | bdl | 0.02 |
| P2O5 | 0.04 | bdl | 0.02 | bdl | 0.00 | 0.05 | bdl | bdl | 0.03 | bdl | bdl | 0.01 | 0.03 | 0.01 | bdl | 0.01 |
| FeO | 0.57 | 0.95 | 0.58 | 0.73 | 0.82 | 0.63 | 0.55 | 0.56 | 0.45 | 0.41 | 0.53 | 0.57 | 0.59 | 0.48 | 0.45 | 0.50 |
| TiO2 | bdl | bdl | bdl | bdl | bdl | bdl | 0.09 | 0.01 | bdl | bdl | bdl | 0.03 | 0.01 | 0.04 | 0.01 | 0.02 |
| NiO | 0.04 | 0.04 | 0.18 | 0.03 | 0.03 | 0.13 | 0.07 | bdl | 0.04 | 0.10 | bdl | bdl | bdl | 0.01 | bdl | 0.05 |
| Li2O | 0.14 | 0.14 | 0.14 | 0.14 | 0.16 | 0.13 | 0.14 | 0.13 | 0.13 | 0.13 | 0.02 | 0.02 | 0.02 | 0.02 | 0.02 | 0.03 |
| BeO * | 13.13 | 13.25 | 13.28 | 13.18 | 13.07 | 13.24 | 13.19 | 13.26 | 13.20 | 13.27 | 13.62 | 13.67 | 13.68 | 13.80 | 13.68 | 13.64 |
| Total | 96.44 | 97.66 | 97.62 | 96.95 | 96.54 | 97.27 | 97.00 | 97.32 | 96.99 | 97.53 | 98.38 | 98.75 | 98.85 | 99.62 | 98.73 | 98.47 |
| cation (apfu) | ||||||||||||||||
| Si | 5.909 | 5.908 | 5.872 | 5.857 | 5.872 | 5.872 | 5.845 | 5.847 | 5.827 | 5.821 | 6.011 | 6.000 | 5.986 | 5.992 | 6.003 | 5.998 |
| Na | 0.089 | 0.110 | 0.076 | 0.086 | 0.116 | 0.083 | 0.082 | 0.085 | 0.096 | 0.082 | 0.082 | 0.074 | 0.068 | 0.060 | 0.062 | 0.058 |
| K | 0.003 | 0.003 | 0.002 | 0.003 | 0.005 | 0.002 | 0.002 | 0.000 | 0.002 | 0.000 | 0.003 | 0.001 | 0.002 | 0.001 | 0.002 | 0.000 |
| Cr | 0.000 | 0.003 | 0.000 | 0.000 | 0.003 | 0.003 | 0.000 | 0.000 | 0.002 | 0.004 | 0.000 | 0.002 | 0.001 | 0.000 | 0.002 | 0.000 |
| Al | 2.055 | 2.021 | 2.115 | 2.128 | 2.077 | 2.100 | 2.149 | 2.157 | 2.178 | 2.189 | 1.925 | 1.938 | 1.957 | 1.956 | 1.948 | 1.952 |
| Mg | 0.023 | 0.033 | 0.006 | 0.016 | 0.036 | 0.014 | 0.007 | 0.003 | 0.006 | 0.011 | 0.011 | 0.008 | 0.004 | 0.007 | 0.005 | 0.002 |
| Ca | 0.001 | 0.002 | 0.001 | 0.000 | 0.000 | 0.002 | 0.002 | 0.000 | 0.002 | 0.000 | 0.000 | 0.001 | 0.001 | 0.007 | 0.001 | 0.000 |
| Mn | 0.000 | 0.004 | 0.000 | 0.000 | 0.003 | 0.000 | 0.001 | 0.004 | 0.000 | 0.002 | 0.000 | 0.000 | 0.005 | 0.000 | 0.000 | 0.002 |
| P | 0.003 | 0.000 | 0.001 | 0.000 | 0.000 | 0.004 | 0.000 | 0.000 | 0.002 | 0.000 | 0.000 | 0.001 | 0.002 | 0.001 | 0.000 | 0.001 |
| Fe | 0.044 | 0.074 | 0.045 | 0.057 | 0.065 | 0.049 | 0.043 | 0.043 | 0.035 | 0.032 | 0.041 | 0.044 | 0.045 | 0.036 | 0.034 | 0.038 |
| Ti | 0.000 | 0.000 | 0.000 | 0.000 | 0.000 | 0.000 | 0.007 | 0.001 | 0.000 | 0.000 | 0.000 | 0.002 | 0.000 | 0.002 | 0.000 | 0.002 |
| Ni | 0.003 | 0.003 | 0.014 | 0.002 | 0.002 | 0.010 | 0.005 | 0.000 | 0.003 | 0.007 | 0.000 | 0.000 | 0.000 | 0.001 | 0.000 | 0.004 |
| Li | 0.051 | 0.051 | 0.050 | 0.051 | 0.058 | 0.048 | 0.051 | 0.048 | 0.050 | 0.050 | 0.009 | 0.008 | 0.008 | 0.009 | 0.009 | 0.009 |
| Be | 2.949 | 2.949 | 2.950 | 2.949 | 2.942 | 2.952 | 2.949 | 2.952 | 2.950 | 2.950 | 2.991 | 2.992 | 2.992 | 2.991 | 2.991 | 2.991 |
| XJ-2-7 | XJ-2-8 | XJ-2-9 | XJ-2-10 | XJ-2-11 | XJ-2-12 | XJ-2-13 | XJ-2-14 | XJ-2-15 | MG-1 | MG-2 | MG-3 | MG-4 | MG-5 | MG-6 | MG-7 | |
| SiO2 | 65.82 | 65.42 | 65.81 | 64.99 | 66.00 | 66.06 | 65.34 | 65.97 | 65.58 | 65.48 | 65.09 | 65.37 | 65.73 | 65.43 | 64.97 | 65.36 |
| Na2O | 0.37 | 0.38 | 0.36 | 0.44 | 0.37 | 0.38 | 0.30 | 0.36 | 0.39 | 0.23 | 0.25 | 0.21 | 0.24 | 0.21 | 0.23 | 0.24 |
| K2O | 0.00 | 0.01 | 0.02 | 0.01 | 0.01 | 0.01 | 0.01 | bdl | 0.01 | bdl | 0.02 | 0.01 | 0.00 | 0.01 | 0.01 | 0.00 |
| Cr2O3 | 0.01 | bdl | bdl | bdl | 0.04 | bdl | 0.02 | bdl | bdl | 0.01 | bdl | 0.01 | bdl | bdl | 0.06 | bdl |
| Al2O3 | 18.32 | 17.97 | 18.16 | 17.56 | 18.16 | 18.02 | 18.31 | 18.29 | 18.08 | 17.48 | 17.41 | 17.22 | 17.47 | 17.51 | 17.33 | 17.35 |
| MgO | 0.04 | 0.04 | 0.03 | 0.14 | 0.04 | 0.05 | 0.04 | 0.04 | 0.06 | 0.01 | 0.04 | 0.04 | 0.07 | 0.05 | 0.03 | 0.06 |
| CaO | 0.01 | bdl | 0.01 | bdl | 0.02 | 0.00 | bdl | 0.01 | 0.02 | bdl | 0.01 | 0.01 | 0.01 | 0.00 | 0.00 | bdl |
| MnO | bdl | 0.03 | 0.01 | bdl | 0.03 | bdl | 0.02 | 0.01 | 0.00 | 0.04 | bdl | 0.03 | 0.01 | 0.01 | bdl | bdl |
| P2O5 | bdl | 0.03 | 0.01 | 0.00 | bdl | 0.02 | bdl | 0.01 | 0.00 | bdl | 0.02 | bdl | 0.01 | 0.01 | 0.01 | 0.01 |
| FeO | 0.43 | 0.47 | 0.41 | 0.64 | 0.50 | 0.35 | 0.44 | 0.47 | 0.57 | 1.02 | 1.04 | 0.90 | 1.02 | 0.94 | 1.00 | 1.02 |
| TiO2 | bdl | bdl | 0.03 | 0.04 | bdl | 0.04 | 0.02 | bdl | 0.01 | bdl | 0.01 | 0.00 | 0.01 | 0.02 | 0.02 | bdl |
| NiO | bdl | bdl | bdl | 0.03 | 0.01 | bdl | bdl | bdl | 0.01 | 0.06 | 0.01 | bdl | bdl | 0.02 | 0.01 | bdl |
| Li2O | 0.02 | 0.02 | 0.02 | 0.02 | 0.02 | 0.03 | 0.02 | 0.02 | 0.02 | 0.03 | 0.03 | 0.03 | 0.03 | 0.03 | 0.03 | 0.03 |
| BeO * | 13.68 | 13.57 | 13.66 | 13.46 | 13.70 | 13.68 | 13.60 | 13.70 | 13.62 | 13.52 | 13.45 | 13.45 | 13.57 | 13.51 | 13.41 | 13.48 |
| Total | 98.72 | 97.94 | 98.52 | 97.34 | 98.91 | 98.63 | 98.13 | 98.87 | 98.35 | 97.89 | 97.36 | 97.28 | 98.17 | 97.76 | 97.11 | 97.55 |
| cation (apfu) | ||||||||||||||||
| Si | 5.991 | 6.003 | 6.001 | 6.009 | 6.000 | 6.014 | 5.984 | 5.996 | 5.996 | 6.026 | 6.022 | 6.046 | 6.029 | 6.025 | 6.025 | 6.033 |
| Na | 0.066 | 0.068 | 0.064 | 0.079 | 0.066 | 0.068 | 0.054 | 0.063 | 0.069 | 0.041 | 0.044 | 0.037 | 0.043 | 0.038 | 0.041 | 0.043 |
| K | 0.000 | 0.002 | 0.002 | 0.001 | 0.002 | 0.002 | 0.001 | 0.000 | 0.001 | 0.000 | 0.002 | 0.001 | 0.000 | 0.002 | 0.001 | 0.000 |
| Cr | 0.001 | 0.000 | 0.000 | 0.000 | 0.003 | 0.000 | 0.001 | 0.000 | 0.000 | 0.001 | 0.000 | 0.001 | 0.000 | 0.000 | 0.004 | 0.000 |
| Al | 1.965 | 1.943 | 1.951 | 1.914 | 1.945 | 1.933 | 1.976 | 1.959 | 1.948 | 1.896 | 1.898 | 1.877 | 1.889 | 1.900 | 1.894 | 1.887 |
| Mg | 0.006 | 0.006 | 0.005 | 0.019 | 0.006 | 0.007 | 0.005 | 0.005 | 0.008 | 0.002 | 0.005 | 0.006 | 0.010 | 0.007 | 0.004 | 0.008 |
| Ca | 0.001 | 0.000 | 0.001 | 0.000 | 0.002 | 0.000 | 0.000 | 0.000 | 0.001 | 0.000 | 0.001 | 0.001 | 0.001 | 0.000 | 0.000 | 0.000 |
| Mn | 0.000 | 0.002 | 0.000 | 0.000 | 0.002 | 0.000 | 0.001 | 0.001 | 0.000 | 0.003 | 0.000 | 0.002 | 0.001 | 0.000 | 0.000 | 0.000 |
| P | 0.000 | 0.002 | 0.001 | 0.000 | 0.000 | 0.001 | 0.000 | 0.001 | 0.000 | 0.000 | 0.001 | 0.000 | 0.001 | 0.000 | 0.000 | 0.001 |
| Fe | 0.033 | 0.036 | 0.031 | 0.049 | 0.038 | 0.026 | 0.033 | 0.036 | 0.043 | 0.078 | 0.081 | 0.069 | 0.078 | 0.072 | 0.078 | 0.079 |
| Ti | 0.000 | 0.000 | 0.002 | 0.003 | 0.000 | 0.003 | 0.002 | 0.000 | 0.000 | 0.000 | 0.001 | 0.000 | 0.000 | 0.002 | 0.002 | 0.000 |
| Ni | 0.000 | 0.000 | 0.000 | 0.002 | 0.001 | 0.000 | 0.000 | 0.000 | 0.000 | 0.004 | 0.000 | 0.000 | 0.000 | 0.002 | 0.001 | 0.000 |
| Li | 0.009 | 0.009 | 0.009 | 0.010 | 0.009 | 0.009 | 0.009 | 0.009 | 0.009 | 0.011 | 0.011 | 0.013 | 0.011 | 0.012 | 0.013 | 0.012 |
| Be | 2.991 | 2.991 | 2.991 | 2.990 | 2.991 | 2.991 | 2.991 | 2.991 | 2.991 | 2.989 | 2.989 | 2.987 | 2.989 | 2.988 | 2.987 | 2.988 |
| MG-8 | MG-9 | MG-10 | MG-11 | MG-12 | MG-13 | NA-1 | NA-2 | NA-3 | NA-4 | NA-5 | NA-6 | NA-7 | NA-8 | NA-9 | NA-10 | |
| SiO2 | 65.33 | 65.29 | 65.58 | 65.44 | 64.58 | 65.56 | 62.51 | 62.64 | 61.65 | 61.54 | 61.54 | 61.96 | 61.55 | 62.50 | 61.14 | 61.59 |
| Na2O | 0.21 | 0.25 | 0.27 | 0.26 | 0.31 | 0.27 | 1.27 | 1.16 | 1.30 | 1.63 | 1.30 | 1.30 | 1.31 | 1.16 | 1.15 | 1.23 |
| K2O | 0.01 | 0.01 | 0.01 | bdl | 0.01 | 0.01 | 0.08 | 0.09 | 0.09 | 0.17 | 0.07 | 0.08 | 0.09 | 0.05 | 0.12 | 0.08 |
| Cr2O3 | bdl | 0.02 | bdl | 0.02 | 0.13 | 0.11 | bdl | 0.01 | 0.00 | bdl | bdl | bdl | 0.01 | 0.05 | 0.01 | bdl |
| Al2O3 | 17.30 | 17.34 | 17.38 | 17.47 | 17.28 | 17.37 | 17.07 | 17.21 | 17.17 | 17.36 | 17.42 | 17.04 | 17.50 | 17.63 | 17.49 | 17.76 |
| MgO | 0.03 | 0.01 | 0.02 | 0.02 | 0.10 | 0.05 | 1.09 | 1.04 | 1.09 | 1.07 | 1.11 | 1.00 | 1.09 | 1.12 | 1.09 | 1.10 |
| CaO | 0.01 | bdl | bdl | 0.00 | 0.08 | bdl | 0.00 | bdl | 0.00 | 0.02 | 0.01 | 0.01 | bdl | 0.02 | 0.03 | 0.01 |
| MnO | 0.02 | 0.04 | 0.02 | 0.02 | 0.01 | bdl | 0.04 | 0.01 | 0.04 | 0.03 | 0.02 | 0.03 | 0.09 | 0.01 | 0.05 | 0.07 |
| P2O5 | 0.01 | bdl | bdl | 0.01 | bdl | bdl | 0.01 | bdl | bdl | 0.04 | bdl | 0.02 | 0.01 | 0.02 | bdl | 0.03 |
| FeO | 1.11 | 0.91 | 0.92 | 1.17 | 1.02 | 1.04 | 2.17 | 2.16 | 2.09 | 2.11 | 2.20 | 2.10 | 2.11 | 1.88 | 2.13 | 2.16 |
| TiO2 | bdl | 0.03 | 0.00 | 0.02 | bdl | 0.05 | 0.05 | 0.00 | bdl | bdl | 0.01 | 0.01 | bdl | 0.01 | 0.01 | bdl |
| NiO | bdl | 0.03 | 0.01 | 0.01 | 0.00 | 0.04 | 0.02 | 0.00 | 0.09 | 0.04 | 0.02 | bdl | bdl | 0.01 | 0.05 | 0.00 |
| Li2O | 0.03 | 0.03 | 0.03 | 0.03 | 0.03 | 0.03 | 0.12 | 0.12 | 0.12 | 0.12 | 0.12 | 0.12 | 0.11 | 0.12 | 0.12 | 0.12 |
| BeO * | 13.47 | 13.47 | 13.52 | 13.53 | 13.37 | 13.54 | 13.10 | 13.12 | 12.98 | 13.02 | 12.99 | 13.00 | 13.02 | 13.16 | 12.93 | 13.04 |
| Total | 97.52 | 97.43 | 97.76 | 98.00 | 96.93 | 98.06 | 97.54 | 97.57 | 96.62 | 97.14 | 96.81 | 96.67 | 96.89 | 97.74 | 96.30 | 97.20 |
| cation (apfu) | ||||||||||||||||
| Si | 6.034 | 6.033 | 6.038 | 6.019 | 6.009 | 6.025 | 5.867 | 5.872 | 5.845 | 5.816 | 5.824 | 5.865 | 5.820 | 5.842 | 5.816 | 5.805 |
| Na | 0.037 | 0.044 | 0.048 | 0.045 | 0.056 | 0.048 | 0.232 | 0.210 | 0.239 | 0.299 | 0.238 | 0.239 | 0.240 | 0.209 | 0.213 | 0.224 |
| K | 0.001 | 0.001 | 0.001 | 0.000 | 0.001 | 0.001 | 0.010 | 0.010 | 0.011 | 0.020 | 0.009 | 0.010 | 0.011 | 0.006 | 0.015 | 0.010 |
| Cr | 0.000 | 0.002 | 0.000 | 0.002 | 0.010 | 0.008 | 0.000 | 0.001 | 0.000 | 0.000 | 0.000 | 0.000 | 0.001 | 0.004 | 0.001 | 0.000 |
| Al | 1.883 | 1.889 | 1.885 | 1.894 | 1.895 | 1.881 | 1.888 | 1.901 | 1.918 | 1.933 | 1.943 | 1.901 | 1.951 | 1.942 | 1.960 | 1.973 |
| Mg | 0.004 | 0.002 | 0.003 | 0.003 | 0.014 | 0.006 | 0.153 | 0.145 | 0.154 | 0.150 | 0.157 | 0.141 | 0.154 | 0.156 | 0.155 | 0.155 |
| Ca | 0.001 | 0.000 | 0.000 | 0.000 | 0.007 | 0.000 | 0.000 | 0.000 | 0.000 | 0.002 | 0.001 | 0.001 | 0.000 | 0.002 | 0.003 | 0.001 |
| Mn | 0.001 | 0.003 | 0.002 | 0.002 | 0.001 | 0.000 | 0.003 | 0.001 | 0.003 | 0.002 | 0.002 | 0.003 | 0.008 | 0.001 | 0.004 | 0.005 |
| P | 0.001 | 0.000 | 0.000 | 0.001 | 0.000 | 0.000 | 0.001 | 0.000 | 0.000 | 0.003 | 0.000 | 0.002 | 0.001 | 0.002 | 0.000 | 0.002 |
| Fe | 0.086 | 0.070 | 0.071 | 0.090 | 0.080 | 0.080 | 0.170 | 0.169 | 0.166 | 0.166 | 0.174 | 0.166 | 0.167 | 0.147 | 0.169 | 0.170 |
| Ti | 0.000 | 0.002 | 0.000 | 0.001 | 0.000 | 0.004 | 0.003 | 0.000 | 0.000 | 0.000 | 0.001 | 0.000 | 0.000 | 0.001 | 0.001 | 0.000 |
| Ni | 0.000 | 0.002 | 0.000 | 0.001 | 0.000 | 0.003 | 0.002 | 0.000 | 0.007 | 0.003 | 0.002 | 0.000 | 0.000 | 0.001 | 0.004 | 0.000 |
| Li | 0.012 | 0.011 | 0.010 | 0.011 | 0.012 | 0.011 | 0.046 | 0.045 | 0.044 | 0.044 | 0.047 | 0.045 | 0.043 | 0.045 | 0.044 | 0.047 |
| Be | 2.988 | 2.989 | 2.990 | 2.989 | 2.988 | 2.989 | 2.954 | 2.955 | 2.956 | 2.956 | 2.953 | 2.955 | 2.957 | 2.955 | 2.956 | 2.953 |
| XJ-1-1 | XJ-1-2 | XJ-1-3 | XJ-1-4 | XJ-1-5 | XJ-1-6 | XJ-1-7 | XJ-1-8 | XJ-2-1 | XJ-2-2 | XJ-2-3 | XJ-2-4 | XJ-2-5 | XJ-2-6 | XJ-2-7 | XJ-2-8 | XJ-2-9 | ||
| Li | 630 | 641 | 630 | 631 | 721 | 598 | 639 | 596 | 112 | 106 | 108 | 113 | 112 | 117 | 114 | 112 | 110 | |
| Na | 2948 | 3002 | 2890 | 2840 | 3327 | 2851 | 3470 | 2807 | 1768 | 1738 | 1770 | 1742 | 1634 | 1689 | 1688 | 1680 | 1815 | |
| Mg | 407 | 440 | 380 | 378 | 523 | 492 | 869 | 441 | 612 | 582 | 609 | 590 | 536 | 580 | 578 | 580 | 646 | |
| K | 78.9 | 90.7 | 77.5 | 97.8 | 107 | 90.8 | 113.1 | 84.3 | 90.1 | 87.5 | 71.2 | 75.2 | 67.7 | 96.0 | 70.8 | 74.5 | 81.7 | |
| Sc | bdl | 0.43 | 0.28 | bdl | 0.30 | 0.57 | 1.36 | 0.31 | 0.93 | 0.96 | 0.70 | 0.89 | 0.69 | 0.87 | 0.77 | 0.92 | 0.87 | |
| Ti | 79.2 | 71.2 | 71.8 | 66.7 | 63.1 | 70.6 | 73.9 | 68.7 | 67.7 | 61.3 | 66.9 | 64.2 | 63.5 | 66.3 | 69.5 | 70.1 | 70.1 | |
| V | 2.27 | 2.51 | 2.16 | 2.25 | 2.26 | 2.48 | 8.01 | 1.32 | 1.45 | 1.42 | 1.39 | 1.44 | 1.11 | 1.44 | 1.22 | 1.29 | 1.53 | |
| Mn | 36.6 | 36.6 | 35.9 | 35.8 | 32.3 | 37.0 | 44.3 | 28.8 | 73.9 | 70.9 | 68.4 | 70.3 | 62.2 | 61.1 | 58.9 | 65.6 | 72.2 | |
| Fe | 4492 | 4751 | 4550 | 4655 | 4159 | 4535 | 5782 | 3907 | 5805 | 5774 | 5723 | 5698 | 5293 | 5388 | 5401 | 5472 | 5985 | |
| Zn | 371 | 370 | 360 | 375 | 346 | 373 | 356 | 348 | 201 | 202 | 199 | 204 | 201 | 202 | 201 | 199 | 202 | |
| Rb | 33.3 | 35.9 | 30.3 | 35.7 | 33.3 | 34.4 | 41.4 | 30.4 | 22.5 | 23.1 | 21.8 | 21.7 | 20.7 | 21.6 | 20.2 | 21.6 | 22.4 | |
| Cs | 2623 | 2989 | 2593 | 2969 | 2278 | 2683 | 4000 | 1562 | 427 | 424 | 404 | 412 | 357 | 378 | 377 | 366 | 468 | |
| cation (apfu) | ||||||||||||||||||
| Li | 0.052 | 0.052 | 0.052 | 0.052 | 0.060 | 0.049 | 0.053 | 0.049 | 0.009 | 0.008 | 0.008 | 0.009 | 0.009 | 0.009 | 0.009 | 0.009 | 0.009 | |
| Na | 0.073 | 0.074 | 0.071 | 0.071 | 0.083 | 0.071 | 0.087 | 0.070 | 0.042 | 0.041 | 0.042 | 0.041 | 0.039 | 0.040 | 0.040 | 0.040 | 0.043 | |
| Mg | 0.010 | 0.010 | 0.009 | 0.009 | 0.012 | 0.012 | 0.021 | 0.010 | 0.014 | 0.013 | 0.014 | 0.013 | 0.012 | 0.013 | 0.013 | 0.013 | 0.015 | |
| K | 0.001 | 0.001 | 0.001 | 0.001 | 0.002 | 0.001 | 0.002 | 0.001 | 0.001 | 0.001 | 0.001 | 0.001 | 0.001 | 0.001 | 0.001 | 0.001 | 0.001 | |
| Sc | - | 0.000 | 0.000 | - | 0.000 | 0.000 | 0.000 | 0.000 | 0.000 | 0.000 | 0.000 | 0.000 | 0.000 | 0.000 | 0.000 | 0.000 | 0.000 | |
| Ti | 0.001 | 0.001 | 0.001 | 0.001 | 0.001 | 0.001 | 0.001 | 0.001 | 0.001 | 0.001 | 0.001 | 0.001 | 0.001 | 0.001 | 0.001 | 0.001 | 0.001 | |
| V | 0.000 | 0.000 | 0.000 | 0.000 | 0.000 | 0.000 | 0.000 | 0.000 | 0.000 | 0.000 | 0.000 | 0.000 | 0.000 | 0.000 | 0.000 | 0.000 | 0.000 | |
| Mn | 0.000 | 0.000 | 0.000 | 0.000 | 0.000 | 0.000 | 0.000 | 0.000 | 0.001 | 0.001 | 0.001 | 0.001 | 0.001 | 0.001 | 0.001 | 0.001 | 0.001 | |
| Fe | 0.046 | 0.048 | 0.046 | 0.048 | 0.043 | 0.046 | 0.059 | 0.040 | 0.057 | 0.057 | 0.056 | 0.055 | 0.052 | 0.053 | 0.053 | 0.054 | 0.059 | |
| Zn | 0.003 | 0.003 | 0.003 | 0.003 | 0.003 | 0.003 | 0.003 | 0.003 | 0.002 | 0.002 | 0.002 | 0.002 | 0.002 | 0.002 | 0.002 | 0.002 | 0.002 | |
| Rb | 0.000 | 0.000 | 0.000 | 0.000 | 0.000 | 0.000 | 0.000 | 0.000 | 0.000 | 0.000 | 0.000 | 0.000 | 0.000 | 0.000 | 0.000 | 0.000 | 0.000 | |
| Cs | 0.011 | 0.013 | 0.011 | 0.013 | 0.010 | 0.012 | 0.017 | 0.007 | 0.002 | 0.002 | 0.002 | 0.002 | 0.001 | 0.002 | 0.002 | 0.002 | 0.002 | |
| XJ-2-10 | XJ-2-11 | XJ-2-12 | XJ-2-13 | MG-1 | MG-2 | MG-3 | MG-4 | MG-5 | MG-6 | MG-7 | MG-8 | MG-9 | MG-10 | MG-11 | MG-12 | MG-13 | ||
| Li | 119 | 112 | 116 | 109 | 135 | 144 | 158 | 136 | 144 | 161 | 151 | 145 | 137 | 131 | 135 | 147 | 135 | |
| Na | 1828 | 1853 | 1829 | 1732 | 1764.2 | 1778 | 1857 | 1731 | 1779 | 1728 | 1770 | 1905 | 1732 | 1723 | 1735 | 1849 | 1721 | |
| Mg | 631 | 648 | 632 | 600 | 212 | 220 | 222 | 225 | 225 | 221 | 227 | 230 | 228 | 230 | 230 | 230 | 230 | |
| K | 32.2 | 58.3 | 69.5 | 83.8 | 63 | 39.4 | 38.0 | 48.7 | 63.5 | 31.0 | 39.3 | 63.2 | 73.8 | 71.5 | 53.3 | 49.7 | 57.2 | |
| Sc | 1.18 | 0.74 | 1.08 | 0.69 | 3.25 | 3.14 | 3.32 | 3.52 | 3.22 | 3.18 | 3.76 | 3.45 | 3.43 | 3.22 | 3.45 | 3.76 | 3.36 | |
| Ti | 68.9 | 70.5 | 70.3 | 73.1 | 65.8 | 67.9 | 66.3 | 69.4 | 64.6 | 64.4 | 64.4 | 66.7 | 70.9 | 70.8 | 67.5 | 68.5 | 72.8 | |
| V | 1.64 | 1.53 | 1.11 | 1.34 | 7.29 | 7.37 | 7.50 | 7.34 | 7.27 | 7.25 | 7.72 | 7.40 | 7.00 | 7.63 | 7.72 | 7.12 | 7.71 | |
| Mn | 61.0 | 75.8 | 73.0 | 74.2 | 105 | 102 | 95.0 | 107 | 104 | 104 | 111 | 117 | 117 | 119 | 118 | 122 | 120 | |
| Fe | 5529 | 6026 | 5992 | 5826 | 7546 | 7504 | 7457 | 7503 | 7547 | 7204 | 7522 | 7585 | 7575 | 7633 | 7663 | 7649 | 7634 | |
| Zn | 191 | 206 | 199 | 207 | 87.6 | 85.3 | 84.9 | 86.0 | 85.1 | 82.1 | 89.7 | 87.0 | 90.5 | 86.0 | 89.2 | 88.1 | 89.1 | |
| Rb | 18.2 | 21.2 | 20.9 | 21.9 | 43.5 | 39.1 | 29.7 | 42.5 | 42.2 | 29.1 | 39.1 | 42.1 | 43.3 | 42.6 | 38.7 | 42.1 | 43.2 | |
| Cs | 395 | 465 | 464 | 431 | 543 | 555 | 578 | 543 | 555 | 621 | 563 | 556 | 542 | 546 | 546 | 559 | 548 | |
| cation (apfu) | ||||||||||||||||||
| Li | 0.009 | 0.009 | 0.009 | 0.009 | 0.011 | 0.011 | 0.013 | 0.011 | 0.011 | 0.013 | 0.012 | 0.012 | 0.011 | 0.010 | 0.011 | 0.012 | 0.011 | |
| Na | 0.044 | 0.044 | 0.043 | 0.042 | 0.042 | 0.043 | 0.045 | 0.041 | 0.043 | 0.042 | 0.042 | 0.046 | 0.042 | 0.041 | 0.042 | 0.045 | 0.041 | |
| Mg | 0.014 | 0.015 | 0.014 | 0.014 | 0.005 | 0.005 | 0.005 | 0.005 | 0.005 | 0.005 | 0.005 | 0.005 | 0.005 | 0.005 | 0.005 | 0.005 | 0.005 | |
| K | 0.000 | 0.001 | 0.001 | 0.001 | 0.001 | 0.001 | 0.001 | 0.001 | 0.001 | 0.000 | 0.001 | 0.001 | 0.001 | 0.001 | 0.001 | 0.001 | 0.001 | |
| Sc | 0.000 | 0.000 | 0.000 | 0.000 | 0.000 | 0.000 | 0.000 | 0.000 | 0.000 | 0.000 | 0.000 | 0.000 | 0.000 | 0.000 | 0.000 | 0.000 | 0.000 | |
| Ti | 0.001 | 0.001 | 0.001 | 0.001 | 0.001 | 0.001 | 0.001 | 0.001 | 0.001 | 0.001 | 0.001 | 0.001 | 0.001 | 0.001 | 0.001 | 0.001 | 0.001 | |
| V | 0.000 | 0.000 | 0.000 | 0.000 | 0.000 | 0.000 | 0.000 | 0.000 | 0.000 | 0.000 | 0.000 | 0.000 | 0.000 | 0.000 | 0.000 | 0.000 | 0.000 | |
| Mn | 0.001 | 0.001 | 0.001 | 0.001 | 0.001 | 0.001 | 0.001 | 0.001 | 0.001 | 0.001 | 0.001 | 0.001 | 0.001 | 0.001 | 0.001 | 0.001 | 0.001 | |
| Fe | 0.055 | 0.059 | 0.059 | 0.058 | 0.074 | 0.074 | 0.074 | 0.074 | 0.074 | 0.072 | 0.074 | 0.075 | 0.075 | 0.075 | 0.076 | 0.076 | 0.075 | |
| Zn | 0.002 | 0.002 | 0.002 | 0.002 | 0.001 | 0.001 | 0.001 | 0.001 | 0.001 | 0.001 | 0.001 | 0.001 | 0.001 | 0.001 | 0.001 | 0.001 | 0.001 | |
| Rb | 0.000 | 0.000 | 0.000 | 0.000 | 0.000 | 0.000 | 0.000 | 0.000 | 0.000 | 0.000 | 0.000 | 0.000 | 0.000 | 0.000 | 0.000 | 0.000 | 0.000 | |
| Cs | 0.002 | 0.002 | 0.002 | 0.002 | 0.002 | 0.002 | 0.002 | 0.002 | 0.002 | 0.003 | 0.002 | 0.002 | 0.002 | 0.002 | 0.002 | 0.002 | 0.002 | |
| MG-14 | MG-15 | NA-1 | NA-2 | NA-3 | NA-4 | NA-5 | NA-6 | NA-7 | NA-8 | NA-9 | NA-10 | NA-11 | NA-12 | NA-13 | NA-14 | NA-15 | DL | |
| Li | 134 | 139 | 563 | 561 | 540 | 542 | 573 | 548 | 527 | 558 | 537 | 578 | 578 | 538 | 537 | 555 | 564 | 0.4 |
| Na | 1710 | 1796 | 8658 | 8691 | 8469 | 8587 | 8854 | 8731 | 8860 | 8870 | 8855 | 8886 | 8996 | 8850 | 8683 | 8806 | 8832 | 0.4 |
| Mg | 229.4 | 230.2 | 5102 | 5122 | 5099 | 5203 | 5263 | 5181 | 5232 | 5310 | 5210 | 5261 | 5322 | 5303 | 5266 | 5210 | 5265 | 0.06 |
| K | 50.4 | 49.2 | 639 | 641 | 560 | 560.4 | 664 | 644 | 635 | 659 | 633 | 643 | 670 | 658 | 615 | 654 | 649 | 0.15 |
| Sc | 3.80 | 3.40 | 549 | 553 | 539 | 537 | 544 | 550 | 557 | 556 | 542 | 547 | 551 | 555 | 548 | 552 | 574 | 0.2 |
| Ti | 68.1 | 68.4 | 87.8 | 85.2 | 87.8 | 77.3 | 81.1 | 81.2 | 83.9 | 77.0 | 83.4 | 81.6 | 86.8 | 83.1 | 78.5 | 81.0 | 80.1 | 1.3 |
| V | 7.41 | 7.74 | 61.5 | 61.0 | 61.0 | 62.3 | 63.2 | 62.7 | 63.2 | 63.2 | 62.9 | 62.8 | 66.0 | 64.9 | 63.3 | 63.9 | 65.1 | 0.001 |
| Mn | 117 | 119 | 338 | 330 | 332 | 314 | 340 | 342 | 339 | 355 | 294 | 332 | 343 | 349 | 302 | 318 | 320 | 0.01 |
| Fe | 7620 | 7696 | 15,800 | 15,686 | 15,631 | 15,650 | 15,748 | 15,771 | 15,898 | 15,958 | 15,798 | 15,918 | 16,145 | 16,220 | 15,896 | 15,988 | 16,100 | 0.05 |
| Zn | 86.7 | 87.7 | 84.8 | 87.4 | 87.9 | 85.5 | 88.0 | 87.6 | 90.3 | 86.7 | 86.3 | 90.5 | 86.5 | 87.4 | 82.8 | 84.3 | 88.4 | 0.02 |
| Rb | 421.0 | 44.0 | 89.7 | 88.5 | 87.5 | 87.4 | 89.8 | 90.1 | 92.0 | 91.0 | 91.4 | 92.5 | 93.4 | 94.1 | 90.9 | 93.7 | 93.8 | 0.003 |
| Cs | 550 | 549 | 696 | 706 | 692 | 691 | 750 | 712 | 724 | 712 | 716 | 719 | 717 | 716 | 683 | 711 | 718 | 0.001 |
| cation (apfu) | ||||||||||||||||||
| Li | 0.011 | 0.011 | 0.047 | 0.047 | 0.046 | 0.046 | 0.048 | 0.046 | 0.044 | 0.046 | 0.046 | 0.049 | 0.048 | 0.045 | 0.045 | 0.047 | 0.047 | |
| Na | 0.041 | 0.044 | 0.217 | 0.218 | 0.215 | 0.219 | 0.226 | 0.221 | 0.226 | 0.223 | 0.227 | 0.226 | 0.226 | 0.225 | 0.220 | 0.224 | 0.223 | |
| Mg | 0.005 | 0.005 | 0.121 | 0.121 | 0.123 | 0.125 | 0.127 | 0.124 | 0.126 | 0.126 | 0.126 | 0.127 | 0.127 | 0.127 | 0.126 | 0.125 | 0.126 | |
| K | 0.001 | 0.001 | 0.009 | 0.009 | 0.008 | 0.008 | 0.010 | 0.010 | 0.010 | 0.010 | 0.010 | 0.010 | 0.010 | 0.010 | 0.009 | 0.010 | 0.010 | |
| Sc | 0.000 | 0.000 | 0.007 | 0.007 | 0.007 | 0.007 | 0.007 | 0.007 | 0.007 | 0.007 | 0.007 | 0.007 | 0.007 | 0.007 | 0.007 | 0.007 | 0.007 | |
| Ti | 0.001 | 0.001 | 0.001 | 0.001 | 0.001 | 0.001 | 0.001 | 0.001 | 0.001 | 0.001 | 0.001 | 0.001 | 0.001 | 0.001 | 0.001 | 0.001 | 0.001 | |
| V | 0.000 | 0.000 | 0.001 | 0.001 | 0.001 | 0.001 | 0.001 | 0.001 | 0.001 | 0.001 | 0.001 | 0.001 | 0.001 | 0.001 | 0.001 | 0.001 | 0.001 | |
| Mn | 0.001 | 0.001 | 0.004 | 0.003 | 0.004 | 0.003 | 0.004 | 0.004 | 0.004 | 0.004 | 0.003 | 0.004 | 0.004 | 0.004 | 0.003 | 0.003 | 0.003 | |
| Fe | 0.076 | 0.077 | 0.163 | 0.162 | 0.164 | 0.164 | 0.165 | 0.164 | 0.167 | 0.165 | 0.167 | 0.167 | 0.167 | 0.169 | 0.166 | 0.167 | 0.167 | |
| Zn | 0.001 | 0.001 | 0.001 | 0.001 | 0.001 | 0.001 | 0.001 | 0.001 | 0.001 | 0.001 | 0.001 | 0.001 | 0.001 | 0.001 | 0.001 | 0.001 | 0.001 | |
| Rb | 0.000 | 0.000 | 0.001 | 0.001 | 0.001 | 0.001 | 0.001 | 0.001 | 0.001 | 0.001 | 0.001 | 0.001 | 0.001 | 0.001 | 0.001 | 0.001 | 0.001 | |
| Cs | 0.002 | 0.002 | 0.003 | 0.003 | 0.003 | 0.003 | 0.003 | 0.003 | 0.003 | 0.003 | 0.003 | 0.003 | 0.003 | 0.003 | 0.003 | 0.003 | 0.003 | |
References
- Daneshvar, N.; Azizi, H.; Asahara, Y.; Tsuboi, M.; Minami, M.; Mohammad, Y.O. Geochemistry and Genesis of Beryl Crystals in the LCT Pegmatite Type, Ebrahim-Attar Mountain, Western Iran. Minerals 2021, 11, 717. [Google Scholar] [CrossRef]
- Wang, P.; Gray, T.P.; Li, Z.; Anderson, E.J.D.; Allaz, J.; Smyth, J.R.; Koenig, A.E.; Qi, L.j.; Zhou, Y.; Raschke, M.B. Mineralogical classification and crystal water characterisation of beryl from the W–Sn–Be occurrence of Xuebaoding, Sichuan province, western China. Mineral. Mag. 2021, 85, 172–188. [Google Scholar] [CrossRef]
- Černý, P. Mineralogy of Beryllium in Granitic Pegmatites. Rev. Mineral. Geochem. 2002, 50, 405–444. [Google Scholar] [CrossRef]
- Aurisicchio, C.; Fioravanti, G.; Grubessi, O.; Zanazzi, P.F. Reappraisal of the crystal chemistry of beryl. Am. Miner. 1988, 73, 826–837. [Google Scholar]
- Wood, D.L.; Nassau, K. Infrared Spectra of Foreign Molecules in Beryl. J. Chem. Phys. 1967, 47, 2220–2228. [Google Scholar] [CrossRef]
- Yu, X.Y. Colored Gemmology, 2nd ed.; Geological Publishing House: Beijing, China, 2019; pp. 150–151. [Google Scholar]
- Shen, J.Q.; Hu, Z.K.; Cui, S.Y.; Zhang, Y.F.; Li, E.Q.; Liang, W.; Xu, B. A Study on Beryl in the Cuonadong Be-W-Sn Polymetallic Deposit, Longzi County, Tibet, China. Crystals 2021, 11, 777. [Google Scholar] [CrossRef]
- Bhandari, S.; Qin, K.; Zhou, Q.; Evans, N.J. Geological, Mineralogical and Geochemical Study of the Aquamarine-Bearing Yamrang Pegmatite, Eastern Nepal with Implications for Exploration Targeting. Minerals 2022, 12, 564. [Google Scholar] [CrossRef]
- Hoyer, I.d.S.; Souza, V.d.S.; Debowski, B.P. Aquamarine from Massangana batholith, Rondônia State: Mineral chemistry and fluid inclusion data. REM-Int. Eng. J. 2020, 73, 319–327. [Google Scholar] [CrossRef]
- Groat, L.A.; Giuliani, G.; Stone-Sundberg, J.; Sun, Z.; Renfro, N.D.; Palke, A.C. A Review of Analytical Methods Used in Geographic Origin Determination of Gemstones. Gems Gemol. 2019, 55, 512–535. [Google Scholar] [CrossRef]
- Xu, B.; Hou, Z.-Q.; Griffin, W.L.; Lu, Y.; Belousova, E.; Xu, J.-F.; O’Reilly, S.Y. Recycled volatiles determine fertility of porphyry deposits in collisional settings. Am. Mineral. 2021, 106, 656–661. [Google Scholar] [CrossRef]
- Xu, B.; Hou, Z.-Q.; Griffin, W.L.; O’Reilly, S.Y.; Zheng, Y.-C.; Wang, T.; Bin, F.; Xu, J.-F. In-situ mineralogical interpretation of the mantle geophysical signature of the Gangdese Cu-porphyry mineral system. Gondwana Res. 2022, 111, 53–63. [Google Scholar] [CrossRef]
- Xu, B.; Hou, Z.-Q.; Griffin, W.L.; Zheng, Y.-C.; Wang, T.; Guo, Z.; Hou, J.; Santosh, M.; O’Reilly, S.Y. Cenozoic lithospheric architecture and metallogenesis in Southeastern Tibet. Earth-Sci. Rev. 2021, 214, 103472. [Google Scholar] [CrossRef]
- Xu, B.; Hou, Z.-Q.; Griffin, W.L.; Yu, J.-X.; Long, T.; Zhao, Y.; Wang, T.; Fu, B.; Belousova, E.; O’Reilly, S.Y. Apatite halogens and Sr-O and zircon Hf-O isotopes: Recycled volatiles in Jurassic porphyry ore systems in southern Tibet. Chem. Geol. 2022, 605, 120924. [Google Scholar] [CrossRef]
- Xu, B.; Griffin, W.L.; Xiong, Q.; Hou, Z.-Q.; O’Reilly, S.Y.; Guo, Z.; Pearson, N.J.; Gréau, Y.; Yang, Z.-M.; Zheng, Y.-C. Ultrapotassic rocks and xenoliths from South Tibet: Contrasting styles of interaction between lithospheric mantle and asthenosphere during continental collision. Geology 2017, 45, 51–54. [Google Scholar] [CrossRef]
- Saeseaw, S.; Renfro, N.D.; Palke, A.C.; Sun, Z.; McClure, S.F. Geographic Origin Determination of Emerald. Gems Gemol. 2019, 55, 614–646. [Google Scholar] [CrossRef]
- Palke, A.C.; Saeseaw, S.; Renfro, N.D.; Sun, Z.; McClure, S.F. Geographic Origin Determination of Ruby. Gems Gemol. 2019, 55, 580–613. [Google Scholar] [CrossRef]
- Palke, A.C.; Saeseaw, S.; Renfro, N.D.; Sun, Z.; McClure, S.F. Geographic Origin Determination of Blue Sapphire. Gems Gemol. 2019, 55, 536–579. [Google Scholar] [CrossRef]
- Fukuda, J.; Shinoda, K. Water molecules in beryl and cordierite: High-temperature vibrational behavior, dehydration, and coordination to cations. Phys. Chem. Miner. 2011, 38, 469–481. [Google Scholar] [CrossRef]
- Hu, Y.; Lu, R. Color Characteristics of Blue to Yellow Beryl from Multiple Origins. Gems Gemol. 2020, 56, 54–65. [Google Scholar] [CrossRef]
- Zhou, Q.; Qin, K.; Tang, D.; Wang, C.; Tian, Y.; Sakyi, P.A. Mineralogy of the Koktokay No. 3 pegmatite, Altai, NW China: Implications for evolution and melt–fluid processes of rare-metal pegmatites. Eur. J. Mineral. 2015, 27, 433–457. [Google Scholar] [CrossRef]
- Pedrosa-Soares, A.C.; De Campos, C.P.; Noce, C.; Silva, L.C.; Novo, T.; Roncato, J.; Medeiros, S.; Castañeda, C.; Queiroga, G.; Dantas, E.; et al. Late Neoproterozoic-Cambrian granitic magmatism in the Araçuaí orogen (Brazil), the Eastern Brazilian Pegmatite Province and related mineral resources. Geol. Soc. Lond. Spec. Publ. 2022, 350, 25–51. [Google Scholar] [CrossRef]
- Ballouard, C.; Elburg, M.A.; Tappe, S.; Reinke, C.; Ueckermann, H.; Doggart, S. Magmatic-hydrothermal evolution of rare metal pegmatites from the Mesoproterozoic Orange River pegmatite belt (Namaqualand, South Africa). Ore Geol. Rev. 2020, 116, 103252. [Google Scholar] [CrossRef]
- Wen, L.; Liang, W.X.; Zhang, Z.G.; Huang, J.C. The Infrared Spectroscopy of Minerals; Chongqing University Press: Chongqing, China, 1988; pp. 79–81. [Google Scholar]
- Aurisicchio, C.; Grubessi, O.; Zecchini, P. Infrared spectroscopy and crystal chemistry of the beryl group. Can. Mineral. 1994, 32, 55–68. [Google Scholar]
- Zhou, K.C.; Qi, L.J.; Xiang, C.J. Study on gemology of beryl gem from Pingwu Sichuan and mechanism of irradiation inducing coloration. China Min. Mag. 2005, 14, 30–32. [Google Scholar]
- Jehlička, J.; Culka, A.; Bersani, D.; Vandenabeele, P. Comparison of seven portable Raman spectrometers: Beryl as a case study. J. Raman Spectrosc. 2017, 48, 1289–1299. [Google Scholar] [CrossRef]
- Pisutha-Arnond, V.; Atichat, W.; Nhung, N.T.; Khoi, N.N.; Häger, T.; Hofmeister, W.; Huong, L.T.-T. Aquamarine from the Thuong Xuan District, Thanh Hoa Province, Vietnam. Gems Gemol. 2011, 47, 42–48. [Google Scholar] [CrossRef]
- Sardi, F.G.; Heimann, A. Pegmatitic Beryl as Indicator of Melt Evolution: Example from the Velasco District, Pampeana Pegmatite Province, Argentina, and Review of Worldwide Occurrences. Can. Mineral. 2014, 52, 809–836. [Google Scholar] [CrossRef]
- Hamis, A.; Kesraoui, M.; Boutaleb, A.; Fuchs, Y.; Marignac, C. Beryl occurrences in the granitic complex of Guerioune, Laouni, Southeastern Algeria: Electron microprobe, infrared spectroscopy, and fluid inclusions data. Arab. J. Geosci. 2021, 14, 357. [Google Scholar] [CrossRef]
- Borzenko, A.A.; Yurgenson, G.A. Scandium, Yttrium and Lanthanids in the Beryl of the Sherlovaya Gora Deposit. In Minerals: Structure, Properties, Methods of Investigation. Springer Proceedings in Earth and Environmental Sciences; Springer: Cham, Switzerland, 2020; pp. 37–42. [Google Scholar] [CrossRef]
- Rossman, G.R. Color in Gems: The New Technologies. Gems Gemol. 1981, 17, 60–71. [Google Scholar] [CrossRef]
- Goldman, D.S.; Rossman, G.R.; Parkin, K.M. Channel constituents in beryl. Phys. Chem. Miner. 1978, 3, 225–235. [Google Scholar] [CrossRef]
- Viana, R.R.; da Costa, G.M.; De Grave, E.; Stern, W.B.; Jordt-Evangelista, H. Characterization of beryl (aquamarine variety) by Mösssbauer spectroscopy. Phys. Chem. Miner. 2002, 29, 78–86. [Google Scholar] [CrossRef]
- Taran, M.N.; Rossman, G.R. Optical spectroscopic study of tuhualite and a re-examination of the beryl, cordierite, and osumilite spectra. Am. Mineral. 2001, 86, 937–980. [Google Scholar] [CrossRef]
- Lum, J.E.; Viljoen, F.; Cairncross, B.; Frei, D. Mineralogical and geochemical characteristics of BERYL (AQUAMARINE) from the Erongo Volcanic Complex, Namibia. J. Afr. Earth Sci. 2016, 124, 104–125. [Google Scholar] [CrossRef]
- Merino, E.; Villaseca, C.; Orejana, D.; Jeffries, T. Gahnite, chrysoberyl and beryl co-occurrence as accessory minerals in a highly evolved peraluminous pluton: The Belvís de Monroy leucogranite (Cáceres, Spain). Lithos 2013, 179, 137–156. [Google Scholar] [CrossRef]
- Ding, P. Study on Mineralogical Characteristic and Fluid Inclusions of Aquamarine from Fugong, Yunnan Province. Master’s Thesis, China University of Geosciences, Beijing, China, 2012. [Google Scholar]
- Fridrichová, J.; Bačík, P.; Rusinová, P.; Antal, P.; Škoda, R.; Bizovská, V.; Miglierini, M. Optical and crystal-chemical changes in aquamarines and yellow beryls from Thanh Hoa province, Vietnam induced by heat treatment. Phys. Chem. Miner. 2014, 42, 287–302. [Google Scholar] [CrossRef]
- Groat, L.A.; Rossman, G.R.; Dyar, M.D.; Turner, D.; Piccoli, P.M.B.; Schultz, A.J.; Ottolini, L. Crystal Chemistry of Dark Blue Aquamarine from the True Blue Showing, Yukon Territory, Canada. Can. Mineral. 2010, 48, 597–613. [Google Scholar] [CrossRef]
- Beal, K.L.; Lentz, D.R. Aquamarine beryl from Zealand Station, Canada: A mineralogical and stable isotope study. J. Geosci. 2012, 55, 57–67. [Google Scholar] [CrossRef]
- Kim, S.J.; Shin, D.W.; Shon, S.H.; Jang, Y.D. Gemological Characteristics of Aquamarine from the Gilgit-Baltistan of Northern Areas, Pakistan. J. Mineral. Soc. Korea 2015, 28, 51–60. [Google Scholar] [CrossRef]
- Bocchio, R.; Adamo, I.; Caucia, F. Aquamarine from the Masino-Bregaglia Massif, Central Alps, Italy. Gems Gemol. 2009, 45, 204–207. [Google Scholar] [CrossRef]


| Sample | Color | RI | DR | Dichroism | CCF | UV | SG |
|---|---|---|---|---|---|---|---|
| XJ-1 | Light blue | 1.573–1.581 | 0.008 | Weak | Pale green | Inert | 2.68 |
| XJ-2 | Light blue | 1.562–1.569 | 0.007 | Weak | Pale green | Inert | 2.68 |
| MG | Medium blue | 1.561–1.570 | 0.009 | Moderate | Blue green | Weak blue-white at longwave | 2.67 |
| NA | Deep blue | 1.582–1.590 | 0.008 | Weak | Pale green | Inert | 2.70 |
| Sample | Chemical Formula |
|---|---|
| XJ-1 | ch(Na0.091,K0.002)T2(Be2.949,Li0.051)3.000 O(Al2.117,Fe0.048,Mg0.015,Cr0.002,Ca0.001,Mn0.001,Ti0.001)2.185T1Si5.863O18 |
| XJ-2 | ch(Na0.067,K0.001)T2Be2.991,Li0.009)3.000 O(Al1.947,Fe0.038,Mg0.007,Cr0.001,Ca0.001,Mn0.001,Ti0.001)1.996T1Si5.999O18 |
| MG | ch(Na0.044,K0.001)T2(Be2.989,Li0.011)3.000 O(Al1.890,Fe0.078,Mg0.006,Cr0.002,Ca0.001,Mn0.001,Ti0.001)1.979T1Si6.028O18 |
| NA | ch(Na0.234,K0.011)T2(Be2.955,Li0.045)3.000 O(Al1.931,Fe0.166,Mg0.152,Mn0.003,Cr0.001,Ca0.001,Ti0.001)2.255T1Si5.837O18 |
Disclaimer/Publisher’s Note: The statements, opinions and data contained in all publications are solely those of the individual author(s) and contributor(s) and not of MDPI and/or the editor(s). MDPI and/or the editor(s) disclaim responsibility for any injury to people or property resulting from any ideas, methods, instructions or products referred to in the content. |
© 2023 by the authors. Licensee MDPI, Basel, Switzerland. This article is an open access article distributed under the terms and conditions of the Creative Commons Attribution (CC BY) license (https://creativecommons.org/licenses/by/4.0/).
Share and Cite
Cui, S.; Xu, B.; Shen, J.; Miao, Z.; Wang, Z. Gemology, Spectroscopy, and Mineralogy Study of Aquamarines of Three Different Origins. Crystals 2023, 13, 1478. https://doi.org/10.3390/cryst13101478
Cui S, Xu B, Shen J, Miao Z, Wang Z. Gemology, Spectroscopy, and Mineralogy Study of Aquamarines of Three Different Origins. Crystals. 2023; 13(10):1478. https://doi.org/10.3390/cryst13101478
Chicago/Turabian StyleCui, Shiyuan, Bo Xu, Jiaqi Shen, Zhuang Miao, and Zixuan Wang. 2023. "Gemology, Spectroscopy, and Mineralogy Study of Aquamarines of Three Different Origins" Crystals 13, no. 10: 1478. https://doi.org/10.3390/cryst13101478
APA StyleCui, S., Xu, B., Shen, J., Miao, Z., & Wang, Z. (2023). Gemology, Spectroscopy, and Mineralogy Study of Aquamarines of Three Different Origins. Crystals, 13(10), 1478. https://doi.org/10.3390/cryst13101478