
Improving the Erosion Resistance Performance of Pisha Sandstone Weathered Soil Using MICP Technology


Abstract
:
1. Introduction
2. Materials, Methods and Experiments
2.1. Materials
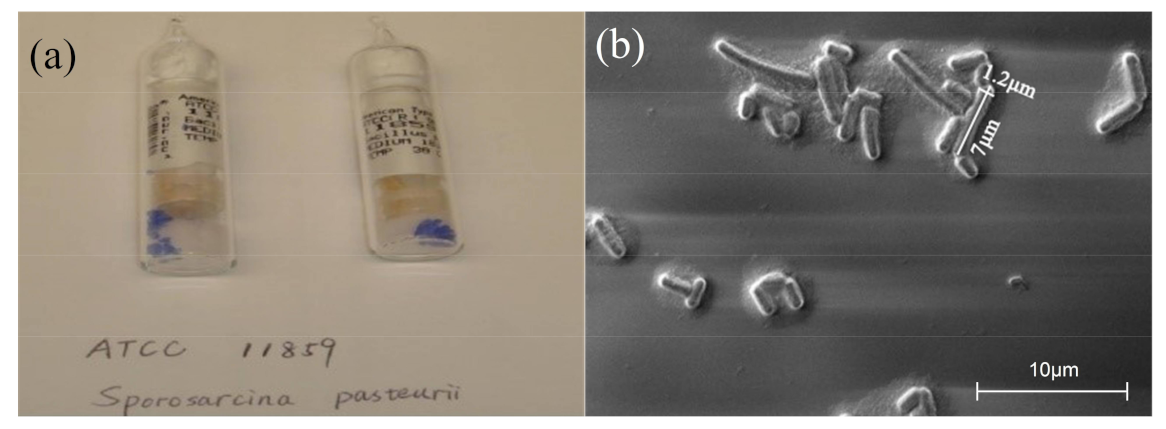
2.1.1. Bacteria
2.1.2. Calcium Source Solution
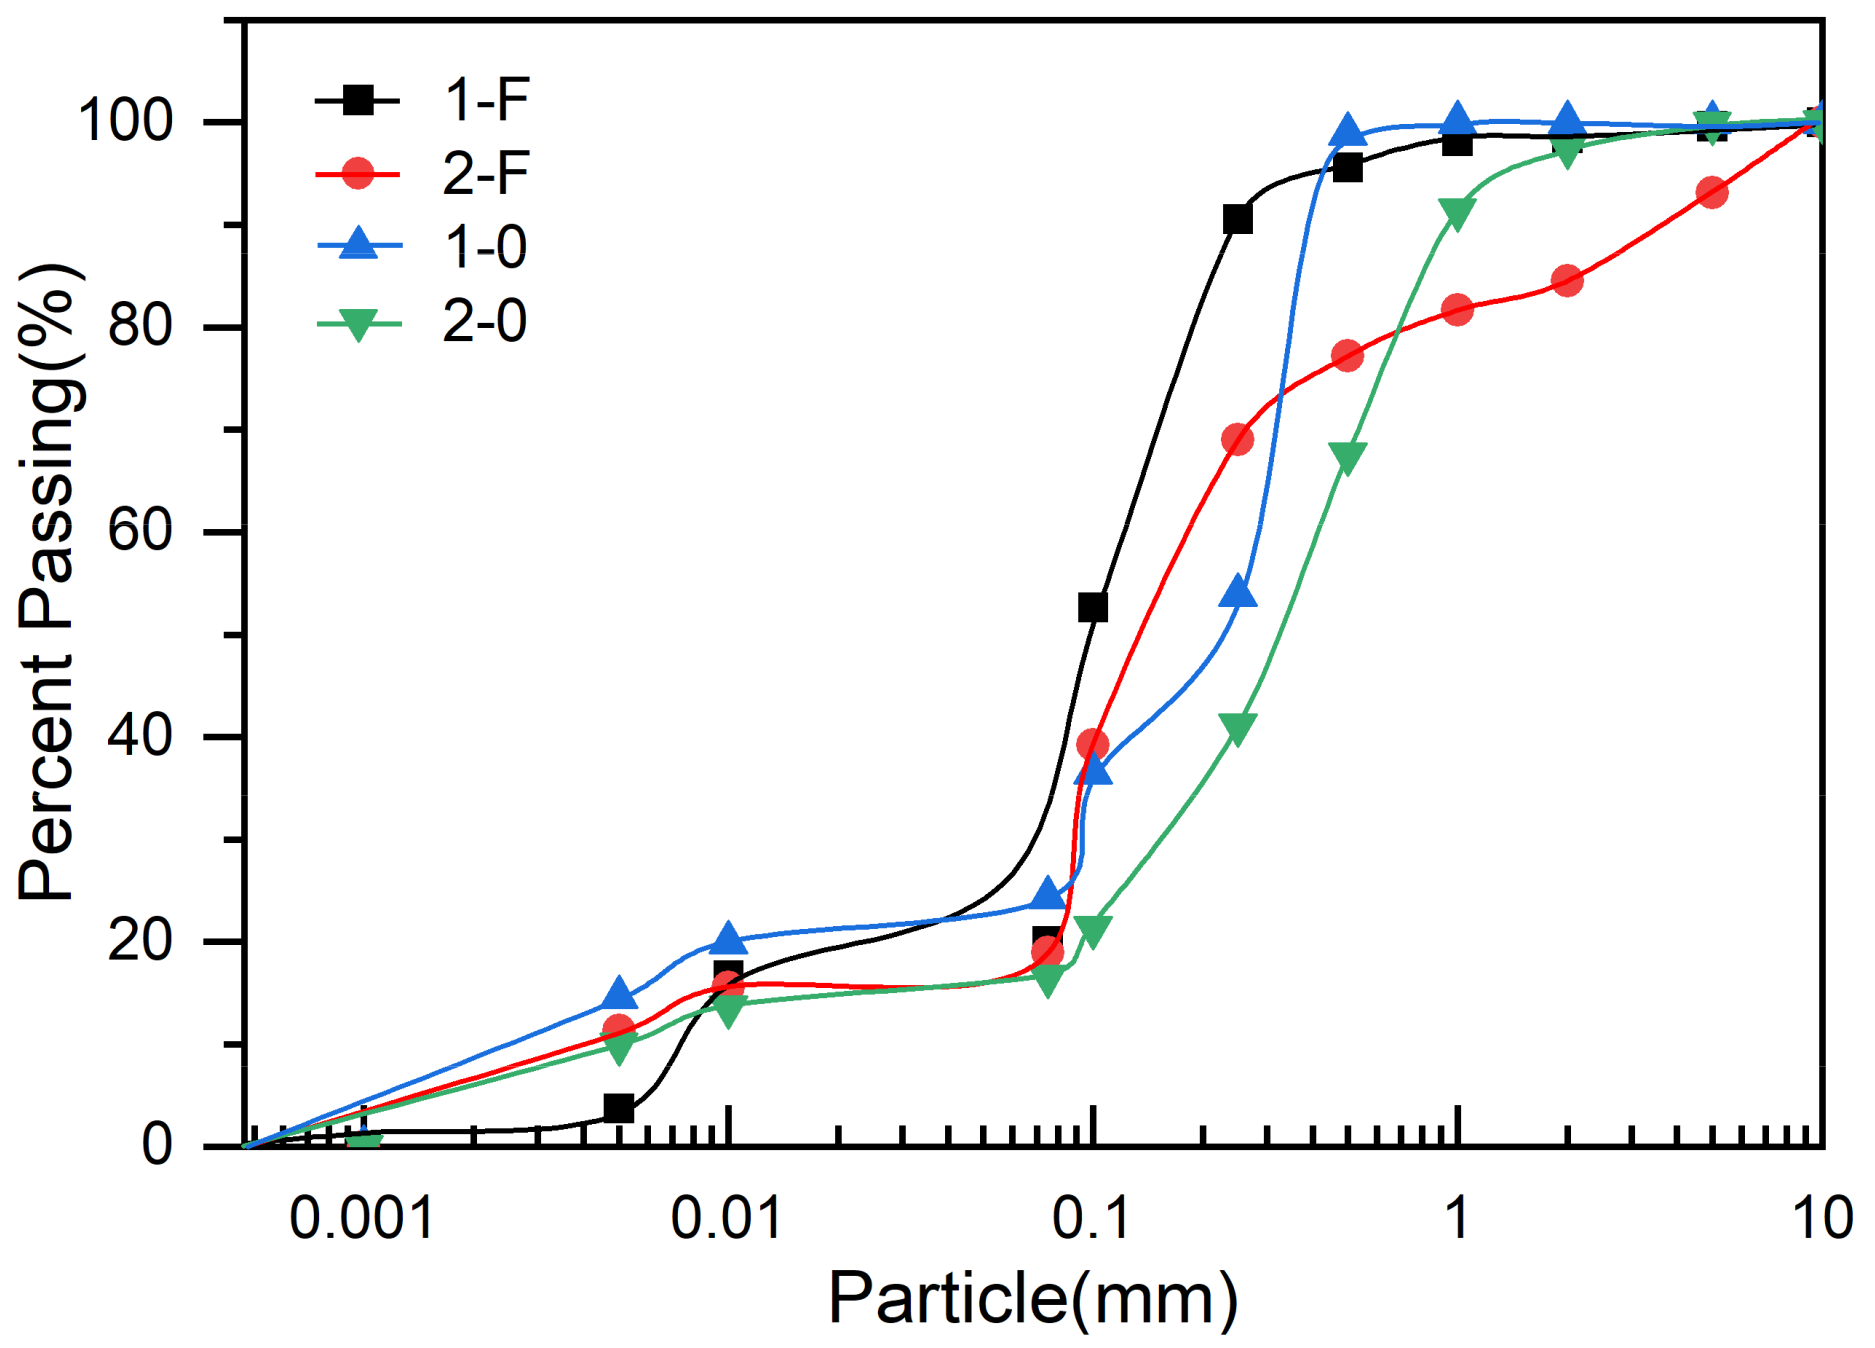
2.1.3. Pisha Sandstone and Its Weathered Soil
2.2. Method
2.2.1. Unconfined Compressive Strength Test
2.2.2. XRD Test
2.2.3. Infrared Spectroscopy Test
2.2.4. Nuclear Magnetic Resonance Test
2.2.5. Determination of Salt Content
2.3. Experiments
2.3.1. Improvement of Pisha Sandstone Weathered Soil Based on MICP Technology
- Weigh the matrix: calculate the volume of the sample according to the size of the test sample and determine the quality of the Pisha sandstone weathered soil.
- Making the mold: the unimproved weathered soil is a loose, granular material. In order to obtain an improved soil sample that meets the size specified in the specification, the specimens were prepared in full contact flexible molds (FCFM) as described in Li et al. [29], which were made of geotextile.
- Prepare the calcium source solution: calcium chloride dihydrate will produce a lot of bubbles in the dissolution process, it should be prepared one hour before soaking the samples and put into the box of the MICP reactor to give sufficient time to dissipate the bubbles.
- Dilute the bacterial liquid: there are two quantitative indicators for bacterial liquid, one is volumetric consumption, and the other is bacterial liquid concentration. In this study, the concentration of the bacterial solution was measured with a visible light spectrophotometer. The quantitative index is OD600, which generally refers to the absorbance of a certain solution at a wavelength of 600 nm. The OD600 of the bacterial solution obtained by the expanded culture is between 1.6 and 2.0, and the concentration used in the experiment is 1.2, so it should be diluted to a certain concentration with the fresh liquid culture medium for use. In order to ensure the urease production capacity of the bacterial liquid and the activity of urease, before diluting the bacterial liquid, a conductivity meter should be used to determine the activity of urease in the bacterial liquid. According to the method in the literature [30], use a conductivity meter to test the amount of hydrolysis of urea per minute by the activated bacterial solution to characterize the urease activity. The measured urease activity value of the bacterial solution should be greater than 6 mmol/(L·min) to meet the requirements for use.
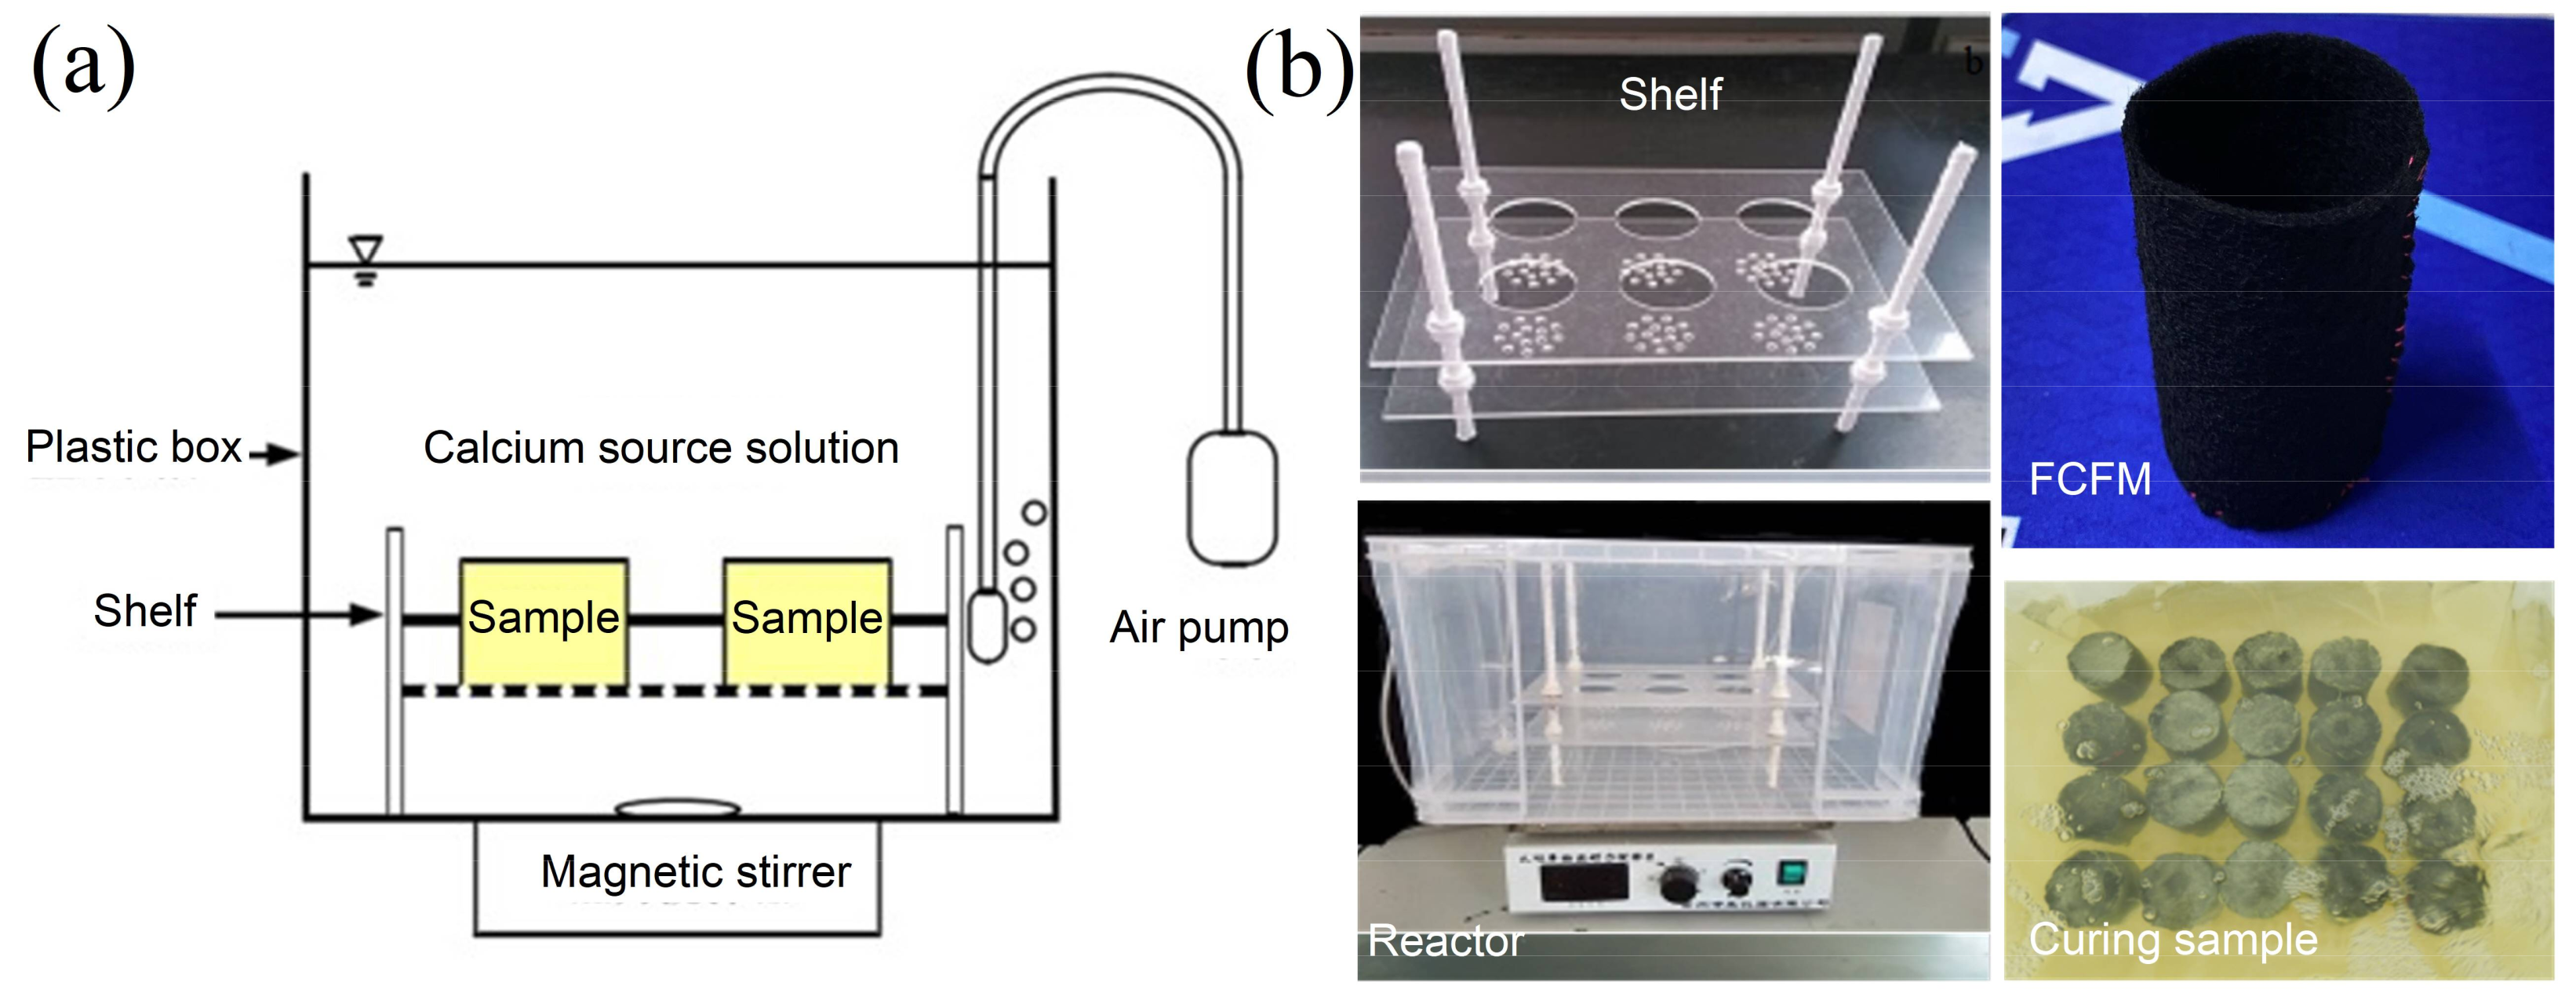
- Make the sample: the adjusted concentration of the bacterial liquid is mixed into the soil and then loaded into the sewn molding mold, and the upper cover of the mold is quickly stitched to the sample. After the stitching is completed, move samples into a reactor filled with calcium source solution to soak and cure. Sample volume: bacterial liquid volume: calcium source solution liquid volume = 5:1:20.The MICP reactor is a device designed and manufactured by the research group to provide a reaction place for the mineralization (as shown in Figure 5). It consists of a plastic box, a magnetic stirrer, a sample carrier, and an oxygen pump. Among them, during the operation of the magnetic stirrer, the entire liquid environment is agitated to make the ion distribution in the solution more uniform, making the mineralization reaction more complete; the oxygen pump continuously injects oxygen into the calcium source solution, and the abundance of oxygen is in order to provide the necessary oxygen for bacterial life and metabolism.
- Cure the sample: soak the stitched sample in a mineralization reactor for eight days. During the curing process, ensure the normal operation of the oxygen pump. When the curing reaches the end of the third day, turn the sample upside down once.
- Air-dry the sample: the sample after curing for seven days can be taken out of the MICP reactor. After removing the shaping mold, take out the improved soil sample. The obtained sample should be dried naturally in an environment of 10–20% air humidity at 10–20 °C. After seven days, various tests are carried out.
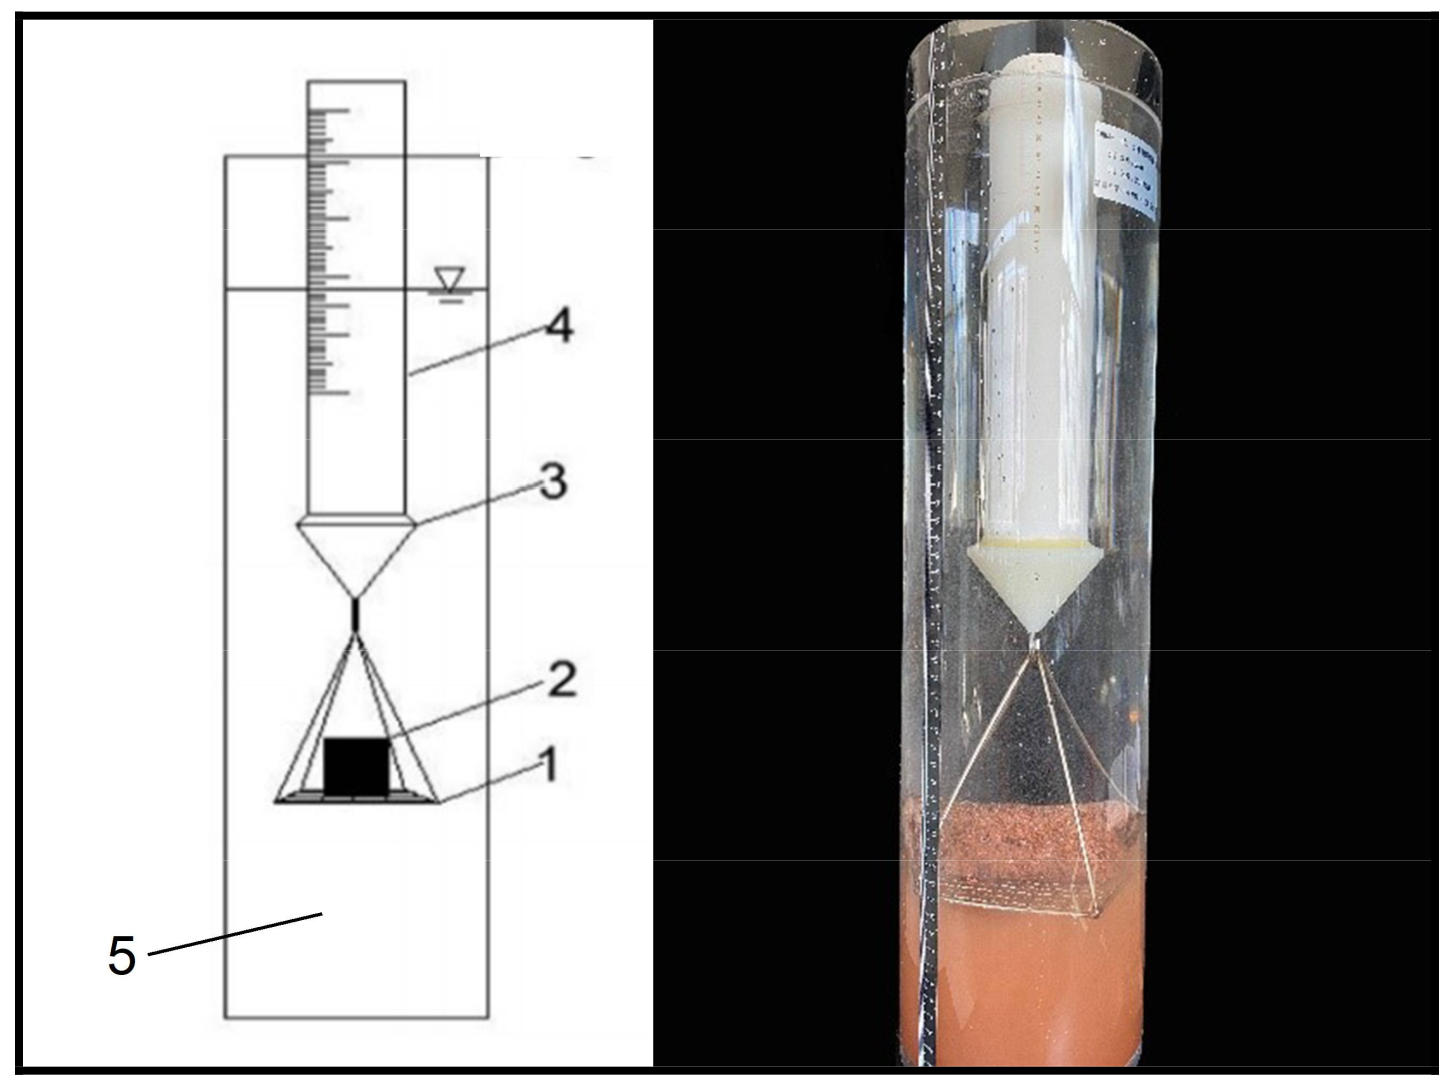
2.3.2. Disintegration Experiments
2.3.3. Wind Sand Erosion Test
3. Results and Discussion
3.1. Mechanical Properties of Improved Samples
3.2. Analysis of Disintegration Characteristics
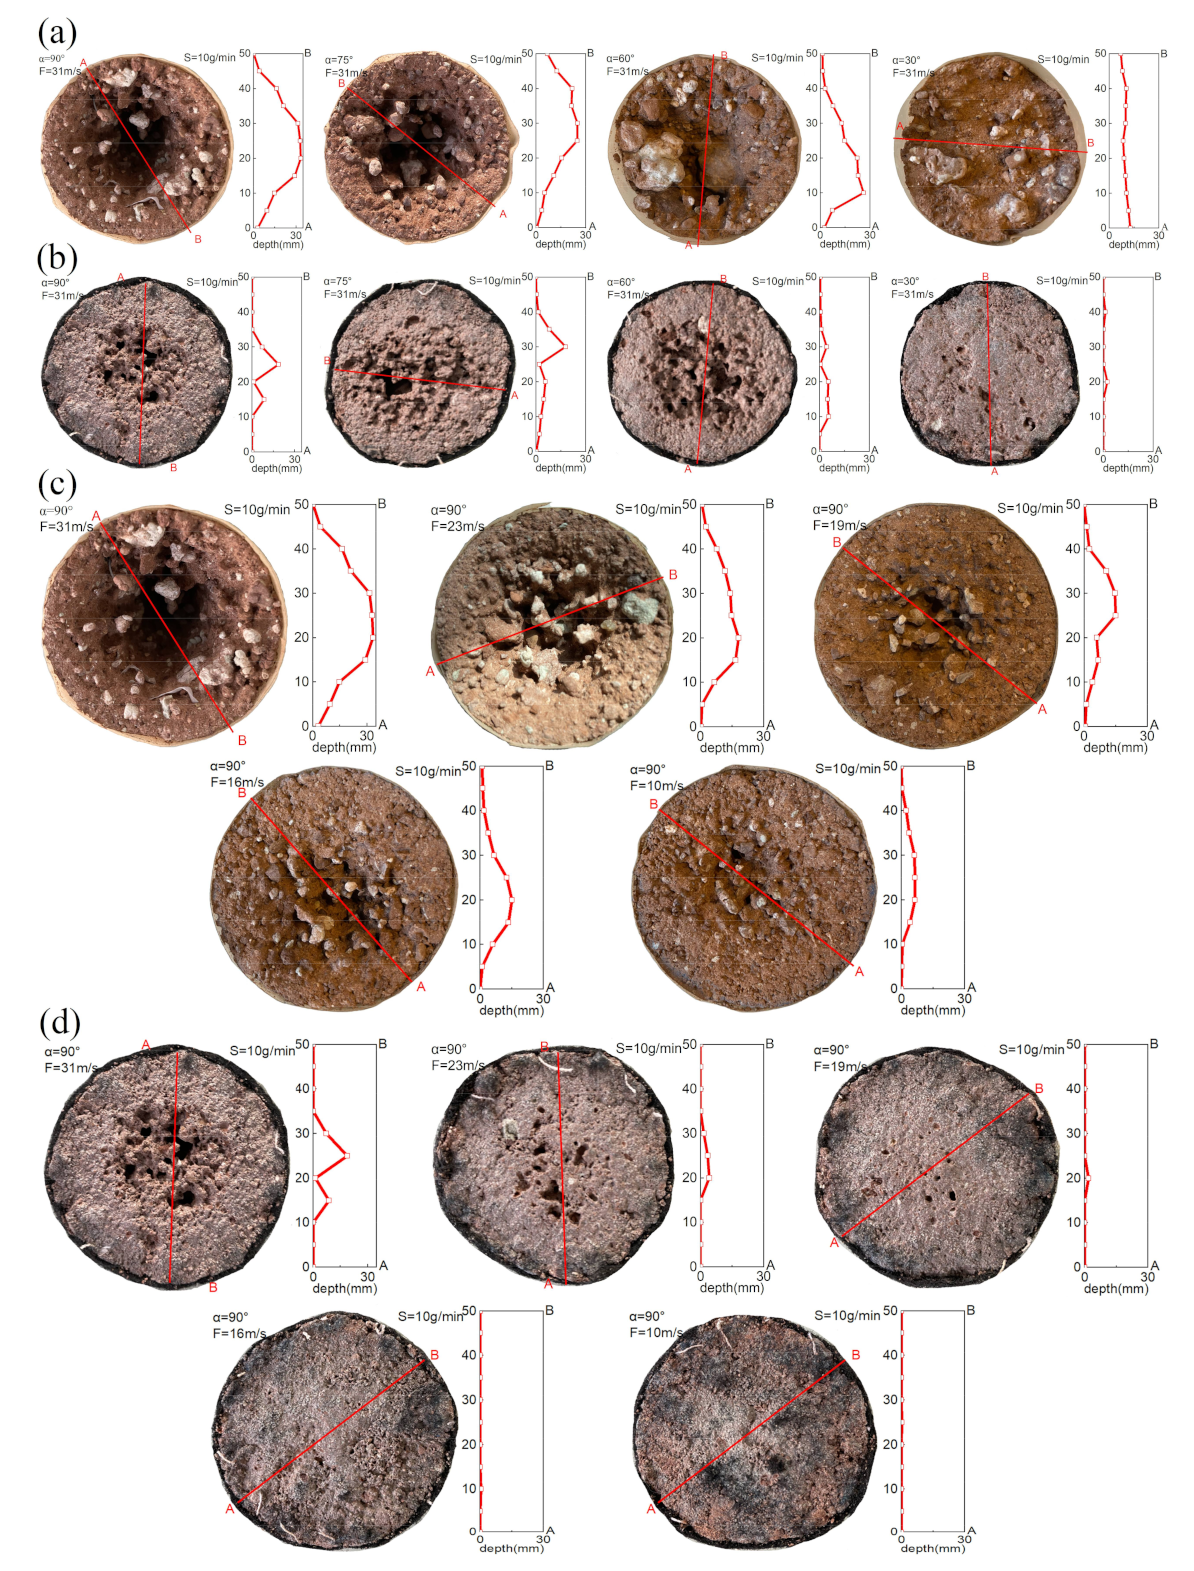
3.3. Observational Evidence of the Wind Erosion Test Samples
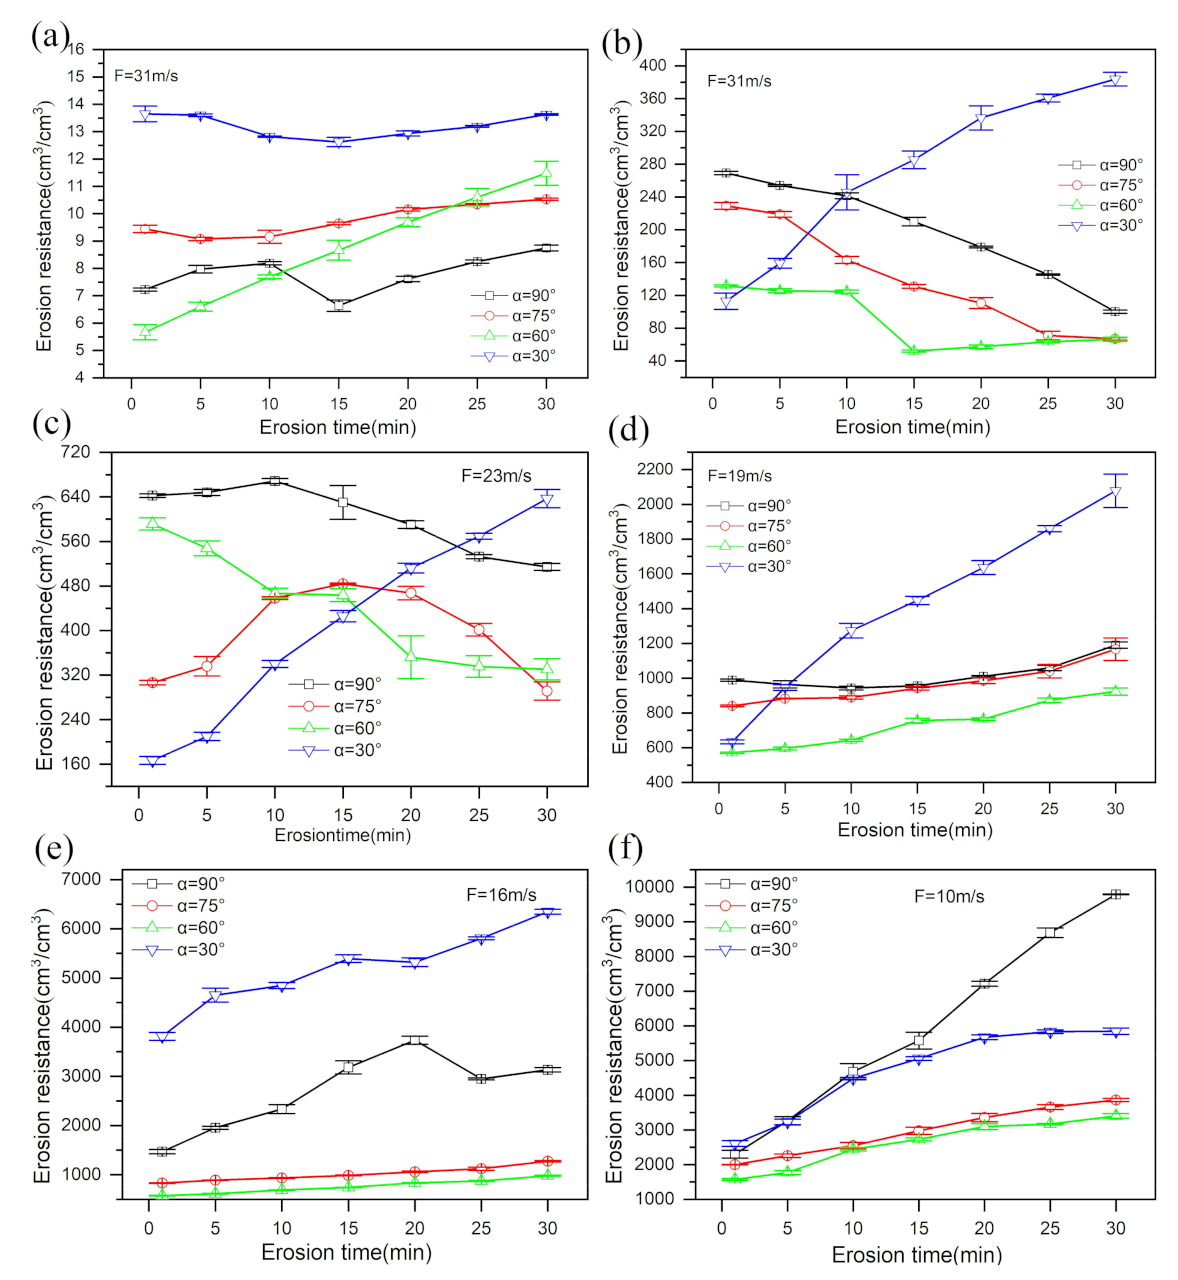
3.4. Wind Erosion Resistance
3.5. Improvement Mechanism of Pisha Sandstone Weathered Soil
3.6. Mechanism Analysis for Improving Resistance Ability
4. Conclusions
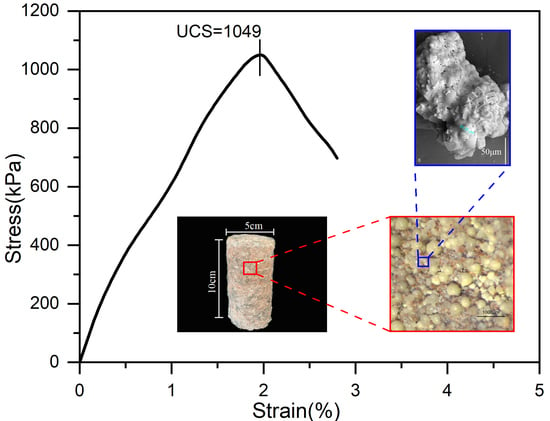
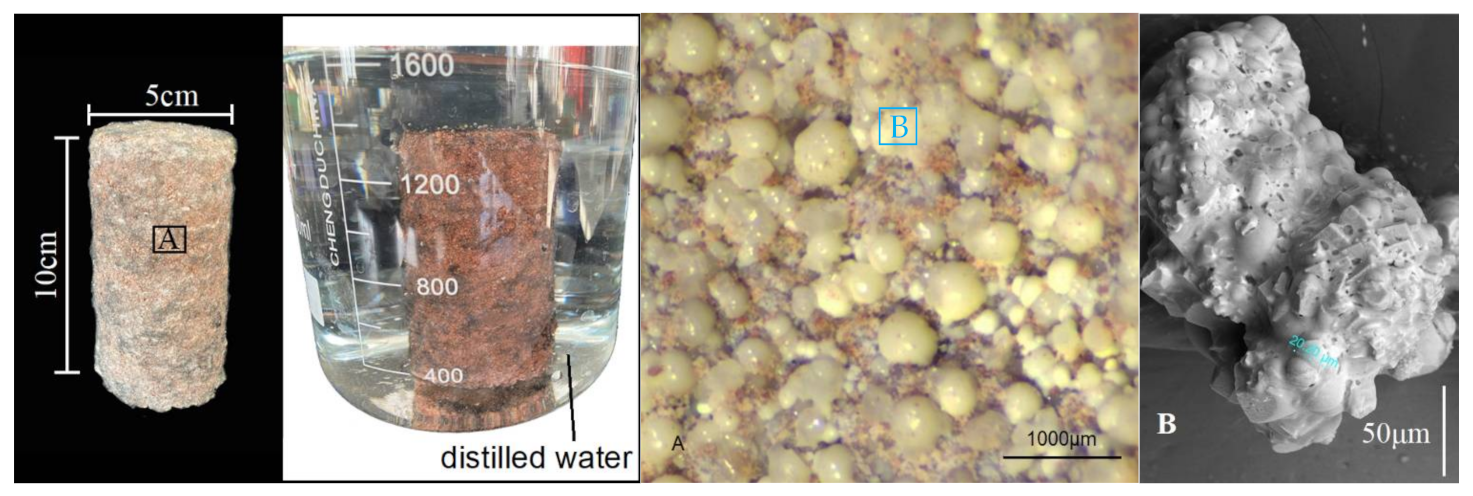
- Pisha sandstone and its weathered soil contain a large number of silty clay particles, especially montmorillonite with high water absorption and strong expansibility. When Pisha sandstone rock and soil are eroded by water or sand, the clay minerals that originally cemented large particles cannot resist the expansion force or external force and sometimes fail, leading to the collapse of the rock and the soil. After improvement, effective cementation was formed between particles, and solidified material with strength up to 1 MPa was formed.
- The disintegration rate and disintegration velocity of improved samples by MICP technology are greatly reduced, which can effectively stave off water erosion. The remolded soil sample almost completely disintegrates in the 10th minute, and the disintegration rate of undisturbed soil in the 30th minute was less than 50%, reaching 39.64%. For the sample improved by MICP technology, the disintegration rate of the sample in the 30th minute was only 1.95%.
- The wind erosion resistance of the improved soil is improved. Originally, the weathered soil formed large and deep erosion pits after being eroded by wind and sand, but after the improvement the mineralized bio-crust forms effective resistance, which changes the damage form of erosion surface and only forms erosion holes. The wind erosion resistance of the improved sample is improved, and its coefficient at a 30° erosion angle is increased about 20 times on average when the wind speed is 31 m/s.
- The internal mechanism of the MICP technology to improve the poor characteristics of the weathered soil in contact with water, mud, and aeolian sand is achieved by inducing calcium carbonate mineral crystals to fill the pores of the soil particles and adhere to and bridge between soil particles for effective cementation. When water invades the soil and expands or is destroyed by external erosion, the cementation of the mineral crystals on the particles resists the expansion force and punching force, thereby improving the erosion resistance.
Author Contributions
Funding
Data Availability Statement
Conflicts of Interest
References
- Wang, Y.C.; Wu, Y.H.; Li, M. Study on Soil Erosion and Its Control in Pisha Sandstone Area; Yellow River Water Conservancy Press: Shanghai, China, 2007. [Google Scholar]
- Yang, F.-S.; Cao, M.-M.; Li, H.-E.; Wang, X.-H.; Bi, C.-F. Simulation of Sediment Retention Effects of the Single Seabuckthorn Flexible Dam in the Pisha Sandstone Area. Ecol. Eng. 2013, 52, 228–237. [Google Scholar] [CrossRef]
- Yang, F.S.; Cao, M.M.; Li, H.E.; Wang, X.H.; Bi, C.F. Ecological Restoration and Soil Improvement Performance of the Seabuckthorn Flexible dam in the Pisha Sandstone Area of Northwestern China. Solid Earth Discuss. 2014, 6, 2803–2842. [Google Scholar]
- Liang, Z.S.; Wu, Z.R.; Yao, W.; Noori, M.; Yang, C.; Xiao, P.; Leng, Y.; Deng, L. Pisha sandstone: Causes, processes and erosion options for its control and prospects. Int. Res. Soil Water Conserv. 2019, 7, 1–8. [Google Scholar] [CrossRef]
- Liang, H.; Wu, Z.; Noori, M.; Yang, C.; Yao, W. A New Ecological Control Method for Pisha Sandstone based on Hydrophilic Polyurethane. J. Arid Land 2017, 9, 790–796. [Google Scholar] [CrossRef]
- Liang, Z.S.; Yang, C.Q.; Wu, Z.R. Study on Mechanical Properties of Pisha Sandstone Solidified Body with W-OH Composite. Yellow River 2016, 38, 30–34. [Google Scholar]
- Zhang, J.K. Study on W-OH Modification and its Performances for Pisha Sandstone Consolidation; Southeast University: Nanjing, China, 2017. [Google Scholar]
- Sun, Z.H.; Han, J.C.; Mao, Z.G.; Wang, H.Y.; Hu, Y. Simulation of Effects of Pisha Sandstone on Improving Corn Yield in Sandy Soil with RZWQM2 Model. Trans. Chin. Soc. Agric. Mach. 2018, 49, 235–243. [Google Scholar]
- Han, J.C.; Xie, J.C.; Zhang, Y. Potential Role of Feldspathic Sandstone as a Natural Water, Retaining Agent in Mu Us Sandy Land, Northwest China. Chin. Geogr. Sci. 2012, 22, 550–555. [Google Scholar] [CrossRef]
- Guo, H.; Han, J.C.; Zhang, Y.; Wang, H.Y.; Sun, Y.Y.; Li, X.C.; Zhang, H.O. Cementation Force of Compound Soil Mixed by Soft Rock and Sand: Raman Spectrum Study. Laser Optoelectron. Prog. 2017, 54, 436–442. [Google Scholar]
- Wang, N.; Xie, J.C.; Han, J.C. A Sand Control and Development Model in Sandy Land Based on Mixed Experiments of Arsenic Sandstone and Sand: A Case Study in Mu Us Sandy Land in China. Chin. Geogr. Sci. 2016, 23, 56–63. [Google Scholar] [CrossRef] [Green Version]
- Dong, J.; Wang, L.; Zhang, T. Study on the strength development, hydration process and carbonation process of NaOH-activated Pisha Sandstone. Constr. Build. Mater. 2014, 66, 154–162. [Google Scholar] [CrossRef]
- Chang, P.; Li, X.L.; Li, M.Y.; Chen, S.H.; Wu, S.G. Experimental study on hydraulic scouring characteristics of sheet flow in Pisha-sandstone. J. Drain. Irrig. Mach. Eng. 2019, 37, 55–61. [Google Scholar]
- Wu, S.Y. Experimental Study on the Mechanical Properties of Pisha-Sandstone and Pisha-Sandstone Cement Soil under Dry-Wet Cycle; Inner Mongolia Agricultural University: Huhhot, China, 2019. [Google Scholar]
- Dong, J.; Li, C.; Liu, H.; Zhang, L.; Liu, J. Investigating the mechanical property and reaction mechanism of geopolymers cement with red Pisha Sandstone. Constr. Build. Mater. 2019, 201, 641–650. [Google Scholar] [CrossRef]
- Su, T.; Zhang, X. Effects of EN-1 soil stabilizer on slope runoff hydraulic characteristics of Pisha sandstone stabilized soil. Nongye Jixie Xuebao Trans. Chin. Soc. Agric. Mach. 2011, 42, 68–75. [Google Scholar]
- Huo, J.S.; Geng, Y.J.; Yu, Z.Q. Experimental Study on the Weathered Red Sandstone Soil Road Performance Stabilized with EN-1 Soil Stabilizer. Adv. Mater. Res. 2011, 255–260, 3190–3194. [Google Scholar] [CrossRef]
- Xiao, P.Q.; Yao, W.Y.; Liu, H. Research progress and harnessing method of soil and water loss in Pisha sandstone region. Yellow River 2014, 36, 92–94. [Google Scholar] [CrossRef]
- Phillips, A.J.; Gerlach, R.; Lauchnor, E.; Mitchelf, A.C.; Cunningham, A.B.; Spangler, L. Engineered applications of ureolytic biomineralization: A review. Biofouling 2013, 29, 715–733. [Google Scholar] [CrossRef] [PubMed] [Green Version]
- Tang, C.S.; Yin, L.-Y.; Jiang, N.-J.; Zhu, C.; Zeng, H.; Li, H.; Shi, B. Factors affecting the performance of microbial-induced carbonate precipitation (MICP) treated soil: A review. Environ. Earth Sci. 2020, 79, 94. [Google Scholar] [CrossRef]
- Whiffin, V.S.; Van Paassen, L.A.; Harkes, M.P. Microbial carbonate precipitation as a soil improvement technique. Geomicrobiol. J. 2007, 24, 417–423. [Google Scholar] [CrossRef]
- Wang, X.X.; Miao, L.C.; Sun, X.H.; Wu, L.Y. Research progress of microbial induced solidification technology. J. Hunan Univ. 2021, 48, 70–81. (In Chinese) [Google Scholar]
- He, J.; Chu, J.; Liu, H.L.; Gao, Y.; Li, B. Research advances in biogeotechnologies. Chin. J. Geotech. Eng. 2016, 38, 643–653. [Google Scholar]
- Liu, H.L.; Xiao, P.; Xiao, Y.; Chu, J. State-of-the-art review of biogeotechnology and its engineering applications. J. Civil Environ. Eng. 2019, 41, 1–14. [Google Scholar]
- De Jong, J.; Soga, K.; Kavazanjian, E.; Burns, S.; van Paassen, L.; Al Quabany, A.; Aydilek, A.; Bang, S.; Burbank, M.; Caslake, L.; et al. Biogeochemical processes and geotechnical applications: Progress, opportunities and challenges. Geotechnique 2013, 63, 287–301. [Google Scholar] [CrossRef] [Green Version]
- Li, C.; Wang, S.; Wang, Y.X.; Gao, Y.; Bai, S. Field experimental study on stability of bio-mineralization crust in the desert. Chin. J. Rock Soil Mech. 2019, 40, 1291–1298. [Google Scholar]
- Meyer, F.D.; Bang, S.; Min, S.; Stetler, L.D.; Bang, S.S. Microbiologically-Induced Soil Stabilization: Application of Sporosarcina pasteurii for Fugitive Dust Control. ASCE Geo-Front. 2011, 4002–4011. [Google Scholar] [CrossRef] [Green Version]
- Hamdan, N.; Kavazanjian, E.J. Enzyme-induced carbonate mineral precipitation for fugitive dust control. Géotechnique 2016, 66, 546–555. [Google Scholar] [CrossRef]
- Li, C.; Wang, Y.; Zhou, T.; Bai, S.; Gao, Y.; Yao, D.; Li, L. Sulfate Acid Corrosion Mechanism of Biogeomaterial Based on MICP Technology. J. Mater. Civil Eng. 2019, 31, 04019097. [Google Scholar] [CrossRef]
- Whiffin, V.S. Microbial CaCO3 Precipitation for the Production of Biocement. Ph.D. Thesis, Murdoch University, Perth, Australia, 2004. [Google Scholar]
- Shi, Y.; Shi, Z.M. Ultrasonic surface treatment for improving wind-blown sand erosion resistance of cementitious materials. WEAR 2020, 460, 108–203. [Google Scholar] [CrossRef]
- Zhang, C.; Li, X.; Lyu, J.; Li, F. Comparison of carbonate precipitation induced by Curvibacter sp. HJ-1 and Arthrobacter sp. MF-2: Further insight into the biomineralization process. J. Struct. Biol. 2020, 212, 107609. [Google Scholar] [CrossRef]


| Description | 0.13 M Tris Buffer | (NH4)2SO4 | Yeast Extract |
|---|---|---|---|
| Concentration (g/L) | 15.748 | 10.0 | 30.0 |
| Description | Nutrient Broth | NH4Cl | Urea | CaCl2·2H2O | NaHCO3 |
|---|---|---|---|---|---|
| Concentration (g/L) | 3.0 | 10.0 | 30.0 | 73.5 | 2.12 |
| Sample No. | Coordinate | Color | Natural Occurrence | wL 1 (%) | wP 2 (%) | IP 3 |
|---|---|---|---|---|---|---|
| 1-0 | N39.4281°, E111.0911° | Fchsia | Rock specimen | 39.4 | 12.0 | 27.4 |
| 1-F | N39.4281°, E111.0911° | Fchsia | Residual soil | 30.2 | 17.3 | 12.9 |
| 2-0 | N39.5425°, E111.0928° | Mroon | Rock specimen | 25.2 | 12.6 | 12.6 |
| 2-F | N39.5425°, E111.0928° | Mroon | Residual soil | 32.8 | 24.1 | 8.7 |
| Particle Size Range (mm) | Percentage Content (%) | |||
|---|---|---|---|---|
| 1-0 | 1-F | 2-0 | 2-F | |
| d < 0.001 | 0.00 | 0.00 | 0.00 | 0.00 |
| 0.001 ≤ d < 0.005 | 14.61 | 3.72 | 9.99 | 11.38 |
| 0.005 ≤ d < 0.01 | 5.36 | 13.00 | 3.66 | 4.17 |
| 0.01 ≤ d < 0.075 | 4.38 | 3.33 | 3.00 | 3.41 |
| d < 0.075 | 24.35 | 20.05 | 16.65 | 18.96 |
| 0.075 ≤ d < 0.1 | 12.19 | 27.86 | 4.74 | 20.24 |
| 0.1 ≤ d < 0.25 | 17.31 | 42.63 | 19.74 | 29.83 |
| 0.25 ≤ d < 0.5 | 45.06 | 5.06 | 26.46 | 8.15 |
| 0.5 ≤ d < 1 | 1.10 | 2.56 | 23.85 | 4.51 |
| 1 ≤ d < 2 | 0.00 | 0.32 | 6.09 | 2.84 |
| 2 ≤ d < 5 | 0.00 | 1.13 | 2.38 | 8.58 |
| 5 ≤ d < 10 | 0.00 | 0.38 | 0.09 | 6.88 |
| Mineral Name | Percentage Content (%) | |||
|---|---|---|---|---|
| 1-0 | 1-F | 2-0 | 2-F | |
| Quartz | 29.40 | 25.93 | 23.45 | 26.31 |
| Albite | 9.67 | 11.82 | 4.57 | 5.02 |
| Calcite | 17.93 | 10.62 | 7.61 | 18.50 |
| Kaolinite | 2.36 | 4.42 | 3.69 | 3.85 |
| Illite | 8.40 | 3.72 | 10.91 | 4.49 |
| Montmorillonite | 22.87 | 22.76 | 31.89 | 22.75 |
| Biotite | 3.56 | 6.58 | 4.80 | 5.26 |
| Chlorite | 0.00 | 0.00 | 4.74 | 5.16 |
| Iron oxide | 5.82 | 14.15 | 8.33 | 8.66 |
| Variable Settings | Variable Value | Test Content |
|---|---|---|
| Erosion angle (α, °) | 90 | 1 Erosion pit depth, mass loss, and morphology of the specimens after erosion |
| 75 | ||
| 60 | ||
| 30 | ||
| Wind speed (F, m/s) | 31 | |
| 23 | ||
| 19 | ||
| 16 | ||
| 10 | ||
| Sand feed rate (S, g/min) | 10 | |
| Sample size (cm) | Φ5H5 |
| Erosion Time (min) | Disintegration Rate (%) | Disintegration Velocity (%/min) | ||||
|---|---|---|---|---|---|---|
| 1-0 | 1-F | Improved Soil | 1-0 | 1-F | Improved Soil | |
| 0 | 0.00 | 0.00 | 0.00 | 0.00 | 0.00 | 0.00 |
| 2 | 4.04 | 13.00 | 0.50 | 4.04 | 6.50 | 0.25 |
| 4 | 8.66 | 36.59 | 0.59 | 8.66 | 9.15 | 0.15 |
| 6 | 11.40 | 48.57 | 0.73 | 11.40 | 8.09 | 0.12 |
| 8 | 19.32 | 62.41 | 0.85 | 19.32 | 7.80 | 0.11 |
| 10 | 20.83 | 76.64 | 0.98 | 20.83 | 7.66 | 0.10 |
| 12 | 22.30 | — | 1.10 | 22.30 | — | 0.09 |
| 14 | 23.32 | — | 1.22 | 23.32 | — | 0.09 |
| 16 | 24.20 | — | 1.35 | 24.20 | — | 0.08 |
| 18 | 26.13 | — | 1.51 | 26.13 | — | 0.08 |
| 20 | 30.69 | — | 1.68 | 30.69 | — | 0.08 |
| 25 | 36.10 | — | 1.80 | 36.10 | — | 0.07 |
| 30 | 39.64 | — | 1.95 | 39.64 | — | 0.06 |
| AV. of Mass Loss Rate (%) | ||||||||||
|---|---|---|---|---|---|---|---|---|---|---|
| Samples | Pisha sandstone Weathered Soil | Improved Soil | ||||||||
| Erosion Angles (°) | 90 | 75 | 60 | 30 | 90 | 75 | 60 | 30 | ||
| 10 m/s | Erosion time (min) | 1 | 0.29 | 0.09 | 0.11 | 0.07 | 0.00 | 0.00 | 0.00 | 0.00 |
| 5 | 1.34 | 0.35 | 0.46 | 0.29 | 0.01 | 0.01 | 0.02 | 0.01 | ||
| 10 | 2.49 | 0.48 | 0.85 | 0.54 | 0.01 | 0.02 | 0.02 | 0.01 | ||
| 15 | 3.69 | 0.61 | 1.20 | 0.77 | 0.02 | 0.03 | 0.03 | 0.02 | ||
| 20 | 4.42 | 0.90 | 1.55 | 0.97 | 0.02 | 0.04 | 0.04 | 0.02 | ||
| 25 | 5.27 | 0.97 | 1.85 | 1.17 | 0.02 | 0.04 | 0.05 | 0.02 | ||
| 30 | 6.29 | 1.13 | 2.12 | 1.38 | 0.02 | 0.05 | 0.05 | 0.02 | ||
| 16 m/s | Erosion time (min) | 1 | 0.21 | 0.13 | 0.19 | 0.14 | 0.00 | 0.01 | 0.01 | 0.00 |
| 5 | 1.05 | 0.65 | 0.91 | 0.67 | 0.02 | 0.03 | 0.05 | 0.02 | ||
| 10 | 2.04 | 1.29 | 1.81 | 1.18 | 0.03 | 0.07 | 0.09 | 0.03 | ||
| 15 | 2.86 | 1.91 | 2.66 | 1.60 | 0.03 | 0.09 | 0.12 | 0.03 | ||
| 20 | 3.73 | 2.48 | 3.40 | 1.97 | 0.03 | 0.12 | 0.14 | 0.03 | ||
| 25 | 4.55 | 3.09 | 4.22 | 2.45 | 0.05 | 0.14 | 0.17 | 0.05 | ||
| 30 | 5.29 | 3.64 | 5.01 | 2.92 | 0.06 | 0.14 | 0.18 | 0.06 | ||
| 19 m/s | Erosion time (min) | 1 | 0.29 | 0.21 | 0.16 | 0.14 | 0.01 | 0.01 | 0.01 | 0.01 |
| 5 | 1.34 | 0.99 | 0.89 | 0.64 | 0.05 | 0.04 | 0.05 | 0.05 | ||
| 10 | 2.49 | 1.91 | 2.60 | 1.59 | 0.10 | 0.07 | 0.10 | 0.10 | ||
| 15 | 3.69 | 2.77 | 3.70 | 2.36 | 0.14 | 0.10 | 0.12 | 0.14 | ||
| 20 | 4.42 | 3.62 | 4.62 | 2.99 | 0.18 | 0.13 | 0.16 | 0.18 | ||
| 25 | 5.27 | 4.46 | 6.03 | 3.84 | 0.21 | 0.15 | 0.18 | 0.21 | ||
| 30 | 6.29 | 5.22 | 7.63 | 4.80 | 0.24 | 0.16 | 0.20 | 0.24 | ||
| 23 m/s | Erosion time (min) | 1 | 0.42 | 0.29 | 0.38 | 0.38 | 0.01 | 0.02 | 0.05 | 0.01 |
| 5 | 1.93 | 1.36 | 1.74 | 1.50 | 0.05 | 0.09 | 0.19 | 0.05 | ||
| 10 | 3.67 | 2.58 | 3.14 | 2.72 | 0.09 | 0.13 | 0.23 | 0.09 | ||
| 15 | 5.13 | 3.69 | 4.18 | 3.68 | 0.15 | 0.19 | 0.28 | 0.15 | ||
| 20 | 6.56 | 4.86 | 5.32 | 4.70 | 0.21 | 0.26 | 0.31 | 0.21 | ||
| 25 | 7.80 | 5.50 | 6.40 | 5.65 | 0.29 | 0.39 | 0.35 | 0.29 | ||
| 30 | 9.14 | 6.29 | 7.38 | 6.38 | 0.36 | 0.64 | 0.38 | 0.36 | ||
| 31 m/s | Erosion time (min) | 1 | 0.82 | 0.64 | 1.04 | 0.45 | 0.02 | 0.03 | 0.05 | 0.03 |
| 5 | 3.73 | 3.29 | 4.45 | 2.23 | 0.12 | 0.14 | 0.24 | 0.14 | ||
| 10 | 7.27 | 6.57 | 7.64 | 4.74 | 0.26 | 0.39 | 0.48 | 0.30 | ||
| 15 | 13.46 | 9.33 | 10.19 | 7.22 | 0.44 | 0.72 | 1.74 | 0.52 | ||
| 20 | 15.63 | 11.82 | 12.13 | 9.39 | 0.69 | 1.14 | 2.11 | 0.81 | ||
| 25 | 18.04 | 14.46 | 13.87 | 11.51 | 1.07 | 2.22 | 2.38 | 1.25 | ||
| 30 | 20.42 | 17.09 | 15.37 | 13.37 | 1.86 | 2.82 | 2.73 | 2.17 | ||
| Band (cm−1) | Functional Group | Possible Compounds |
|---|---|---|
| 3408.54–3047.79 | O-H and N-C stretching | Carbohydrates, proteins, lipids |
| 2983.36–2800.49 | C-H stretching | Proteins, lipids |
| 2370.31 | O-H stretching | Sulfonic acid, sulfuric acid |
| 1798.07 | C=O stretching | Fatty esters or carboxylic acid (lipids) |
| 1624.67 | N-H and C-N stretching | Proteins, N-acetylated amino sugars |
| 1413.27–1083.09 | -CH3 or O-H stretching | Sugars, carbohydrates |
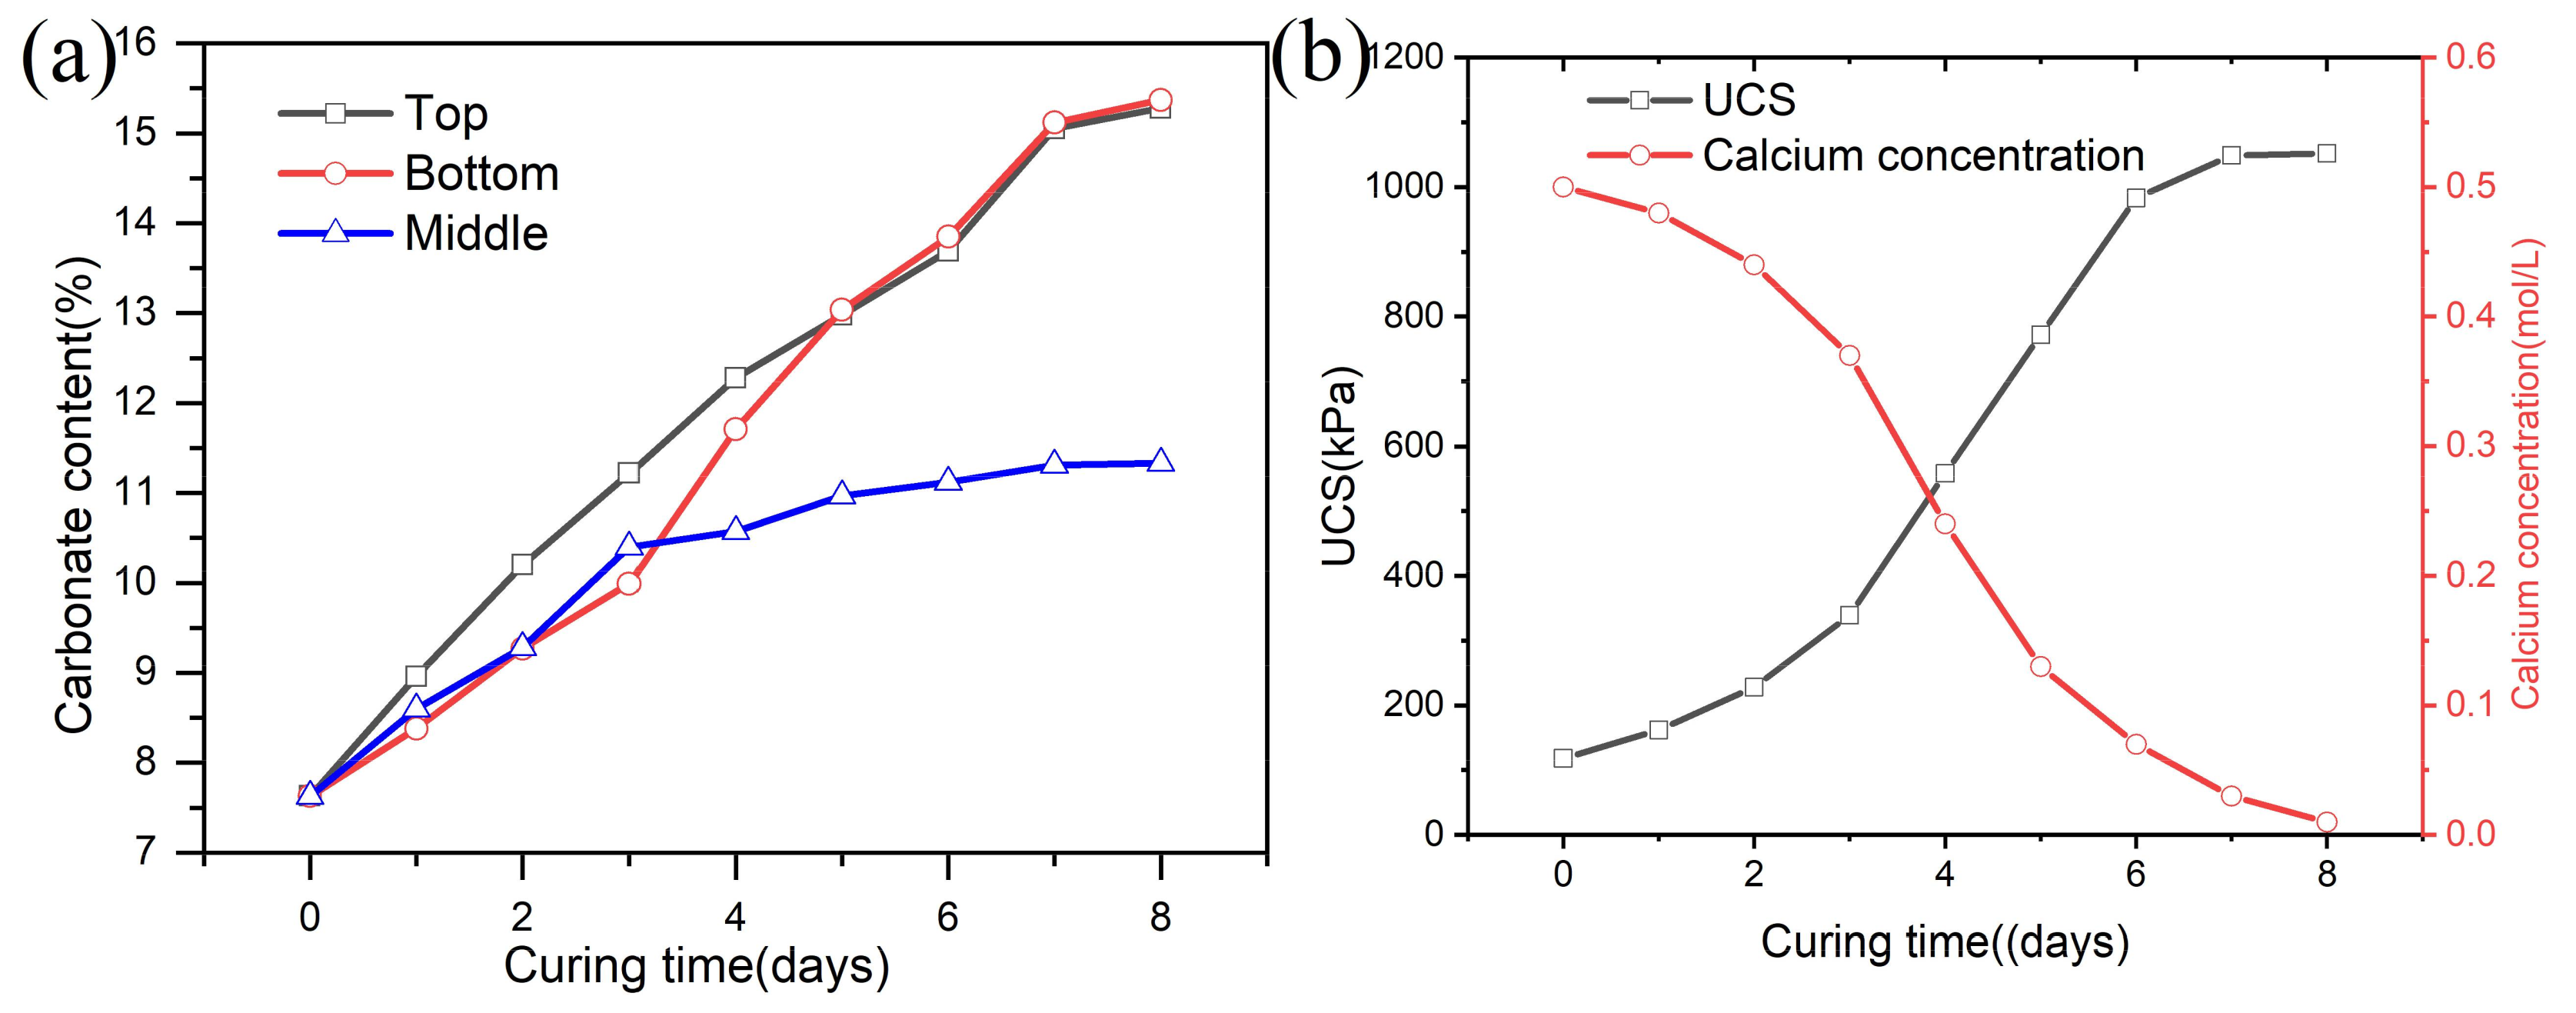
| Curing Time (Days) | Carbonate Content (%) | Calcium Concentration of CSS (mol/L) | |||
|---|---|---|---|---|---|
| Top | Bottom | Middle | UCS (kPa) | ||
| 0 | 7.63 | 7.63 | 7.63 | 118 | 0.50 |
| 1 | 8.96 | 8.38 | 8.60 | 162 | 0.48 |
| 2 | 10.20 | 9.27 | 9.28 | 228 | 0.44 |
| 3 | 11.22 | 9.99 | 10.40 | 339 | 0.37 |
| 4 | 12.28 | 11.71 | 10.57 | 558 | 0.24 |
| 5 | 12.98 | 13.04 | 10.97 | 772 | 0.13 |
| 6 | 13.69 | 13.85 | 11.12 | 983 | 0.07 |
| 7 | 15.05 | 15.12 | 11.31 | 1049 | 0.03 |
| 8 | 15.28 | 15.37 | 11.33 | 1052 | 0.01 |
Publisher’s Note: MDPI stays neutral with regard to jurisdictional claims in published maps and institutional affiliations. |
© 2021 by the authors. Licensee MDPI, Basel, Switzerland. This article is an open access article distributed under the terms and conditions of the Creative Commons Attribution (CC BY) license (https://creativecommons.org/licenses/by/4.0/).
Share and Cite
Wang, Y.; Li, C.; Wang, C.; Gao, Y. Improving the Erosion Resistance Performance of Pisha Sandstone Weathered Soil Using MICP Technology. Crystals 2021, 11, 1112. https://doi.org/10.3390/cryst11091112
Wang Y, Li C, Wang C, Gao Y. Improving the Erosion Resistance Performance of Pisha Sandstone Weathered Soil Using MICP Technology. Crystals. 2021; 11(9):1112. https://doi.org/10.3390/cryst11091112
Chicago/Turabian StyleWang, Yanxing, Chi Li, Cuiyan Wang, and Yu Gao. 2021. "Improving the Erosion Resistance Performance of Pisha Sandstone Weathered Soil Using MICP Technology" Crystals 11, no. 9: 1112. https://doi.org/10.3390/cryst11091112
APA StyleWang, Y., Li, C., Wang, C., & Gao, Y. (2021). Improving the Erosion Resistance Performance of Pisha Sandstone Weathered Soil Using MICP Technology. Crystals, 11(9), 1112. https://doi.org/10.3390/cryst11091112