Article

Texture and Microstructure Evolution of Ultra-High Purity Cu-0.1Al Alloy under Different Rolling Methods

1
College of Materials Science and Engineering, Chongqing University, Chongqing 400044, China
2
Electron Microscopy Center, Chongqing University, Chongqing 400044, China
3
School of Metallurgy and Material Engineering, Chongqing University of Science and Technology, Chongqing 400054, China
*
Authors to whom correspondence should be addressed.
Crystals 2021, 11(9), 1113; https://doi.org/10.3390/cryst11091113
Submission received: 16 August 2021 / Revised: 5 September 2021 / Accepted: 9 September 2021 / Published: 13 September 2021

Abstract

:
The microstructure and texture distribution of ultra-high purity Cu-0.1Al alloy target play a key role in the quality of the sputtering film. The Cu-0.1Al alloy sheets were processed by unidirectional (UR) and cross rolling (CR), and X-ray diffraction (XRD), and electron backscatter diffraction (EBSD) technologies were adopted to observe the texture and microstructure evolution. XRD results reveal that the texture types vary greatly in UR and CR due to the change of strain path. As the strain increases to 90%, S texture occupies the most, followed by copper texture in the UR sample, while brass texture dominates the most in the CR sample. Additionally, the orientation density of texture does not increase significantly with the increase of strain but shows a downward trend both in UR and CR modes. EBSD analysis demonstrates that compared with UR, the deformation microstructure in CR is more uniform, and the layer spacing between the deformation bands is smaller, which can reduce the local-region stress concentration. After the completion of recrystallization, the difference in average grain size between the UR and CR-annealed samples is not significant, and the recrystallized grains become much finer with the increase of strain, while more equiaxed grains can be observed in CR-annealed samples.

1. Introduction

Copper (Cu) instead of aluminum (Al) shows more promising potentials to be metallization materials in the integrated circuit industry because of its advantages of nano-size wiring width [1]. Moreover, Cu has a lower resistivity and higher thermal conductivity and electromigration resistance, as compared with Al [2,3]. Therefore, Cu, as an excellent interconnect material, can reduce delays and improve computing efficiency, and also ensure the reliability of integrated circuits [4].
Cu thin film, used as the basic component, can greatly affect the performances of integrated circuits, which also indicates the possible directions to optimize the properties of devices by improving the quality of the Cu film. Among numerous factors changing the quality of the thin film, the sputtering target with features of high purity, grain refinement, random orientations, and large scale should be considered primarily due to the following reasons: (i) Only Cu and Cu alloy targets with purities of 6 N or above can well ensure the uniformity of sputtering film and the fine wiring quality [5]; (ii) the finer the grain is, the faster the sputtering rate is, while the more homogeneous grain size has more uniform deposition rate and sputtering film [6,7]; (iii) for face-centered cubic (FCC) metals, the sputtering rate is S(111) > S(100) > S(110) [8,9], while the atomic line density is L(110) > L(100) > L(111), indicating that the random crystallographic orientations of the sputtering target can improve the uniformity of film [7,10,11]. Clearly, the uniform and fine grain size combined with random orientations in the target can improve the quality of the sputtering film.
Adding one or more alloying elements such as Al and manganese (Mn) appropriately to high-purity Cu can better regulate the grain size and guarantee the size uniformity of the Cu target, and it can also improve strength and stability. Alloying can prevent defects such as electromigration, stress migration, corrosion, and oxidation of the high-purity Cu while still maintaining good conductivity. However, less attention has been paid to the texture and microstructure of ultra-high purity Cu–Al alloys (99.9999%) used in sputtering targets.
The change of the strain path in plastic deformation plays an important role in the deformed microstructure and texture, and subsequent recrystallization behavior [12,13,14]. Kong et al. [15] adopted unidirectional and 90° cross rolling to process AA3105 Al alloy. Their results demonstrated that the texture types formed in 90° cross rolling and unidirectional rolling were quite different, i.e., strong ND rotating β fiber texture was formed in cross rolling samples, and the recrystallization texture was closely related to the deformation strain. Recently, our works in body-centered cubic (BCC) tantalum [7,16,17,18] showed that 135° cross rolling and asymmetric cross rolling [19,20] can effectively improve the texture and microstructure uniformity, as compared with the unidirectional rolling. In this paper, ultra-high purity Cu–Al alloys were deformed to different reductions by unidirectional and cross rolling, and the microstructure and texture evolution of Cu–Al alloys during unidirectional/cross rolling and the subsequent annealing were comparatively studied.

2. Experimental Method

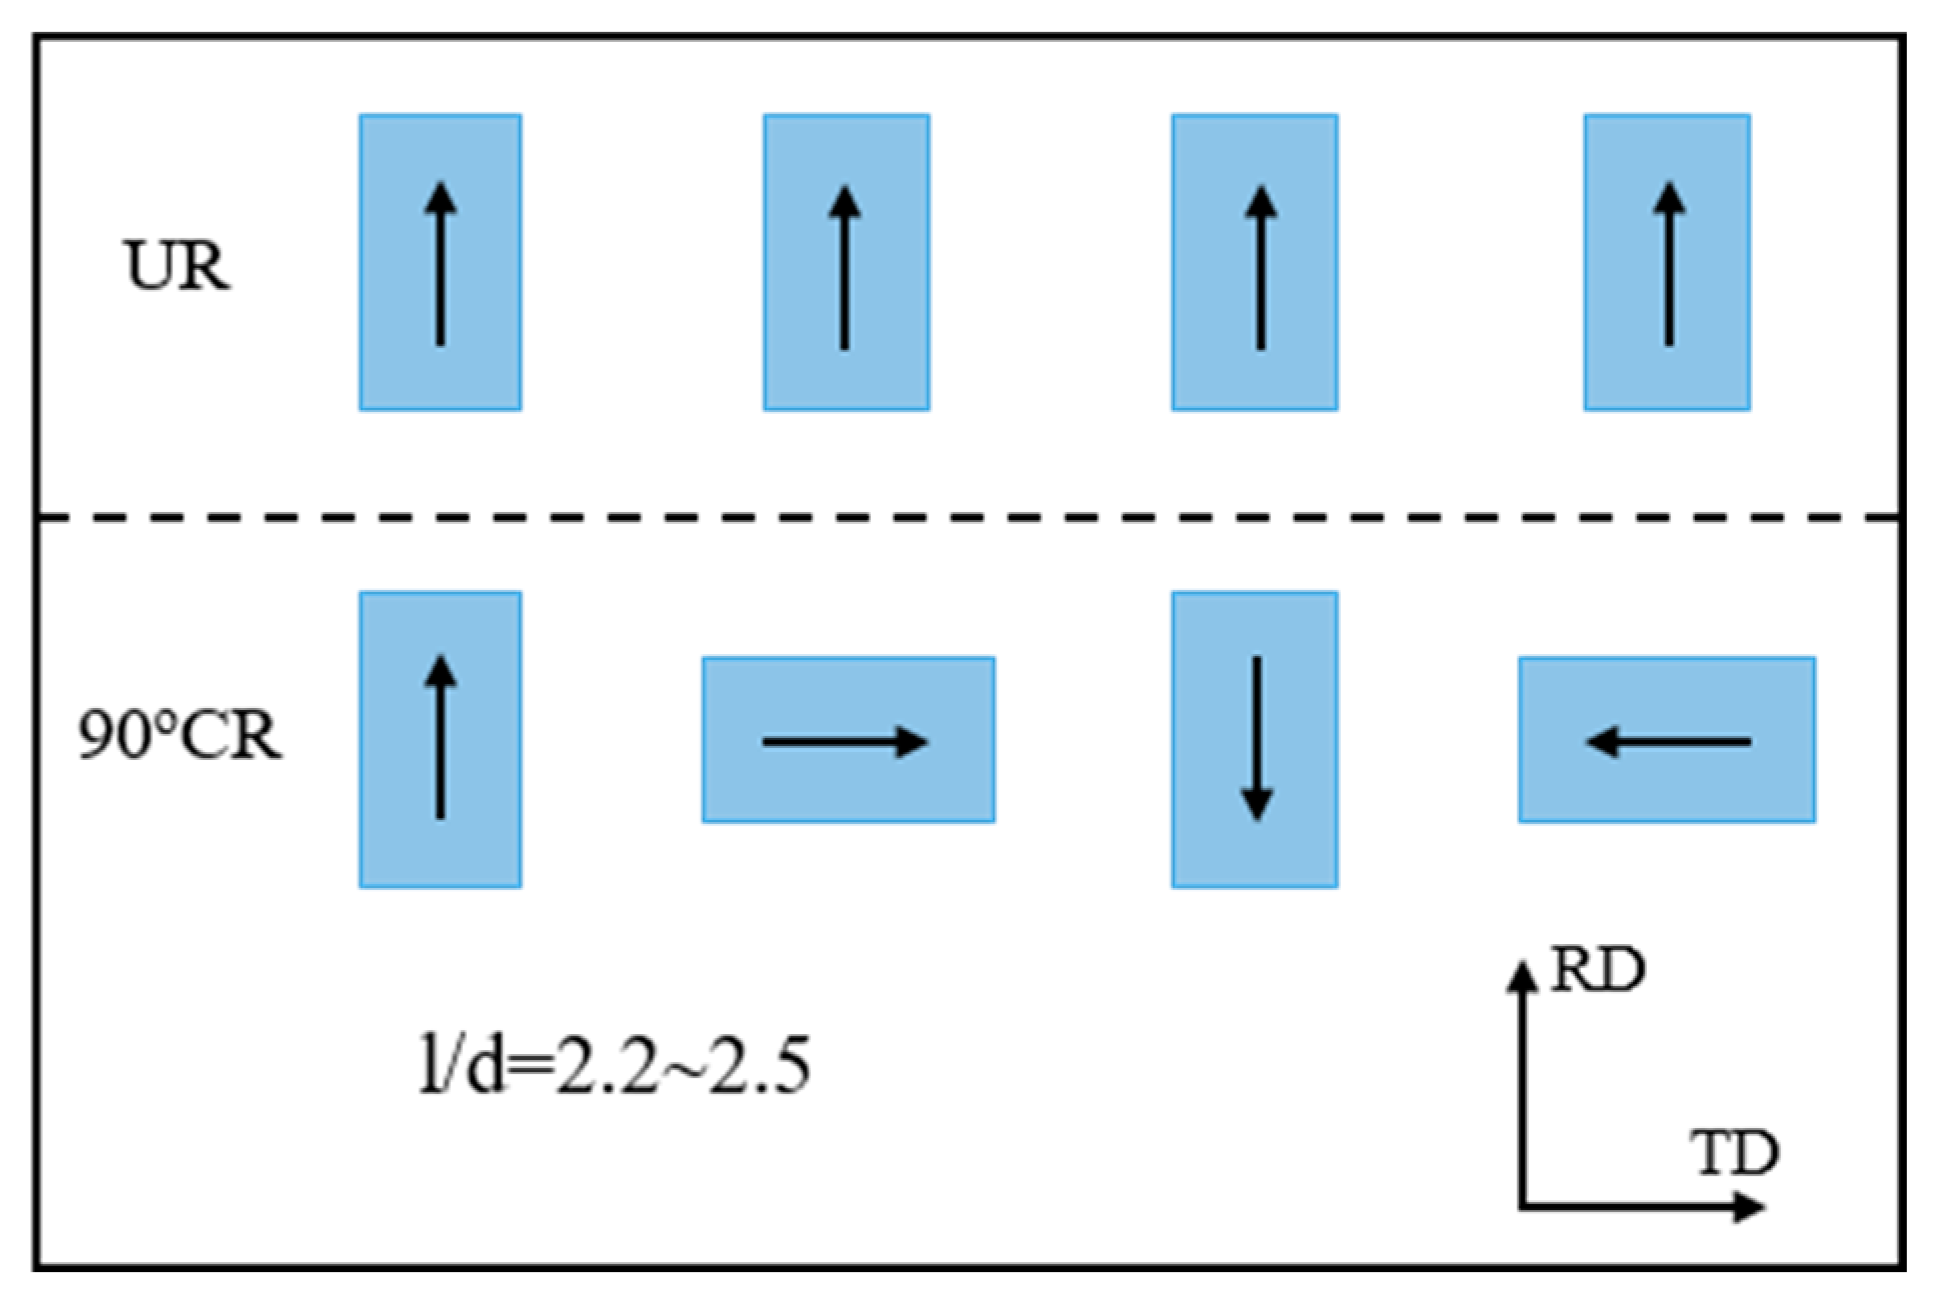
2.1. As-Received Materials and Rolling Experiment

Ultra-high purity Cu-0.1wt%Al (hereinafter referred to as Cu-0.1Al) ingot was prepared by electron beam melting (EBM), and the corresponding chemical composition is displayed in Table 1. Multidirectional warm forging combined with homogenizing treatment (annealed at 300 °C for 60 min) was adopted to break coarse columnar crystals in as-received Cu-0.1Al ingot and was then used in the rolling experiment.
Two rectangular plates (30 mmL × 20 mmW × 10 mmT) were cut from the Cu-0.1Al ingot. The first group was processed by unidirectional rolling (UR). During the UR process, the rolling direction (RD) remains unchanged. The other group was processed by 90° cross rolling (CR). In the CR process, the RD was rotated 90° clockwise in the horizontal plane relative to a previous pass. The rolling experiment was carried out at room temperature, and the detailed rolling parameters are summarized in Table 2. The schematic diagram of the metal-working process can be found in Figure 1. The roll diameter and the rolling rate is 170 mm and 0.2 m/s, respectively. It is worth noting that the deformation geometric parameter l/h is controlled between 2.0 and 2.5 to make the plate deform uniformly in the rolling process, where l is the length of contact between the rolls and the specimen, h is the average thickness of the sample for each rolling pass, and no lubricant is added in the rolling process.
The rolled samples were annealed at 300 °C for 60 min to observe the fully recrystallized texture and microstructure. Argon gas was used as a protective atmosphere during annealing, and the samples were air-cooled after the completion of annealing.

2.2. Characterization Methods

The macrotexture of the rolled sample was determined using an X-ray diffractometer (XRD, Rigaku D/max 2500PC, Tokyo, Japan). Cu Kα radiation was used in the test, and the accelerating voltage and current were 40 kV and 150 mA, respectively. Three incomplete pole figures {111}, {200}, and {220} were recorded using Schulz reflection method, and the orientation distribution function (ODF) was calculated using arbitrarily defined cells (ACD) method [21]. The sample surface for the XRD test was finely mechanically ground to obtain a mirror finish. The detection region is near the center layer in the RD-TD plane.
The microstructure of the samples was characterized by Tescan Mira 3 field-emission scanning electron microscope equipped with an electron backscatter diffraction (EBSD) detector. EBSD studies were carried out at an accelerating voltage of 20 kV and a working distance of 15 mm. The specimen surface was prepared by fine mechanical grinding and then was electropolished in a solution of 25 mL nitric acid, 25 mL alcohol, and 50 mL distilled water. The polishing voltage is 8 V, and the polishing time is about 20 s. The EBSD observation is near the sample center in the RD-ND plane.

3. Results and Discussion

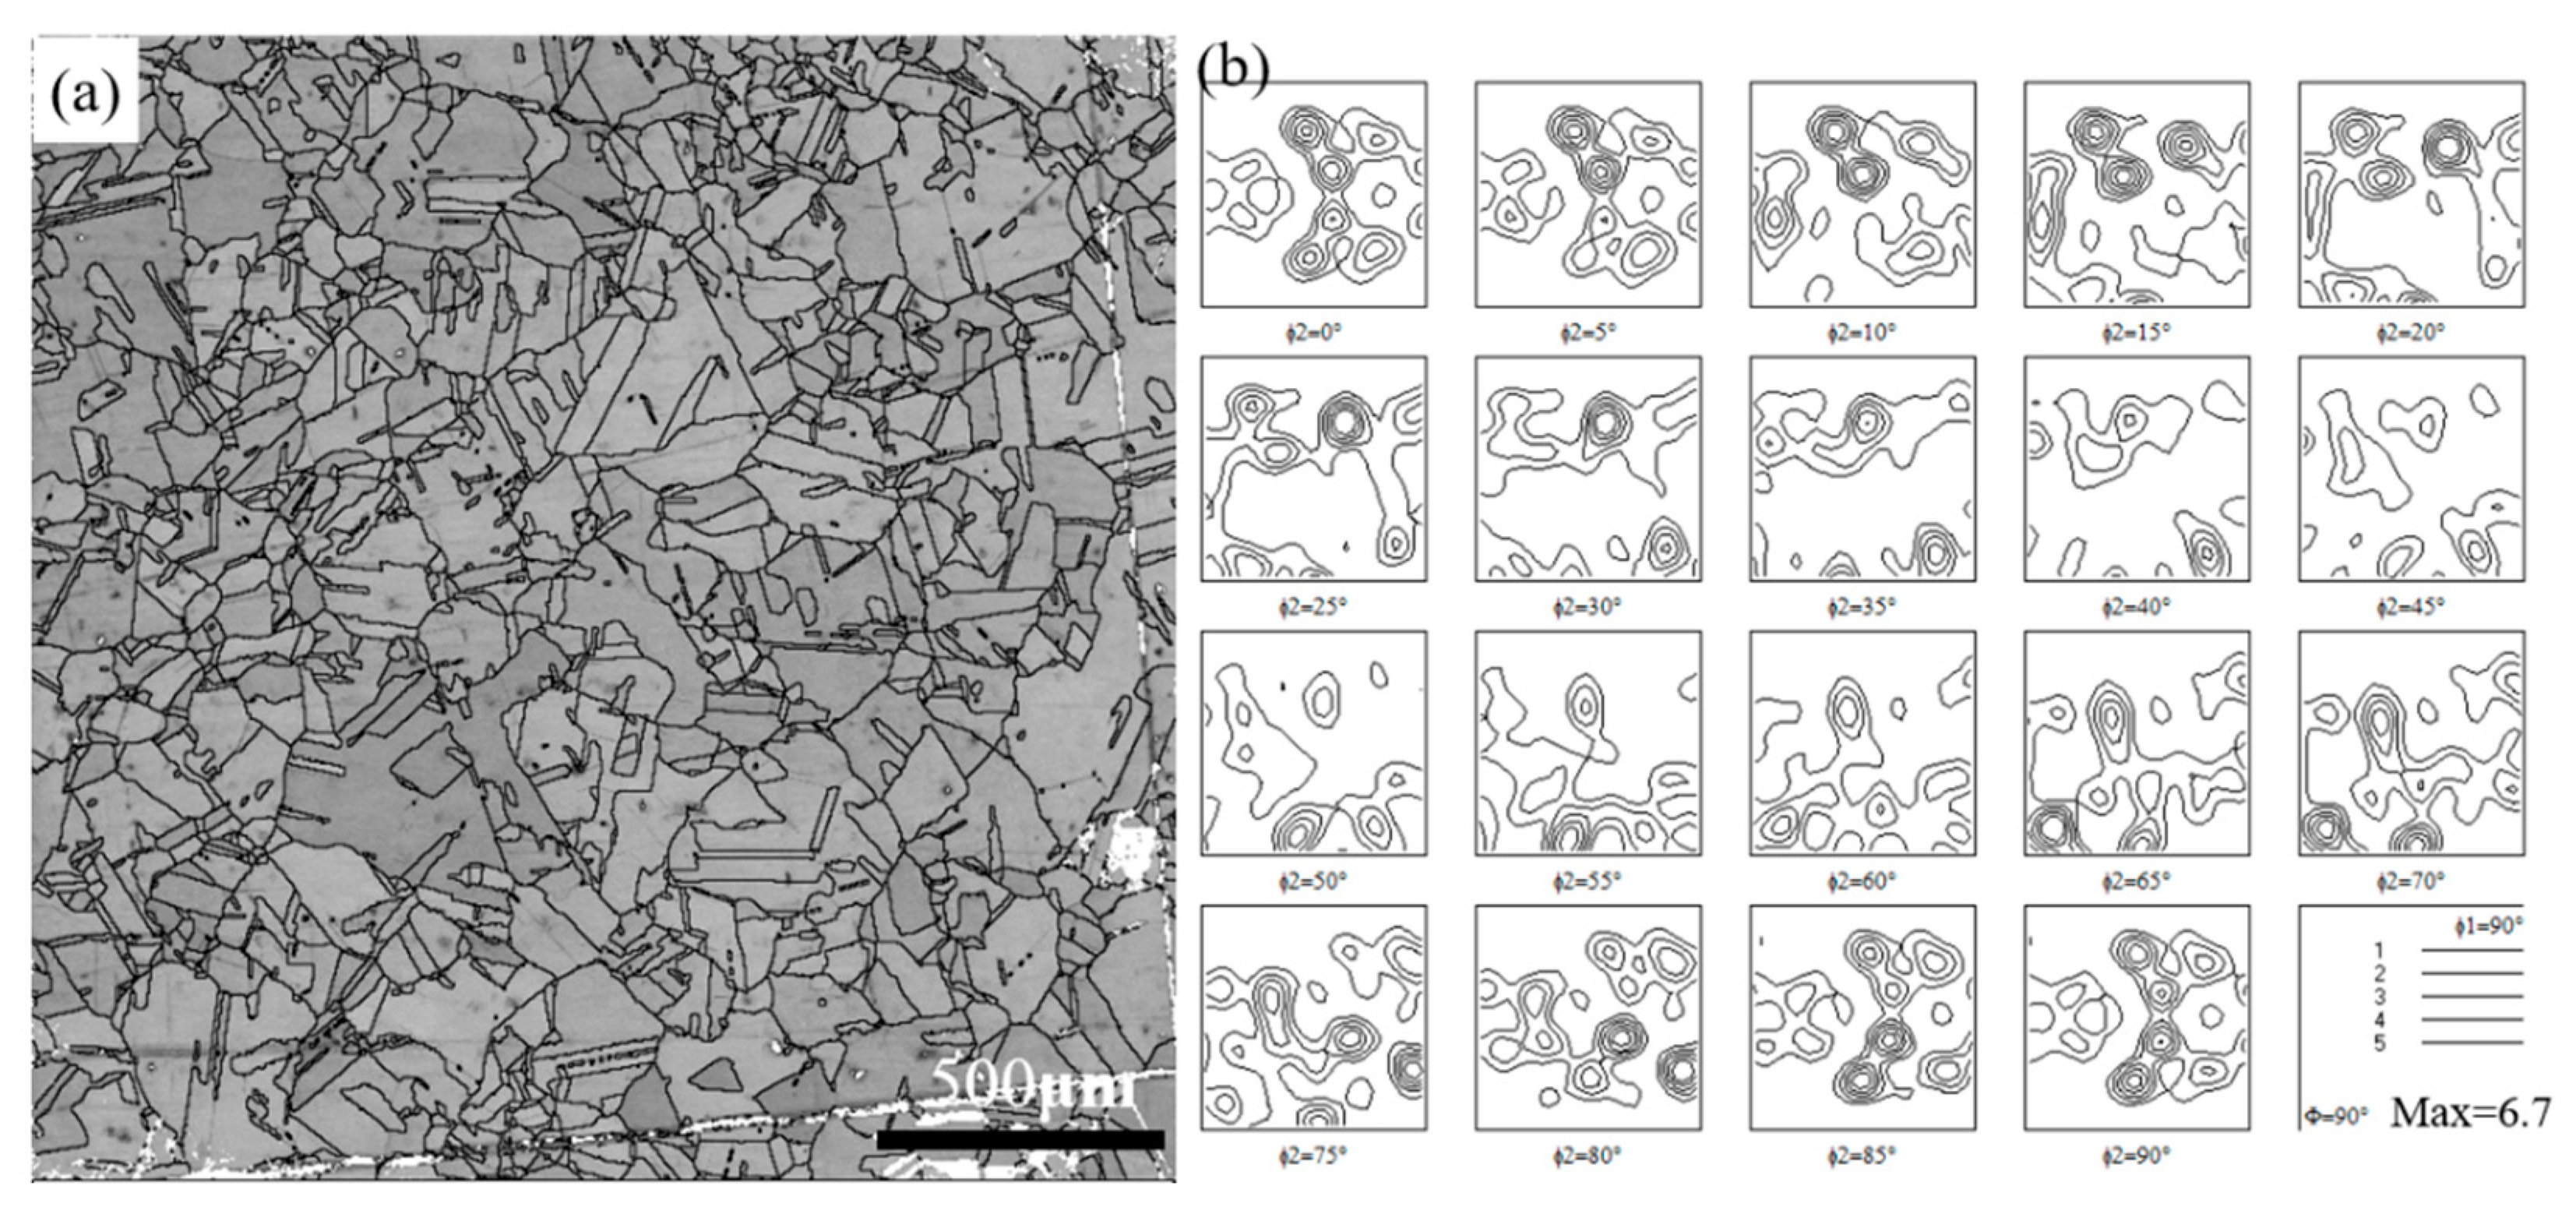
3.1. Initial Grain and Texture Distribution

The as-received microstructure of Cu-0.1Al plate processed by multi-directional warm forging combined with homogenizing annealing is presented in Figure 2. Cu-0.1Al ingot produced by EBM technology usually contains centimeter-scale columnar grains. Although multi-directional warm forging is used to break the initial as-cast columnar structure in Cu-0.1Al ingot, the grains are still unevenly distributed. The average grain size reaches 82 μm and numerous annealing twins can also be observed in the initial sample. As clearly displayed in Figure 2b, the crystal orientation of the initial sample is relatively centered in the local region, and the maximum texture intensity is 6.7.

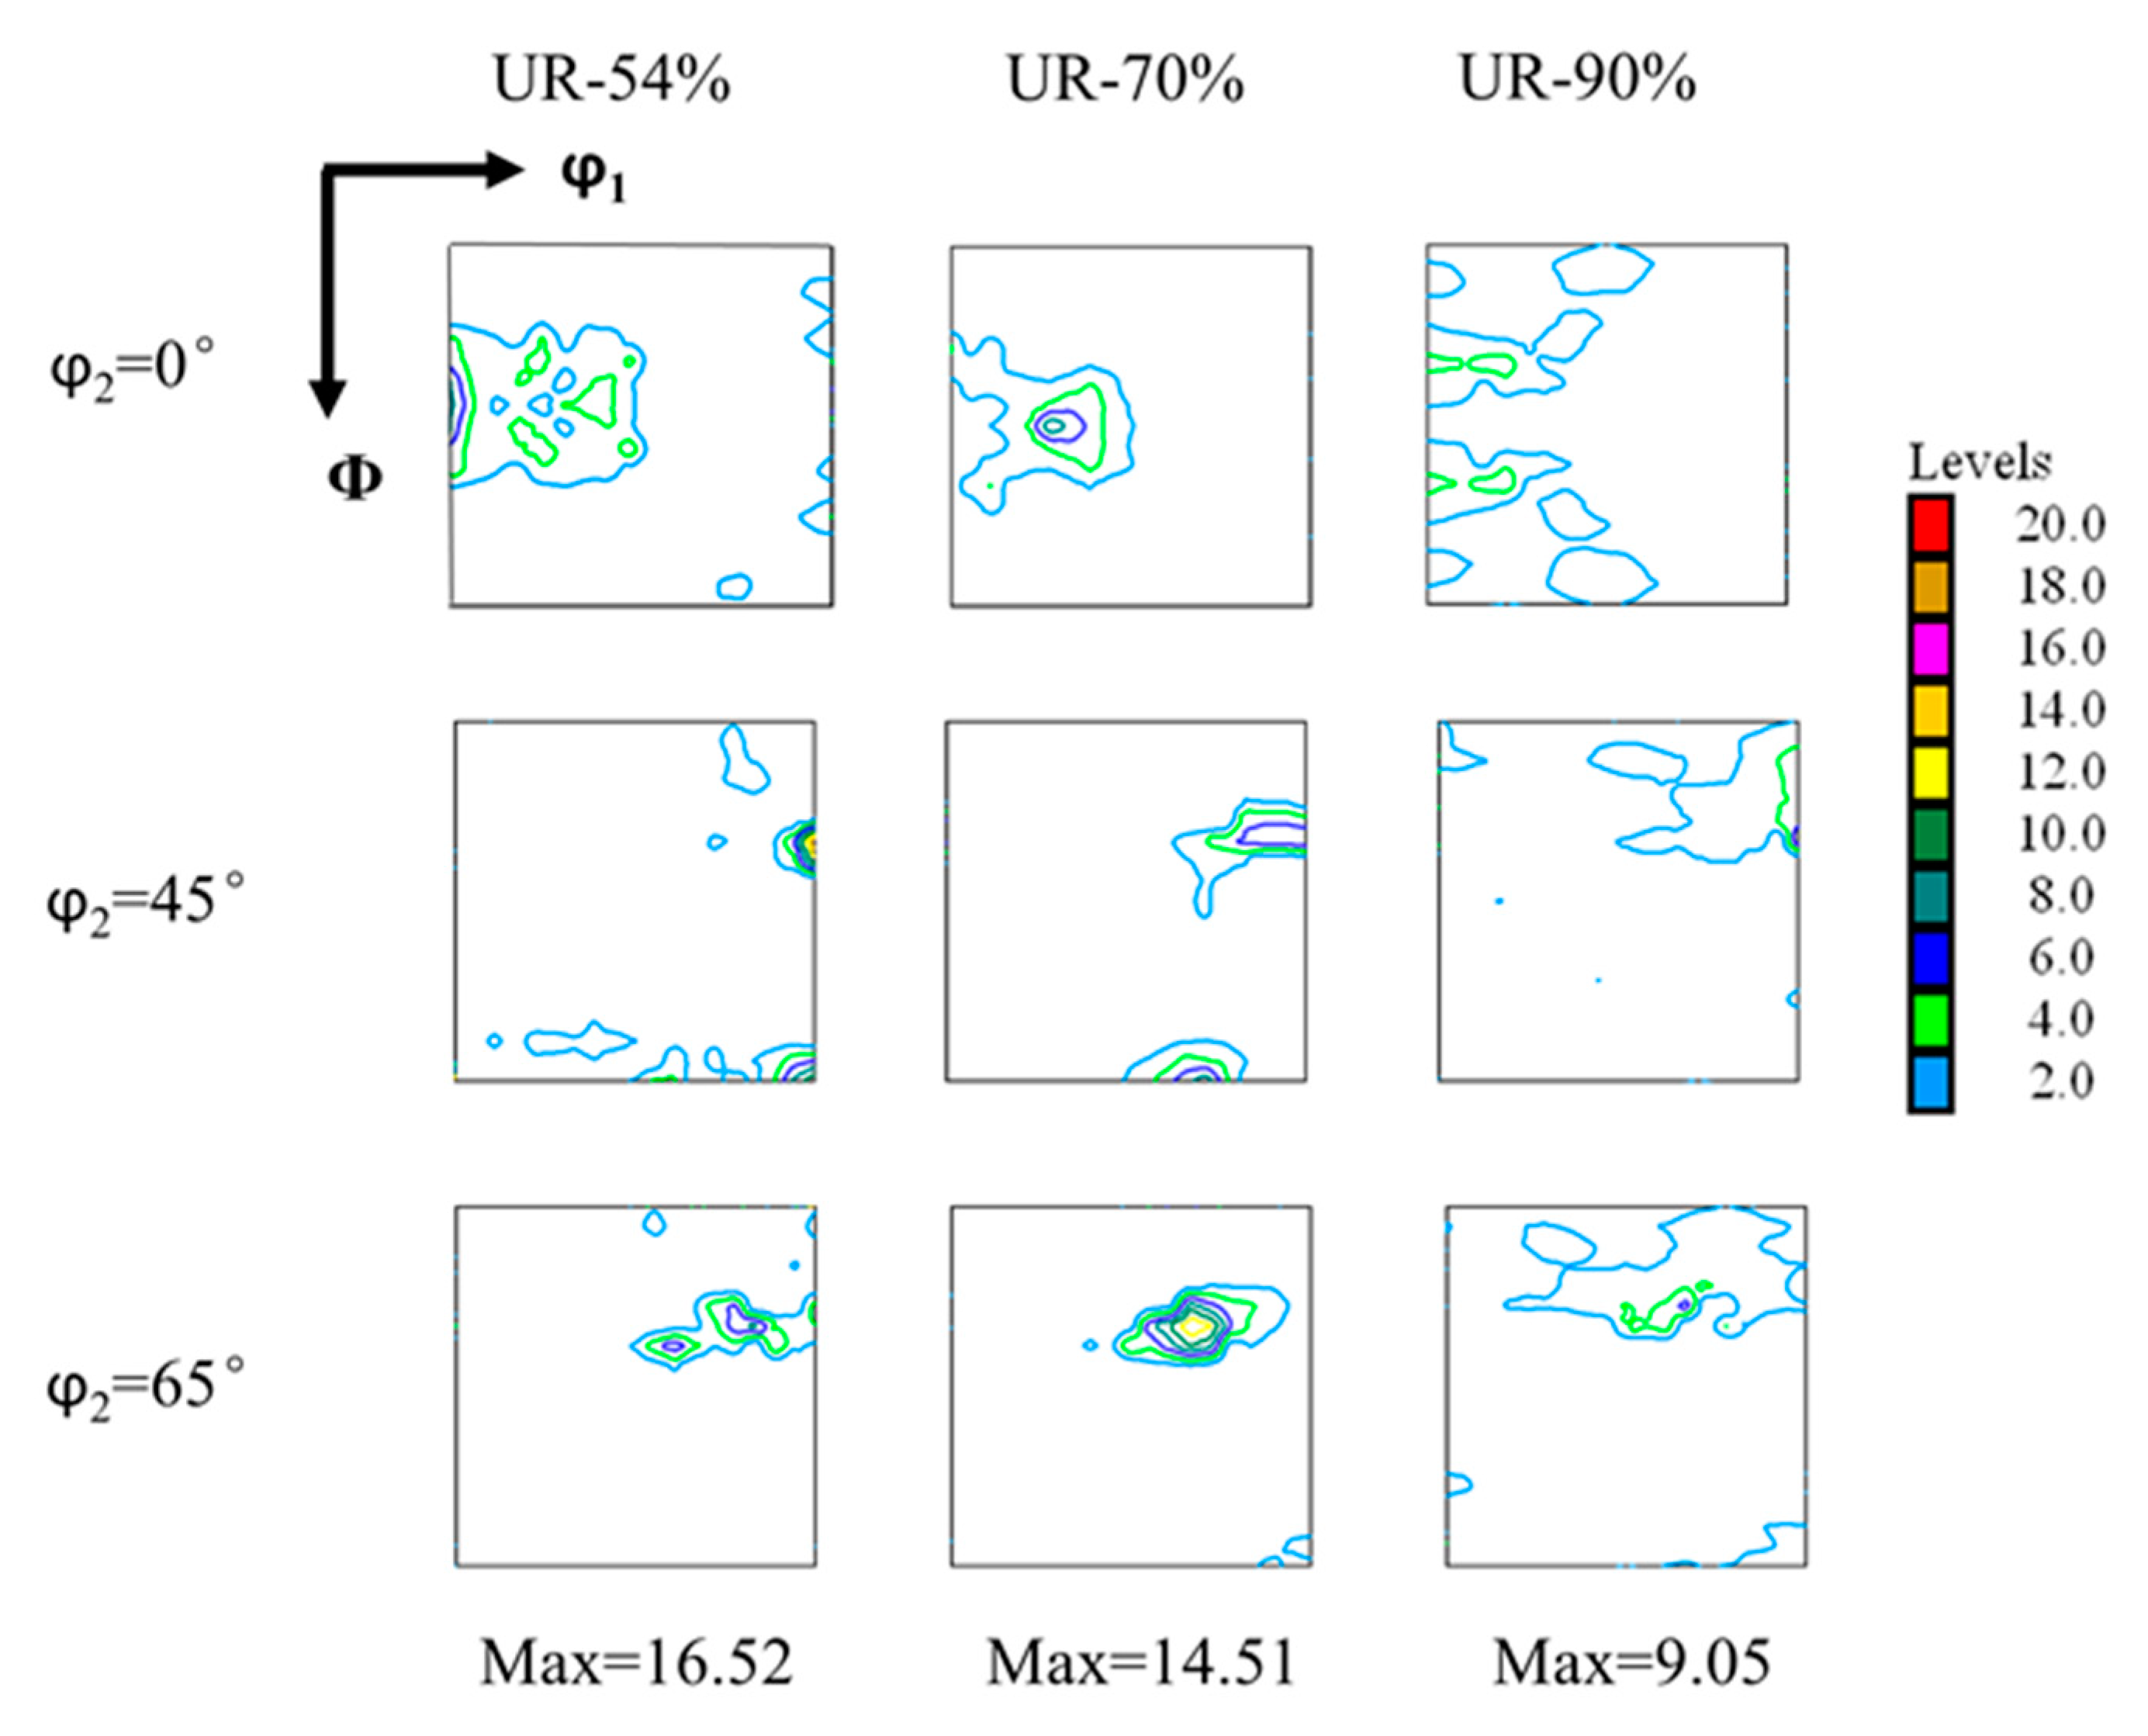
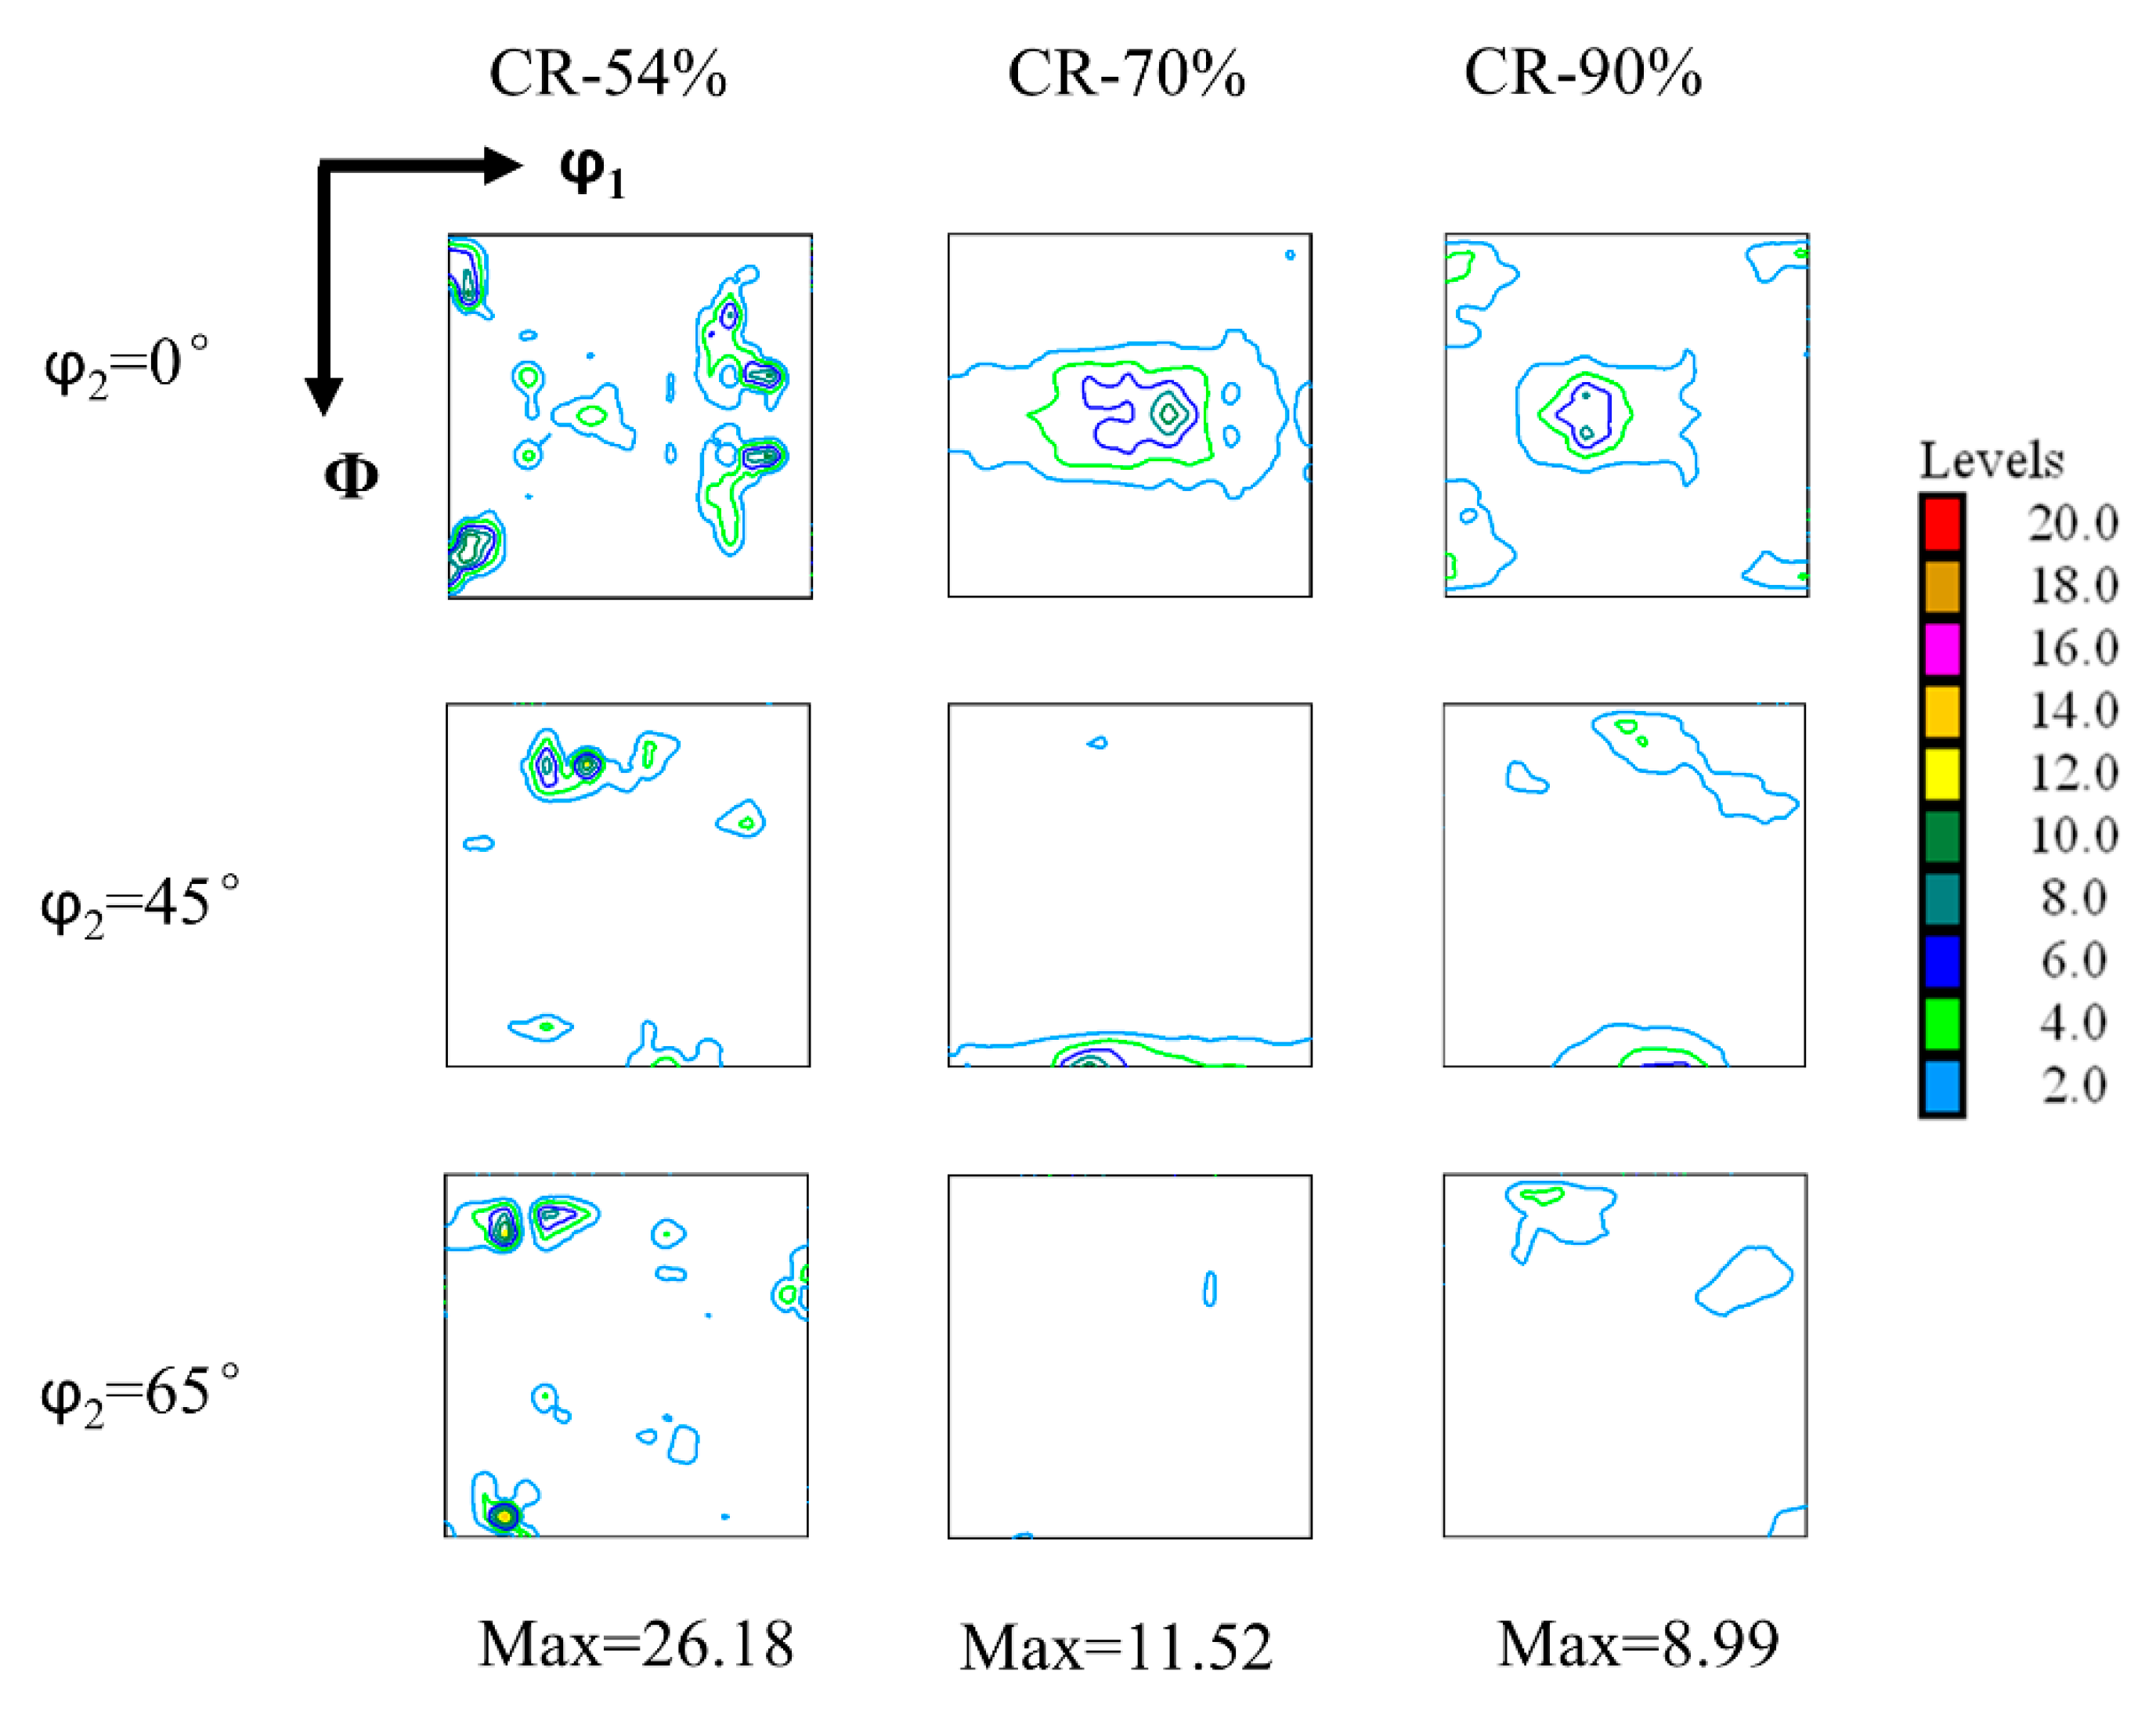
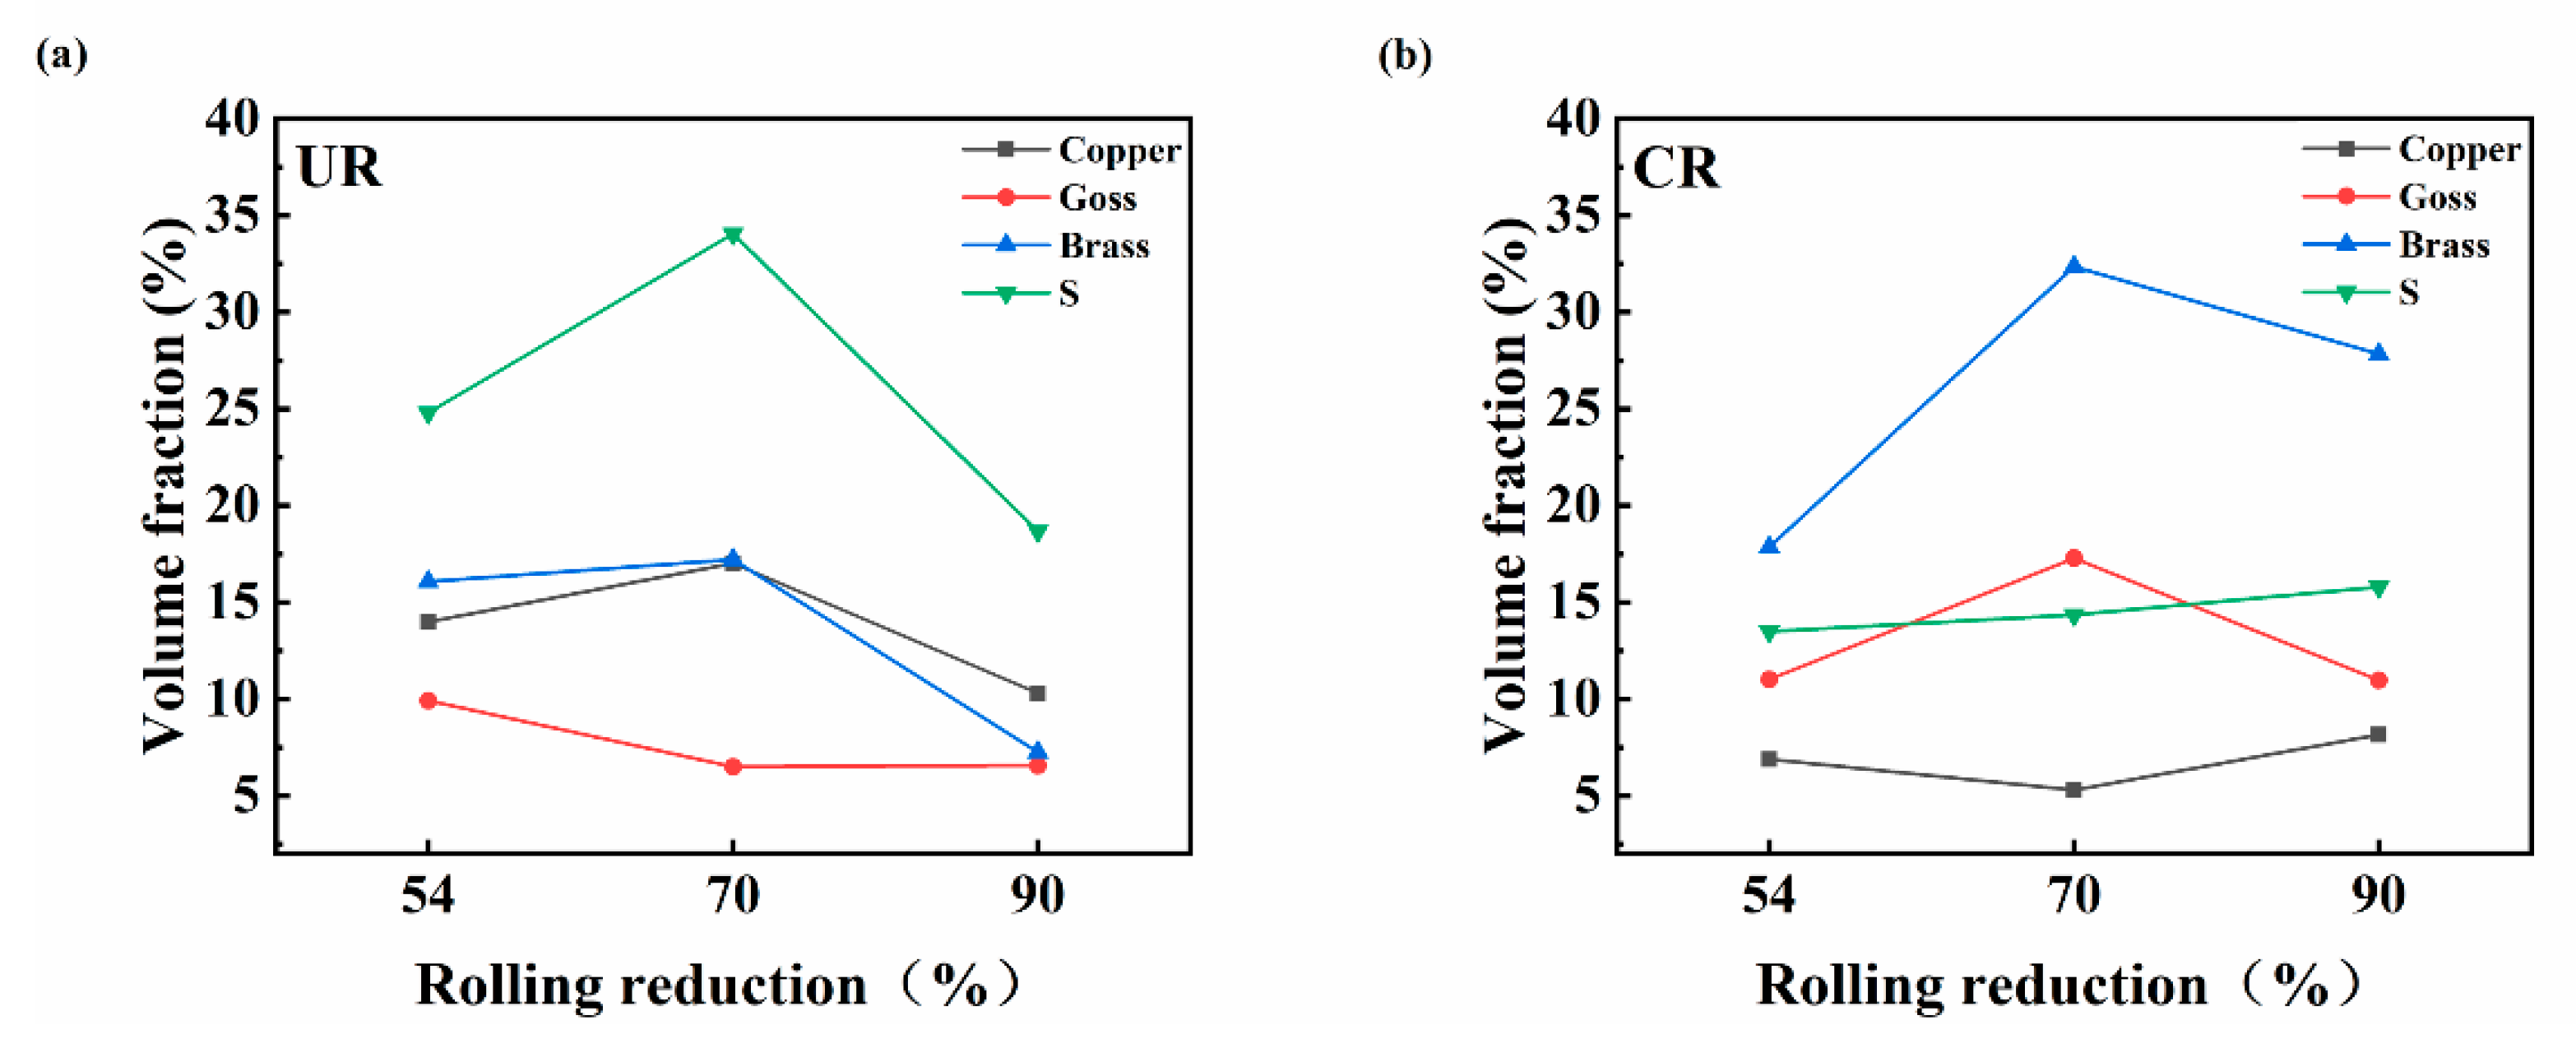
3.2. Deformation Texture Evolution

Figure 3 and Figure 4 are ODF sections (φ2 = 0°, 45°, 65°) of Cu-0.1Al alloy after unidirectional and cross rolling, respectively. The texture of the 54% UR sample is mainly Goss, brass, copper, and S textures, which are typical rolling textures of FCC metallic materials. The typical texture components, i.e., crystallographic orientations in ODF sections and corresponding Euler angles, are displayed in Figure 5 and Table 3, respectively. Among them, Goss and brass textures are scattered along the RD, and the copper texture has the highest intensity. After unidirectional rolling to 70% strain, the Goss texture is transformed into the brass texture, and the copper texture is weakened, but the S texture is enhanced. After deforming to 90%, in addition to the weak copper and S textures, cuberd texture is formed, and the orientation density value is reduced to 9.05, indicating the possible appearance of dynamic recrystallization in this sample. It can be observed that with the increase of strain, the sample is changed from Goss texture to brass and cuberd textures, and finally, under large deformation, the cuberd texture is transformed into cube texture.
In the 54% CR sample, the strong cuberd texture and relatively weak brass and S textures are retained. As compared with the 54% UR sample, the higher texture intensity in the 54% CR sample may be attributed to the partial inheritance of the initial texture and the greater shear strain, causing severe grain fragmentation during the UR process. As strain increases to 70%, the cuberd texture almost disappears, the Goss and brass textures spread along the RD with low orientation density, and the S texture is weakened. When deformation strain reaches 90%, the texture intensity is further reduced, and the maximum orientation density is close to 9. It is worthy to note that brass and S textures do not change significantly, and a small amount of copper texture is generated. It can be observed that the cube texture reappears in the 90% sample due to the occurrence of recrystallized nuclei. Clearly, under the cross-rolling deformation mode, with the increase of strain, the orientation density of the texture does not increase significantly but shows a downward trend. The reason is that the change of the strain path promotes the activation of more slip systems during the cross-rolling process, which is beneficial to weakening the texture intensity and reducing the anisotropy of the structure. Suwas et al. [22,23] also demonstrated that the modes of rolling have a significant effect on the texture evolution of pure Cu. Their results show that a strong Cu-type texture, i.e., {112} <111>, is formed in unidirectional rolling, but multi-step cross rolling exhibits a weak multi-component texture composed of P(BND), an S, and a cube component. The rolling texture components in high purity Cu-0.1Al alloy are different from that in purity Cu since the adding of a minor element, i.e., Al, can improve its strength and thus affects the texture evolution.
Figure 6 displays the quantitative statistics of the texture evolution under the two rolling methods. It can be seen from Figure 6a that under unidirectional rolling, the copper, brass, and S texture contents increase from low to medium deformation. As strain increases to 70%, the Goss texture is transformed into brass texture, and the content of each texture decreases when the strain increases to 90%. Under cross rolling mode, the content of brass and Goss texture increases from low to medium deformation. As the strain further increases to 90%, the content of brass and Goss textures decreases, while the content of copper and S textures is not affected significantly. In the cross-rolling process, due to the change of strain path, the rotation of grains in deformation is not easy to maintain continuity, resulting in the crystal orientation formed in the previous pass change in the subsequent rolling deformation [24], thus affecting the evolution of deformation texture in Cu-0.1Al alloy. Therefore, significant differences in texture component and content exist between the UR and CR samples. It is worthy to note that the addition of Al can reduce the stacking fault energy (SFE) of ultra-high purity Cu and meanwhile increase its strength. Additionally, with the increase of strain, the main deformation texture transits from copper and S textures to brass and S textures, which were also reported by previous research studies [25,26,27]. Engler [28] demonstrated that the addition of Mn in purity copper did not markedly change the SFE but increased the yield strength and promoted the formation of shear bands, thus affecting the deformation texture transition.

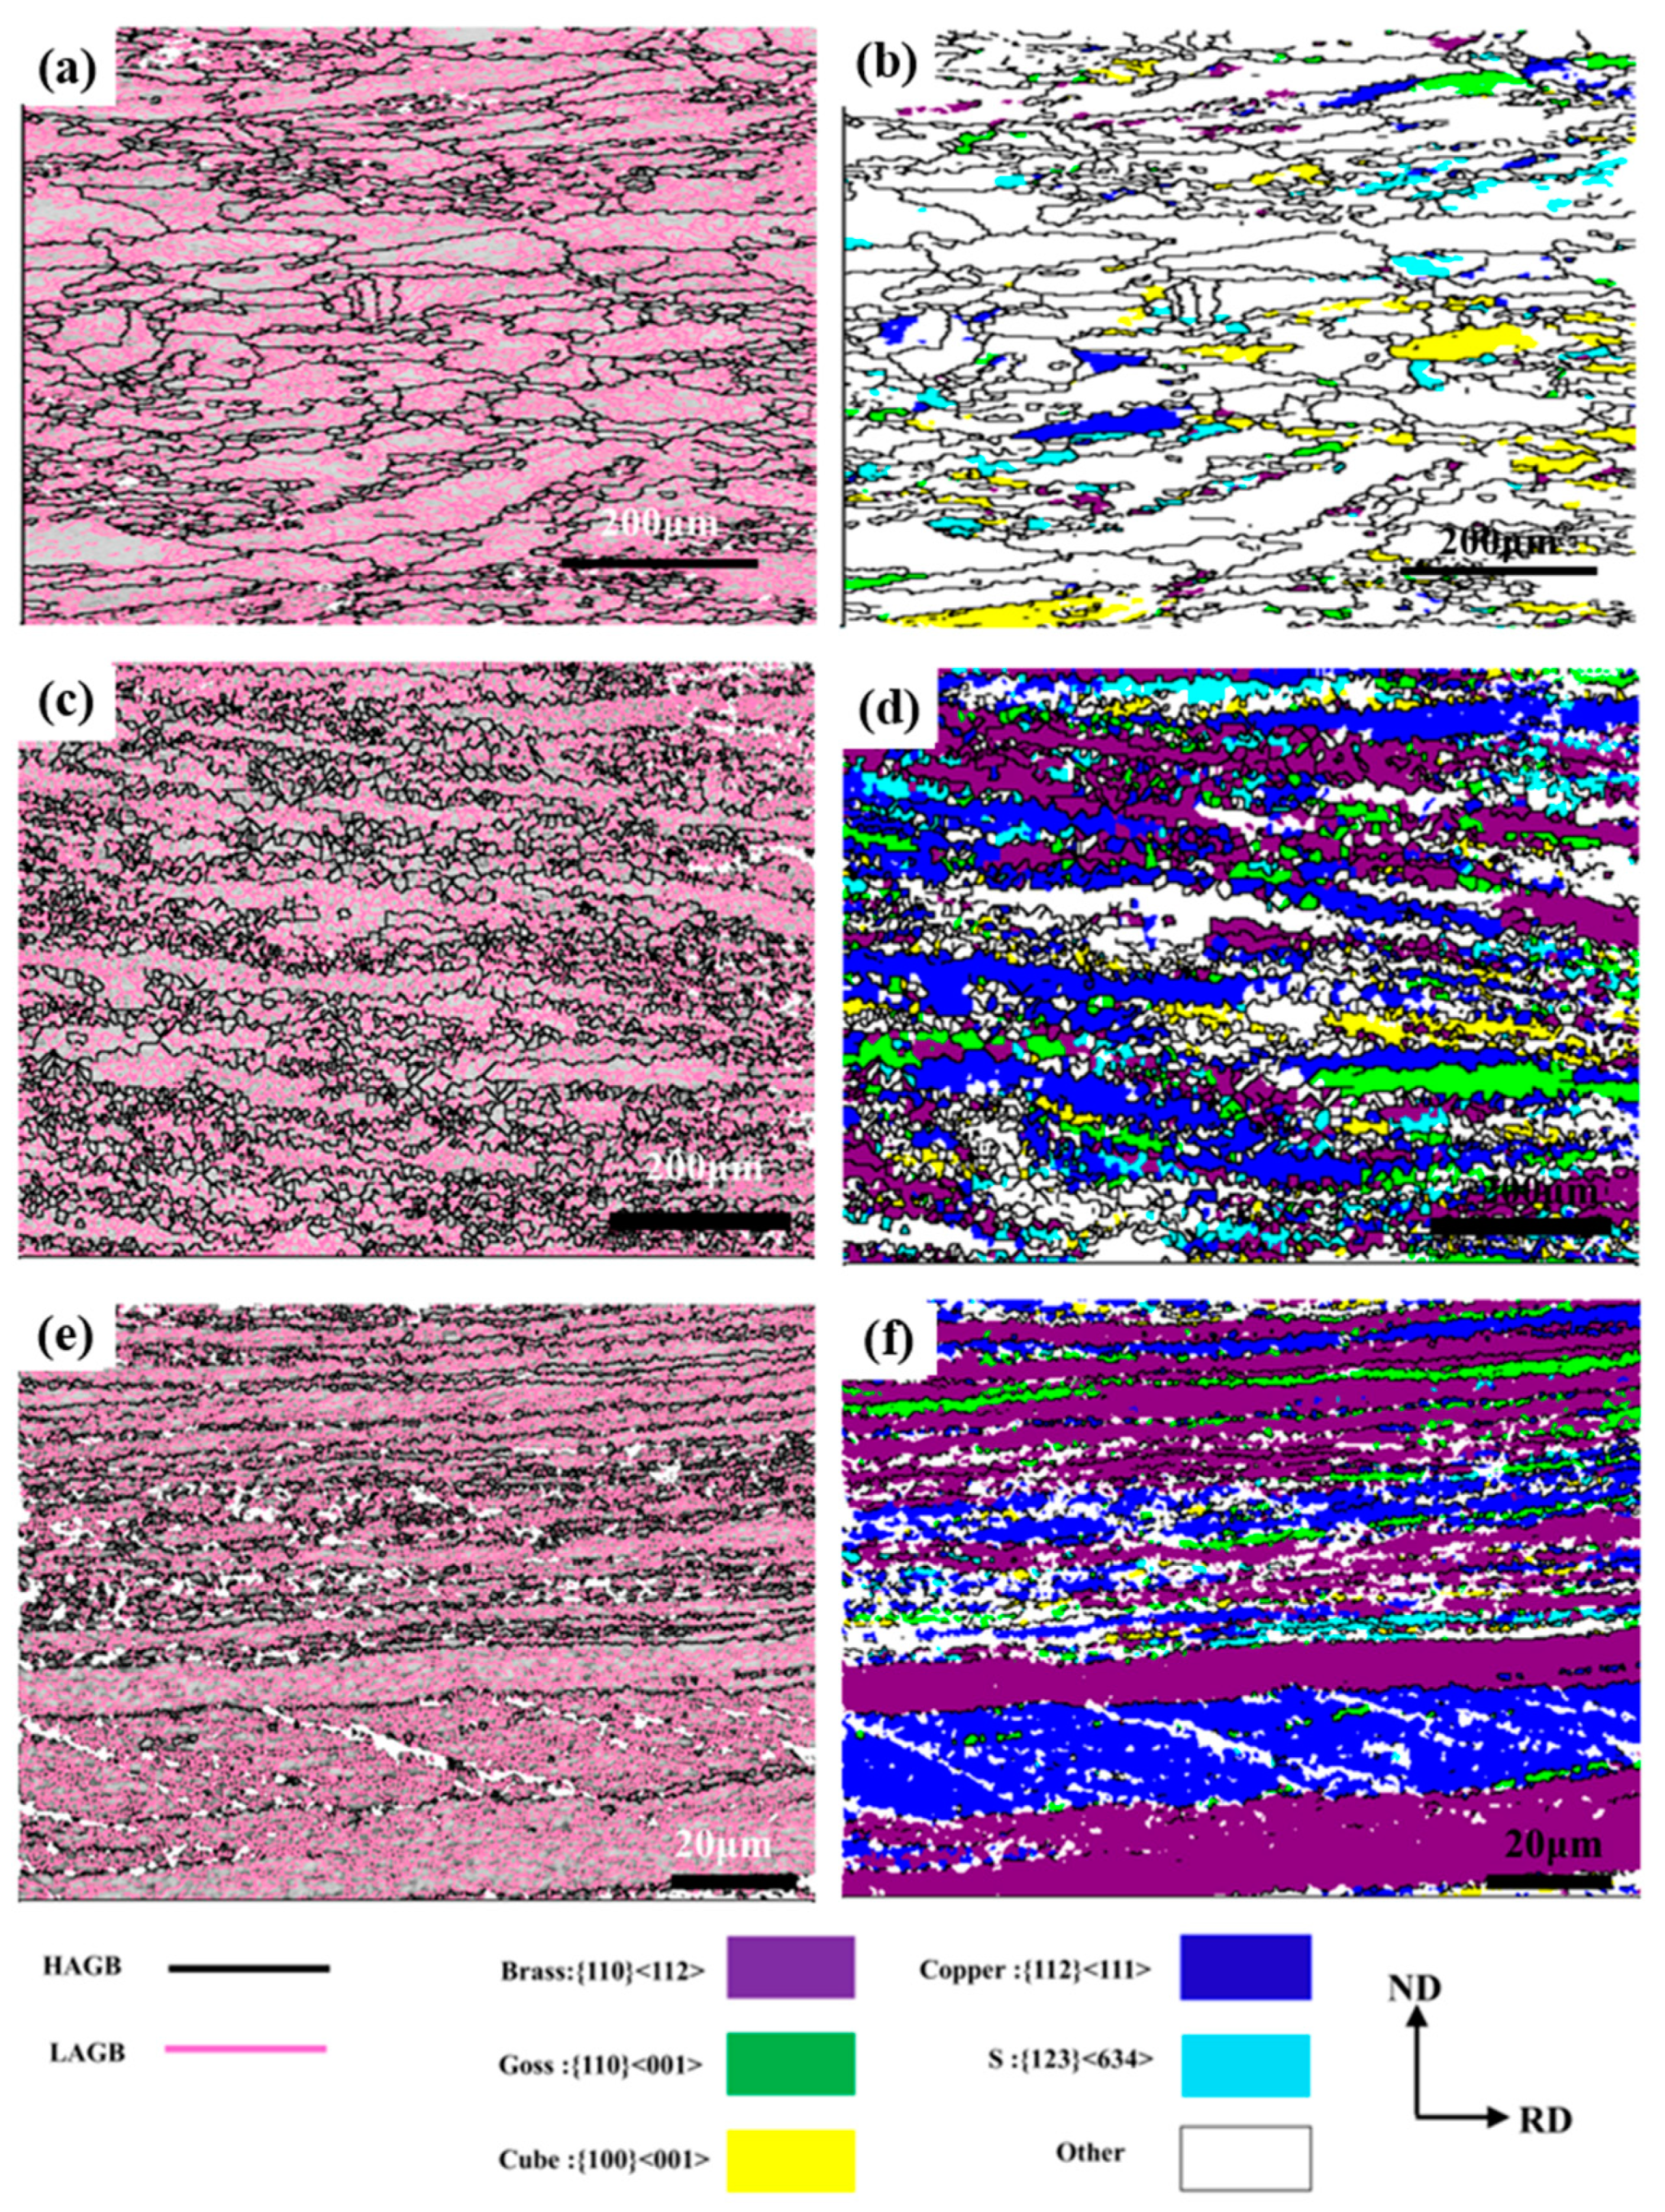
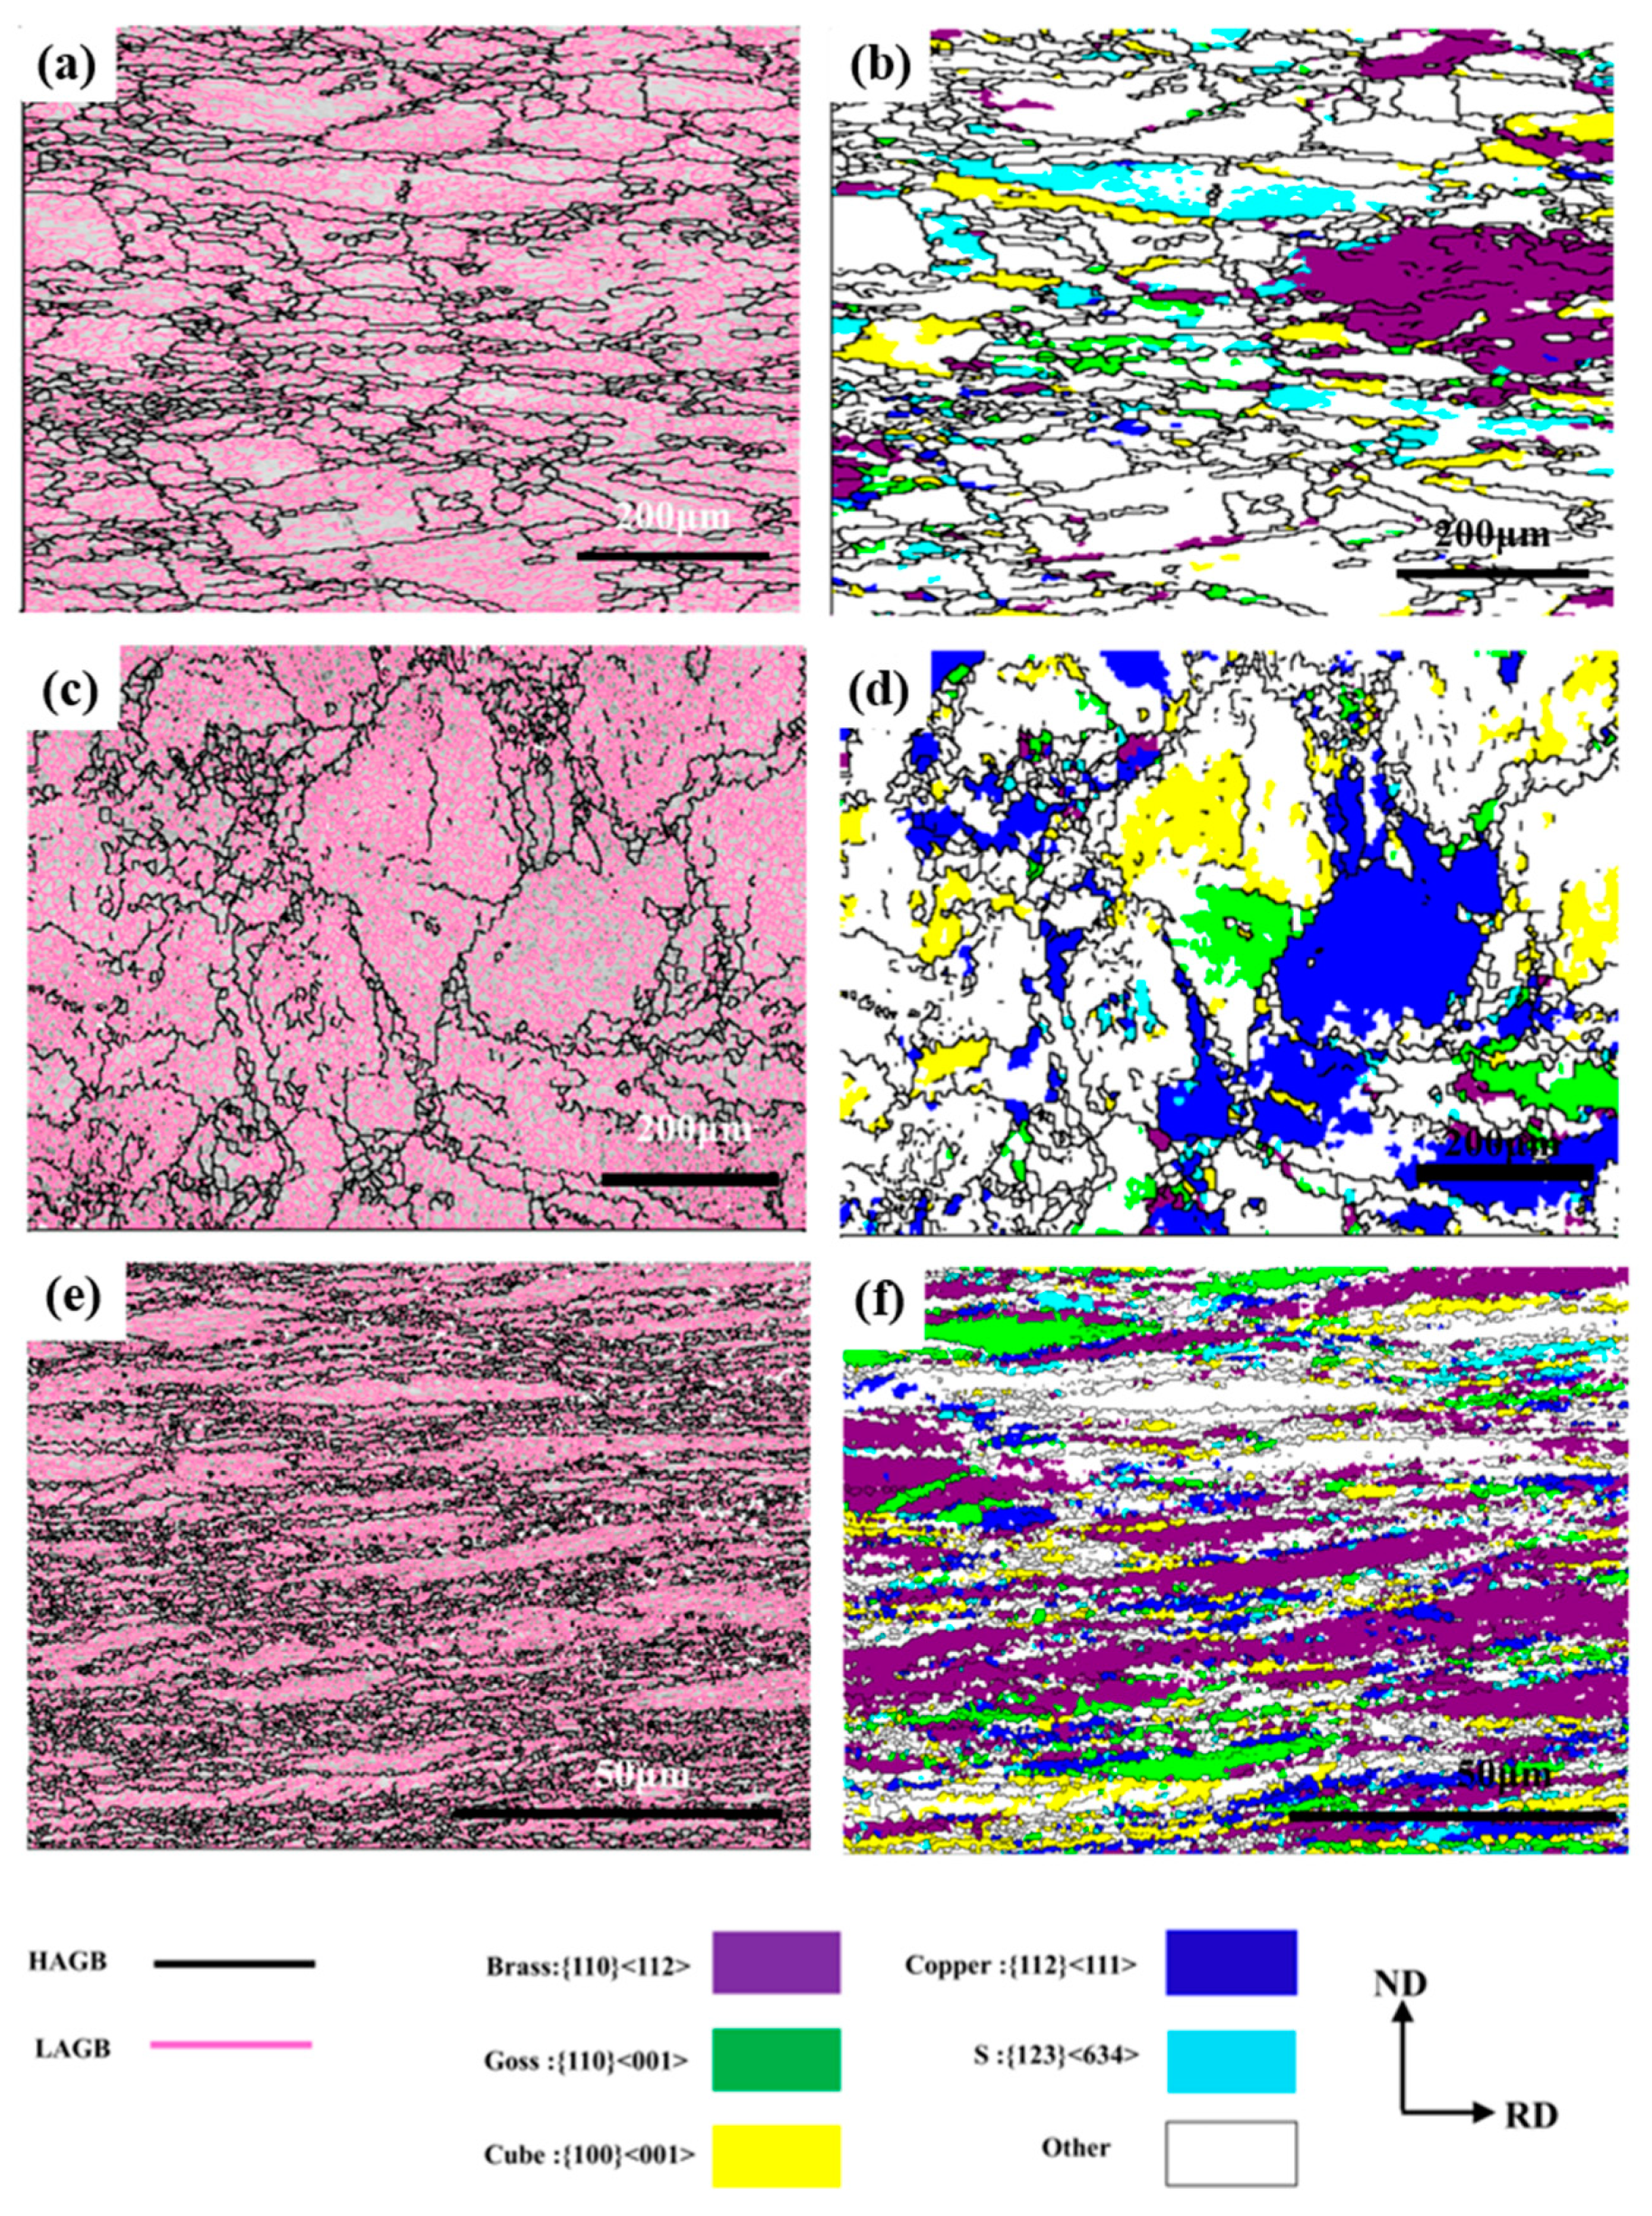
3.3. Deformation Microstructure

Figure 7 and Figure 8 display the grain boundary diagram and crystal orientation map of Cu-0.1Al alloy during unidirectional and cross rolling, respectively. As shown in Figure 7a, the lamellar structures in the 54% UR sample are mostly parallel to the RD, and the distribution of low-angle grain boundaries (2–15°) is uneven. With the strain up to 90%, a more completely lamellar structure along the RD is formed, and no obvious dynamic recrystallization occurs in the deformed matrix. Further observation revealed that some parallel microshear bands appeared in the deformed grains characterized as copper orientations. As displayed in Figure 8, the deformed microstructure in the CR sample consists mainly of “cellular structures” that are not completely parallel to the RD, especially for the 70% CR sample. It is worth noting that the low-angle grain boundaries within the deformed matrix in the 54% CR sample are lower, as compared with the 54% UR sample. Clearly, under the two rolling conditions, compared with the sample obtained by unidirectional rolling, the deformation microstructure of the sample processed by cross rolling is more uniform, and the layer spacing of the deformation band is smaller, which is not easy to cause local stress concentration [7,17,18]. With the increase of strain, grain fragmentation is more severe, especially for the UR sample. Due to the continuous change of strain direction, more slip systems can be activated in the cross rolling process. The increase of reaction between dislocations and substructures is beneficial to alleviate the local-region stress concentration, and the distribution of dislocations at grain boundaries is not more serious than that of unidirectional rolling at the same thickness reduction.

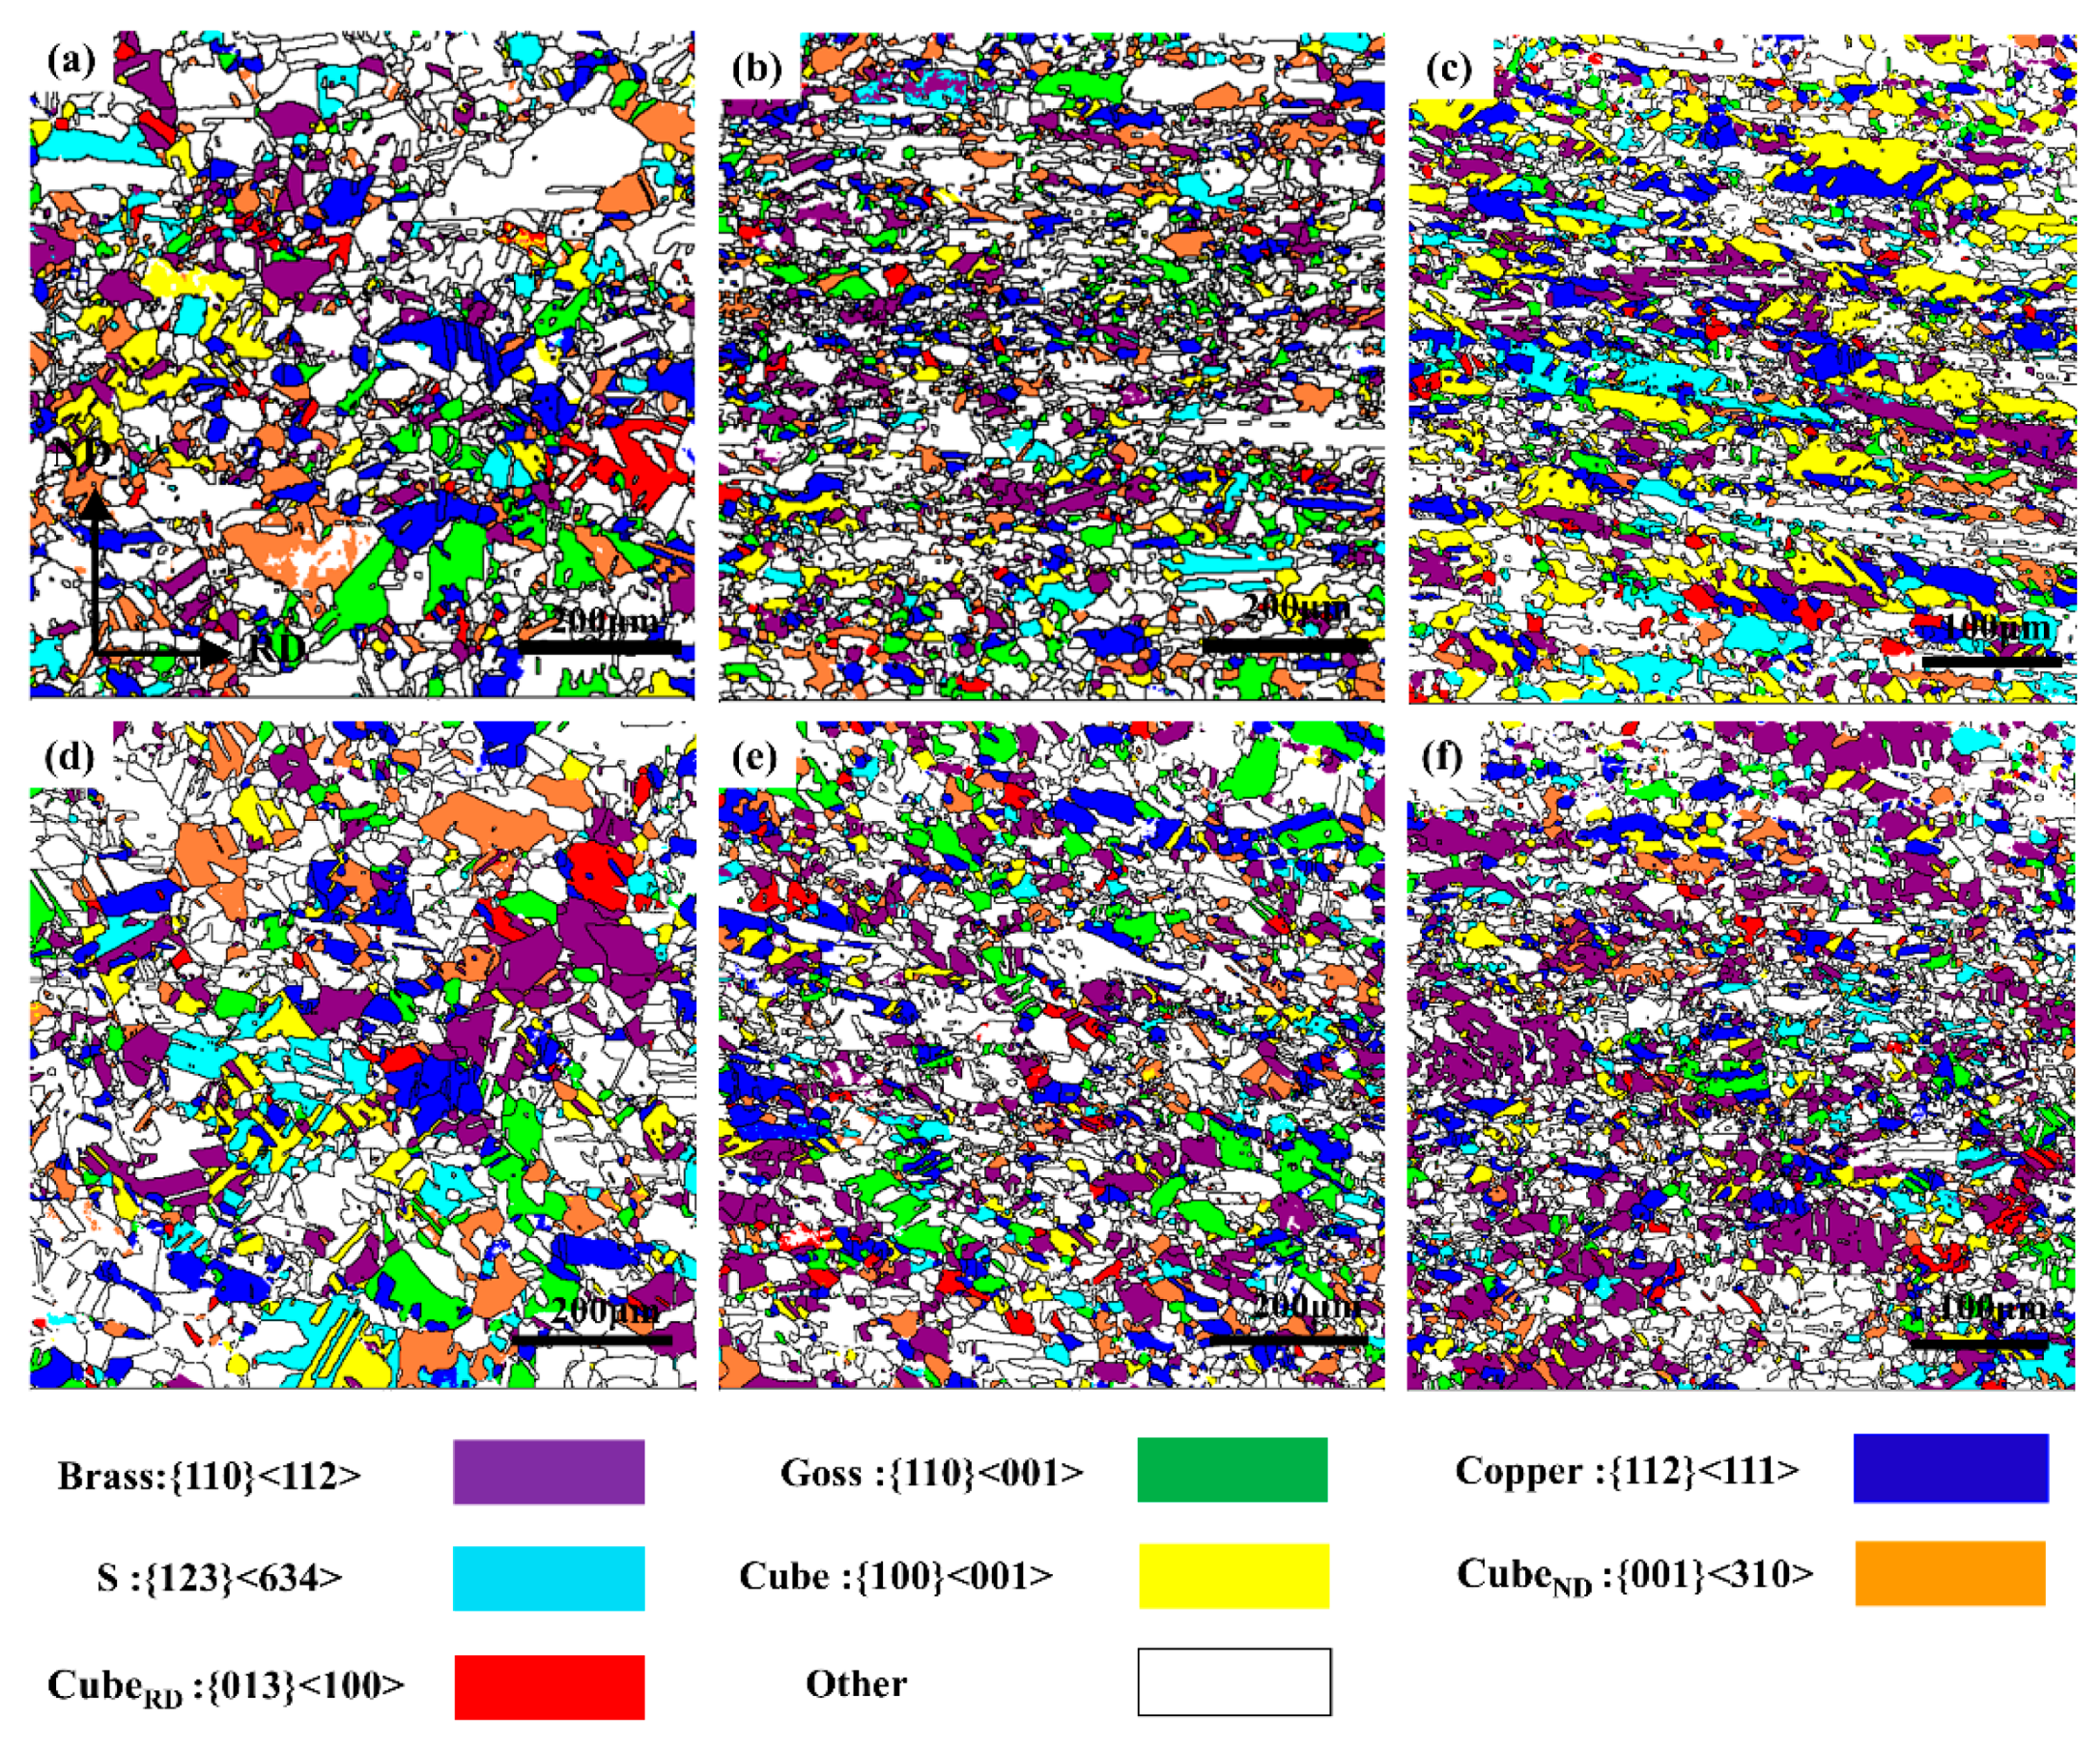
3.4. Recrystallization Microstructure

Figure 9 displays the orientation reconstruction of Cu-0.1Al alloy annealed at 300 °C for 60 min under different deformation modes, and different colors represent different crystal orientations. It can be seen from Figure 9a–c that the recrystallization has been completed basically in the 54% UR-annealed sample, and the grain size varies greatly. The main texture types of recrystallization are cube and cubend textures. With the increase of strain, the recrystallized grains for 70% and 90% UR-annealed samples are finer but elongated obviously along the RD. The cube texture is the main recrystallization texture in 90% UR-annealed sample, and the cube texture grows preferentially but in 70% annealed sample is relatively low. Compared with unidirectional rolling, the recrystallized grains for CR samples are not significantly elongated in the RD, and the grains become more equiaxed. With the increase of strain, the recrystallized grains in the CR sample become much finer. As shown in Table 4, it can be observed that with the increase of strain, the average grain size for UR- and CR-annealed samples becomes smaller. Meanwhile, the difference in recrystallized grain size between these two samples is not significant, and the grain size for the 90% CR-annealed sample is the smallest.
Moreover, it can be observed that the texture component, i.e., crystal orientations in 54% and 70% UR-annealed sample, is relatively random, comprising of weak cube, brass, cubeND components after the completion of recrystallization, while 90% UR-annealed sample exhibits a strong cube component, followed by brass component. In contrast, the content of recrystallized texture generated by the cross-rolling method is relatively random, although a relatively strong brass component is formed in the 70% CR-annealed sample. In general, relatively homogeneous microstructures, i.e., random grain orientation and fine grain size, are generated in 70% UR-, 70% CR-, and 90% CR-annealed samples.

4. Conclusions

The purpose of this work is to investigate the texture and microstructure homogeneity evolution of ultra-high purity Cu–Al alloys under unidirectional and cross rolling. The main conclusions can be summarised as follows:
  • Multidirectional warm forging combined with homogenizing treatment was adopted to break coarse columnar grains in Cu-0.1Al ingot, but the grains are still distributed unevenly. The average grain size reaches 82 μm and the texture distribution is also relatively concentrated.
  • The orientation density of deformation texture decreases gradually both in UR and CR samples as strain increases from 54% to 90%, but the difference of texture types is great since the change of strain path in rolling can alter the crystal orientations.
  • Numerous “cellular structures” are formed in the CR sample, especially for the 70% CR sample. The deformation microstructure in the CR sample is more uniform, as compared with the UR sample, and grain fragmentation is more serious with the increasing strain, especially for the UR sample.
  • The difference in recrystallized grain size between the UR- and CR-annealed samples is not significant, and the grain size is reduced gradually with the increase of strain. Moreover, the recrystallized grains in CR-annealed samples are more equiaxed, as compared with the UR-annealed samples.

Author Contributions

Data curation, J.Z. (Jing Zhang) and X.Y.; Supervision, J.Z. (Jing Zhang) and X.Y.; Writing—original draft, D.L.; Writing—review & editing, S.L. and J.Z. (Jialin Zhu). All authors have read and agreed to the published version of the manuscript.

Funding

This research was funded by National Natural Science Foundation of China, grant number 51421001, Venture and Innovation Support Program for Chongqing Overseas Returnees, grant number 2020088, Chongqing Science and Technology Commission in China, grant number cstc2019jcyj-msxmX0132 and Major “Scientific and Technological Innovation 2025” Project of Ningbo, grant number 2018B10066. The APC was funded by National Natural Science Foundation of China, grant number 51421001.

Conflicts of Interest

The authors declare no conflict of interest.

References

  1. Vaidya, S.; Sheng, T.T.; Sinha, K. linewidth dependence of electromigration in evaporated Al-0.5% Cu. Appl. Phys. Lett. 1980, 36, 464–466. [Google Scholar] [CrossRef]
  2. Istratov, A.A.; Flink, C.; Hieslmair, H.; Mchugo, S.A.; Weber, E.R. Diffusion, solubility and gettering of copper in silicon. Mater. Sci. Eng. B 2000, 72, 99–104. [Google Scholar] [CrossRef]
  3. Hu, C.K.; Harper, J.M.E. Copper interconnections and reliability. Mater. Chem. Phys. 1998, 52, 5–16. [Google Scholar] [CrossRef]
  4. Suwwan de Felipe, T.; Murarka, S.P.; Ajayan, P.M.; Bonevich, J. Electrical stability and microstructural evolution in thin films of high conductivity copper alloys. In Proceedings of the IEEE 1999 International Interconnect Technology Conference, San Francisco, CA, USA, 24–26 May 1999; IEEE: Piscataway Township, NJ, USA. [Google Scholar]
  5. Segal, V.M.; Yi, W.W.; Ferrasse, S.; Wu, C.T.; Strothers, D.; Alford, A.; Willett, B. Copper Sputtering Targets and Methods of Forming Copper Sputtering Targets. U.S. Patent 7767043 B2, 3 August 2010. [Google Scholar]
  6. Dunlop, J.A.; Yuan, J.; Kardokus, J.K.; Emigh, R.A. Sputtering Target with Ultra-Fine Oriented Grains and Method of Making Same. U.S. Patent 5590389A, 31 December 1996. [Google Scholar]
  7. Zhu, J.L.; Liu, S.F.; Yuan, X.L.; Liu, Q. Comparing the Through-Thickness Gradient of the Deformed and Recrystallized Microstructure in Tantalum with Unidirectional and Clock Rolling. Materials 2019, 12, 169. [Google Scholar] [CrossRef] [Green Version]
  8. Wang, H.; Zaluzed, M.J.; Rigsbee, J.M. Microstructure and mechanical properties of sputter-deposited Cu1-xTax alloys. Metall. Mater. Trans. A 1997, 28, 917–925. [Google Scholar] [CrossRef]
  9. Lanford, W.A.; Ding, P.J.; Wang, W.; Hymes, S.; Muraka, S.P. Low-temperature passivation of copper by doping with Al or Mg. Thin Solid Films 1995, 262, 234–241. [Google Scholar] [CrossRef]
  10. Zhu, J.L.; Liu, S.F.; Yang, S.; Zhang, Y.; Zhang, J.; Zhang, C.H.; Deng, C. The Effect of Different Annealing Temperatures on Recrystallization Microstructure and Texture of Clock-Rolled Tantalum Plates with Strong Texture Gradient. Metals 2019, 9, 358. [Google Scholar] [CrossRef] [Green Version]
  11. Zhu, J.L.; Deng, C.; Liu, Y.H.; Lin, N.; Liu, S.F. Effects of Annealing Temperature on Recrystallization Texture and Microstructure Uniformity of High Purity Tantalum. Metals 2019, 9, 75. [Google Scholar] [CrossRef] [Green Version]
  12. Davenport, S.B.; Higginson, R.L. Strain path effects under hot working: An introduction. J. Mater. Process. Technol. 2000, 98, 267–291. [Google Scholar] [CrossRef]
  13. Gupta, A.; Khatirkar, R.K.; Kumar, A.; Thool, K.; Suwas, S. Microstructure and texture development in Ti-15V-3Cr-3Sn-3Al alloy-possible role of strain path. Mater. Charact. 2019, 156, 109884. [Google Scholar] [CrossRef]
  14. Dhinwal, S.S.; Toth, L.S. Effect of strain path change on texture and microstructure evolution in asymmetric rolled extra-low carbon steel. Mater. Charact. 2020, 169, 110578. [Google Scholar] [CrossRef]
  15. Kong, X.Y.; Liu, W.C.; Li, J.; Yuan, H. Deformation and recrystallization textures in straight-rolled and pseudo cross-rolled AA 3105 aluminum alloy. J. Alloys Compd. 2010, 491, 301–307. [Google Scholar] [CrossRef]
  16. Zhu, J.L.; Liu, S.F.; Long, D.; Orlov, D.; Liu, Q. Pass number dependence of through-thickness microstructure homogeneity in tantalum sheets under the change of strain path. Mater. Charact. 2019, 160, 110076. [Google Scholar] [CrossRef]
  17. Fan, H.Y.; Liu, S.F.; Li, L.J.; Deng, C.; Liu, Q. Largely alleviating the orientation dependence by sequentially changing strain paths. Mater. Des. 2016, 97, 464–472. [Google Scholar] [CrossRef]
  18. Liu, Y.H.; Liu, S.F.; Zhu, J.L.; Deng, C.; Fan, H.Y.; Cao, L.F.; Liu, Q. Strain path dependence of microstructure and annealing behavior in high purity tantalum. Mater. Sci. Eng. A 2017, 707, 518–530. [Google Scholar] [CrossRef]
  19. Zhu, J.L.; Liu, S.F.; Long, D.D.; Zhou, S.Y.; Zhu, Y.L.; Orlov, D. The evolution of texture and microstructure uniformity in tantalum sheets during asymmetric cross rolling. Mater. Charact. 2020, 168, 110586. [Google Scholar] [CrossRef]
  20. Zhu, J.L.; Liu, S.F.; Long, D.D.; Liu, Y.H.; Lin, N.; Yuan, X.L.; Orlov, D. Asymmetric cross rolling: A new technique for alleviating orientation-dependent microstructure inhomogeneity in tantalum sheets. J. Mater. Res. Technol. 2020, 9, 4566–4577. [Google Scholar] [CrossRef]
  21. Pawlik, K. Determination of the orientation distribution function form pole figures in arbitrarily defined cells. Phys. Status Solidi B 1986, 134, 477–483. [Google Scholar] [CrossRef]
  22. Suwas, S.; Singh, A.K.; Rao, K.N.; Singh, T. Effect of modes of rolling on evolution of the texture in pure copper and some copper-base alloys Part I: Rolling texture. Z. Met. 2002, 93, 918–927. [Google Scholar] [CrossRef]
  23. Suwas, S.; Singh, A.K. Role of strain path change in texture development. Mater. Sci. Eng. A 2003, 356, 368–371. [Google Scholar] [CrossRef]
  24. Li, X.; Al-Samman, T.; Gottstein, G. Mechanical properties and anisotropy of ME20 magnesium sheet produced by unidirectional and cross rolling. Mater. Des. 2011, 32, 4385–4393. [Google Scholar] [CrossRef]
  25. Brown, T.L.; Saldana, C.; Murthy, T.G.; Mann, J.B.; Guo, Y.; Allard, L.F.; King, A.H.; Compton, W.D.; Trumble, K.P.; Chandrasekar, S. A study of the interactive effecs of strain, strain rate and temperature in severe plastic deformation of copper. Acta Mater. 2009, 57, 5491–5500. [Google Scholar] [CrossRef]
  26. Engler, O. Recrystallisation textures in copper-manganese alloys. Acta Mater. 2001, 49, 1237–1247. [Google Scholar] [CrossRef]
  27. Gurao, N.P.; Sethuraman, S.; Suwas, S. Effect of strain path change on the evolution of texture and microstructure during rolling of copper and nickel. Mater. Sci. Eng. A 2011, 528, 7739–7750. [Google Scholar] [CrossRef]
  28. Engler, O. Deformation and texture of copper-manganese alloys. Acta Mater. 2000, 48, 4827–4840. [Google Scholar] [CrossRef]
Figure 1. Schematic diagram of sample rolling method.
Crystals 11 01113 g001
Figure 2. The as-received microstructure (a) and texture distribution (b) of ultra-high purity Cu-0.1Al alloy before rolling.
Crystals 11 01113 g002
Figure 3. The sections φ2 = 0°, 45°, 65° in the ODFs of Cu-0.1Al alloy under unidirectional rolling.
Crystals 11 01113 g003
Figure 4. The sections φ2 = 0°, 45°, 65° in the ODFs of Cu-0.1Al alloy under cross rolling.
Crystals 11 01113 g004
Figure 5. Typical orientation position in (φ2 = 0°, 45°, 65°) sections of FCC structure materials.
Crystals 11 01113 g005
Figure 6. The volume fraction of rolling texture components in the differently rolled samples of Cu-0.1Al alloy: (a) UR sample; (b) CR sample.
Crystals 11 01113 g006
Figure 7. Grain boundary diagram (a,c,e), and crystal orientation map (b,d,f) of Cu-0.1Al alloy under unidirectional rolling: (a,b) UR-54%; (c,d) UR-70%; (e,f) UR-90%.
Crystals 11 01113 g007
Figure 8. Grain boundary diagram (a,c,e), and crystal orientation map (b,d,f) of Cu-0.1Al alloy under cross rolling: (a,b) UR-54%; (c,d) UR-70%; (e,f) UR-90%.
Crystals 11 01113 g008
Figure 9. Orientation reconstruction of Cu-0.1Al alloy with different rolling methods after annealing at 300 °C for 60 min: (a) UR-54%; (b) UR-70%; (c) UR-90%; (d) CR-54%; (e) CR-70%; (f) CR-90%.
Crystals 11 01113 g009
Table 1. Impurity composition of ultra-high purity Cu-0.1Al (wt-ppm).
AgAsBBiCaCdCoCrFeK
0.14<0.005<0.001<0.001<0.005<0.005<0.005<0.0010.01<0.005
LiMgNaNbNiPSbSiSnTh
<0.001<0.005<0.001<0.005<0.001<0.001<0.0010.02<0.005<0.0001
UVWZnZrBeHgPb
<0.0001<0.001<0.001<0.01<0.001<0.001<0.005<0.001
Note: the chemical content of Al in Cu-0.1Al alloy is 0.102 wt%.
Table 2. The rolling parameter for unidirectional and 90° cross rolling.
Rolling PassEntrance Thickness/mmExit Thickness/mmRolling Reduction Pass Per/%Total Rolling Reduction/%
1109.524.84.8
29.529.104.49
39.108.605.514
48.608.105.819
58.107.704.923
67.706.989.330.2
76.986.704.033
86.706.246.937.6
96.245.669.343.4
105.665.384.946.2
115.384.967.850.4
124.964.4310.755.7
134.434.039.059.7
144.033.4215.165.8
153.423.0012.370
163.002.5016.775
172.502.1912.478.1
182.191.6026.984
191.601.2621.2587.4
201.261.0020.690
Table 3. Main texture component of FCC metals.
Texture TypeMiller IndexEuler Angle (φ1, Φ, φ2)
Copper{112} <111>903545
S{123} <634>593763
Goss{011} <100>0450
Brass{011} <211>35450
Cube{001} <100>000
CubeRD{013} <100>0190
CubeND{001} <310>1900
Table 4. Grain size distribution of Cu-0.1Al alloy under different deformation methods after annealing at 300 °C for 60 min (%).
<5 μm6–15 μm16–20 μm>20 μmAverage Grain Size μm
UR-54%13.9945.798.3931.7628.92
UR-70%20.2748.849.9720.8715.76
UR-90%72.3320.792.404.449.80
CR-54%26.5527.377.4638.5332.42
CR-70%24.2640.118.5227.0618.84
CR-90%74.2320.862.104.128.63
Publisher’s Note: MDPI stays neutral with regard to jurisdictional claims in published maps and institutional affiliations.

