Article

Thermal Deformations of Crystal Structures in the L-Aspartic Acid/L-Glutamic Acid System and DL-Aspartic Acid

1
Department of Crystallography, St. Petersburg State University, Universitetskaya emb. 7/9, 199034 St. Petersburg, Russia
2
Max Planck Institute for Dynamics of Complex Technical Systems, Sandtorstrasse 1, 39106 Magdeburg, Germany
*
Author to whom correspondence should be addressed.
Crystals 2021, 11(9), 1102; https://doi.org/10.3390/cryst11091102
Submission received: 16 August 2021 / Revised: 6 September 2021 / Accepted: 7 September 2021 / Published: 10 September 2021
(This article belongs to the Special Issue Recent Progress in Industrial Crystallization)

Abstract

:
The method of temperature-resolved powder X-ray diffraction (TRPXRD) was used to determine the elevated temperature behavior of L-aspartic acid (L-asp), DL-aspartic acid (DL-asp), L-glutamic acid (L-glu), and an L-asp0.25,L-glu0.75 solid solution. These amino acids were not found to undergo any solid-phase (polymorph) transformations. When heated, they all experienced only thermal deformations. The corresponding parameters of the monoclinic cells of L-asp and DL-asp, and the orthorhombic cells of L-glu and L-asp0.25,L-glu0.75, were calculated for the entire range of studied temperatures (up to 220 °C). The data obtained were used to calculate the parameters of the thermal deformation tensors, and to plot the figures of their thermal expansion coefficients. A correlation between the maximum and minimum values of thermal expansion coefficients and the length, type, direction, and number of hydrogen bonds in the crystal structures of the investigated amino acids was established. The observed negative thermal expansion (contraction) of crystal structures of L-asp and DL-asp along the ac plane can be explained as a result of shear deformations occurring in monoclinic crystals with a non-fixed angle β. The studies were related to the presence of amino acids in various natural and technological processes occurring at different temperatures.

1. Introduction

Amino acids of the general formula NH2-CHR-COOH play an important role in natural biochemical processes. They are typical representatives of organic crystals composed of chiral molecules. Chirality is the ability of a substance to occur in two or more configurations of molecules, which are referred to as enantiomers and diastereomers. Molecules of enantiomers are mirror images of one another. Relative configurations of enantiomers are designated as L (levorotary) and D (dextrorotary). All of the naturally occurring protein molecules are composed of L-enantiomers of amino acids. The respective D-amino acids are less frequently found in nature; for example, they are present in the cellular walls of some bacteria, in some antibiotic drugs, etc. Amino acids are involved in the regulation of metabolic processes; they also stimulate oxidation–reduction reactions in the brain and perform neurotransmission functions in the central nervous system [1]. Moreover, amino acids are widely used in the pharmaceutical industry, and participate in many technological processes occurring at different temperatures [2,3,4]. The chirality of amino acids and their wide distribution in the geological media make these compounds useful tools for dating sediments and paleontological objects [5,6,7]. Considering all of the above-mentioned, investigation of amino acids’ behavior at elevated temperatures is a subject of high relevance.
Thermal deformations in organic compounds [8,9] are considerably less studied than those in inorganic substances [10,11,12], while thermal deformations of chiral organic compounds are hardly investigated at all. Surprisingly enough, there are only a few reported works discussing thermal deformations of amino acids and presenting figures of their thermal expansion coefficients (CTEs). Here, it is worth mentioning the studies of K. Nakata et al. [13], S.J. Coles et al. [14], and C.H. Görbitz et al. [15,16], which discuss the high-temperature polymorph transformations of L-and DL-methionine, L-norvaline, L- and DL-2-aminobutyric acid, and L- and DL-norleucine.
In our previous work, we investigated the thermal deformations of amino acid crystal structures and plotted the figures of CTEs for the following substances: (1) both components and two solid solutions formed in the L-threonine/L-allo-threonine diastereomer system [17], (2) both components and the non-equimolar discrete compound formed in the L-valine/L-isoleucine system [18], and (3) the components formed in the L-alanine/L-serine amino acids system [19].
The present work is seen as continuation of the previous investigations of thermal deformations in amino acid crystal structures, aimed at a better understanding of the structure–property relationships of this important class of compounds. In the system of levorotary enantiomers L-aspartic acid/β-L-glutamic acid, both components and the solid solution L-asp0.25,L-glu0.75 (L-asp/L-glu = 25/75 mol.%) were studied. In addition, racemic aspartic acid (DL-asp) was examined.

2. Materials and Methods

2.1. Materials

Aspartic acid (C4H7NO4) and glutamic acid (C5H9NO4) are proteinogenic aliphatic amino acids. They are characterized by having two carboxylic COOH groups in their molecules, and differ only in the absence or presence of a CH2 group (Figure 1). Both acids have only one chiral center, i.e., they can exist in two different configurations, referred to as L and D enantiomers. In the event that the enantiomers form a binary equimolar compound, the D and L molecules contribute equally to the formation of the resulting DL crystalline structure. The crystals of L-asp and DL-asp show monoclinic syngony with the space groups P21 and C2/c, respectively [20,21]. The L-glu enantiomer possesses orthorhombic syngony with the space group P212121 [22].
The reactants used were as follows: (1) L- and DL-aspartic acid of 99% purity, obtained from AppliChem GmbH, Germany, and (2) β-L-glutamic acid of 99% purity, obtained from Acros Organics–Thermo Fisher Scientific, Belgium. The samples of the L-asp and L-glu enantiomers, DL-asp, and the solid solution L-asp0.25,L-glu0.75, applied in the experiments, were obtained by dissolving the corresponding compounds in distilled water at ~70 °C, followed by crystallization via isothermal evaporation of the solvent at 55 °C for 48 h.

2.2. Methods

The above-mentioned samples were pre-investigated by means of the PXRD method (Rigaku MiniFlex II, Tokyo, Japan). The behavior of the samples at elevated temperatures was studied using the temperature-resolved powder X-ray diffraction (TRPXRD) technique. The experiments were performed in atmospheric air using a Rigaku Ultima IV (Tokyo, Japan) diffractometer equipped with a high-temperature accessory. The experimental conditions were as follows: Co irradiation, 2θ range of 5–50°, and temperature range of 23–220 °C, with a temperature step of 10 °C. The unit cell parameters at each temperature were calculated via the Rietveld method using Topaz software (Bruker AXS GmbH, Karlsruhe, Germany).
Temperature dependencies of the unit cell parameters were applied to calculate the thermal expansion coefficients of the crystal structure (α) along the three mutually orthogonal axes of the thermal deformation tensor (α11, α22, α33), and along the crystallographic axes a, b, and c. The resulting values were utilized to plot projections of the CTE figures onto the ab, ac, and bc planes of the orthorhombic (L-glu and L-asp0.25,L-glu0.75) and monoclinic (L-asp and DL-asp) unit cells. In the case of crystal structures with orthorhombic syngony, the tensor axes were found to be co-directional with the crystallographic axes. The tensor calculations and the plotting of the CTE figures were performed using TEV V1.0.1 software (Thomas Langreiter and Volker Kahlenberg, Institute of Mineralogy and Petrography, Innsbruck, Austria).

3. Results

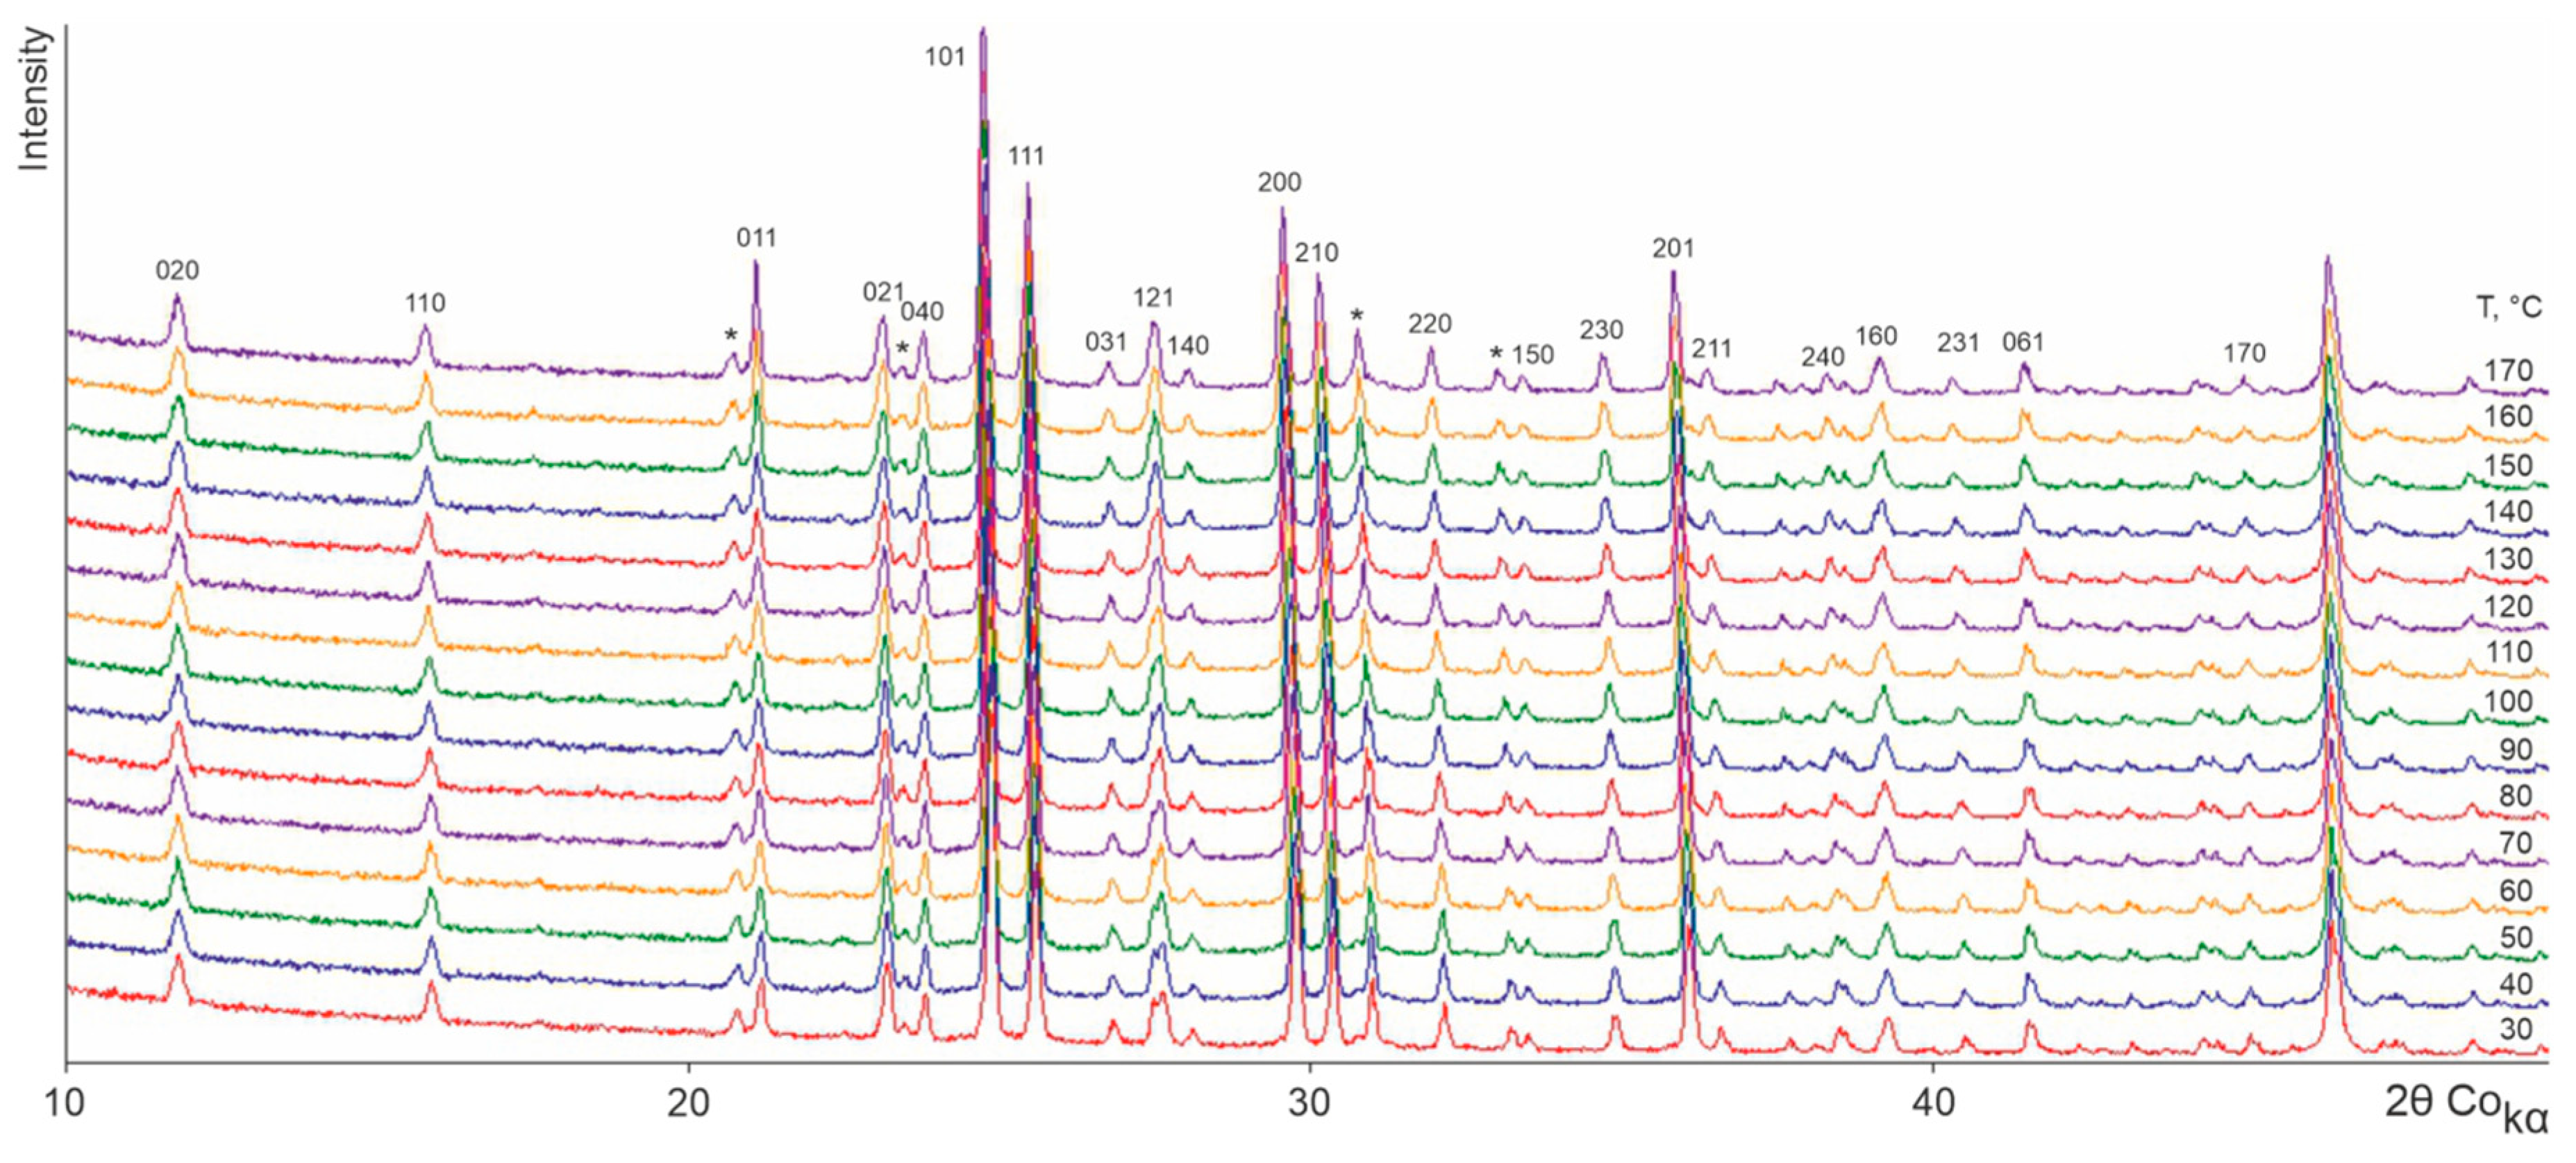
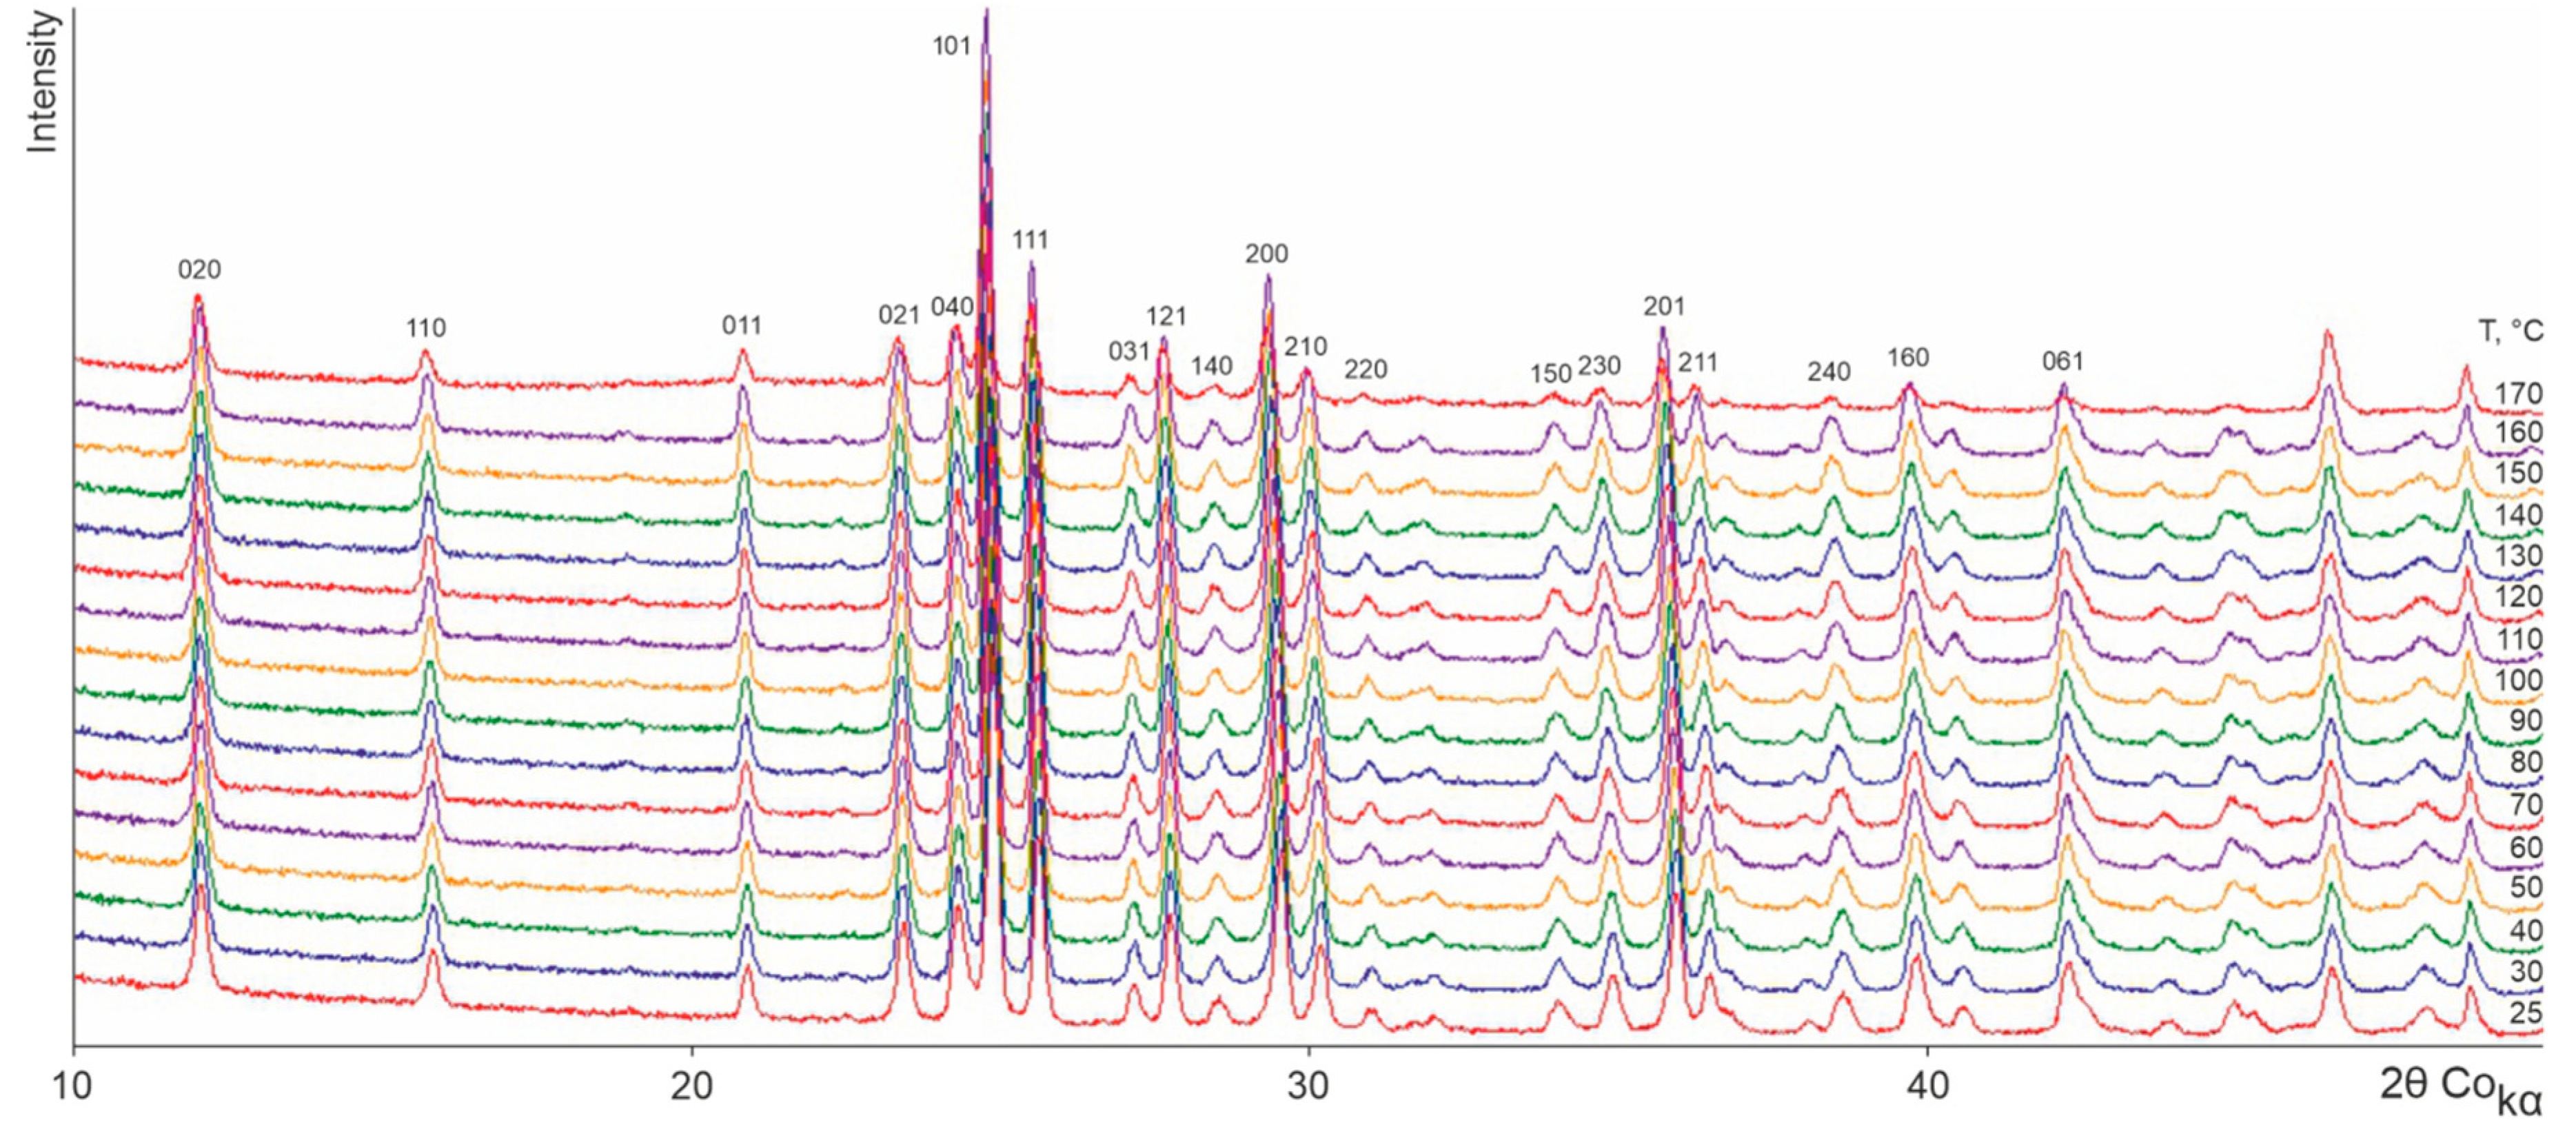
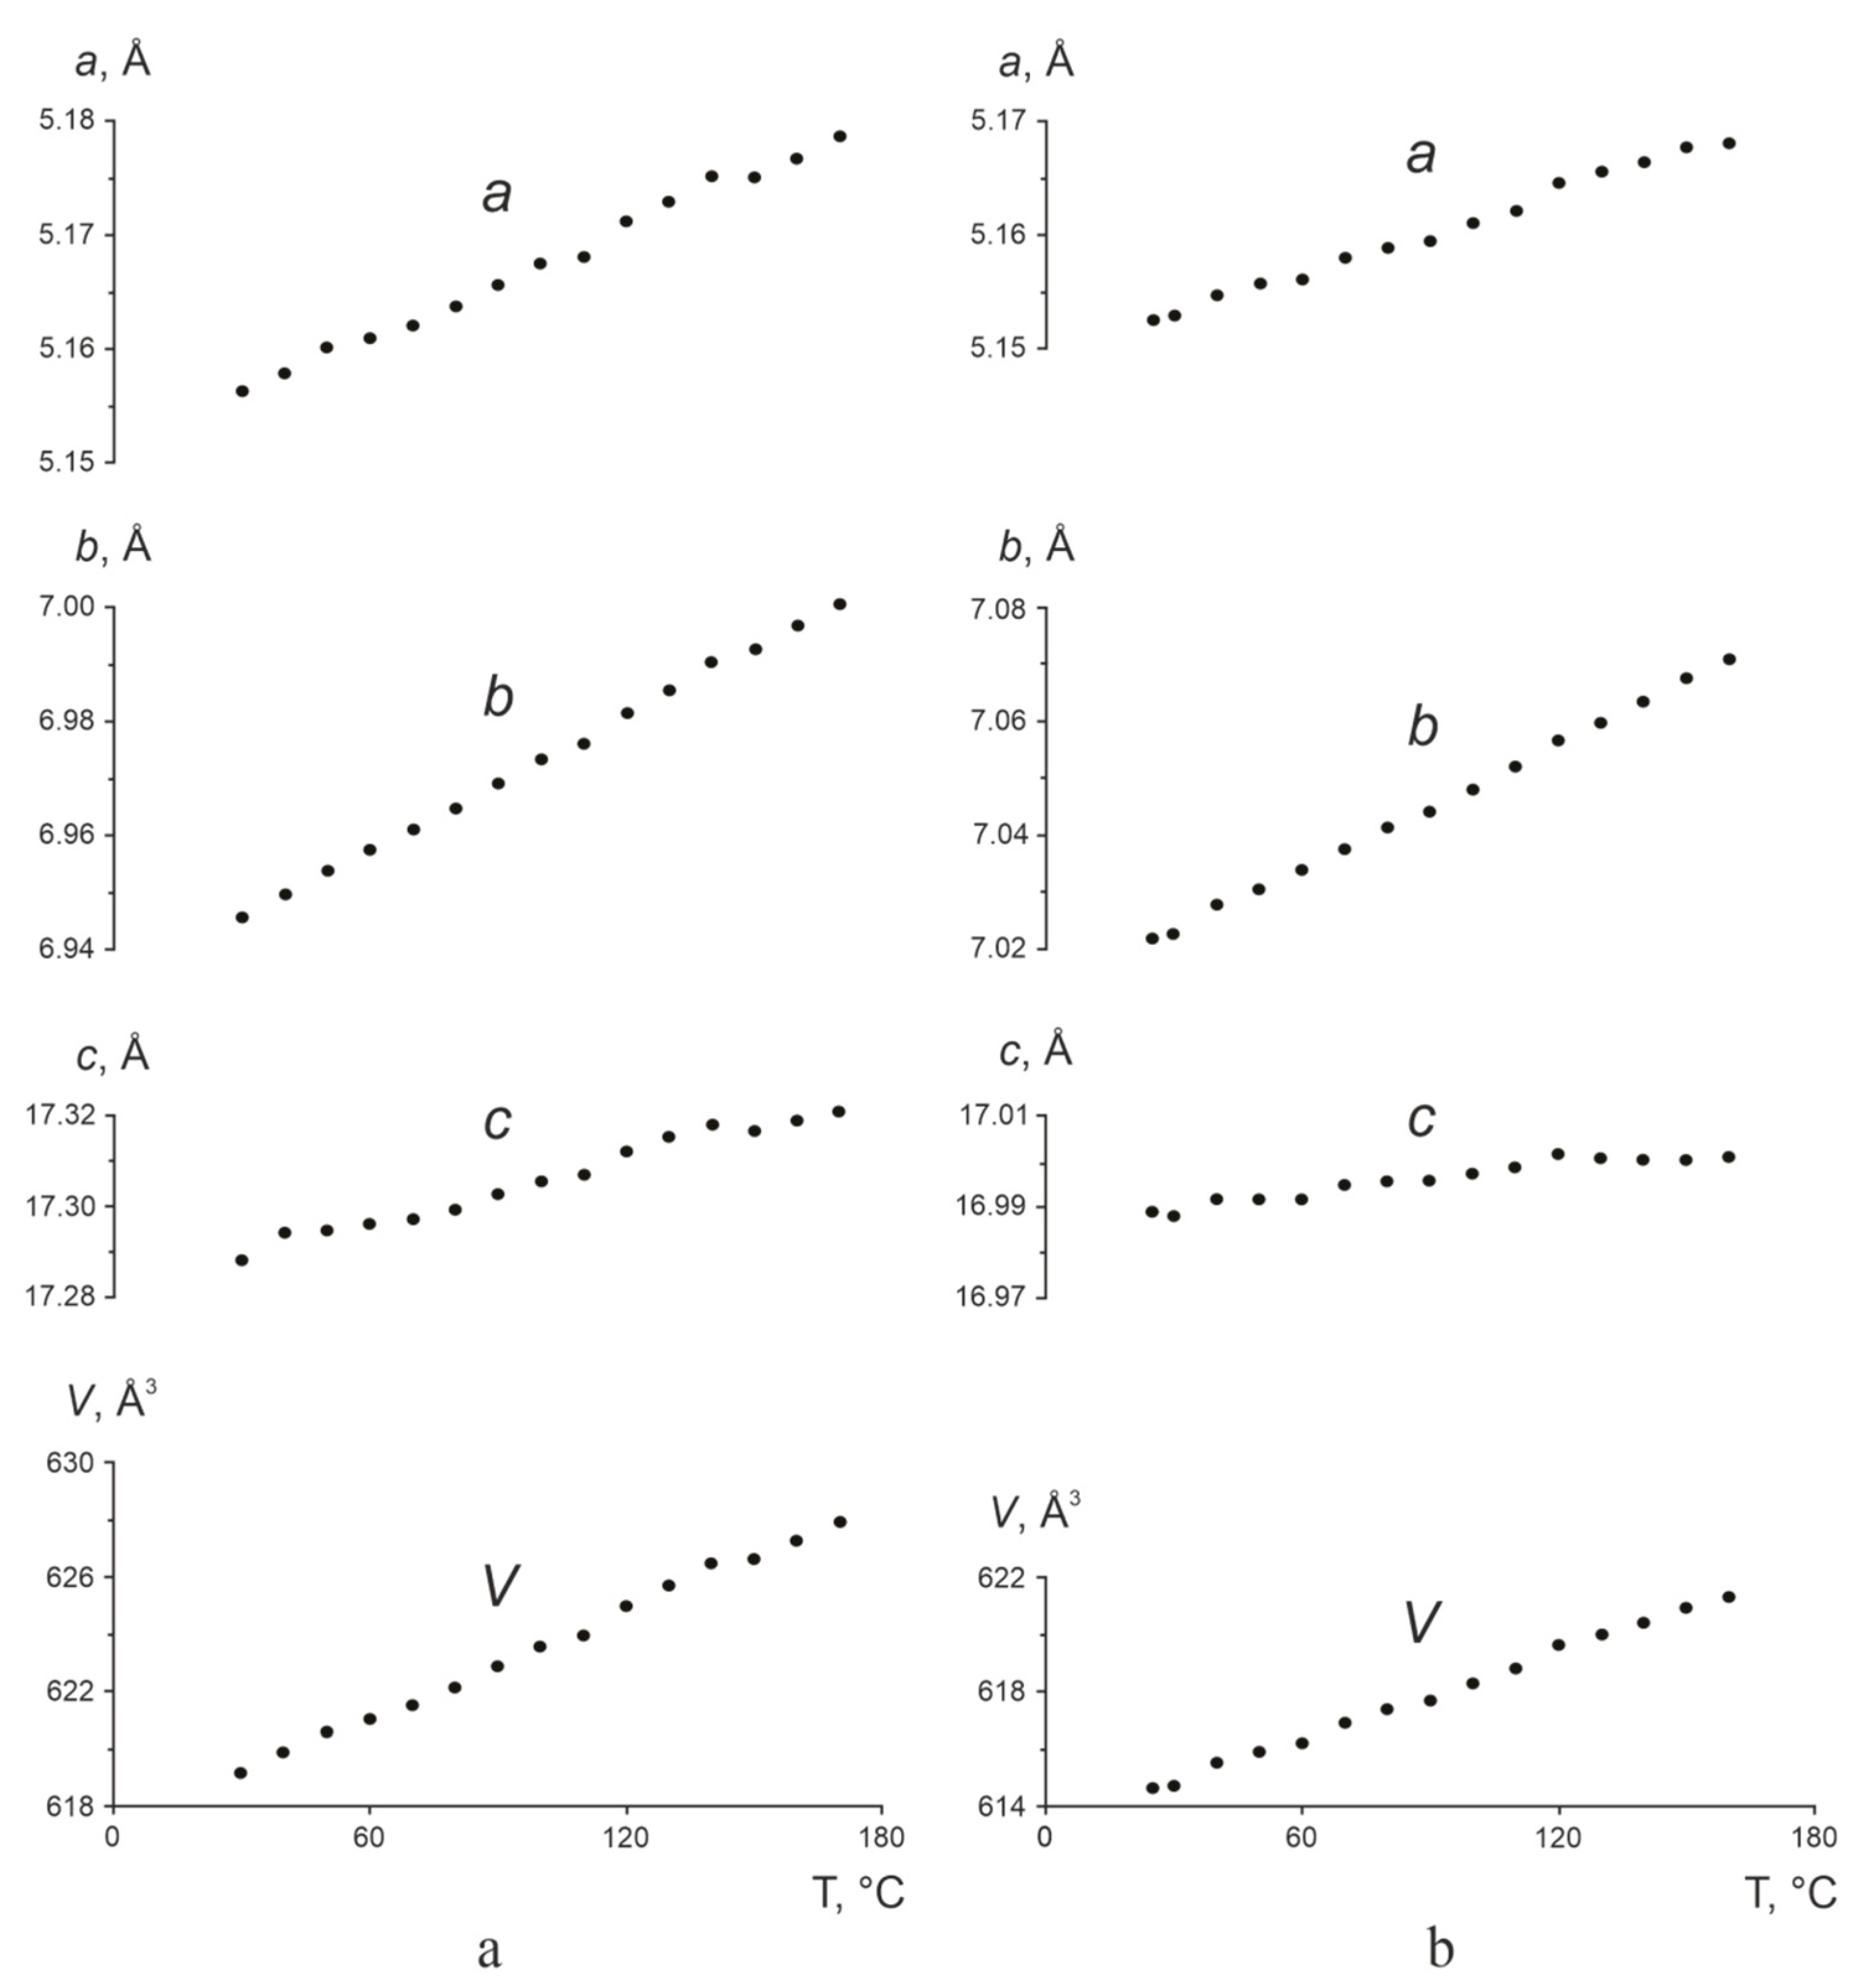
3.1. Temperature-Resolved Powder X-ray Diffraction (TRPXRD) Data

Figure 2, Figure 3, Figure 4 and Figure 5 show the TRPXRD patterns of L-asp, DL-asp, L-glu, and L-asp0.25,L-glu0.75 obtained at various temperatures. It can be seen that within the whole temperature range, all of the patterns maintain the fixed collection of peaks, and do not lose or acquire new ones. This means that the corresponding samples do not undergo any polymorph transformations up to the amorphization temperature of L- and DL-asp (amorphization occurs at 220–230 °C and 210–220 °C, respectively) (Figure 2 and Figure 3), and up to the melting temperature of L-glu and L-asp0.25,L-glu0.75 (melting occurs between 170 and 180 °C) (Figure 4 and Figure 5). Hence, it follows that, upon heating, the crystal structures of all of the studied samples experience only thermal deformations.
As the temperature increases, the peaks are shifted, usually towards the lower 2θ angles. Since the shift values of peaks with different hkl are not the same, some peaks merge.
The sample of the L-glu enantiomer (Figure 4) is already a mixture of two phases at the starting temperature. It is related to the polymorph modifications of β-L-glu (~86 wt.%) and α-L-glu (~14 wt.%). The intensity of the peaks corresponding to the α-L-glu component persists up to the melting point. This verifies that under the conditions of the TRPXRD experiment the β-L-glu and α-L-glu phases do not undergo solid-phase polymorph transformations to change into one another.
The X-ray patterns of the L-asp0.25,L-glu0.75 solid solution (Figure 5) correspond to those of the β-L-glu enantiomer. It is worth mentioning that the solid solution sample did not contain the α-L-glu admixture phase. This may be due to the fact that the conditions of preparing the solutions of L-glu and L-asp0.25,L-glu0.75 (the temperature, degree of supersaturation, and mode of stirring) were slightly different. Several attempts to crystallize a pure α-L-glu phase using the method proposed in [22,23,24] were unsuccessful.
The TRPXRD results were used to calculate the parameters and volume of monoclinic cells of L-asp and DL-asp and orthorhombic cells of L-glu and L-asp0.25,L-glu0.75 within the whole range of studied temperatures.

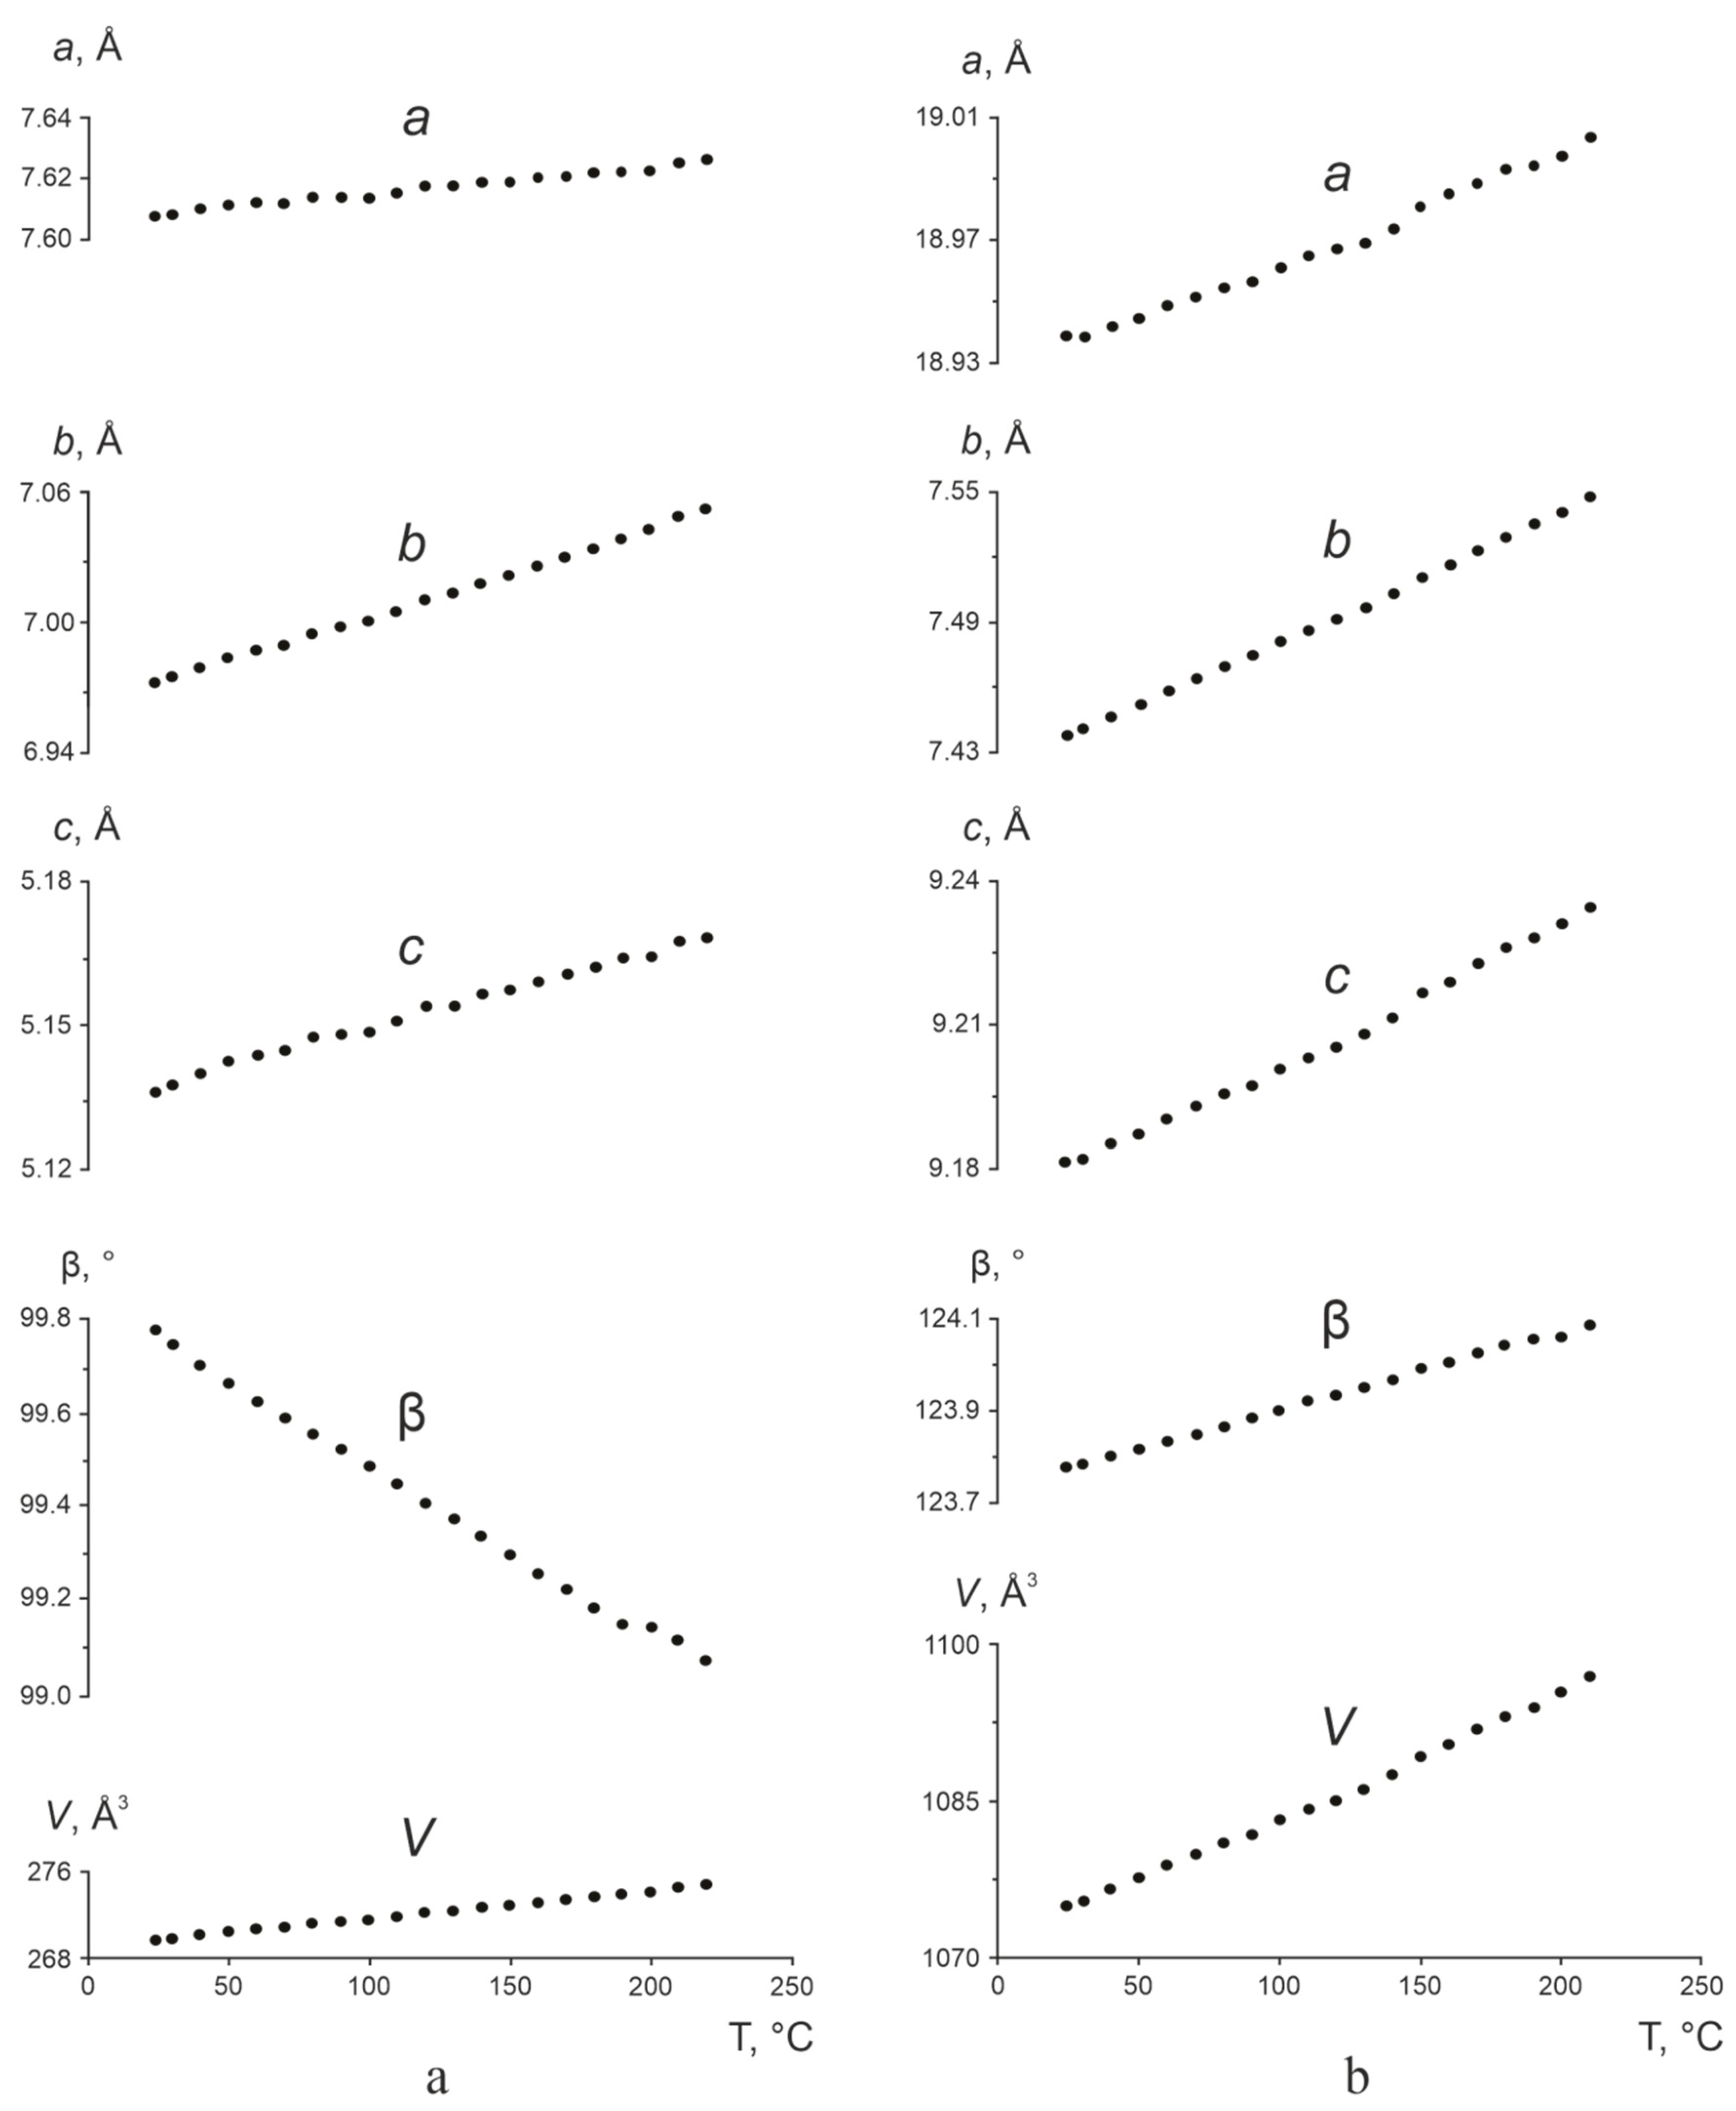
3.2. Temperature Dependencies and Thermal Expansion Coefficients

Figure 6 shows changes in the a, b, c, and β parameters, and in the volume V of the monoclinic cells of L- and DL-asp versus temperature. In all cases, the errors in calculating the parameters and volume did not exceed the marker size. For purposes of comparison, the corresponding dependencies of the parameters and the volume of L-asp (Figure 6a) and DL-asp (Figure 6b) are presented in the same scale. It can be seen that the linear parameters a, b, and c, as well as the volumes V, grow linearly with the increase in temperature for both L- and DL-asp. However, the monoclinic angle β behaves differently: it decreases linearly for L-asp and increases linearly for DL-asp. The CTE values αV of the volumes calculated for the monoclinic cells of the said compounds are close to one another (Table 1).
The temperature-derived changes in the orthorhombic cell parameters a, b, c, and β and volume V of L-glu and the L-asp0.25,L-glu0.75 solid solution are presented in Figure 7a,b, respectively—again at the same scale. For both the enantiomer and the solid solution, increasing the temperature caused a linear increase in all of the parameters and in the volume of the respective orthorhombic cells. This confirms that heating the samples results only in the thermal expansion of their crystal structures. As seen in Figure 7, elevating the temperature leads to a greater increase in the parameters and the volume of the unit cell for L-glu than for the L-asp0.25,L-glu0.75 solid solution. Accordingly, the CTE values αV calculated for these samples appear to be rather different (Table 2).
All of the temperature dependencies of the parameters and the volumes of the unit cells of L-asp, DL-asp, L-glu, and L-asp0.25,L-glu0.75 were approximated by polynomials of the first degree. The calculated data served as the basis for estimation of the CTE values of the crystal structures along the axes of the thermal deformation tensor and the crystallographic axes, given for L-asp and DL-asp in Table 3, and for L-glu and the L-asp0.25,L-glu0.75 solid solution in Table 4.
The data shown in Table 3 indicate the presence of negative (or anomalous) thermal expansion—that is, contraction—of the L-asp and DL-asp monoclinic crystal structures. In both substances, the contraction occurs in the crystallographic plane ac, but in L-asp it acts along the α11 axis of the tensor, while in DL-asp it acts along the α33 axis.
The data presented in Table 3 and Table 4 were used to plot projections of the CTE figures onto the crystallographic planes ab, ac, and bc of L- and DL-asp (Figure 8 and Figure 9, right), and L-glu and L-asp0.25,L-glu0.75 (Figure 10, right, solid black and red dashed lines, respectively). Figure 8 and Figure 9 (left) also show projections of the monoclinic structures of L- and DL-asp onto the a*b, ac, and bc* planes, which are orthogonal to the c, b, and a axes, respectively. The analogous Figure 10 (left) shows projections of the orthorhombic structure of L-glu onto the ab, ac, and bc planes. As the temperature dependencies of all of the unit cell parameters in all of the studied samples can be approximated by linear polynomials, the CTE figures do not change substantially when varying the temperature. For that reason, Figure 8, Figure 9 and Figure 10 show the CTE figures obtained at only one temperature: 100 °C.

4. Discussion

In the following section, first, the results for L-asp and DL-asp crystallizing in a monoclinic lattice are discussed (Figure 8 and Figure 9), followed by the findings for L-glu and the L-asp/L-glu solid solution crystallizing in an orthorhombic syngony (Figure 10).

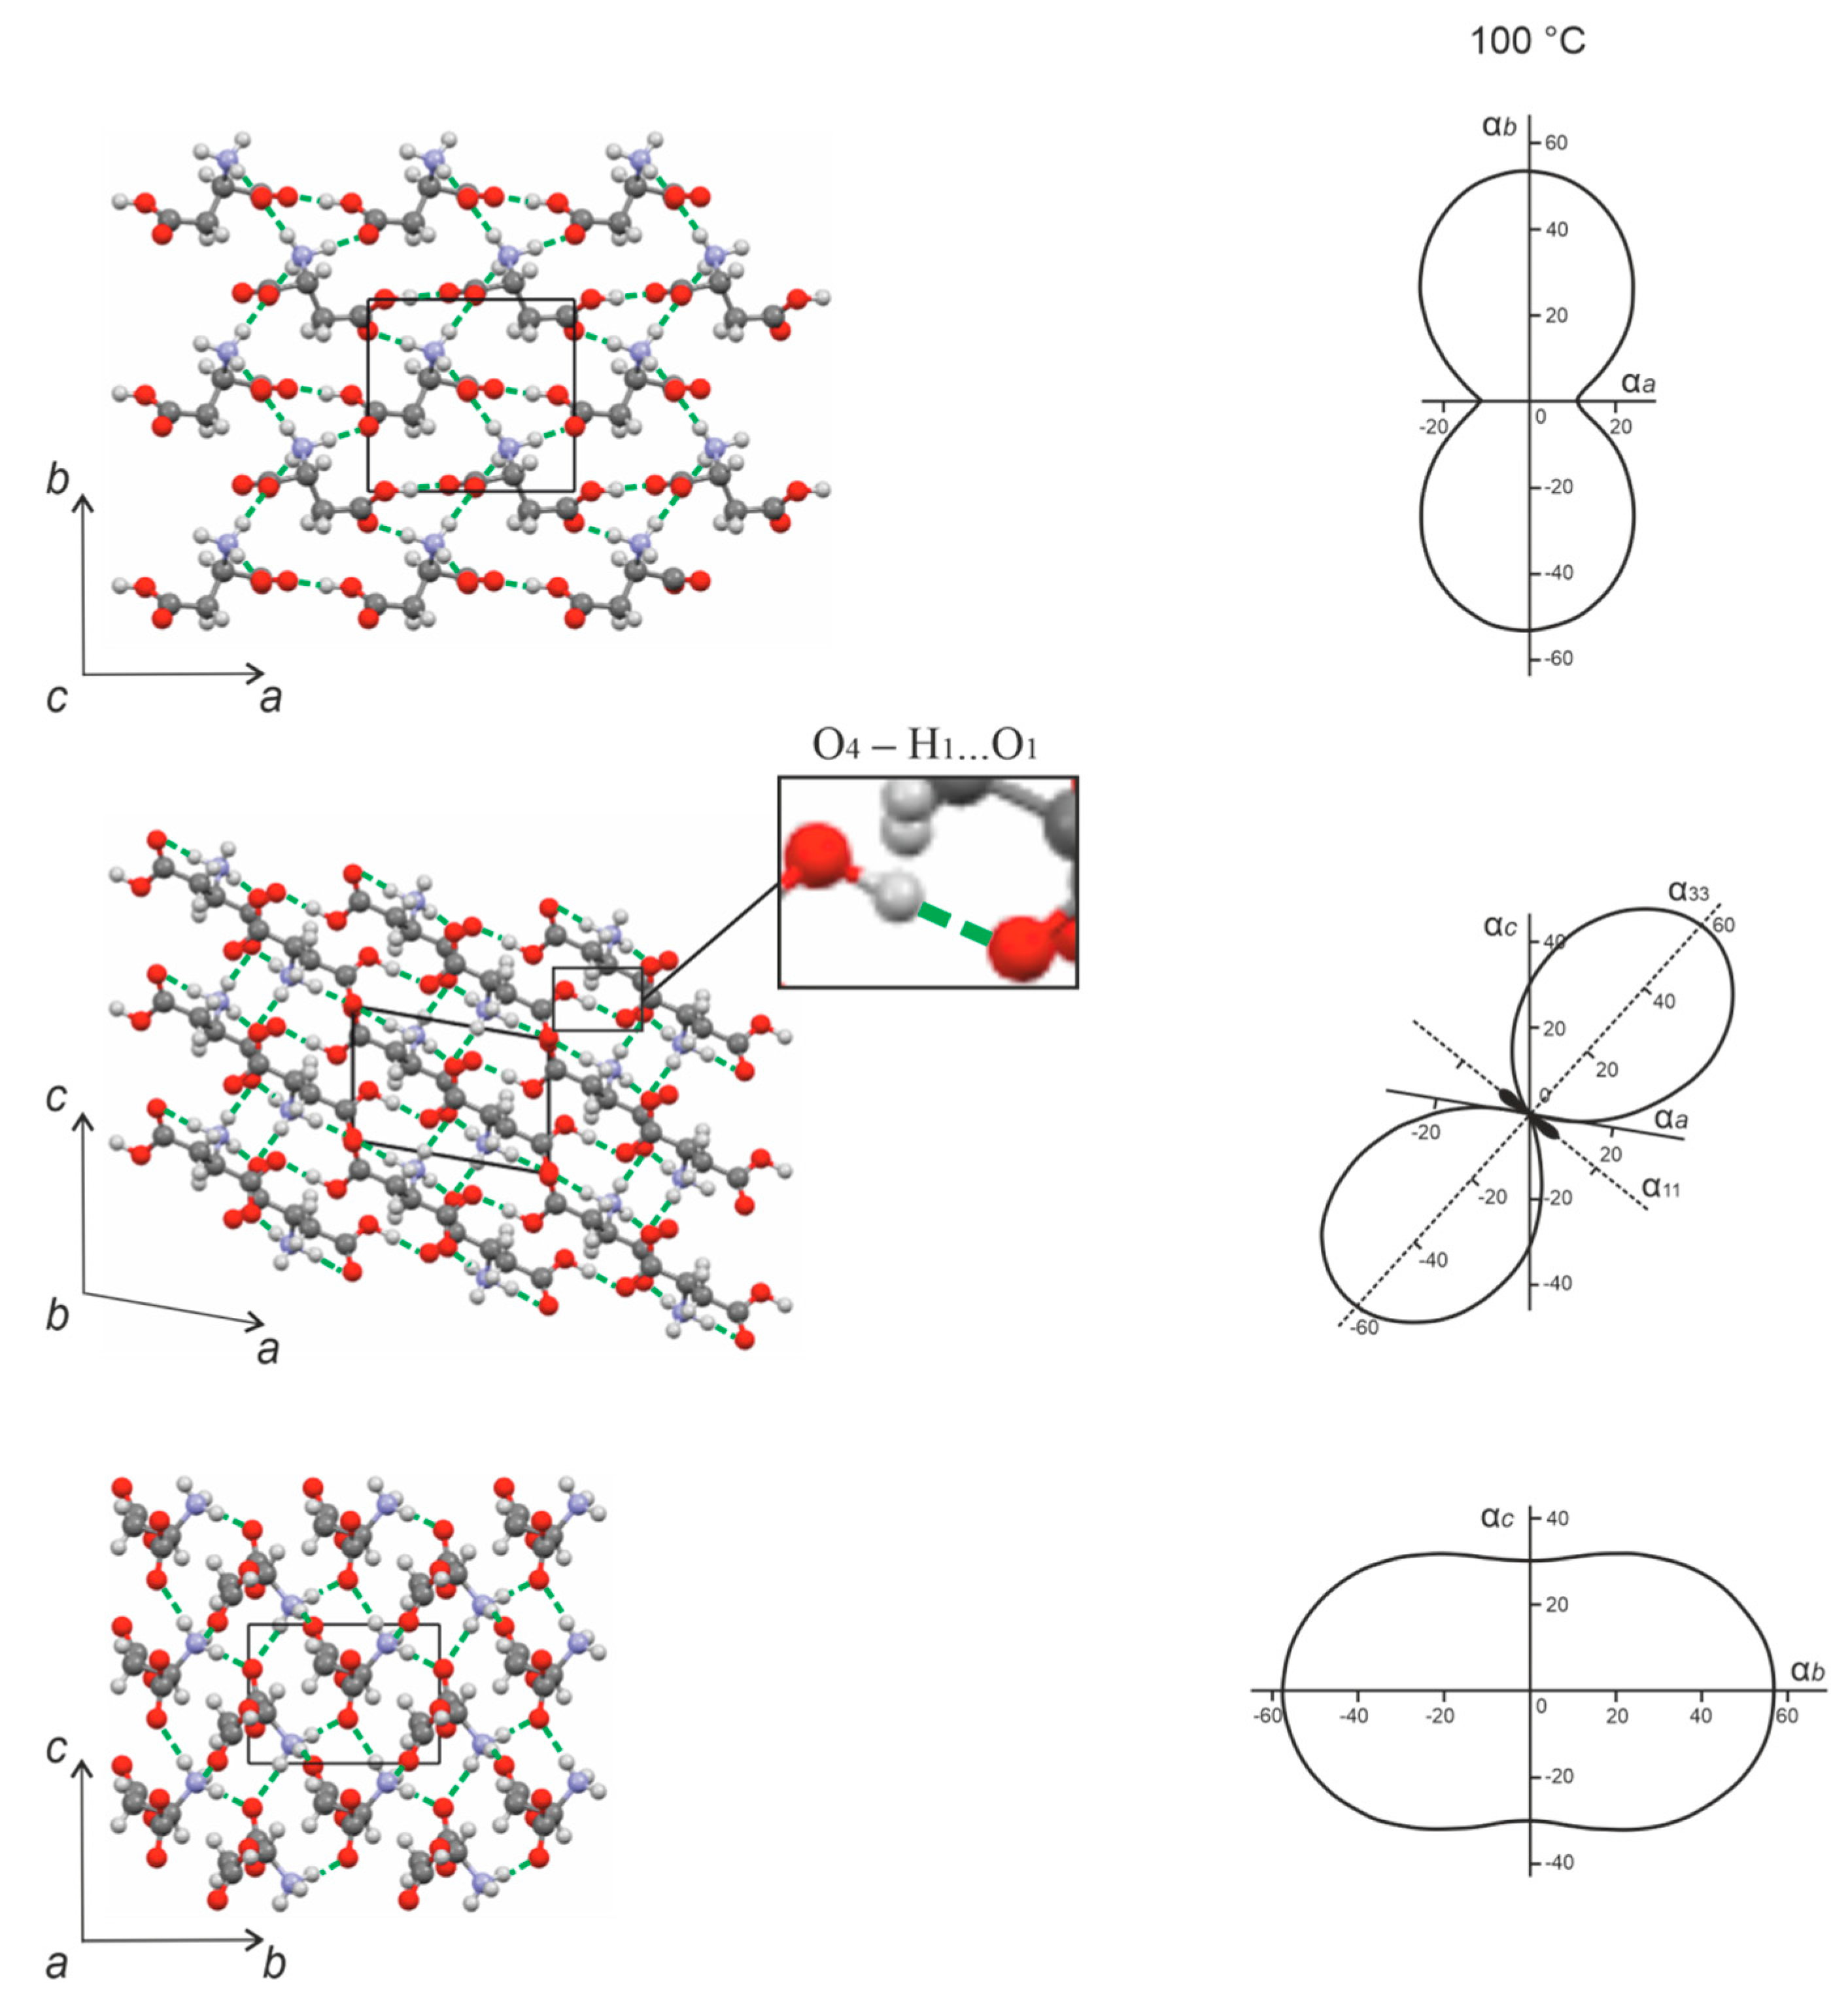
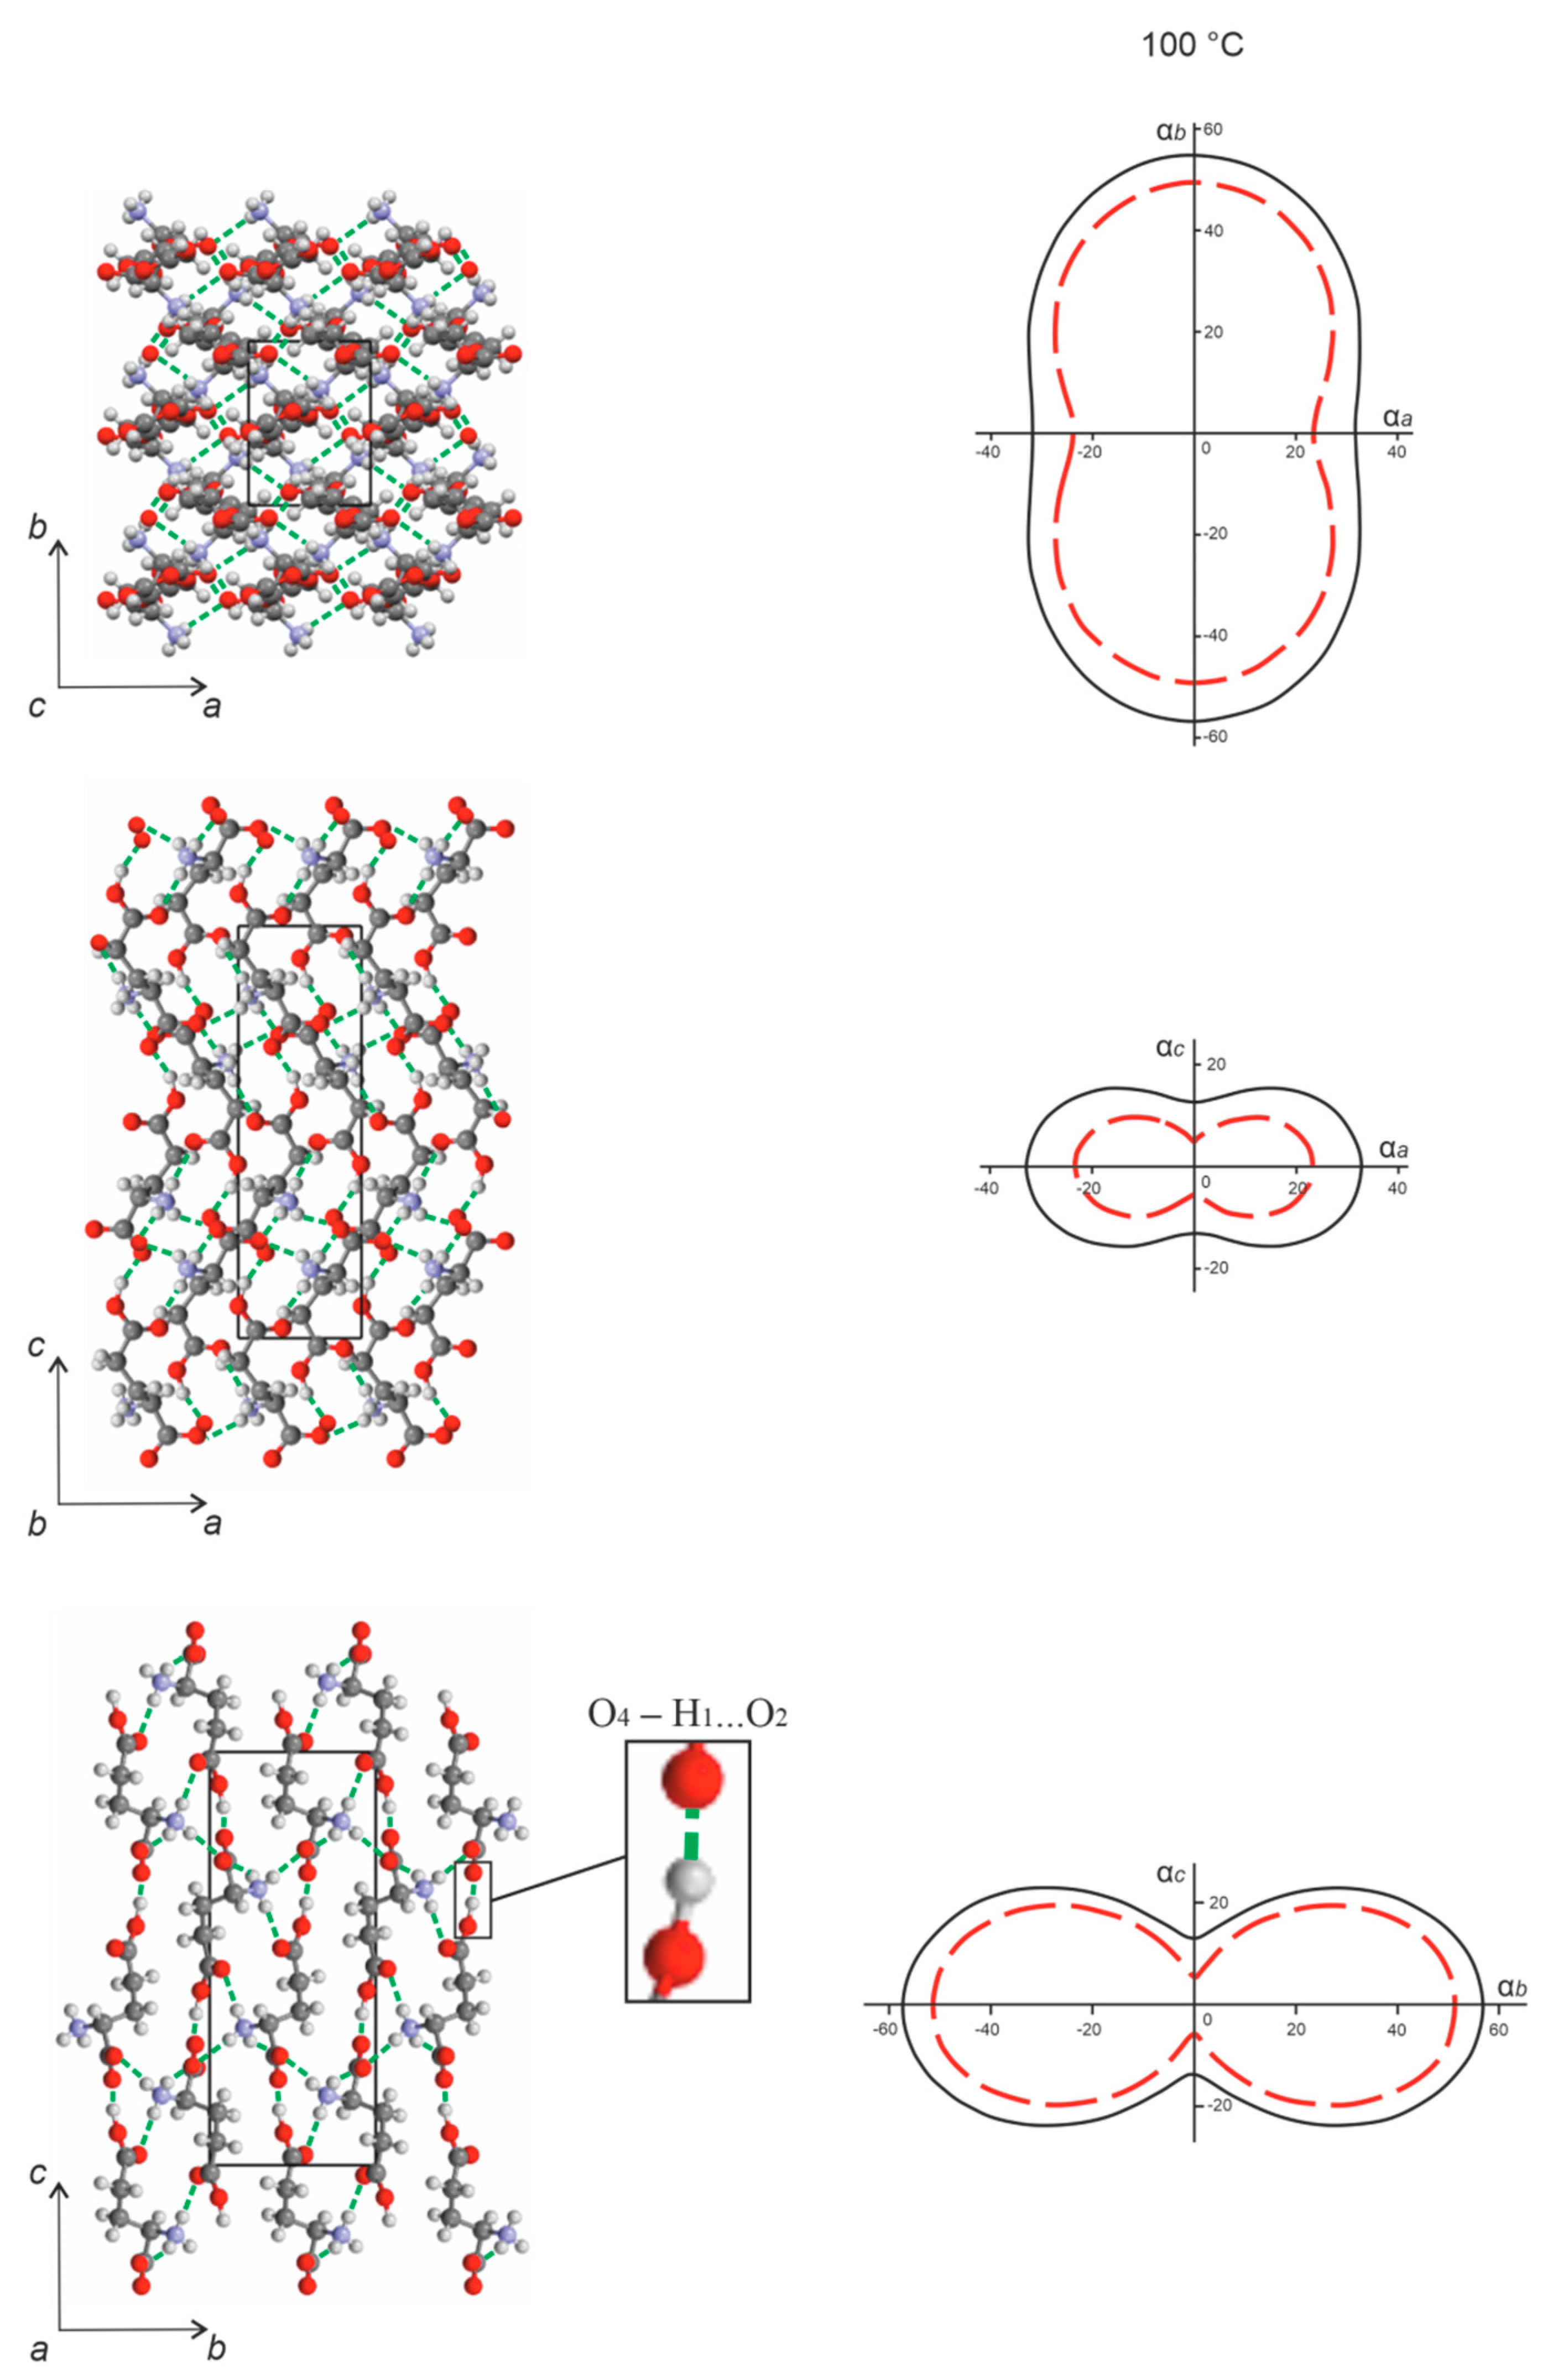
4.1. Monoclinic Amino Acids L-asp and DL-asp

The molecules in the L-asp crystal structure (Figure 8) are arranged in zigzag chains extended along the direction close to that of the bisector of the acute angle a^c. The chain units are interconnected via the strongest hydrogen bond in the structure—namely, O4–H1…O1 = 2577 Å—which is highlighted in the projection of the L-asp crystal structure onto the ac plane. This bond is essentially co-directional with the direction of the negative thermal expansion (α33). There are two other hydrogen bonds—N–H5…O2 and N–H6…O3—formed in approximately the same direction and within the same plane. The maximum thermal expansion is directed along the α33 axis of the thermal deformation tensor, which approximates the bisector of the obtuse angle a^c, i.e., the β angle; only one hydrogen bond—namely, N–H4…O2—is extended in that direction (Figure 8, projection ac). A sufficiently great value of the CTE is observed along the α22 axis (which coincides with axis b), which can be explained by the relatively low concentration of hydrogen bonds along this direction compared to the crystallographic axis a (Figure 8, projection ab).
Therefore, at elevated temperatures, the L-asp crystal structure naturally contracts along the direction in which several hydrogen bonds are grouped, including the strongest hydrogen bond: O4–H1…O1. This contraction is accompanied by a diminution in the β angle (see Figure 6a), and is characterized by maximum anisotropy of the thermal deformations within the ac plane (Figure 8).
The crystal structure of DL-asp is also characterized by negative thermal expansion in the ac plane (Figure 9). In contrast to L-asp, however, the racemate structure contracts along the direction of the bisector of the obtuse angle a^c, i.e., the β angle (Figure 9, projection ac). This may be due to the fact that this is also the direction of the strongest hydrogen bond: O4–H7…O2 = 2558 Å. The closely located hydrogen bonds of the N–H…O type may also facilitate the contraction. Therefore, in this case, contraction with increase in temperature is accompanied by enlargement of the β angle.
The greatest thermal expansion of the DL-asp crystal structure is observed in the direction of crystallographic axis bb = α22). This may be the result of molecular layers formed from interconnected chains of molecules that are arranged in the direction orthogonal to the b axis (within the ac plane). Each D- or L-asp molecule located within the layer is bonded to two molecules located in the previous and subsequent layers via N–H2…O1 and N–H3…O1 hydrogen bonds. This interlayer interaction is not very strong (Figure 9, left, projection bc*) and, therefore, the maximum expansion of the DL-asp crystal structure is directed along the b axis.
In the crystal structures of the aspartic acid enantiomer and the racemate, the negative thermal expansion in the ac plane is co-directed with the direction of the strongest hydrogen bonds of the O–H…O type: O4–H1…O1 (L-asp) and O4–H7…O2 (DL-asp). Individual particularities of thermal deformations in their crystal structures are most clearly visible in the changes in the monoclinic angle β, which for L-asp decreases, but for DL-asp increases. Accordingly, the maximum thermal expansion in both crystal structures occurs along the direction of relatively weak hydrogen bonds of the N–H…O type. Therefore, for both structures, the hydrogen bonds of the O–H…O type are stronger than the hydrogen bonds of the N–H…O type. Additionally, the geometry and concertation of the bonds should be taken into account.
The effect of changing the angle β in monoclinic crystals with elevation of temperature is described in detail by S.K. Filatov et al. [26,27]. Such thermal behavior is typical of crystalline structures, where either one angular parameter (monoclinic cell) or three angular parameters (triclinic cell) are not symmetrically fixed. In addition to thermal expansion, such crystalline structures can also undergo shear deformations characterized by shifts in the molecular rows relative to one another.
Figure 11 illustrates simulated shear deformations in monoclinic crystal models projected for the ac plane. Increasing the β1 angle of the initial orthorhombic structure (Figure 11a, solid line) to reach the β2 value (dashed line) is accompanied by contraction of the crystal structure along the bisector of this angle, and by its simultaneous expansion in the orthogonal direction. Similarly, decreasing the initial β1 angle (Figure 11b, solid line) to the smaller value β2 (dashed line) also leads to contraction of the crystal structure; however, this contraction occurs along the direction orthogonal to the β angle bisector, and at the same time the structure is expanded in the direction parallel to this bisector. Figure 11a,b also show the CTE figures and the regions corresponding to the positive (axis α11) and negative (axis α33) thermal expansion.
A decrease in the β angle with increase in temperature was also observed for enantiomers of two other monoclinic amino acids—namely, L-valine and L-isoleucine [9]. However, in these cases the changes in the crystal structures at elevated temperatures were not accompanied by negative thermal expansion, as revealed for L- and DL-aspartic acid.

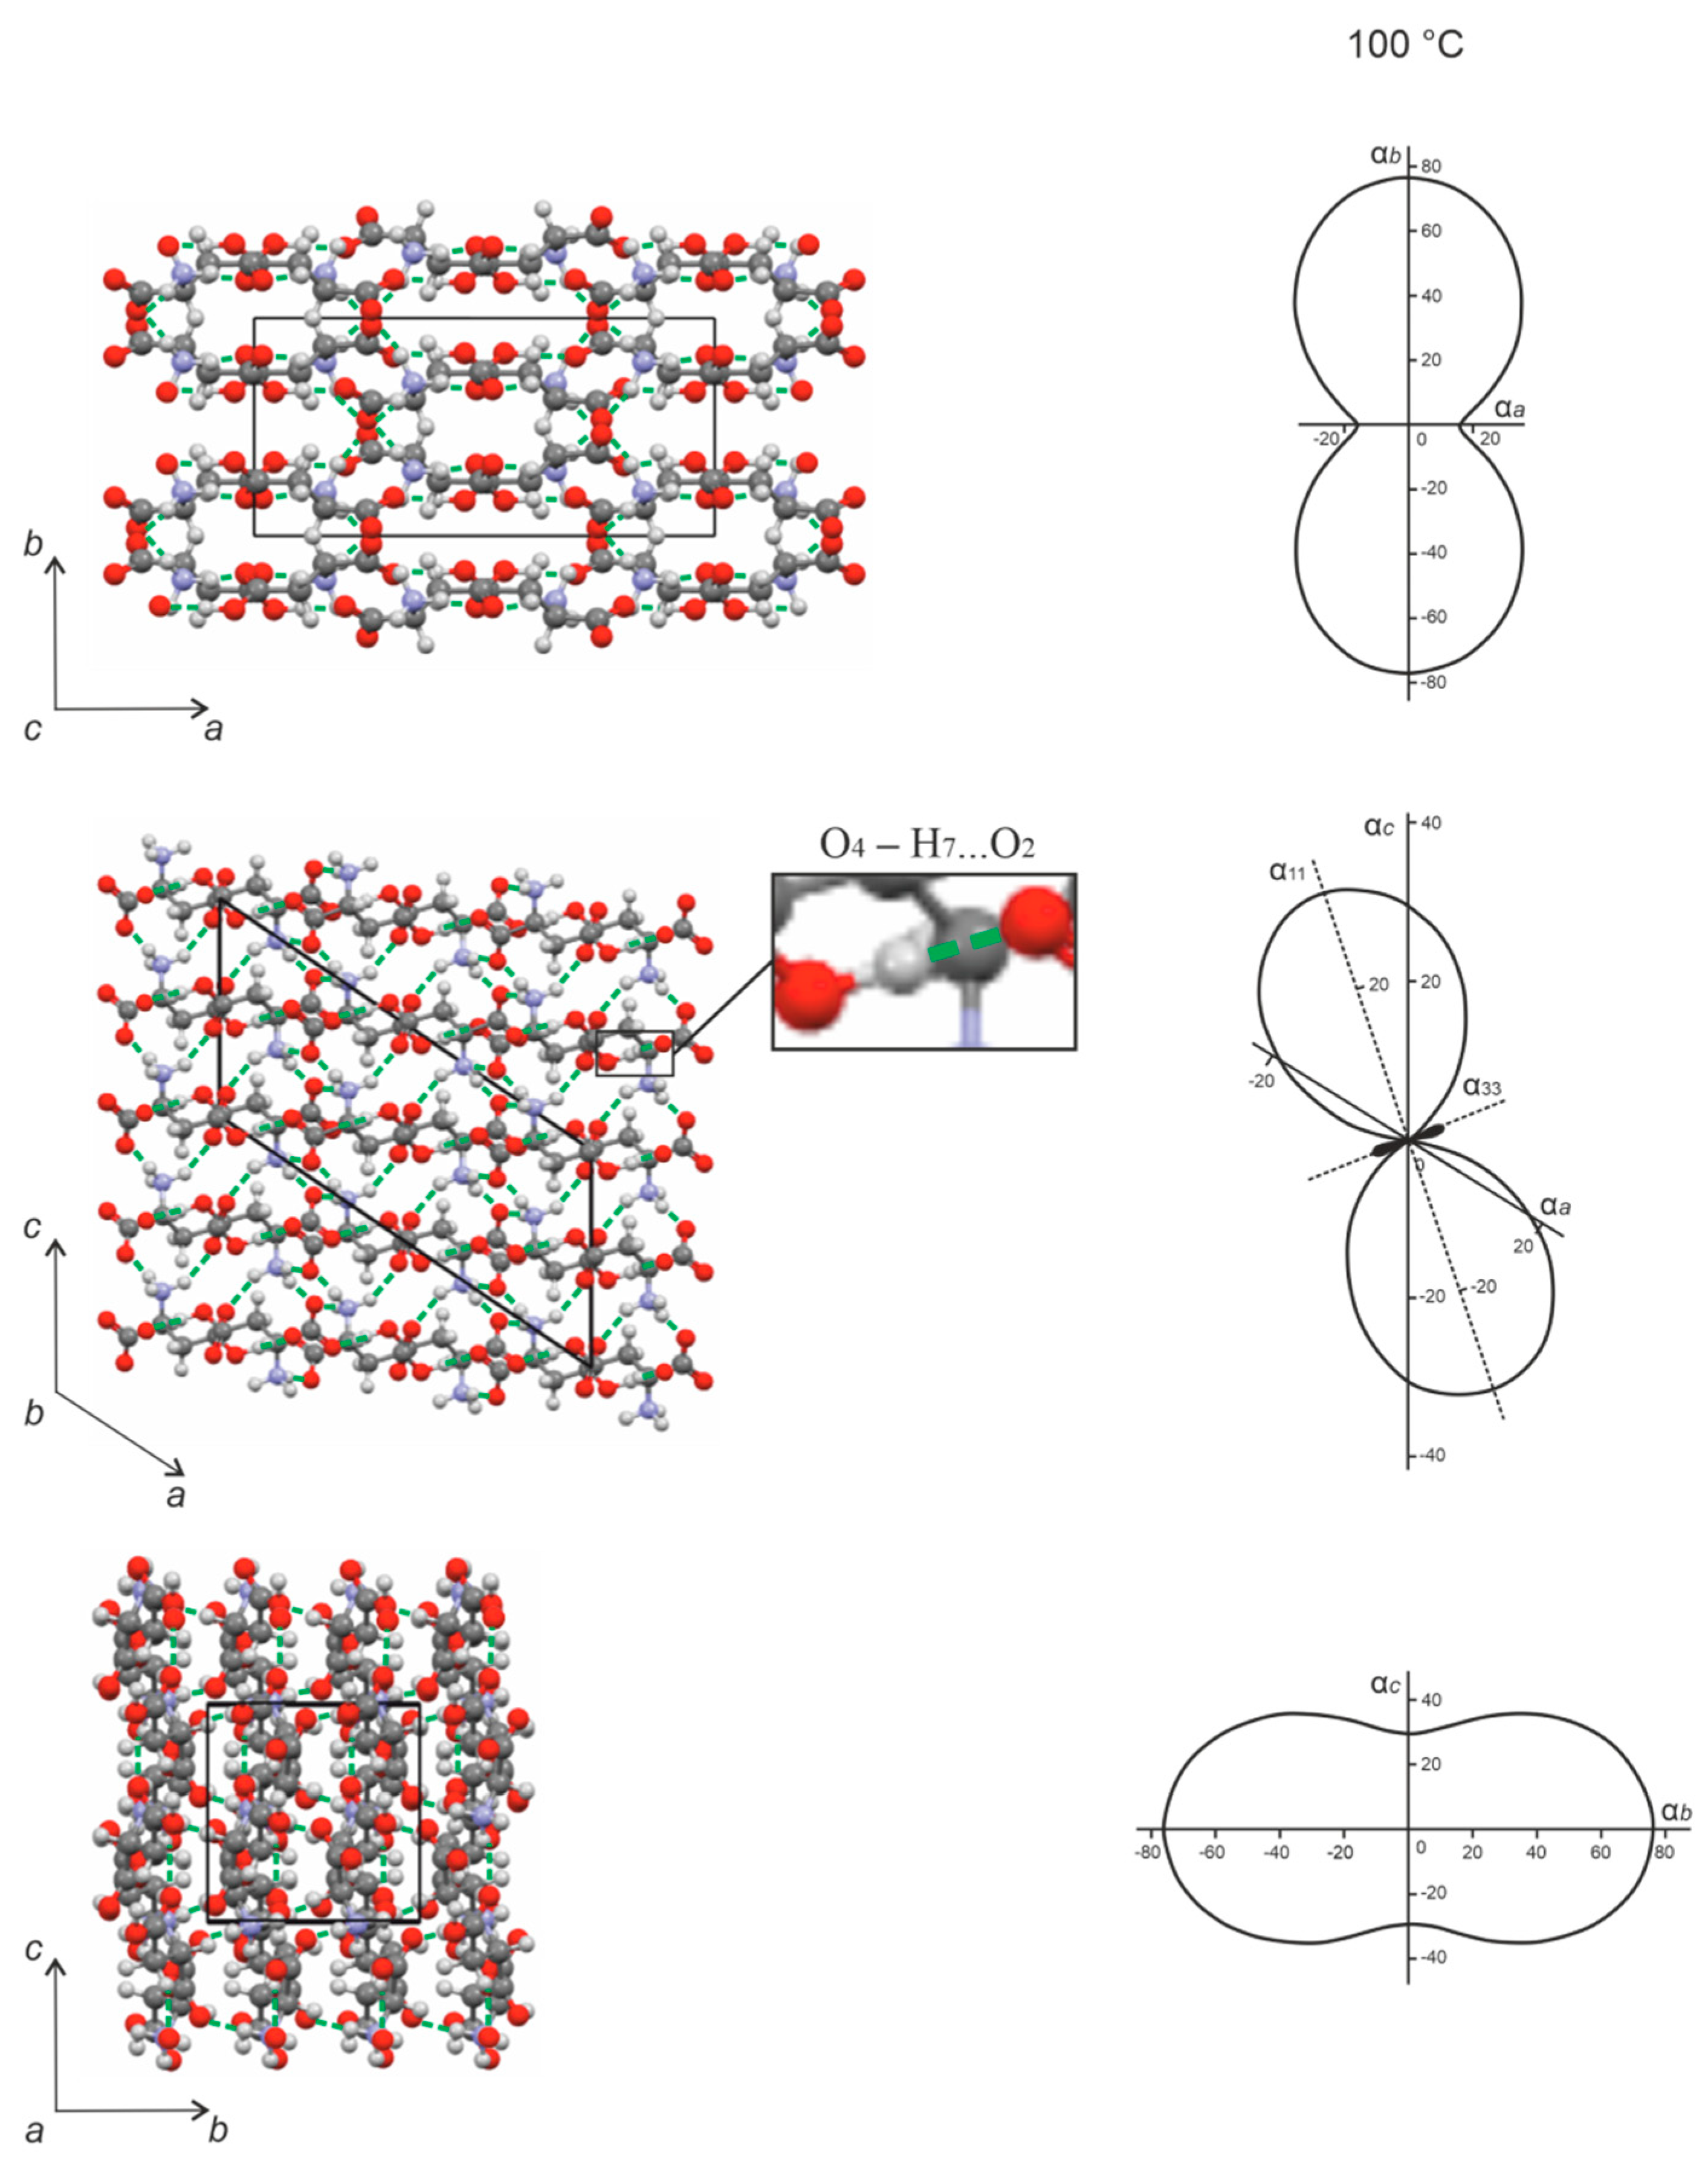
4.2. Orthorhombic Amino Acids L-glu and L-asp0.25,L-glu0.75

The strongest hydrogen bond in the orthorhombic crystal structure of L-glu is O4–H1…O2 = 2519 Å (Figure 10, left, highlighted), which bonds the molecules into zigzagged chains extended along the crystallographic axis c. This explains the minimal CTE value observed along the c axis compared to the other crystallographic directions (Figure 10, right, solid black line). The chains are joined to one another by means of a hydrogen bond (N–H5…O1) to form layers arranged orthogonally to the b axis. The layers, in turn, are bonded via two other hydrogen bonds, i.e., N–H6…O3 and N–H9…O1. The maximal thermal expansion observed along the b axis can be explained by the fact that the direction of the hydrogen bonds uniting the molecular layers deviates to a considerable extent from direction of the b axis. The most significant anisotropy of the thermal deformation was noticed within the ac and bc planes (Figure 10, right, solid black line).
Generally, projections of the CTE figures of the L-asp0.25,L-glu0.75 solid solution onto the ab, ac, and bc planes (Figure 10, right, dashed red line) were of similar proportions—in fact, substantially alike—to the CTE figure of L-glu. However, the CTE values obtained for the solid solution were diminished along all three crystallographic directions in comparison to L-glu. The greatest decrease in the CTE values was observed in the projections upon the ac and bc planes.
The minimal CTE values in the crystal structures of L-glu and the L-asp0.25,L-glu0.75 solid solution are observed in the direction of the strongest hydrogen bond: O4–H1…O2. Conversely, the maximal thermal expansion occurs in the direction of the weakest interaction between the molecules, which may be related to the geometry and low concentration of relatively weak hydrogen bonds of the N–H…O type in the crystal structure of the L-glu enantiomer. The temperature dependencies of the orthorhombic cell parameters and the CTE figures of L-glu (see Figure 7a and Figure 10, solid black line) and the L-asp0.25,L-glu0.75 solid solution (see Figure 7b and Figure 10, dashed red line) have definite similarities. Discrepancies in the thermal changes to their orthorhombic cell parameters and, accordingly, different CTE values, can be caused by a different degree of imperfection of their crystal structure. Substitution of some of the L-glu molecules with smaller L-asp molecules results in the formation of defects, such as voids, in the crystal structure of the solid solution. Expansion of its crystal structure at elevated temperatures can be partially compensated for by the presence of these voids. For this reason, the intensity of changes in the L-asp0.25,L-glu0.75 orthorhombic parameters is considerably lower than that for the L-glu enantiomer.
The above results were compared with similar studies of thermal deformations for (1) the orthorhombic components in the L-threonine/L-allo-threonine (L-thr/L-athr) diastereomer system, and two solid solutions of both—namely, L-thr0.34,L-athr0.66 and L-thr0.10,L-athr0.90 [17]—and (2) the orthorhombic components in the L-alanine (L-ala) and L-serine (L-ser) enantiomer system [19]. It appears that heating resulted in increases in all orthorhombic parameters of L-glu and those of the solid solutions L-asp0.25,L-glu0.75, L-thr0.34,L-athr0.66, and L-thr0.10,L-athr0.90, and in diminution of one of the parameters of the diastereomers L-thr and L-athr and the enantiomers L-ala and L-ser. Increasing all of the parameters indicates the predominantly thermal expansion of the crystal structure. Decreasing one of the parameters allows, in addition, the use of the concept of the hinge mechanism of thermal deformations [26].

5. Conclusions

It was established that, when heated, the L-enantiomers of aspartic and glutamic acid, the aspartic acid racemate, and the L-asp0.25,L-glu0.75 solid solution do not undergo polymorphic transitions, but experience thermal deformations. The mode of the thermal deformations observed in all of the above crystal structures was consistent with the distance, type, geometry, and concentration of the intermolecular hydrogen bonds.
Thermal deformations of L-asp and DL-asp are characterized by the manifestation of negative thermal expansion—i.e., contraction—of their crystal structures in the monoclinicity plane ac. Explanation of this effect of contraction is based on the contribution of shear deformations to thermal deformations of the crystal structure.
Thermal deformations of L-glu and the L-asp0.25,L-glu0.75 solid solution are characterized by increases in all of the parameters of their orthorhombic cells. The CTE values obtained for the solid solution were lower than those calculated for the L-glu enantiomer. The reason for this difference seems to be imperfection of the solid solution crystal structure due to isomorphic substitution of some L-glu molecules by the smaller-sized L-asp molecules.
The results of the present study were compared with data for other amino acids—such as L-valine, L-isoleucine, L-threonine, L-allo-threonine, and solid solutions of the latter two—that we had investigated previously [9,17,19].
The results obtained made it possible to reveal the individual specific features of the amino acids’ thermal behavior, which is important for their efficient application.

Author Contributions

Conceptualization, E.K. and H.L.; methodology, E.K., H.L. and R.S.; formal analysis, R.S.; investigation, R.S. and E.K.; writing—original draft preparation, R.S. and E.K.; writing—review and editing, R.S., E.K. and H.L.; visualization, E.K. and R.S.; supervision, H.L. All authors read and agreed to the published version of the manuscript.

Funding

This work was supported by the President of Russian Federation Grant to leading scientific schools (NSh-2526.2020.5).

Acknowledgments

The investigations were performed using equipment from the Resource Centre “Centre for X-ray Diffraction Studies” of St. Petersburg State University. The authors thank M.G. Krzhizhanovskaya, A.I. Isakov, L. Yu. Kruchkova, A.A. Zolotarev Jr., and N.V. Platonova for collaboration.

Conflicts of Interest

The authors declare no conflict of interest.

References

  1. Nelson, D.L.; Cox, N.N. Lehninger Principles of Biochemistry, 4th ed.; W. H. Freeman: New York, NY, USA, 2005; p. 1125. [Google Scholar]
  2. Giron, D. Polymorphism in the pharmaceutical industry. Therm. Anal. Calorim. 2001, 64, 37–60. [Google Scholar] [CrossRef]
  3. Murakami, H. From Racemates to Single Enantiomers–Chiral Synthetic Drugs over the last 20 year. Top. Curr. Chem. 2006, 269, 273–299. [Google Scholar]
  4. Bredikhin, A.; Bredikhina, Z.; Zakharychev, D. Crystallization of chiral compounds: Thermodynamical, structural and practical aspects. Mendeleev Commun. 2012, 22, 171–180. [Google Scholar] [CrossRef]
  5. Robins, J.; Jones, M.; Matisoo-Smith, E. Amino Acid Racemization Dating in New Zealand: An Overview and Bibliography; Auckland Univ.: Auckland, New Zealand, 2010. [Google Scholar]
  6. Killops, S. Introduction to Organic Geochemistry, 2end edn (paperback). Geofluids 2005, 5, 236–237. [Google Scholar] [CrossRef]
  7. Torres, T.; Ortiz, J.; Arribas, I.; Delgado, A.; Julia, R.; Martín-Rubí, J. Geochemistry of Persististrombus latus Gmelin from the Pleistocene Iberian Mediterranean realm. Lethaia 2010, 43, 149–163. [Google Scholar] [CrossRef] [Green Version]
  8. Saha, B.K. Thermal Expansion in Organic Crystals. J. Indian Inst. Sci. 2017, 97, 177–191. [Google Scholar] [CrossRef]
  9. Kotelnikova, E.; Isakov, A.; Lorenz, H. Thermal deformations of crystal structures formed in the systems of malic acid enantiomers and L-valine–L-isoleucine enantiomers. CrystEngComm. 2018, 20, 2562–2572. [Google Scholar] [CrossRef] [Green Version]
  10. Jessen, S.M.; Kuppers, H. The precision of thermal expansion tensors of triclinic and monoclinic crystals. J. Appl. Crystallogr. 1991, 24, 239–242. [Google Scholar] [CrossRef]
  11. Evans, J.S.O. Negative thermal expansion materials. J. Chem. Soc. Dalton Trans. 1999, 19, 3317–3326. [Google Scholar] [CrossRef]
  12. Miller, W.; Smith, C.W.; Mackenzie, D.S.; Evans, K.E. Negative thermal expansion: A review. J. Mater. Sci. 2009, 44, 5441–5451. [Google Scholar] [CrossRef]
  13. Nakata, K.; Takaki, Y.; Sakurai, K. Structure of the D form of DL-α-amino-n-butyric acid. Acta Cryst. 1980, 36, 504–506. [Google Scholar] [CrossRef]
  14. Coles, S.J.; Gelbrich, T.; Griesser, U.J.; Hursthouse, M.B.; Pitak, M.; Threlfall, T. The Elusive High Temperature Solid-State Structure of D,L-Norleucine. Cryst. Growth Des. 2009, 9, 4610–4612. [Google Scholar] [CrossRef]
  15. Görbitz, C.H.; Qi, L.; Mai, N.T.K.; Kristiansen, H. Redetermined crystal structure of α-DL-methionine at 340 K. Acta Cryst. 2014, 70, 337–340. [Google Scholar] [CrossRef] [Green Version]
  16. Görbitz, C.H.; Karen, P.; Dušek, M.; Petříček, V. An exceptional series of phase transitions in hydrophobic amino acids with linear side chains. IUCrJ. 2016, 3, 341–353. [Google Scholar] [CrossRef] [PubMed] [Green Version]
  17. Taratin, N.; Lorenz, H.; Binev, D.; Seidel-Morgenstern, A.; Kotelnikova, E. Solubility equilibria and crystallographic characterization of the L-threonine/L-allo-threonine system. Part 2: Crystallographic characterization of solid solutions in the threonine diastereomeric system. Cryst. Growth Des. 2015, 15, 137–144. [Google Scholar] [CrossRef]
  18. Isakov, A.; Kotelnikova, E.; Bocharov, S.; Zolotarev, A.J.; Lorenz, H. Thermal deformations of the crystal structures of L-valine, L-isoleucine and discrete compound V2I. In Proceedings of the 23rd International Workshop on Industrial Crystallization (BIWIC-2016), Magdeburg, Germany, 6–8 September 2016; pp. 7–12. [Google Scholar]
  19. Kotelnikova, E.N.; Sadovnichii, R.V.; Kryuchkova, L.Y.; Lorenz, H. Limits of Solid Solutions and Thermal Deformations in the L-Alanine–L-Serine Amino Acid System. Crystals 2020, 10, 618. [Google Scholar] [CrossRef]
  20. Derissen, J.L.; Endeman, H.J.; Peerdeman, A.F. The crystal and molecular structure of L-aspartic acid. Acta Cryst. Sect. B Struct. Crystallogr. Cryst. Chem. 1968, 24, 1349–1354. [Google Scholar] [CrossRef]
  21. Rao, S.T. Refinement of DL-Aspartic Acid. Acta Cryst. 1973, 29, 1718–1720. [Google Scholar] [CrossRef]
  22. Ruggiero, M.T.; Sibik, J.; Zeitler, J.A.; Korter, T.M. Examination of l-Glutamic Acid Polymorphs by Solid-State Density Functional Theory and Terahertz Spectroscopy. J. Phys. Chem. A 2016, 120, 7490–7495. [Google Scholar] [CrossRef]
  23. Kitamura, M. Polymorphism in the Crystallization of L-Glutamic Acid. J. Cryst. Growth 1989, 96, 541–546. [Google Scholar] [CrossRef]
  24. Sugita, Y. Polymorphism of L-Glutamic Acid Crystals and Inhibitory Substance for β- Transition in Beet Molasses. Agric. Biol. Chem. 1988, 52, 3081–3085. [Google Scholar]
  25. CSD files (identifiers): LASPRT (L-asp), DLASPA02 (DL-asp) and LGLUAC01 (L-glu). Available online: https://www.ccdc.cam.ac.uk (accessed on 6 August 2021).
  26. Filatov, S.; Krivovichev, S.; Bubnova, R. General Crystal Chemistry; Publishing House of St. Petersburg University: St. Petersburg, Russia, 2018; pp. 222–224. (In Russian) [Google Scholar]
  27. Filatov, S.; Bubnova, R. The nature of special points on unit cell parameters temperature dependences for crystal substances. Z. Kristallogr. 2007, 26, 447–452. [Google Scholar] [CrossRef]
Figure 1. Structural formulae and spatial structures of the molecules of L-asp (a) and L-glu (b).
Crystals 11 01102 g001
Figure 2. X-ray patterns of an L-asp sample obtained at various temperatures.
Crystals 11 01102 g002
Figure 3. X-ray patterns of a DL-asp sample obtained at various temperatures.
Crystals 11 01102 g003
Figure 4. X-ray patterns of an L-glu sample obtained at various temperatures. The majority of the peaks correspond to the β-L-glu modification. The peaks belonging to the α-L-glu modification are marked with an asterisk.
Crystals 11 01102 g004
Figure 5. X-ray patterns of an L-asp0.25,L-glu0.75 solid solution obtained at various temperatures.
Crystals 11 01102 g005
Figure 6. Temperature dependencies of the monoclinic cell parameters a, b, c (Å), β (°), and volume V3) of L-asp (a) and DL-asp (b). The errors in calculating the parameters and volume do not exceed the marker size.
Crystals 11 01102 g006
Figure 7. Temperature dependencies of the orthorhombic cell parameters a, b, c (Å), and volume V3) of L-glu (a) and the L-asp0.25,L-glu0.75 solid solution (b). The errors in calculating the parameters and volume do not exceed the marker size.
Crystals 11 01102 g007
Figure 8. Projections of the CTE figures onto the ab, ac, and bc planes (right), and projections of the crystal structure onto the a*b, ac, and bc* planes (left) in the monoclinic cell of L-aspartic acid. Black shade corresponds to the region of the negative thermal expansion. Hydrogen bonds are shown as green dashed lines. The crystal structure projections were plotted using the structural data from CSD (LASPRT) [25].
Crystals 11 01102 g008
Figure 9. Projections of the CTE figures onto the ab, ac, and bc planes (right), and projections of the crystal structure onto the a*b, ac, and bc* planes (left) in the monoclinic cell of DL-aspartic acid. Black shade corresponds to the region of the negative thermal expansion. Hydrogen bonds are shown as green dashed lines. The crystal structure projections were plotted using the structural data from CSD (DLASPA02) [25].
Crystals 11 01102 g009
Figure 10. CTE figures of L-glutamic acid (solid black line) and the solid solution L-asp0.25L-glu0.75 (red dashed line) projected upon the ab, ac, and bc planes of the corresponding orthorhombic cells (right). Projections of the L-glu crystal structure onto the same planes (left). Hydrogen bonds are shown as green dashed lines. The crystal structure projections were plotted using the structural data from CSD (LGLUAC01) [25].
Crystals 11 01102 g010
Figure 11. Schematic representation of shear deformation in relation to the figures of the thermal expansion coefficients (α11 and α33) for increased (a) and decreased (b) angle β. Angles β1 and β2 are the monoclinic angles before and after the shear deformation, respectively. The image was plotted with partial use of the data reported in [26].
Crystals 11 01102 g011
Table 1. Thermal expansion coefficients (αV * 10−6 °C−1) for the monoclinic cell volume of L- and DL-asp.
SampleαV
L-asp112(1)
DL-asp107(1)
Table 2. Thermal expansion coefficients (αV * 10−6 °C−1) for the orthorhombic cell volume of L-glu and the L-asp0.25,L-glu0.75 solid solution.
SampleαV
L-glu100(1)
L-asp0.25,L-glu0.7579(2)
Table 3. Thermal expansion coefficients (α * 10−6 °C−1) for the monoclinic crystal structures of L-asp and DL-asp along the axes of the thermal deformation tensor, and along the crystallographic axes.
Sampleα11α22α33αaαb = α22αc
L-asp−7.257.959.810.9(5)57.9(6)30.8(9)
DL-asp34.678.2−4.118.7(6)78.2(5)31.5(7)
Table 4. Thermal expansion coefficients (α * 10−6 °C−1) for the orthorhombic crystal structures of L-glu and L-asp0.25,L-glu0.75 along the axes of the thermal deformation tensor, and the crystallographic axes.
Sampleαa = α11αb = α22αc = α33
L-glu31.2(8)56.6(6)13.5(7)
L-asp0.25,L-glu0.7523(1)52(1)6(1)
Publisher’s Note: MDPI stays neutral with regard to jurisdictional claims in published maps and institutional affiliations.

