Abstract
The interface behavior of brazing between Zr-Cu filler metal and SiC ceramic was investigated. Based on the brazing experiment, the formation of brazing interface products was analyzed using OM, SEM, XRD and other methods. The stable chemical potential phase diagram was established to analyze the possible diffusion path of interface elements, and then the growth behavior of the interface reaction layer was studied by establishing relevant models. The results show that the interface reaction between the active element Zr and SiC ceramic is the main reason in the brazing process the interface products are mainly ZrC and Zr2Si and the possible diffusion path of elements in the product formation process is explained. The kinetic equation of interfacial reaction layer growth is established, and the diffusion constant (2.1479 μm·s1/2) and activation energy (42.65 kJ·mol−1) are obtained. The growth kinetics equation of interfacial reaction layer thickness with holding time at different brazing temperatures is obtained.
1. Introduction
SiC ceramic material has the advantages of high nuclear fuel consumption and difficult to react with hot water vapor at high temperature; therefore, it is very likely to replace zirconium alloy as the fourth generation of nuclear fuel cladding material [1]. At present, single-phase SiC and SiCf/SiC composites with high purity, density, excellent mechanical properties and nuclear properties are mainly prepared using chemical vapor deposition and chemical vapor infiltration, which can basically satisfy the performance requirements of nuclear SiC ceramic materials [2]. However, due to the inherent brittleness of SiC ceramic materials, it is difficult to prepare long and thin (length, 3.8 m; outer diameter, 8~10 mm; wall thickness, ≤1.0 mm) SiC ceramic clad tubes with current preparation technology. Therefore, its joining technology has become the bottleneck of nuclear reactor application. The joining methods of SiC ceramic materials mainly include brazing [3,4], diffusion bonding [5,6], reaction bonding [7] and ceramic precursor bonding [8]. Among them, brazing of the SiC ceramic can obtain ideal joints at lower temperatures and shorter times, and is the most possible joining method to realize mass production. It is widely known that the composition and properties of filler metal are the key factors to achieve the brazing effect of SiC ceramics. The developed filler metals mainly include Ag-based [3], Cu-based [4], Au-based [9], Ti-based [10], Ni-based [11], Co-based solder [12], etc. In terms of high temperature properties, the brazing joint properties of Ag-based and Cu-based filler metals are relatively poor. The joint properties of Au-based filler metal brazing are better, but the cost is high. A joint with the high temperature properties of Ti-based, Ni-based and Co-based filler metals brazing are better. From the thermal neutron absorption cross section, as one of the important indexes to measure the nuclear performance of materials, the thermal neutron absorption cross section of Au is very large, and that of Ti, Ni and Co is also relatively large, which will waste nuclear fuel. To sum up, the traditional brazing filler metal of SiC ceramic material cannot simultaneously have excellent high temperature performance and nuclear performance, which reflects the inapplicability in the harsh environment of a nuclear reactor.
Based on the special application environment of nuclear SiC ceramic materials and the related properties of brazed joints, combined with the mature application of Zr alloy as nuclear fuel rod cladding material [13], the research group innovatively proposed the development and design of Zr-based filler metal [14,15,16]. This paper focuses on the brazing mechanism of Zr-Cu filler metal and SiC ceramic, which lays a theoretical foundation and technical guidance for the development of brazing filler metals and the research of brazing technology.
2. Materials and Methods
Reactive bonded silicon carbide (RBSiC) was used as the brazing parent material in the experiment, and the properties of the SiC ceramic with 20 wt.% free silicon are shown in Table 1. As the filler metal (Zr-Cu filler metal), 80Zr−20Cu (wt.%) was used for brazing the SiC ceramic, and the related performance is shown in Table 2. Before the brazing experiment, the SiC ceramic and Zr-Cu filler metal were processed into shapes 20 × 10 × 10 mm3 and 20 × 10 × 0.2 mm3, and then polished with a 2000# diamond grinding disc and cleaned with an ultrasonic wave in acetone for 30 min. A “sandwich” structure (SiC ceramic/Zr-Cu filler metal/SiC ceramic) was formed and placed in a vacuum brazing furnace (VQS-335, Shenyang, China). The samples were heated to brazing temperature (1200 °C or 1300 °C) with a heating rate of 4 °C/min and holding time (5 min or 20 min or 60 min), and then cooled to room temperature at the same rate. The vacuum degree in the furnace must be guaranteed during the SiC ceramic brazing experiment.
Table 1.
Properties of RBSiC ceramic [14].
Table 2.
The related performance of the Zr-Cu filler metal [16].
The phases of the interfacial reaction layer and the filler metal were characterized using XRD (XRD, Epyrean, Dordrecht, The Netherlands). Before analyzing the microstructure of the interface reaction layer, it was necessary to use the corrosive agent (5 vol.% HF + 5 vol.% HNO3 + 90 vol.% H2O), and the microstructure of the SiC ceramic joint was analyzed using OM (GX71, OLYMPUS, Tokyo, Japan) and scanning electron microscope (S-4800, Hitachi, Tokyo, Japan) with EDS.
3. Results and Discussion
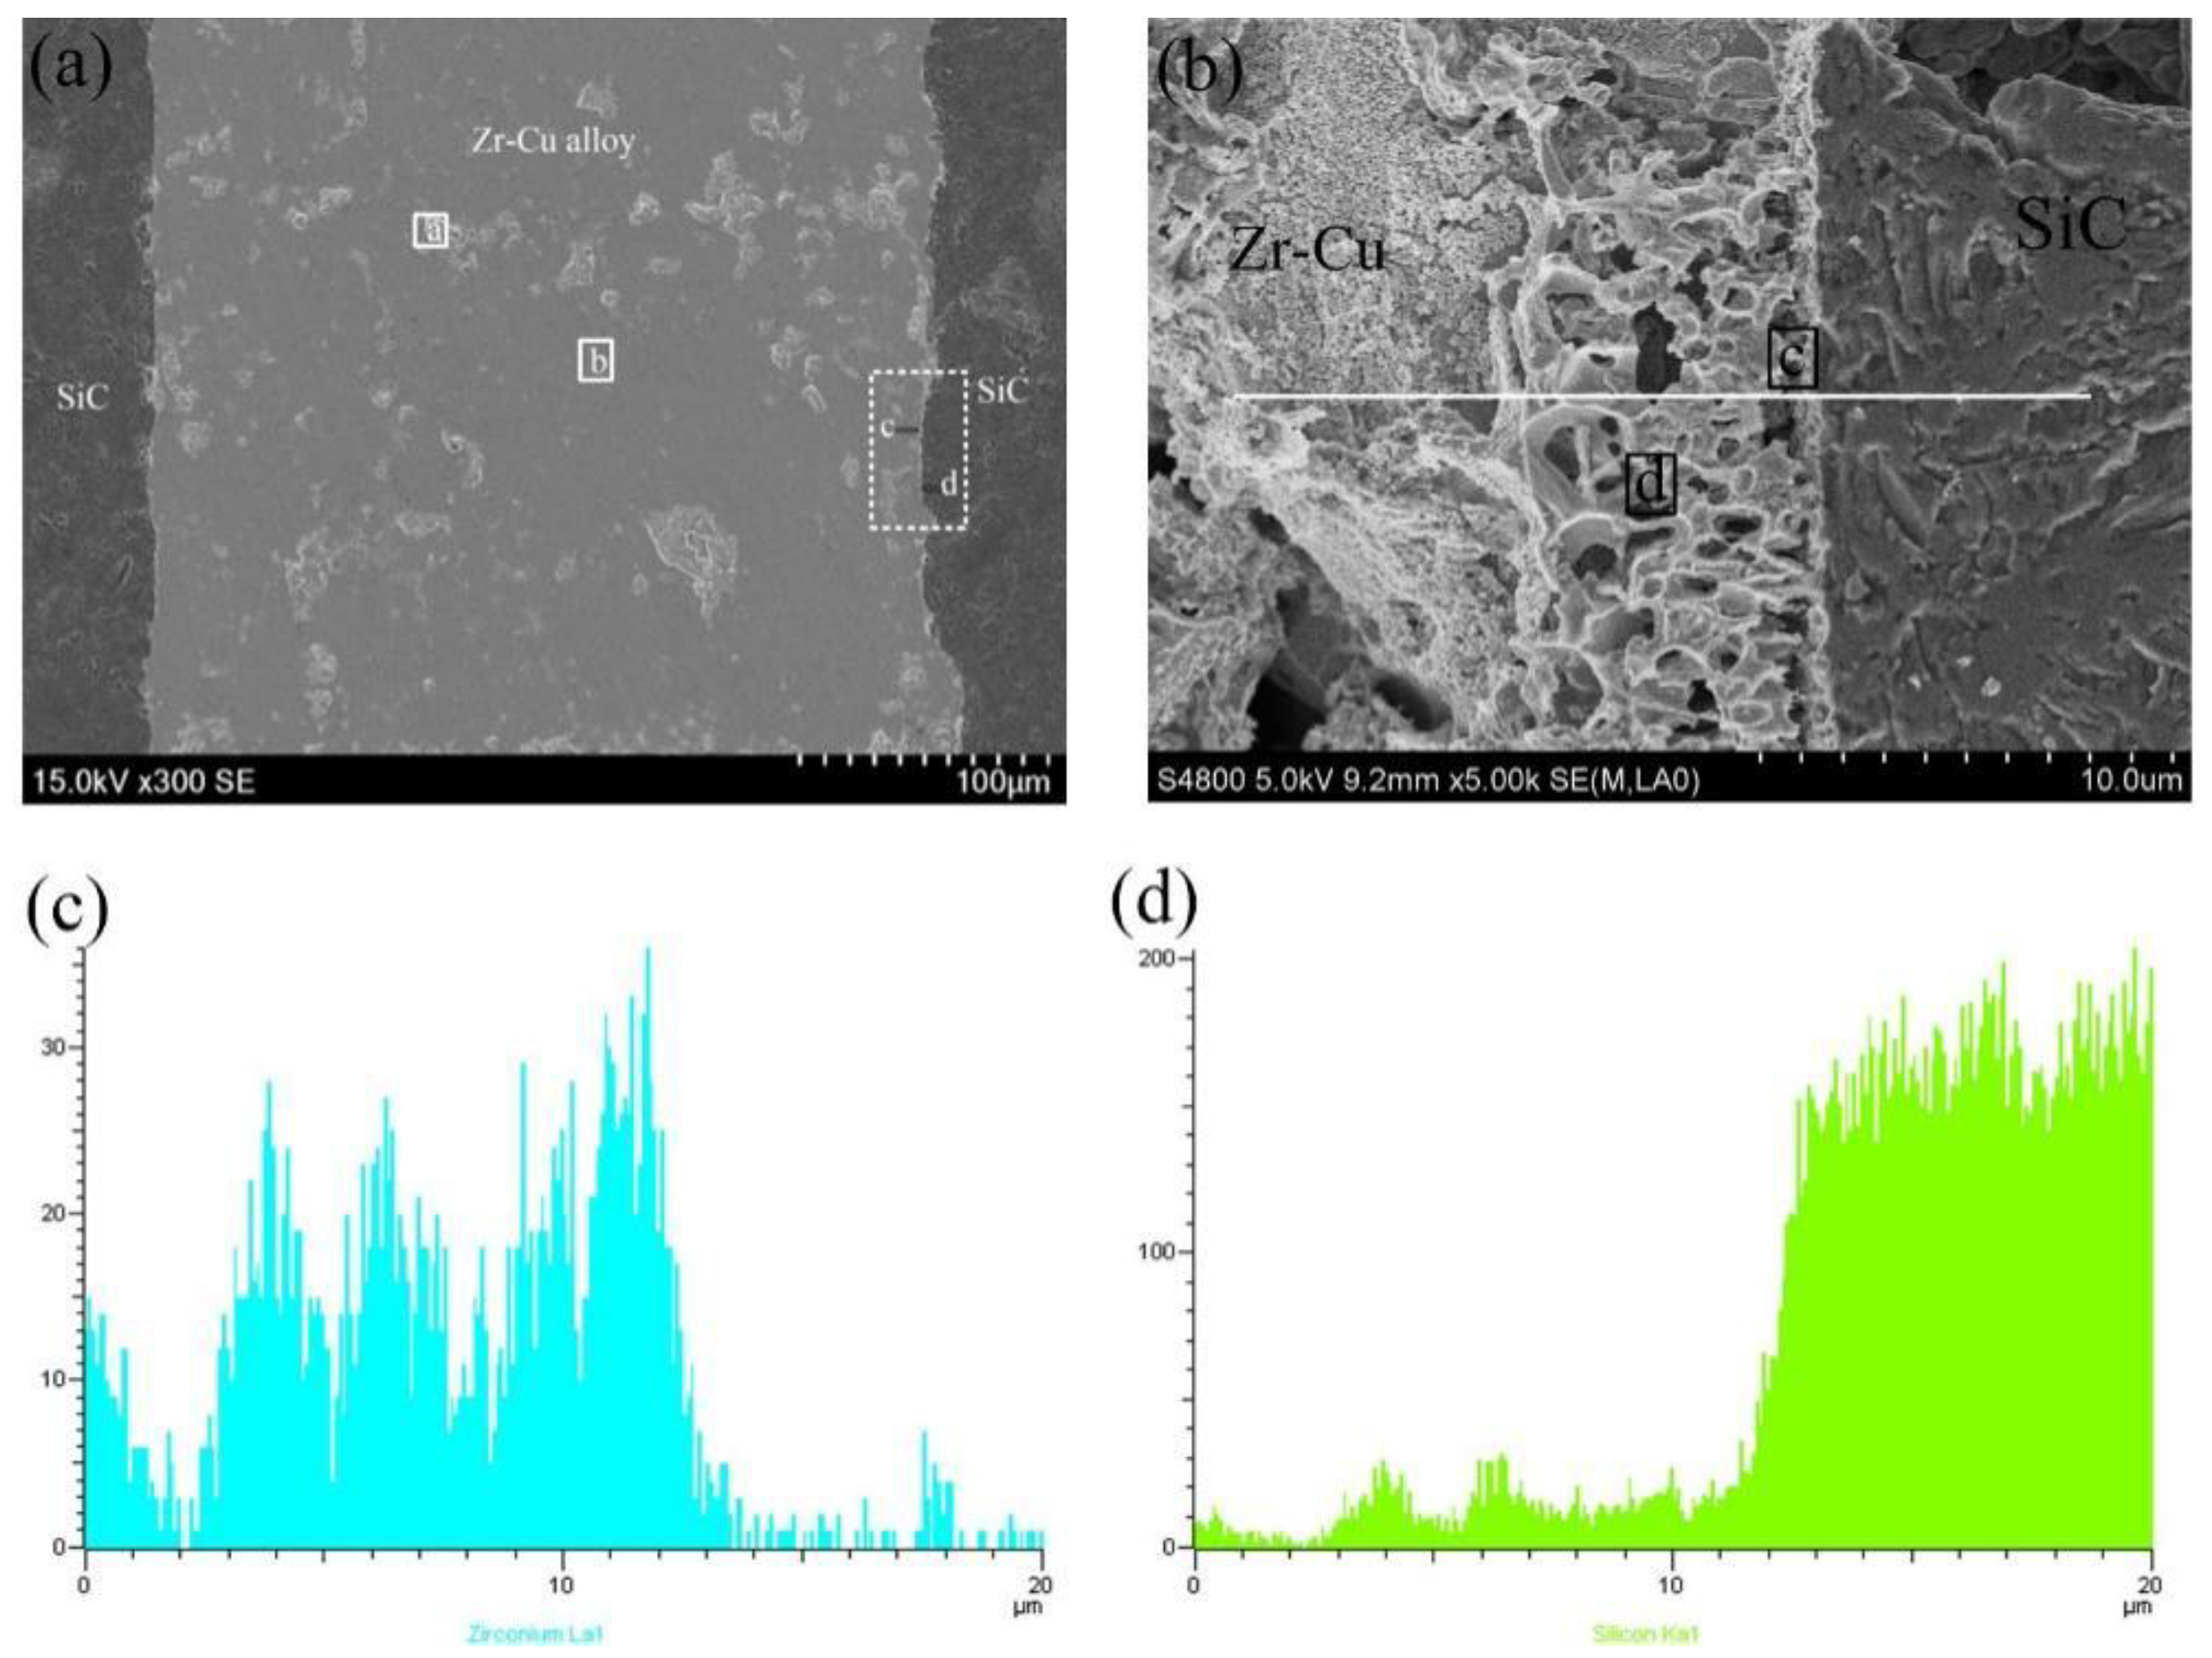
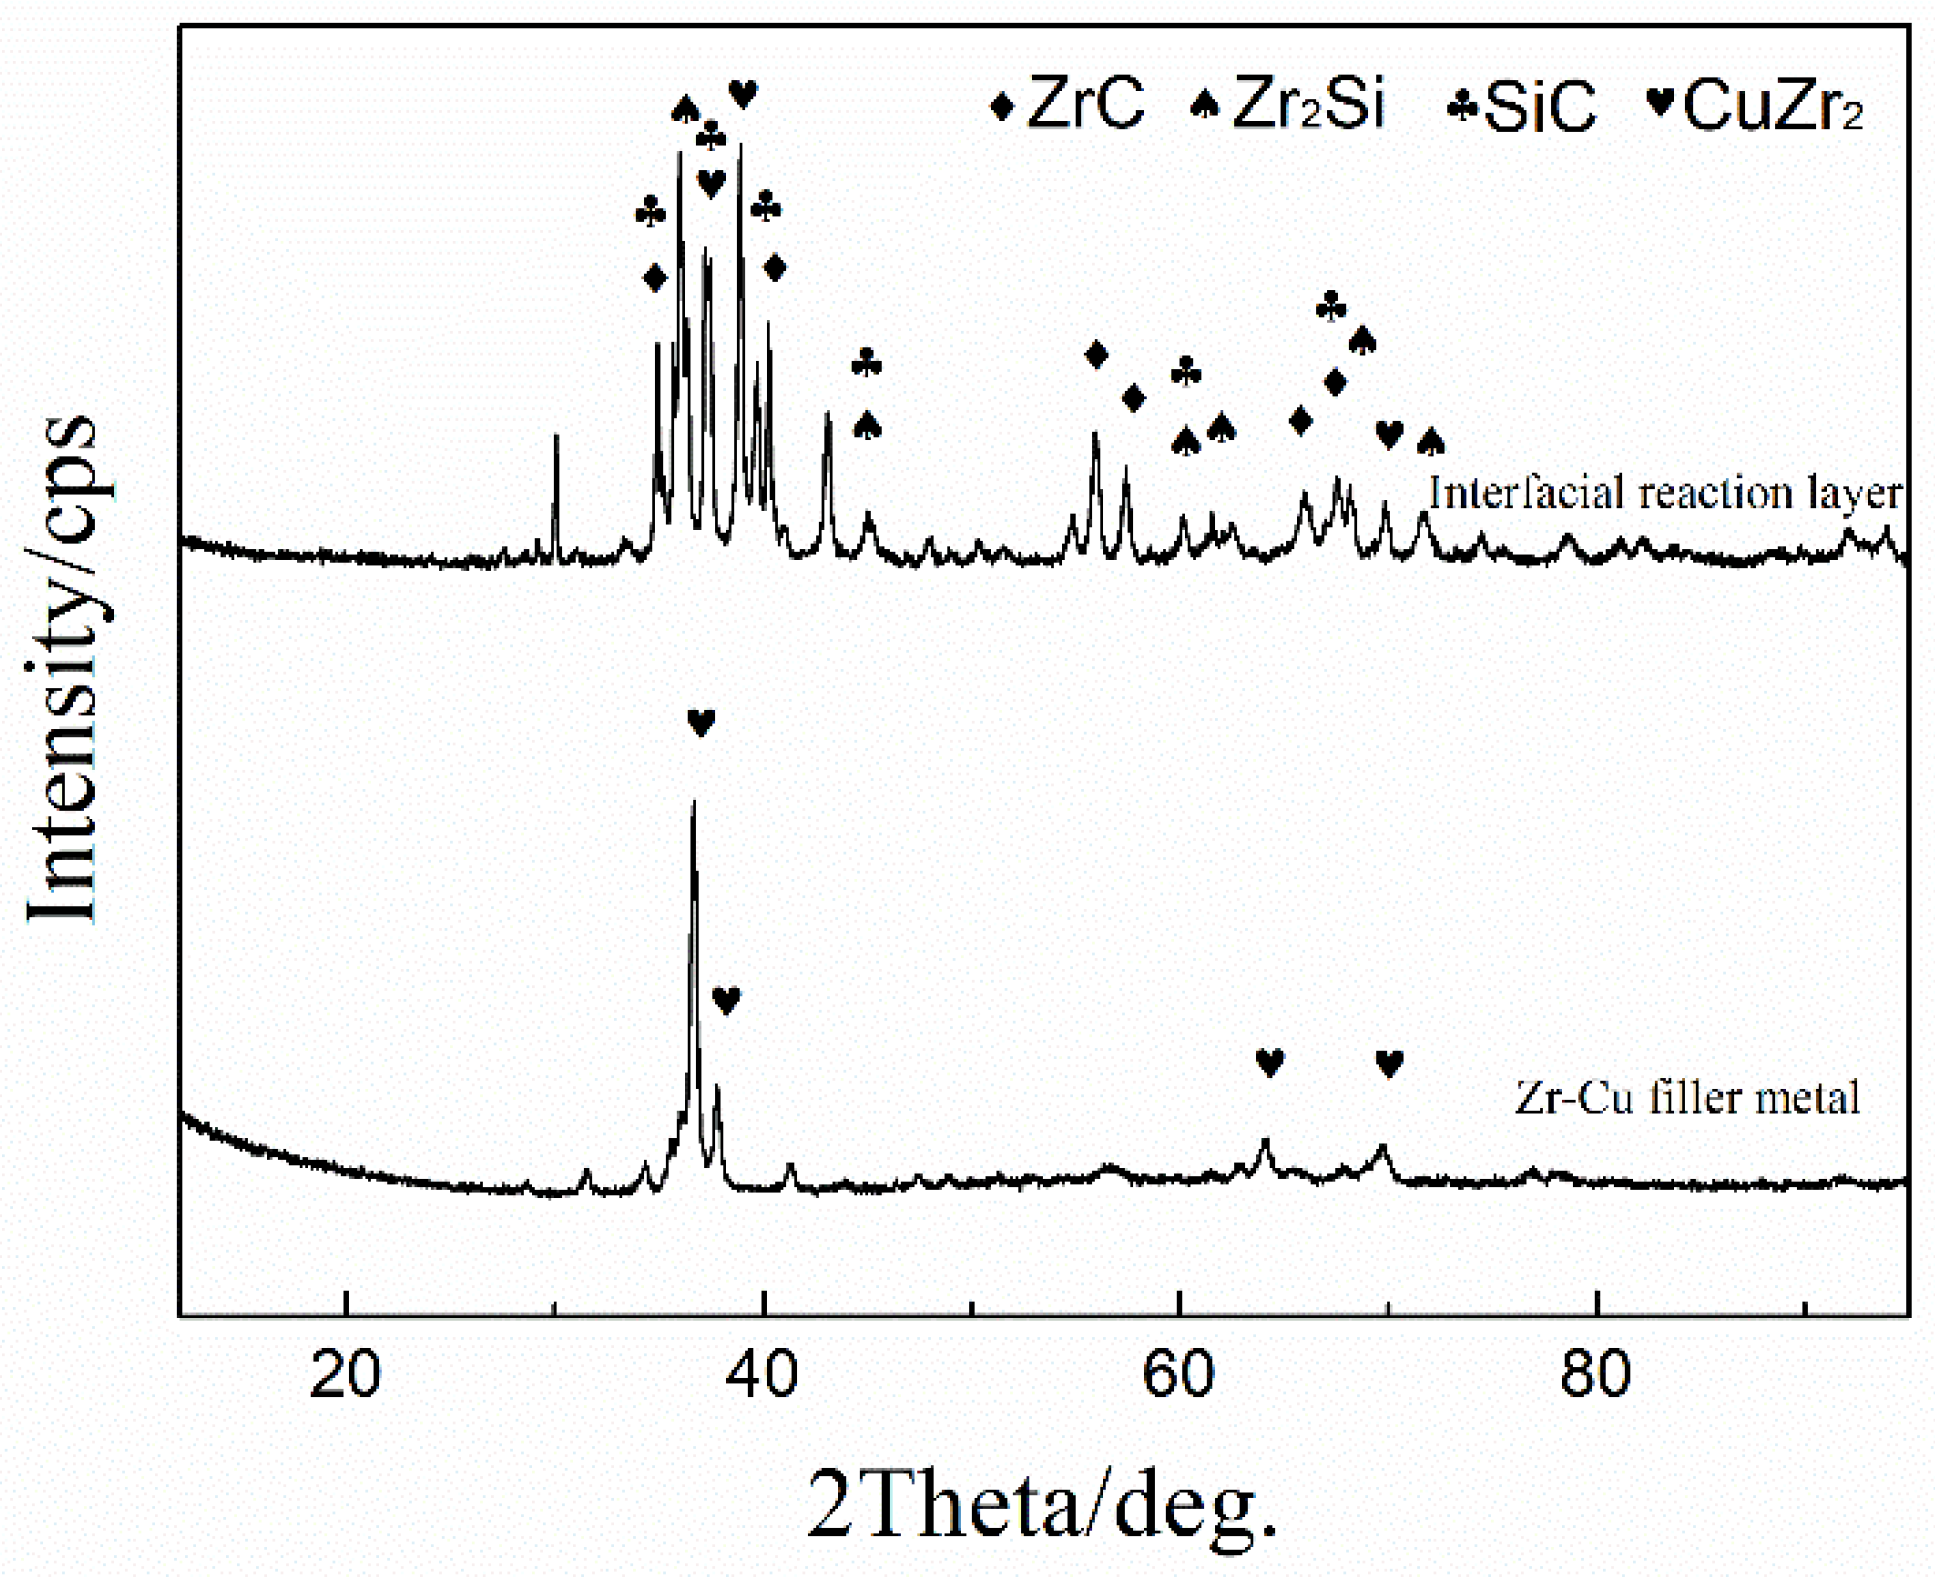
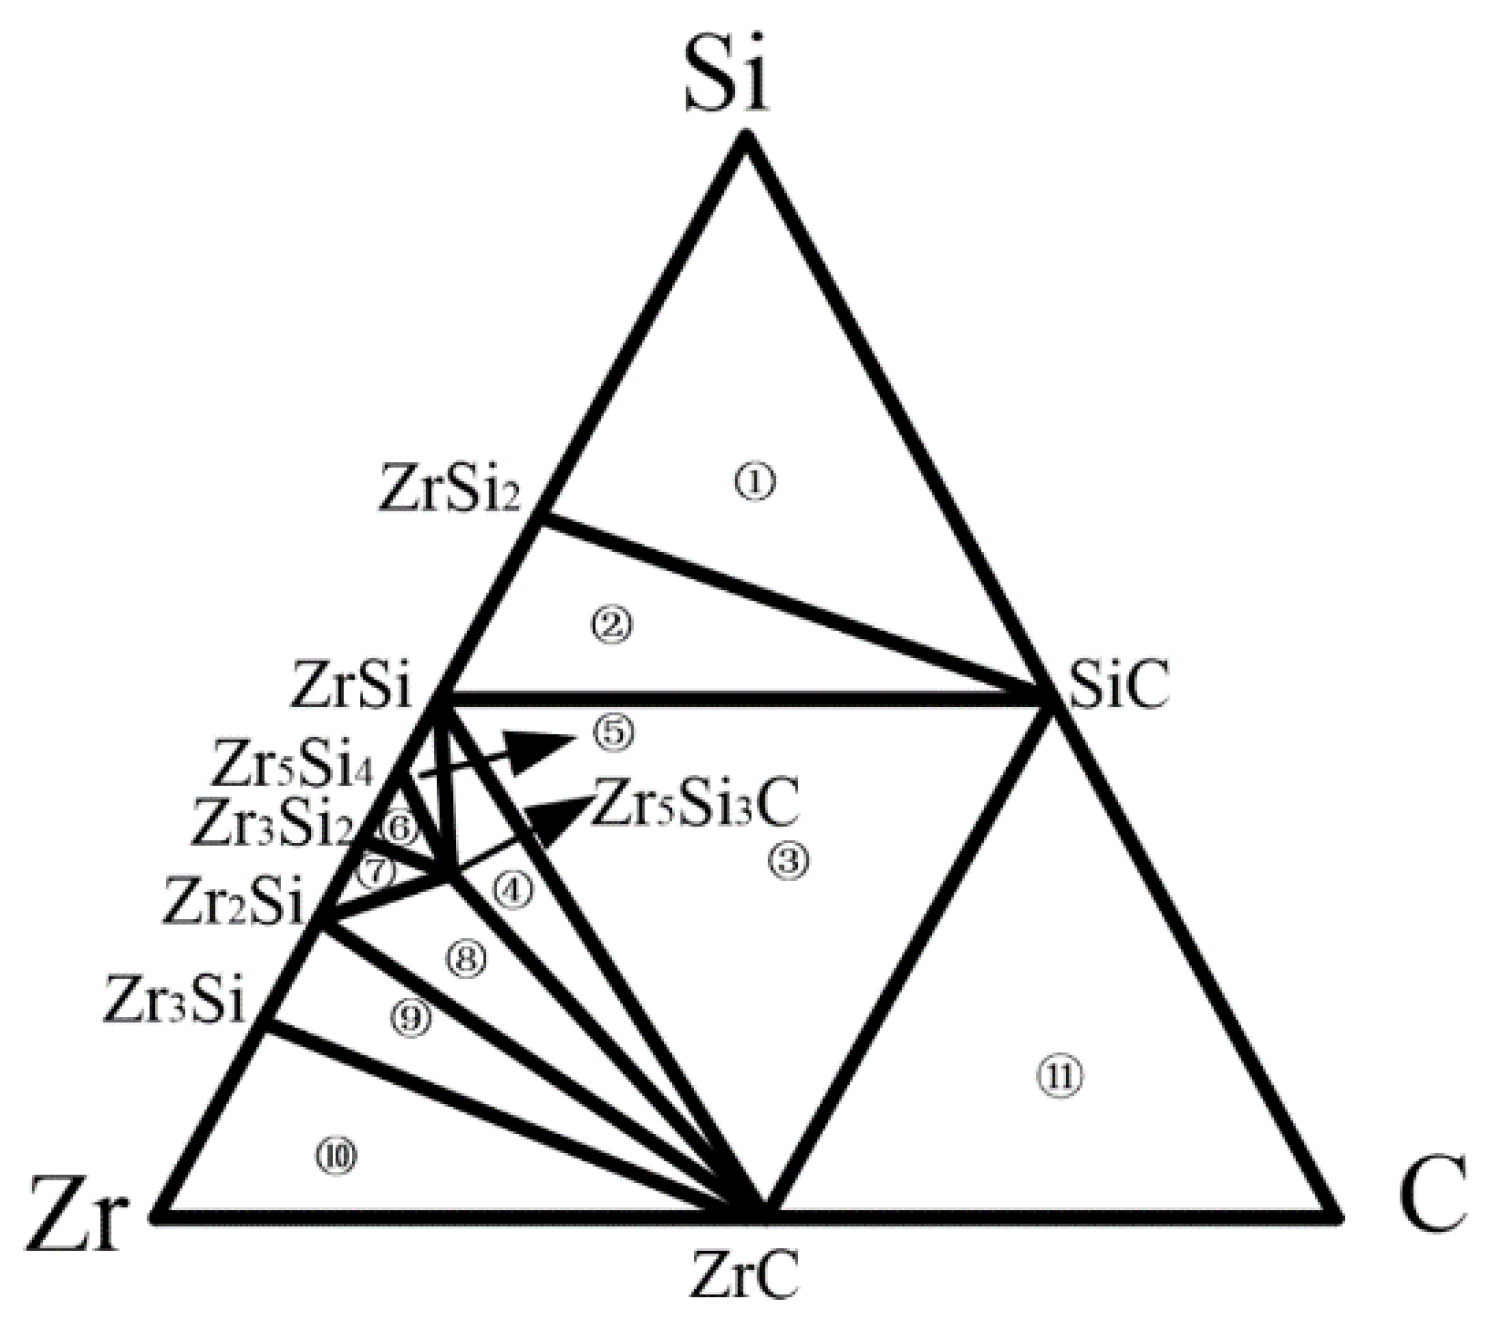
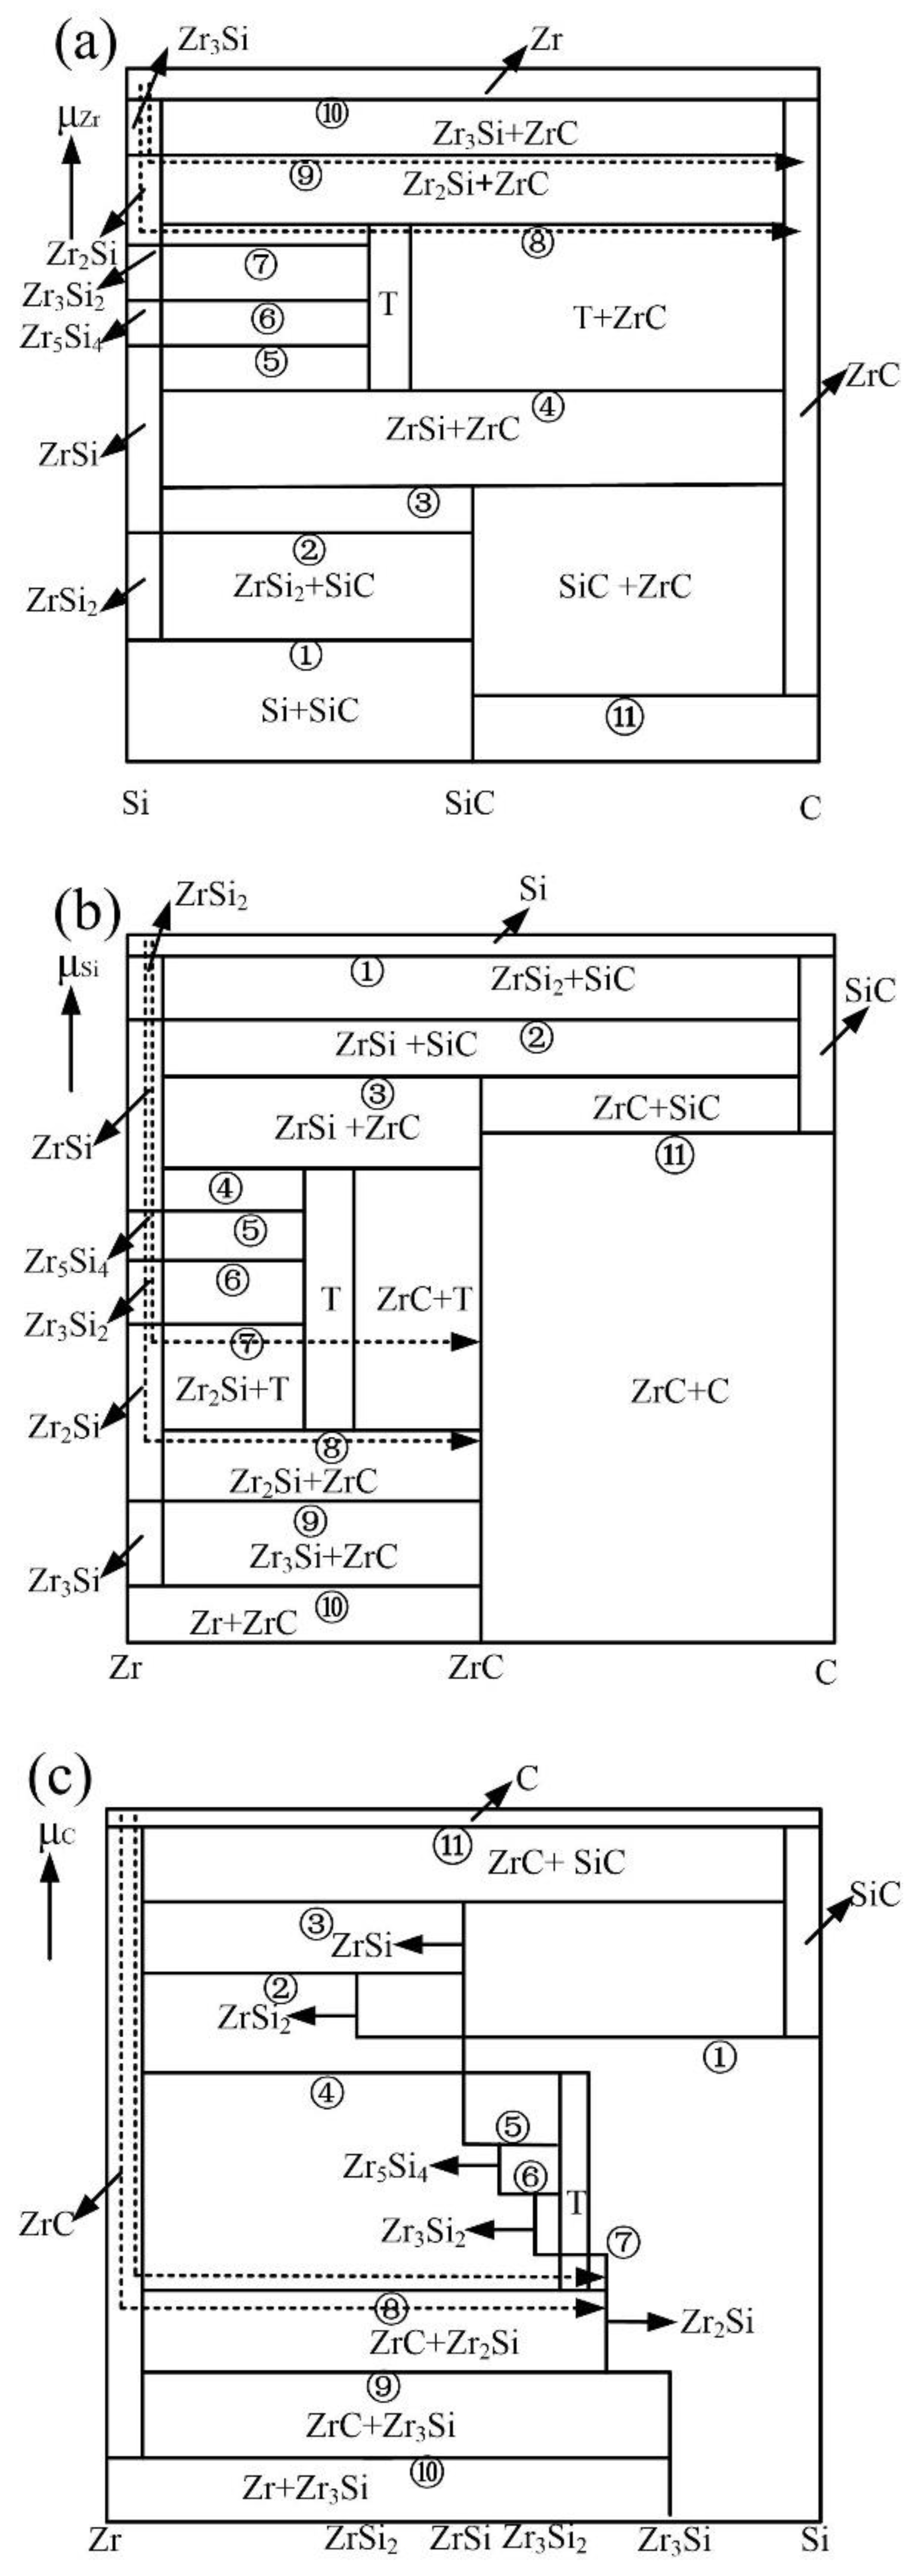
3.1. Formation of Interface Products and the Way of Element Diffusion
The microstructure of the SiC ceramic with brazing temperature of 1200 °C and holding for 20 min is shown in Figure 1. It can be seen that the Zr-based active filler metal can fill the gap between SiC ceramics well and realize the joining of SiC ceramics. Figure 1b shows a certain thickness (about 2.9 μm) of interface reaction layer after corrosion, and the interface between the Zr-Cu filler metal and the SiC ceramic has good chemical metallurgical bonding. The results of EDS show that, in the interfacial reaction, Si atoms diffuse to the filler metal, while the active element, Zr atoms, dissolve and diffuse to the base metal, SiC. Of course, the C atoms of the base metal also diffuse to the filler metal. The active element Zr reacts with Si and C atoms that decomposed from the SiC ceramic, and a certain thickness of interfacial reaction layer is formed with the prolongation of holding time. The EDS of each area in the SiC ceramic brazed joint is shown in Table 3, and the interface reaction products of the brazed joint and the XRD results of the Zr-Cu filler metal are shown in Figure 2. It can be inferred that the phases in zone (a) are CuZr2 and Zr, which mainly exist in the form of agglomeration in the brazed joint and are unevenly distributed. The phase in zone (b) is Zr-Cu eutectic alloy, which is the main component of the brazed alloy. The results show that Zr-Cu eutectic alloy is the main component of the Zr-Cu filler metal, accompanied by a small amount of CuZr2 and Zr. The phase in zone (c) is Zr2Si, which is mainly distributed in the reaction layer of the brazed interface and the contact between the filler metal and the reaction layer. The phase in zone (d) is Zr-Cu eutectic alloy, which is the main component of the brazed joint alloy and ZrC and Zr2Si are the main components of the interface reaction layer, this is mainly based on the thermodynamic analysis, the chemical reaction equation is as follows: The Gibbs free energy of the reaction of SiC + 3Zr = ZrC + Zr2Si is the lowest. The Gibbs free energy of the reaction at 1100~1300 °C is −328.5~−325.6 kJ/mol. Therefore, the interface products are mainly ZrC and Zr2Si, which is consistent with the thermodynamic calculation, and ZrC is mainly distributed in the interface reaction layer and the contact area between the reaction layer and the SiC ceramic.
Figure 1.
Microstructure of the SiC ceramic brazing joint at 1200 °C and holding for 20 min: (a) microstructure of SiC joint, (b) microstructure of interface, (c) Zr elemental line scanning across the white line in (b), (d) Si elemental line scanning across the white line in (b).
Table 3.
EDS analysis of the brazed joint at 1200 °C (at%).
Figure 2.
XRD patterns of the interface of the Zr-Cu alloy/SiC ceramic.
At the same time, the products of the interface reaction, ZrC and Zr2Si, have good nuclear properties and nuclear compatibility [17,18], and their thermal expansion coefficients are close to those of SiC. According to previous research, the thermal expansion coefficient of filler metal is 7.4 × 10⁻⁶/K at room temperature, the thermal expansion coefficients of Zr2Si and ZrC are 7.0 × 10⁻⁶/K and 6.6 × 10⁻⁶/K, respectively, while the thermal expansion coefficient of SiC ceramic is 4.5 × 10⁻⁶/K. As the dependence from the center of the brazing seam to the base metal SiC ceramics is Zr-Cu/Zr2Si/Zr2Si+ZrC/ZrC/SiC, the thermal expansion coefficient of the material from the center of the brazing seam to the base metal SiC ceramics forms a gradient transition and decreases in turn, then the residual stress of the brazing joint can be effectively released or eased during the cooling process, which can effectively improve the performance of the SiC ceramic brazing joint.
The compounds formed by the interfacial reaction between the Zr-based filler metal and the SiC ceramic are related to the equilibrium phase diagram of the Zr-Si-C ternary system. The results of the brazing experiments show that the interface products are mainly ZrC and Zr2Si, and the commonly used Zr5Si3C will replace Zr5Si3Cx [19]. Therefore, the simplified phase diagram of the Zr-Si-C ternary alloy at 1200 °C is obtained [20], as shown in Figure 3, which is divided into 10 three-phase equilibrium regions for the subsequent calculation of the chemical potential of the components in each equilibrium region.
Figure 3.
Simplified isothermal section of the Zr-Si-C ternary system at 1200 °C [18].
The Gibbs free energy of the existing material phase in the equilibrium phase diagram of Zr-Si-C ternary system at 1200 °C was calculated using the interpolation method according to the data of the practical Inorganic Thermodynamics Data Manual [21]. The Gibbs free energy of an unknown substance is estimated by using the calculation method of minimum free energy principle in reference [22,23]. Compared with other calculation methods, the calculation results of this method are more accurate and reliable. Therefore, the standard Gibbs free energy of the Zr-Si-C ternary system at 1200 °C is obtained as shown in Table 4.
Table 4.
Standard Gibbs free energy of materials in Zr-Si-C system at 1200 °C.
In the ternary stable system, the phase chemical potentials of each member are equal when they are in phase equilibrium. Therefore, the stable chemical potentials of the three components in the equilibrium triangle formed in the ternary stable system of Zr-Si-C at 1200 °C are calculated, as shown in Table 5. A phase diagram of the chemical potential stability of Zr, Si and C components is established when μA takes the chemical potential of one component as the ordinate and the relative molar ratio NB/(NB + NC) of the other two components as the abscissa, as shown in Figure 4. For convenience, T is used to represent Zr5Si3C.
Table 5.
The constituent chemical potential of Zr-Si-C system in different equilibrium area at 1200 °C.
Figure 4.
Stabilized chemical potential diagram of different components at 1200 °C: (a) Zr; (b) Si; (c) C.
In the process of element diffusion, the thermodynamic conditions, mass conservation and kinetic conditions need to be satisfied. Based on the above theory, the chemical potential of an element determines its reaction pathway. In a word, from the kinetic point of view, the simpler the reaction path is, the faster the chemical potential gradient decreases and the more sufficient the reaction is. The possible diffusion paths of the active element, Zr, are shown in Figure 4a, and the possible diffusion paths are as follows:
- (1)
- Zr—Zr3Si—Zr2Si—ZrC,
- (2)
- Zr—Zr3Si—Zr2Si—T—ZrC.
Figure 4b shows that the possible diffusion paths of Si are as follows:
- (1)
- Si—ZrSi2—ZrSi—Zr5Si4—Zr3Si2—Zr2Si—T—ZrC,
- (2)
- Si—ZrSi2—ZrSi—Zr5Si4—Zr3Si2—Zr2Si—ZrC.
Figure 4c shows that the possible diffusion pathway of C is as follows:
- (1)
- C—ZrC—T—Zr2Si,
- (2)
- C—ZrC—Zr2Si.
3.2. Growth Behavior of Interface Reaction Layer
The results show that the products of an interface reaction are mainly composed of ZrC and Zr2Si at a certain brazing temperature. The thickness of the reaction layer increases with the prolongation of the holding time. At this time, the Zr element in the filler metal layer diffuses to the reaction layer, resulting in a decrease in its concentration, while the SiC ceramic surface decomposes continuously and the Si and C atoms also diffuse to the reaction layer. The Zr-Cu alloy, as the Zr-based filler metal, and the content of the Zr element is 80 wt.%. Therefore, the schematic diagram of the brazing joint between the Zr-Cu filler metal and the SiC ceramic and the corresponding diagram of the change of the Zr atom’s concentration on both sides of the reaction layer are established, as shown in Figure 5. In this model, the diffusion rate of the Zr element in the reaction layer is the main factor in the growth process of the interface reaction layer, and the kinetic equation of the interface reaction layer in the brazing process is established based on the concentration of the Zr element in the reaction layer.
Figure 5.
Schematic diagram of brazing joint between Zr-Cu filler metal and SiC ceramics and changes in the corresponding Zr atom concentration on both sides of the reaction layer: (a) brazing joint at the temperature of T at the beginning of the interface reaction, (b) the changes in the concentration of the Zr atom in the (a) joint on both sides of the reaction layer, (c) brazing joints during the growth of interfacial reactions, (d) the change of the Zr atom concentration on the two sides of the reaction layer for the (c) joint.
The growth of the interface reaction layer with brazing time is shown in Figure 6, which is mainly divided into the following three stages: stage a is the heating up stage, where the interface reaction products begin to form at the brazing temperature, T0, and then the reaction layer grows slowly with a temperature range of T0~T1; stage b is the holding stage when the brazing temperature, T1, and the reaction layer grows rapidly; stage c is the cooling stage (the temperature from T1 to T0), where the reaction layer grows slowly to a stop. In the brazing process, the heating rate and cooling rate are usually fixed and the thickness of the interface reaction layer is also determined when the brazing temperature is T1. Therefore, the thickness of the interface reaction layer in stages a and c is d0, which is mainly related to the brazing temperature. The thickness of the reaction layer changes with the holding time when the brazing temperature is T1 and the thickness of the interface reaction layer in stage b is dt. Then, the expression of the total thickness, d, of the reaction layer is as follows:
Figure 6.
Schematic of three steps of reaction layer formation at SiC side.
From Fick’s second law the following can be taken:
where D is the diffusion coefficient of elements, C represents the molar concentration of atoms, x represents the position of interface and t is the reaction time of reaction layer at brazing temperature. In addition, for the convenience of data processing, it is assumed that the diffusion coefficient and concentration of Zr atoms are only related to the brazing temperature.
The general solution is as follows:
where a and b are constants.
Combined with the actual concentration distribution of Zr atoms in the brazing process, the Gauss solution error function is selected to express the accurate result. is the Gauss error function and the function expression is as follows:
Let C be a function of to obtain the following results:
When the reaction time of the interfacial reaction layer is t, combined with Figure 4, the change of the number of substances on both sides of the reaction layer is as follows:
where, in the formula, , . and successively represent the diffusion coefficient of the Zr atoms in the Zr-Cu filler metal, the reaction layer and the SiC ceramic material, respectively. represents the original concentration of Zr atoms in the Zr-Cu filler metal. represents the concentration of active Zr atoms at the contact of the filler metal and the interface reaction layer. represents the concentration of active Zr atoms at the contact of the reaction layer and the SiC ceramic material. represents the concentration of active Zr atoms in the SiC ceramic material. represents the distance from Zr-Cu; represents the left side of the reaction layer, where A− represents the position of the left side of the reaction layer close to the filler metal layer and A+ represents the position of the right side of the reaction layer close to the filler metal layer; and represents the right side of the reaction layer, where B− represents the position of the side of the reaction layer away from the SiC ceramic and B+ represents the position of the right side of the reaction layer close to the SiC ceramic.
According to Figure 5 and the actual situation of the brazing SiC ceramic, the diffusion flux of Zr atoms in the reaction layer ( = A– and = B+) is very small, approximately zero, which can be ignored compared with the following diffusion flux in the reaction layer:
After substituting Equation (8) into Equation (6) and Equation (9) into Equation (7), the simplified formula is as follows:
After substituting Equation (5) into Equations (10) and (11), the following formulas are obtained:
When the brazing temperature (T) is constant, the concentration gradient of the Zr element at the interface of both sides of the reaction layer is constant; therefore, and are constant. Integral Equations (12) and (13), obtain the following expressions, respectively, when the initial condition t = 0, :
From Equations (14) and (15), the thickness of the interfacial reaction layer dt can be obtained when the brazing temperature is T1 and the holding time is t, and the expression is as follows:
When the brazing temperature is constant, the diffusion coefficient D1 is a constant, then Equation (16) can be expressed as follows:
where t is the brazing holding time and is the total diffusion coefficient of the system, .
After substituting Equation (17) into Equation (2), the total thickness of the reaction layer in the whole brazing process is obtained as follows:
According to the Arrhenius equation, the relationship between the diffusion coefficient of the Zr atoms in the reaction layer and the brazing temperature (T) is expressed as follows:
where is the apparent activation energy of Zr (kJ/mol), represents the parameters related to the material, R represents the Proctor gas constant (R = 8.314 J/mol) and T represents the absolute temperature (K).
The relationship between the total thickness of the reaction layer and the brazing temperature and holding time was obtained; the expression is as follows:
Take logarithm on both sides of Formula (23) to obtain the following:
It can be seen that and are linear. As long as the diffusion coefficients and
corresponding to T1 and T2 are obtained at different brazing temperatures and Formula (17) is substituted, and can be obtained. The table expression is as follows:
In order to obtain the specific expression of the interfacial reaction layer growth, it is necessary to determine the unknowns in the expression combined with the data of the brazing experiment. During the study of the SiC brazing process, the thickness of the interface reaction layer was measured at 1200 °C and 1300 °C, respectively, for different holding times. The experimental data obtained are shown in Table 6.
Table 6.
Thickness of interface reaction layer under different brazing parameters (μm).
By substituting the above results into Equations
(20) and (21), the constant is
2.1479 μm·s1/2 and the activation energy is 42.65 kJ·mol−1. Therefore, the growth kinetics equation of the thickness of the interfacial reaction layer with a holding time at different brazing temperatures is obtained, and and the relevant parameters are shown in Table 7.
Table 7.
The expression of interfacial reaction layer thickness at different brazing temperatures.
When the brazing temperature is 1200 °C, the growth kinetics equation of the interfacial reaction layer is as follows:
When the brazing temperature is 1300 °C, the growth kinetics equation of the interfacial reaction layer is as follows:
It can be found from Equations (24) and (25) that the average total thickness of the interfacial reaction layer is determined by the brazing temperature and holding time of brazing SiC ceramic with Zr-based filler metal, and the thickness of the interfacial reaction layer increases exponentially with the increase in the brazing temperature and holding time. In the process of brazing, it is necessary to strictly control the thickness of the interface reaction layer, which has a great influence on the properties of the joint. Therefore, the brazing temperature and holding time can be deduced according to the reaction layer’s growth kinetics equation to formulate the brazing process. At the same time, the formation of the brazing reaction layer lays the foundation for the realization of brazing SiC ceramic, which is an important part of the SiC ceramic brazing mechanism.
4. Conclusions
- (1)
- In the brazing process of Zr-Cu filler metal and SiC ceramic, the main reaction is the interface reaction of the active element Zr and the SiC ceramic and the interface products are mainly ZrC and Zr2Si, which is consistent with the thermodynamic calculation. The potential stability phase diagram of the Zr-Si-C ternary system was used to explain the possible diffusion path of elements in the process of product formation.
- (2)
- Based on the Fick diffusion theory, the physical model of the brazing SiC ceramic experiment and the diffusion behavior of Zr in the interface reaction layer, the kinetics equation of the interface reaction layer growth is established and the diffusion constant = 2.1479 μm·s1/2 and activation energy Q = 42.65 KJ·mol−1 are calculated. The growth kinetics equation of the interfacial reaction layer thickness with holding time under different brazing temperature is obtained as follows:brazing temperature at 1200 °C:brazing temperature at 1300 °C: .
Author Contributions
Conceptualization, H.Z.; Data curation, T.L.; Funding acquisition, B.Z.; Investigation, B.Z., T.L. and J.H.; Supervision, H.Z.; Visualization, B.Z., H.Z. and J.H.; Writing—original draft, T.L. and J.H.; Writing—review & editing, B.Z. All authors have read and agreed tothe published version of the manuscript.
Funding
This research was funded by Hubei education department program, grant number: Q20201802; Hubei science and technology program, grant number: 2020CFB375; Doctoral researchinitiation fund of Hubei University of Automotive Technology, grant number: BK201902.
Institutional Review Board Statement
Not applicable.
Informed Consent Statement
Not applicable.
Conflicts of Interest
The authors declare no conflict of interest.
References
- Passerini, S.; Kazimi, M.S.; Shwageraus, E. A systematic approach to nuclear fuel cycle analysis and optimization. Nucl. Sci. Eng. 2014, 178, 186–201. [Google Scholar] [CrossRef]
- Gorton, J.P.; Collins, B.S.; Wysocki, A.J.; Brown, N.R. Assessment of CASL VERA for BWR analysis and application to accident tolerant SiC/SiC channel box. Nucl. Eng. Des. 2020, 365, 110732. [Google Scholar] [CrossRef]
- Zhong, Z.; Hou, G.; Zhu, Z.; Wang, Z.; Wang, G.; Wu, Y. Microstructure and mechanical strength of SiC joints brazed with Cr3C2 particulate reinforced Ag-Cu-Ti brazing alloy. Ceram. Int. 2018, 44, 11862–11868. [Google Scholar] [CrossRef]
- Xiong, H.P.; Chen, B.; Pan, Y.; Zhao, H.S.; Ye, L. Joining of Cf/SiC composite with a Cu-Au-Pd-V brazing filler and interfacial reactions. J. Eur. Ceram. Soc. 2014, 34, 1481–1486. [Google Scholar] [CrossRef]
- Wang, Q.; Li, Q.H.; Sun, D.L.; Han, X.; Tian, Q. Microstructure and mechanical properties of SiC/Ti diffusion bonding joints under electric field. Rare Met. Mater. Eng. 2016, 45, 1749–1754. [Google Scholar]
- Kim, J.-H.; Kim, D.S.; Lim, S.T.; Kim, D.K. Interfacial microstructure of diffusion-bonded SiC and Re with Ti interlayer. J. Alloys Compd. 2017, 701, 316–320. [Google Scholar] [CrossRef]
- Dong, H.; Li, S.; Teng, Y.; Ma, W. Joining of SiC ceramic-based material with ternary carbide Ti3SiC2. Mater. Sci. Eng. 2011, 176, 60–64. [Google Scholar] [CrossRef]
- Yuan, X.; Chien, H. Residual thermal stress analysis of SiC joint by polysiloxane silicon resin YR3187. J. Adhes. Sci. Technol. 2013, 27, 1525–1534. [Google Scholar] [CrossRef]
- He, H.; Lu, C.; He, Y.; Zheng, W.; Yang, J.; Wang, L.; Sun, Y.; Gao, Z. Characterization of SiC ceramic joints brazed using Au-Ni-Pd-Ti high-temperature filler alloy. Materials 2019, 12, 931. [Google Scholar]
- Qi, Q.; Zhang, J.; Lu, C.; Zhang, Q.; Xuan, Y.; Liu, M. Microstructure and mechanical properties of the SiC/Zr4 joints brazed with TiZrNiCu filler for nuclear application. Mater. Int. 2018, 28, 378–385. [Google Scholar]
- Tian, W.B.; Sun, Z.M.; Zhang, P.; Zhang, Y.M.; Shi, J. Brazing of silicon carbide ceramics with Ni-Si-Ti powder mixtures. J. Aust. Ceram. Soc. 2017, 53, 511–516. [Google Scholar] [CrossRef]
- Li, H.; Wang, Z.; Zhong, Z.; Wen, Q.; Song, K.; Zhang, H.; Wu, Y. Micro-alloying effects of yttrium on the microstructure and strength of silicon carbide joint brazed with chromium-silicon eutectic alloy. J. Alloys Compd. 2018, 738, 354–362. [Google Scholar] [CrossRef]
- Matsukawa, Y.; Okuma, I.; Muta, H.; Shinohara, Y.; Suzue, R.; Yang, H.; Maruyama, T.; Toyama, T.; Shen, J.; Li, Y.; et al. Crystallographic analysis on atomic-plane parallelisms between bcc precipitates and hcp matrix in recrystallized Zr-2.5Nb alloys. Acta Mater. 2017, 126, 86–101. [Google Scholar] [CrossRef]
- Zhou, B.; Zeng, Z.; Cai, Y.; Feng, K. FEM simulation and verification of brazing SiC ceramic with novel Zr-Cu filler metal. Materials 2019, 12, 3380. [Google Scholar] [CrossRef] [PubMed] [Green Version]
- Zhou, B.; Wang, J.; Feng, K.; Cai, Y.; Chen, S. Effect of brazing parameters on the microstructure and properties of SiC ceramic joint with Zr-Cu filler metal. Crystals 2020, 10, 93. [Google Scholar] [CrossRef] [Green Version]
- Zhou, B.; Feng, K. Zr-Cu alloy filler metal for brazing SiC ceramic. RSC Adv. 2018, 8, 26251–26254. [Google Scholar] [CrossRef] [Green Version]
- Xu, L.; Huang, C.; Liu, H.; Zou, B.; Zhu, H.; Zhao, G.; Wang, J. Study on the synthesis and growth mechanisms of the refractory ZrC whiskers. Int. J. Refract. Met. Hard Mater. 2014, 42, 116–119. [Google Scholar] [CrossRef]
- Yeom, H.; Lockhart, C.; Mariani, R.; Xu, P.; Corradini, M.; Sridharan, K. Evaluation of steam corrosion and water quenching behavior of zirconium-silicide coated LWR fuel claddings. J. Nucl. Mater. 2018, 499, 256–267. [Google Scholar] [CrossRef]
- Jeske, T.; Schmitz, G. Nanoscale analysis of the early interreaction stages in Al/Ni. Scr. Mater. 2001, 45, 555–560. [Google Scholar] [CrossRef]
- Wang, Y.; Carim, A.H. Ternary phase equilibria in the Zr-Si-C system. J. Am. Ceram. Soc. 1995, 78, 662–666. [Google Scholar] [CrossRef]
- Ye, D. Thermodynamic Data Handbook of Inorganic Substances; Metallurgical Industry Press: Beijing, China, 1980. [Google Scholar]
- Andersson, J.O. Thermodynamic properties of Mo-C. Calphad 1988, 12, 1–8. [Google Scholar] [CrossRef]
- Boettinger, W.J.; Perepezko, J.H.; Frankwicz, P.S. Application of ternary phase diagrams to the development of MoSi2-based materials. Mater. Sci. Eng. A 1992, 155, 33–44. [Google Scholar] [CrossRef]
Publisher’s Note: MDPI stays neutral with regard to jurisdictional claims in published maps and institutional affiliations. |
© 2021 by the authors. Licensee MDPI, Basel, Switzerland. This article is an open access article distributed under the terms and conditions of the Creative Commons Attribution (CC BY) license (https://creativecommons.org/licenses/by/4.0/).