Abstract
Despite having a very similar electrocaloric (EC) coefficient, i.e., the EC temperature change divided by the applied electric field, the 0.9Pb(Mg1/3Nb2/3)O3–0.1PbTiO3 (PMN-10PT) ceramic prepared by mechanochemical synthesis exhibits a much higher EC temperature change than the columbite-derived version, i.e., 2.37 °C at 107 °C and 115 kV/cm. The difference is due to the almost two-times-higher breakdown field of the former material, 115 kV/cm, as opposed to 57 kV/cm in the latter. While both ceramic materials have similarly high relative densities and grain sizes (>96%, ≈5 μm) and an almost correct perovskite stoichiometry, the mechanochemical synthesis contributes to a lower level of compositional deviation. The peak permittivity and saturated polarization are slightly higher and the domain structure is finer in the mechanochemically derived ceramic. The secondary phases that result from each synthesis are identified and related to different interactions of the individual materials with the electric field: an intergranular lead-silicate-based phase in the columbite-derived PMN-10PT and MgO inclusions in the mechanochemically derived ceramic.
1. Introduction
The electrocaloric (EC) effect is a reversible temperature change in a polar material that manifests itself with the application or removal of an electric field. It is directly related to the polarization change as a function of temperature and electric field. Therefore, it is strong in ferroelectric and relaxor materials such as the (1–x)Pb(Mg1/3Nb2/3)O3–xPbTiO3 (PMN-100xPT) solid solution. The PMN-10PT ceramic exhibits a dielectric permittivity maximum at ~45 °C []. As the temperature dependence of the EC temperature change (ΔTEC) shows a maximum value in the middle of the low-temperature slope of the dielectric peak [,,], PMN-10PT is an appropriate candidate for EC cooling devices operating in the vicinity of room temperature. PMN-10PT bulk ceramic elements have been used as the active elements of a heat regenerator in a proof-of-concept EC cooling device [].
One of the challenges with EC cooling technology is the performance of the EC materials. Thin films exhibit a large ΔTEC, of a few tens of degrees Celsius, which is a direct consequence of their high electric breakdown field (BF), which is often >1000 kV/cm []. However, their small thermal mass makes thin films less suitable for cooling purposes []. On the other hand, bulk materials have the required thermal mass, and their EC coefficients (ΔTEC/ΔE) are even higher than those of the films. But unfortunately, bulk materials hardly survive electric fields higher than a few tens of kV/cm. The increase in the electric field that the EC bulk elements can withstand is, therefore, one of the highest priorities in the development of cooling devices. Multilayer (ML) elements require lower applied voltages, and have a higher BF compared to their bulk ceramic counterparts, and have proven to be a good solution for EC cooling applications [,,]. Furthermore, it has been shown that PMN MLs exhibit an almost fatigue-free EC response, even after 1 million EC cycles [].
The BF is affected by numerous factors: besides the thickness and shape of the material and the electrode, the electrode material, and environmental conditions, the microstructure is also a critical factor [,,]. Namely, electric breakdown occurs in places where the tunneling current has the least resistance, i.e., through defects, pores, along grain boundaries, etc. [,,]. It was also shown that in a lead-zirconate-titanate ceramic, the dominant paths of fracture and crack propagation upon the application of an electric field were found to initiate from pores/impurities at triple junctions and propagate along the grain boundaries []. Therefore, high-quality materials, i.e., single phase, with a high relative density, with an optimized microstructure, and a low concentration of impurities, are crucial in EC applications.
PMN and PMN-based bulk ceramic materials are prepared by different powder synthesis routes. The conventional solid-state synthesis of PMN, i.e., the mixed-oxide route, yields an undesirable pyrochlore phase, in addition to the perovskite phase. This secondary phase has a low dielectric permittivity (~130 at room temperature) []. It is thermodynamically stable, making it difficult to eliminate from the final product. To avoid or at least suppress the amount of pyrochlore phase in the PMN, the columbite synthesis was proposed [], where the undesired pre-reaction between PbO and Nb2O5 is avoided. In the first step a columbite precursor MgNb2O6 is synthesized, while in the second step, PbO reacts with MgNb2O6 to form the perovskite phase. The columbite synthesis has also been successfully applied in the synthesis of PMN-10PT ceramics [], where, in the second step, both PbO and TiO2 are added to the MgNb2O6.
Mechanochemical synthesis is a nominally room-temperature alternative route in which a powder mixture is subjected to high-energy collisions with the milling bodies during high-energy milling. The mechanochemical reactions are promoted by the energy transferred from the milling bodies to the particles []. Compared with classic solid-state synthesis, the ceramics prepared from mechanochemically synthesized powders often exhibit a superior chemical homogeneity [,]. In contrast to the columbite synthesis, which includes two separate calcination steps, the mechanochemical synthesis is performed in a single step, i.e., with high-energy milling of a PbO-MgO-Nb2O5-(TiO2) powder mixture. In [,] the authors obtained a single-phase material, whereas in [,], besides the perovskite phase, a trace amount of pyrochlore was detected.
A literature search of the EC properties of PMN-100xPT bulk ceramics was performed; it is summarized in the Supporting Information, Table S1. Surprisingly, it could be concluded that the ceramics prepared by mechanochemical synthesis withstood approximately two-times-higher electric fields than the ceramics prepared using the columbite route and consequently also exhibited a much higher EC temperature change. Nevertheless, the lower applied fields/voltages could also be related to the limitations of the measurement equipment, not only to the materials’ characteristics. To investigate this observation in detail, we decided to compare the PMN-10PT bulk ceramic samples prepared with the columbite and the mechanochemical synthesis. As both the EC temperature change and the BF depend on the microstructure [], ceramic samples with similar relative densities and average grain sizes were prepared.
We show that the much higher EC temperature change and BF of the mechanochemically derived ceramic, compared with those of the columbite-derived PMN-10PT, can be related to microstructural features that are inherently connected to the individual synthesis routes.
2. Materials and Methods
For the synthesis of the stoichiometric PMN-10PT ceramic powder, PbO (99.9%, Aldrich, St. Louis, MO, USA), MgO (98%, Aldrich, St. Louis, MO, USA), TiO2 (99.8%, Alfa Aesar, MO, USA), and Nb2O5 (99.9%, Aldrich, St. Louis, MO, USA) were used. The columbite and mechanochemical syntheses are described below.
In the columbite synthesis, the first step was to homogenize and mill the MgO-Nb2O5 powder mixture in an attritor mill at 800 rpm for 4 h in isopropanol using 3-mm ZrO2 stabilized with Y2O3 (YSZ) balls, followed by drying. The powder mixture was calcined in an alumina crucible at 1150 °C for 4 h with heating and cooling rates of 5 °C/min. In the second step, both PbO and TiO2 were added to MgNb2O6 in the molar ratio corresponding to the stoichiometry of the PMN-10PT, and the mixture was milled again under the same conditions as in the first step and dried. The as-prepared PbO-MgNb2O6-TiO2 powder mixture was then calcined at 750 °C for 4 h, milled in the attritor at 800 rpm for 4 h in isopropanol, and dried.
The stoichiometric powder mixture for the mechanochemical synthesis was first homogenized in a planetary mill (Retsch, PM 400) at 200 rpm for 2 h in isopropanol, using 10-mm YSZ balls, and dried. The powder mixture was then dry-milled in a planetary mill at 300 rpm for 96 h, using 20-mm tungsten carbide (WC) balls. After this, it was milled in an attritor at 800 rpm for 4 h in isopropanol using 3-mm YSZ balls and dried. The scheme for the columbite and mechanochemical syntheses of the PMN-10PT is shown in Figure 1, while the particle-size distribution, the dynamic sintering curves, and XRD patterns are presented in the Supporting Information (Figures S1 and S2).
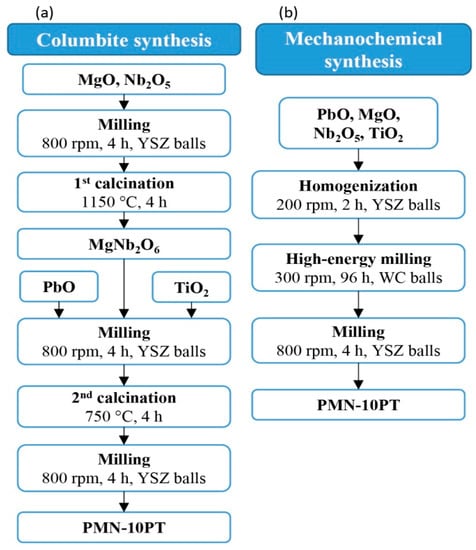
Figure 1.
Schematic presentation of the (a) columbite and (b) mechanochemical syntheses of the PMN-10PT ceramic powder.
The powder compacts were pressed uniaxially at 50 MPa and then isostatically at 300 MPa, and sintered in double alumina crucibles in the presence of PMN-10PT packing powder. Our aim was to prepare ceramic samples with similarly high relative densities and average grain sizes (GSs) of about 5 µm. Therefore, preliminary experiments were performed to determine suitable sintering conditions. Consequently, the columbite and mechanochemically synthesized PMN-10PT powder compacts were sintered at 1200 °C for 16 h and 2 h, respectively (for XRD patterns of the sintered and crushed ceramics, see Figure S3, Supporting Information). The heating and cooling rates were 2 °C/min. To maintain the clarity of the text, the PMN-10PT samples, prepared with the columbite and mechanochemical syntheses are denoted as Col and Mech, respectively. For more details regarding the powder properties (i.e., particle-size distribution and phase composition) and the dynamic sintering curves of both samples, see the Supporting Information.
The densities of the sintered ceramics were measured with a gas-displacement density analyzer (Micromeritics, AccuPyc III 1340 Pycnometer). The results represent an average of ten measurements. The relative densities (RDs) of the ceramics were calculated using the theoretical density of PMN, i.e., 8.13 g/cm3 (JCPDS 81-0861).
Quantitative elemental analyses of the powder were performed with inductively coupled plasma (ICP) mass spectroscopy using a quadrupole-based 7500 CE spectrometer. The measurements were made without a reference. Instead, an additional technique was used to verify the results: ICP atom emission spectroscopy using a Thermo Jarrel Ash Atomscan 25 spectrometer.
For the microstructural investigations, the samples were cut with a diamond wire, ground and polished with diamond paste and an OP-S silica colloidal suspension (Struers), and finally thermally etched at ~900 °C. A field-emission scanning electron microscope (FE-SEM; JEOL JSM-7600) equipped with an energy-dispersive X-ray spectrometer (EDS; INCA Oxford 350 EDS SDD) and a wavelength-dispersive X-ray spectrometer (WDXS; INCA Wave 500) was used for the imaging and compositional analyses. For more details regarding the WDXS analyses, see the Supporting Information (Figure S4). For the GS analysis, more than 300 grains per sample were measured with the Image Tool Software. The GS is expressed as the Feret’s diameter.
For the transmission electron microscope (TEM) analyses, the pellets were cut into discs, ringed with 3-mm brass rings, mechanically thinned and polished to approximately 100 μm, then dimpled to about 10 μm in the center of the disc. Cold-stage argon-ion milling (RES 010, Bal-Tec AG, Balzers, Liechtenstein) was introduced to achieve perforation of the central area of the disc. A TEM (JEM-2100, Jeol Ltd., Tokyo, Japan) operated at 200 kV with a beryllium double-tilt specimen holder and an EDS detector was used to determine the composition and crystallinity of the matrix and the secondary phases.
For high- and low-field dielectric measurements and direct EC measurements, the pellets were cut to a thickness of about 200 µm and 80 µm, respectively, polished, annealed at 600 °C for 1 h and cooled at a rate of 1 °C/min. The Cr/Au electrodes were deposited using RF-magneton sputtering (5 pascals). The complex dielectric constant was measured in the temperature range from −50 °C to 150 °C at frequencies of 0.1, 1, 10, and 100 kHz using an Agilent E4980A Precision LCR meter. The amplitude of the probing AC electric signal was 1 V. The dielectric response was measured during the cooling run with a rate of 1 °C/min. The polarization versus electric field () hysteresis loops were measured with an Aixacct TF analyzer 2000. The indirect EC measurements were performed at a constant electric field in the temperature range from room temperature to 140 °C with a step of 5 °C. The applied electric signal was sinusoidal, and the frequency was 1 Hz. For the calculation of (indirect method, calculated after [,]) the specific heat capacities [] of the investigated samples were used. For the direct EC measurements, a modified high-resolution calorimeter was employed. The temperature of the sample was followed by measuring the resistance of a micro-bead thermistor. The details of the method can be found in []. In order to find the maximal electric field that the sample can withstand and, consequently, to determine the maximal EC effect, the measurements at high electric fields (>57 kV/cm) were performed at one selected temperature, i.e., 110 °C. This temperature was selected due to the vicinity of the dielectric-permittivity-peak temperature of PMN-10PT under high electric fields [,].
Prior to the domain-structure investigations, the samples were finely polished (OP-S silica colloidal suspension, Struers, Ballerup, Denmark) and annealed at 600 °C for 1 h and then cooled with a rate of 1 °C/min. The out-of-plane piezoresponse amplitude images were recorded with an atomic force microscope (AFM; MFP-3D, Asylum Research, Santa Barbara, CA, USA), a piezo-response force microscope (PFM) dual ac resonance tracking mode at an AC amplitude signal of 40 V and 300 kHz. For scanning a Si tip coated with a conductive Ti/Ir layer (Asyelec-01, AtomicForce F&E GmbH, Wiesbaden, Germany) with a diameter of 25 nm 10 nm was applied. After the investigations of the as-sintered samples, the Ag-electrode paint (Ted Pella, Leitsilber 200 Silver Paint, Redding, CA, USA) was deposited on the sample surfaces and dried. The as-prepared samples were poled at room temperature using a DC electric field of 40 kV/cm, applied for 15 min. After the poling process, the electrodes were removed using acetone. The poled samples were aged for 24 h and then re-investigated by PFM.
3. Results and Discussion
The results of the direct and indirect EC measurements for the Col and Mech PMN-10PT samples are presented in Figure 2. At electric fields of 57 kV/cm a comparison of the values do not reveal any significant differences between the samples. As shown in Figure 2, the Col sample broke at ~60 kV/cm, unlike the Mech sample, which withstood 115 kV/cm without experiencing any dielectric breakdown. Consequently, a considerably higher was achieved in the Mech than in the Col ceramic: 2.37 °C (at 115 kV/cm) as opposed to 1.39 °C (at 57 kV/cm). Note that ~20 samples were prepared by mechanochemical synthesis and all of them experienced the dielectric breakdown only above 115 kV/cm. A similar trend is seen when comparing the literature data for PMN-PT ceramics of different compositions prepared by mechanochemical or solid-state synthesis (Table S1). Only one publication [] reports that during the electrocaloric measurements, solid-state-synthesized PMN ceramics survived an electric field of 90 kV/cm.
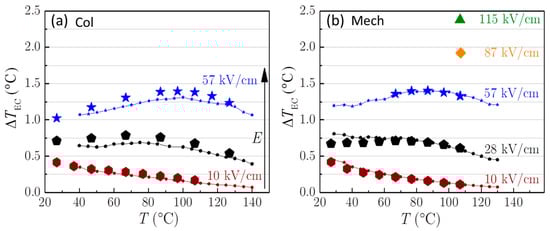
Figure 2.
at a few selected electric fields for the (a) Col and (b) Mech samples. The larger and smaller symbols represent the results of the direct and indirect EC measurements, respectively. Lines are a guide for the eye. The arrow indicates the increase in the electric field.
Here, naturally, the question arises: why do the Mech ceramics withstand approximately two-times higher electric fields than the Col ceramics? The thicknesses of the investigated samples and the areas of the electrodes were similar, therefore, the impact of the measurement conditions can be excluded. Joule heating was not detected during the direct EC measurements, irrespective of the synthesis method, the temperature, and the applied electric field. The hysteresis loops (see Figure 3a,b) are slightly different, most probably due to the differences in electrical conductivity of the samples (see Figure 4). The σ′ of Mech sample at 0.1 kHz is slightly higher compared to Col, which could be the consequence of longer sintering time.
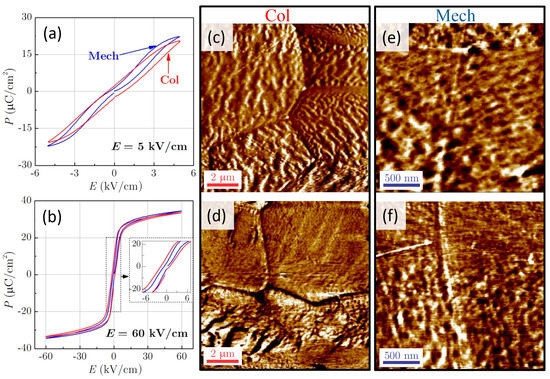
Figure 3.
The P–E hysteresis loops at 27 °C for the Col (red line) and Mech (blue line) ceramics at electric field amplitudes of (a) 5 kV/cm and (b) 60 kV/cm. (c–f) The out-of-plane amplitude PFM images for the (c,d) Col and (e,f) Mech ceramics before (above; c and e) and after (below; d and f) poling. Note the different scales.
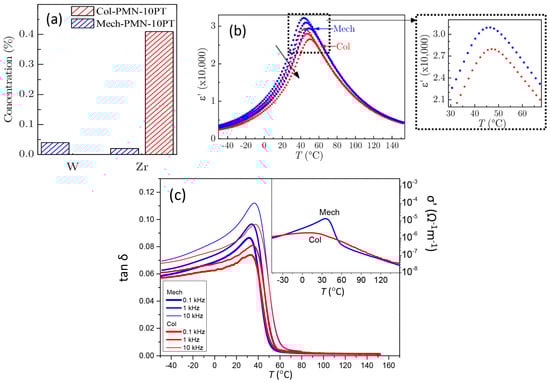
Figure 4.
(a) Concentrations of contaminants in the PMN-10PT powder due to the wear of the milling bodies, determined by ICP spectrometry. Concentration is given in mole of contaminant per mole of PMN-10PT (in %). Temperature dependence of the (b) and (c) at 0.1, 1, and 10 kHz for the Col (red stars) and Mech (blue circles) ceramics. The black arrow in (b) indicates the increasing frequency. Inset in (b): smaller scale of the at 1 kHz. Inset in (c): The specific electrical conductivity σ’ for both samples calculated from the dielectric data at 0.1 kHz.
Further, PFM analyses on the Col and Mech samples were performed before (Figure 3c,e) and after poling at 40 kV/cm (Figure 3d,f). The fine-grain response in both samples, yielding labyrinth-type domain features, can likely be attributed to clusters of piezo-active nanodomains. These features disappear after in-situ heating the samples to temperatures higher than the dielectric permittivity maximum, confirming that the observed features are ferroelectric domains. After poling, these features partially disappear (see top parts of the bottom images in Figure 3d,f), which could indicate a more uniform distribution of dipoles. Such domain structures were previously observed in PMN-10PT single crystals [,,] and a similar nanometre-sized domain structure was also observed in mechanochemically synthesized Pb(Sc0.5Nb0.5)O3 near the ferroelectric-relaxor crossover [].
To understand the reasons for the different responses of the Col and Mech samples to the electric field, we further investigated the concentrations of the contaminants in the PMN-10PT powders due to possible wear of the milling bodies. The results of the ICP mass spectroscopy are given in Figure 4a. In the Mech powder, the analysis confirmed the presence of W and Zr in very small amounts, i.e., 0.04 and 0.02 mol% (mole of contaminant per mole of PMN-10PT in %), respectively. The concentration of Co, also a constituent of the WC milling bodies, was below the detection limit (<25 mg/kg). On the other hand, the amount of Zr in the Col powder was about 20 times higher than in the Mech powder, i.e., 0.41 mol%. Therefore, a possible influence of the W and Zr impurities on the BF in the Col and the Mech samples, respectively, should be considered.
Next, we investigated the ε′(T) of both samples. The two ceramics show similar trends in dielectric permittivity vs temperature (Figure 4b); both samples exhibit a dielectric permittivity maximum () at 47 °C at 1 kHz, irrespective of the synthesis method. However, the of the Mech reaches 30,900, which is ~10% higher than the value obtained for the Col ceramic. According to [], the PMN-13PT, containing 1 mol% of WO3, displayed a stronger frequency dispersion of ε′(T), a downward shift of Tεmax and an increased compared to the stoichiometric material. Therefore, we cannot exclude the possibility that the 0.04 mol% of W in the Mech samples could slightly enhance their dielectric properties.
In the next step, we also consider the 0.41 mol% of Zr observed in the Col sample. In the case of [Pb0.98Ba0.01][(Zr0.53Ti0.47)0.98Nb0.02)O3 the addition of 2 vol% ZrO2 contributed to an ~20% lower dielectric permittivity peak []. In contrast, 1 vol% ZrO2 doping of Pb(Zr0.52Ti0.48)O3 had little influence on the microstructure and mechanical properties of the material []. Therefore, 0.41% of Zr in the Col could slightly deteriorate its dielectric properties, but this cannot explain the large discrepancy in the BF observed between the Col and the Mech samples.
The microstructures of the Col and Mech samples are collected in Figure 5. Both samples had an RD exceeding 96% and crystallized in a pure perovskite phase (Figure S3, Supporting Information). We carefully compared the microstructures, as different sintering times could result in the evaporation of lead oxide and consequently in a loss of stoichiometry. The WDXS analysis of the Col and the Mech ceramics revealed that the materials had comparable chemical compositions, relatively homogeneous throughout the volume of the grains, see Table 1. The amount of Pb was ~20.3 at% in both cases. The calculated A:B ionic ratios were 1.007 ± 0.029 and 1.003 ± 0.011 for the Col and the Mech ceramics, respectively. Nevertheless, scattering of the Pb concentration around its average value is more pronounced in the Col sample than in the Mech sample, and it results in a three-times-larger standard deviation of Pb in the former sample (see Figure S4 for WDXS results). Similarly, we observed a larger deviation of the Nb and Mg concentrations in the Col sample. This could indicate a better chemical homogeneity of the Mech samples, as was previously reported for another lead-based perovskite relaxor [].
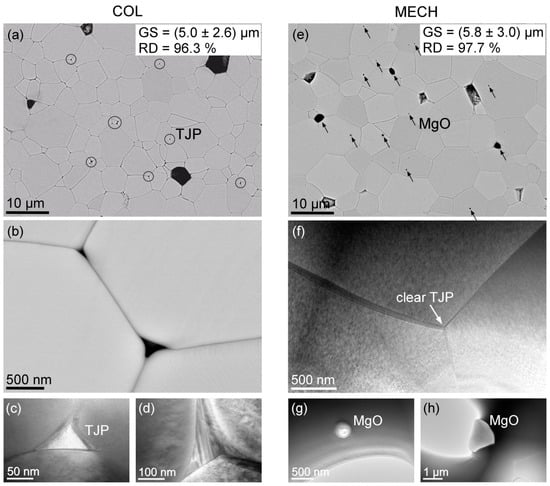
Figure 5.
Microstructures of Col (a–d) and Mech (e–h) PMN-10PT samples from combined SEM (a,b,e) and TEM (c,d,f–h) techniques. Circles in (a) point out the triple-junction points (TJP), magnified in (b–d), where secondary phases of Mg- and Pb-silicates crystallized. Arrows in (e) point out the MgO grains at the grain boundaries and trapped MgO inclusions in the matrix grains. Panel (f) shows clear TJPs of the Mech sample. Panels (g,h) are TEM images of MgO inclusions.

Table 1.
Chemical composition and the standard deviation (STDEV) of the Col and the Mech ceramics, determined by WDXS.
To pinpoint the reasons for the different dielectric breakdown fields of the Col and Mech samples, we further investigated their microstructures by SEM and TEM techniques (Figure 5). We observe two main differences. While we did not find any grains of secondary phases in the Col sample, we noticed that some triple-junction points (TJPs) between the grains contained secondary phases (circled in Figure 5a). Randall et al. [] also observed intergranular phases in the PMN-7PT prepared by the columbite route, located at the grain boundaries and TJPs that were rich in lead and contained Al, Si, P, and S impurities. Rounded matrix grains at the TJPs implied the presence of a liquid phase during sintering. Such rounded matrix grains at the TJPs were also observed in our samples (Figure 5b–d). The presence of a liquid phase is additionally supported by the much steeper dynamic sintering curve of the Col sample, the onset of which is ≈100 °C down-shifted compared to the Mech sample; see Supporting Information, Figure S1.
The observed secondary phases in the Col samples were analyzed by EDS in the TEM, which mainly confirmed the presence of Mg– and Pb–silicates/alumosilicates/phosphates. High-resolution imaging of the silicon-rich TJPs showed that the secondary phases were predominantly crystalline (Figure 5c,d). Despite the observed TJP phases being crystalline, the presence of the two constituents, Si and Pb, implies the possibility of semi-glassy phases, or even thin segregated layers of low-melting-point Pb-rich amorphous phases at the grain boundaries [,]. Furthermore, electric breakdown studies of lead silicates have shown a monotonic decrease in the breakdown field with increasing PbO content []. The formation of the silicate network is governed by the interplay of the SiO4 tetrahedra and PbOx polyhedra []. Such a semi-crystalline phase has a large amount of free volume, which can also account for other impurities introduced into the silicate network. Mg, on the other hand, can form various stable crystalline silicate phases and/or solid solutions [].
In contrast, in the Mech sample, the TJPs were clear (Figure 5e,f), i.e., free from any secondary phases. However, the sample contained MgO inclusions within the matrix grains, as well as individual MgO grains of up to about 1 μm in size (Figure 5g,h). These are presumed to be unreacted leftovers from the mechanochemical synthesis, which remained due to their low chemical reactivity. Figure 5f further confirms the presence of nanodomains (see nanosized features of different contrast), characteristic for a relaxor ferroelectric material. Similar nanodomains are observed also in the Col sample.
In order to better understand the effects of microstructural features on the breakdown characteristics of the two PMN-10PT samples, we investigate breakdown field paths by SEM. Figure 6a shows the microstructure of the Col sample after the dielectric breakdown. Along the path of the sample’s point of breakdown, we observe a molten surface with a network of cracks, connected across channels that were created by the electric current flow during (or prior to) the electrical breakdown (see inset). In the Mech sample, however, shown in Figure 6b, we observe the melted matrix phase and cracked MgO grains, linked with finite cracks (see inset), caused by the electrical loading of the sample.
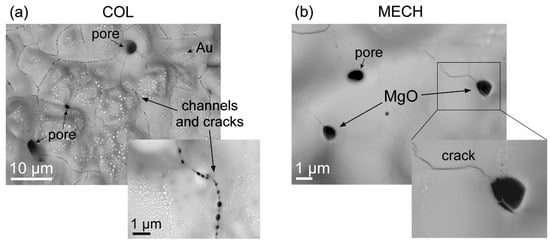
Figure 6.
Comparison of Col (a) and Mech (b) PMN-10PT samples after the dielectric breakdown, viewed along the breakdown path, perpendicular to the sample’s surface. (a) The melted surface of the Col sample shows a network of cracks along the channels of numerous electric breakdown paths penetrating the bulk (see inset for small black holes, i.e., channels, connected by cracks). White bubbles are remains of molten Au-electrode. (b) The surface at the breakdown point in the Mech sample shows a melted matrix with MgO grains that were cracked. The inset shows the propagation of a crack along the grain boundaries of the matrix that ends at the MgO grain.
After inspecting the breakdown features, we search the literature for a link between the cracked MgO grains and the higher BF of the Mech sample. Indeed, the influence of the MgO addition on the BF in perovskite materials was previously discussed. It has been shown that the addition of MgO can significantly improve the BF of Ba0.4Sr0.6TiO3 [,] and 0.475Bi0.5Na0.5TiO3–0.525Ba0.85Ca0.15Ti0.9Zr0.1O3 [] ceramics, due to the very high BF of MgO (1000 kV/cm []). A significant enhancement in BF was also observed in Ba0.7Sr0.3TiO3 thin films on Al2O3 substrates when doped with MgO []. Looking closely at the Figure 6a inset we could see that a crack propagated though the matrix during partial breakdown (most likely along the matrix grain boundaries), penetrated the MgO grain, caused its partial fracture, but was then stopped. This could imply that the MgO inclusions are effective at hindering the propagation of several micro-cracks [] before the samples’ final breakdown due to electrical/heat overload.
The proposed stress-relief mechanism is suggested to increase the fracture toughness of the material and plausibly contributes to the higher BF of the Mech samples. When compared to the Col sample that possesses no MgO grains, it seems that there is no such barrier for the electrons to stop (be absorbed) within the bulk, causing channels and cracks throughout the ceramic. We thus suggest that the lower BF in the Col sample is due to the lack of MgO grains, but also traces of silicate phases (and other impurities) that we identified at the grain contacts [,].
4. Conclusions
This study of the EC effect for PMN-10PT ceramics provided evidence of how the ‘fingerprints’ of a selected synthesis route crucially influence the functional properties. The ceramics were prepared via the conventional columbite route and by mechanochemical synthesis. The latter samples could withstand dc electric fields as high as 115 kV/cm, which contributed to very high electrocaloric temperature changes, i.e., of 2.37 K at 107 °C. In contrast, the ceramics prepared by columbite synthesis could withstand only ~60 kV/cm, and thus had a much lower . The mechanochemically derived ceramic is characterized by a slightly higher peak dielectric permittivity and saturated polarization, slimmer polarization vs. electric field loop, and a finer domain structure. These features could be related to a higher level of chemical homogeneity in this material, as evidenced by the WDXS.
A detailed investigation of the microstructure in the columbite-derived ceramics revealed a lead/magnesium-silicate-based phase located at the triple junctions of the grains, in agreement with earlier studies of columbite-derived PMN-PT materials. Such a semi-crystalline phase is presumably an easy path for the current propagation. Quite the contrary, in the mechanochemically derived PMN-10PT, the grain boundaries were clean, and furthermore, inter- and intragranular MgO inclusions were identified. These microstructural features contribute to a higher electric breakdown field of the mechanochemically synthesized PMN-10PT ceramics.
Supplementary Materials
The following are available online at https://www.mdpi.com/article/10.3390/cryst11040372/s1. Table S1. Comparison of the EC properties for PMN-PT ceramics prepared by columbite and mechanochemical syntheses. Figure S1. (a) Particle size distributions and (b) the dynamic sintering curves of the Col (red) and Mech (blue) powders. Lines are a guide for the eye; Figure S2. XRD patterns of the Col (red) and Mech (blue) powders. The peaks, denoted with Miller indices, correspond to the PMN (JCPDS 81-0861). Green and violet tick marks correspond to the peak positions of the cubic Pb1.86Mg0.24Nb1.76O6.5 (Py; JCPDS 82-0338) and tetragonal PT (JCPDS 078-0299), respectively. Note the square-root scale of the y-axis. Figure S3. (a) XRD pattern of the sintered Col and Mech PMN-10PT ceramics. All the peaks cor-respond to the perovskite phase (JCPDS 81-0861). (b) An enlarged 2Θ region from 15 to 35°. Figure S4. Deviation of the concentration for individual elements with regard to their nominal concentrations. The results are given together with STDEV for the Col and Mech ceramics. The analyses were performed on the grain interiors.
Author Contributions
Conceptualization, H.U., M.V., and B.M.; data curation, H.U., M.V., M.O., L.F., and B.R.; formal analysis, H.U., M.V., M.O., L.F., and B.R.; investigation, H.U., M.V., M.O., L.F., B.R., Z.K., V.B., and B.M.; methodology, Z.K. and V.B.; project administration, B.M.; supervision, B.M.; writing—original draft, H.U. and B.M.; writing—review & editing, H.U., M.V., M.O., L.F., B.R., Z.K., V.B., and B.M. All authors have read and agreed to the published version of the manuscript.
Funding
This research was funded by the Slovenian Research Agency (ARRS), grant numbers J2-1738, L2-8180, P2-0105 and P1-0125.
Institutional Review Board Statement
Not applicable.
Informed Consent Statement
Not applicable.
Data Availability Statement
Not need.
Acknowledgments
Technical support by Silvo Drnovšek and Jena Cilenšek from the JSI and the Erasmus+ programme is gratefully acknowledged. The authors also thank the Slovenian Research Agency for financial support in the frame of the projects J2-1738, L2-8180 and programs P2-0105 and P1-0125.
Conflicts of Interest
The authors declare no conflict of interest.
References
- Vrabelj, M.; Ursic, H.; Kutnjak, Z.; Rozic, B.; Drnovsek, S.; Bencan, A.; Bobnar, V.; Fulanovic, L.; Malic, B. Large electrocaloric effect in grain-size-engineered 0.9Pb(Mg1/3Nb2/3)O3–0.1PbTiO3. J. Eur. Ceram. Soc. 2016, 36, 75–80. [Google Scholar] [CrossRef]
- Rožič, B.; Kosec, M.; Uršič, H.; Holc, J.; Malič, B.; Zhang, Q.M.; Blinc, R.; Pirc, R.; Kutnjak, Z. Large electrocaloric effect in grain-size-engineered 0.9Pb(Mg1/3Nb2/3)O3–0.1PbTiO3. J. Appl. Phys. 2011, 110, 1–5. [Google Scholar]
- Moya, X.; Kar-Narayan, S.; Mathur, N.D. Caloric materials near ferroic phase transitions. Nat. Mater. 2014, 13, 439–450. [Google Scholar] [CrossRef]
- Fulanović, L.; Bradeško, A.; Novak, N.; Malič, B.; Bobnar, V. Relation between dielectric permittivity and electrocaloric effect under high electric fields in the Pb(Mg1/3Nb2/3)O3-based ceramics. J. Appl. Phys. 2020, 127, 184102. [Google Scholar] [CrossRef]
- Plaznik, U.; Kitanovski, A.; Rozic, B.; Malic, B.; Ursic, H.; Drnovsek, S.; Cilensek, J.; Vrabelj, M.; Poredos, A.; Kutnjak, Z. Bulk relaxor ferroelectric ceramics as a working body for an electrocaloric cooling device. Appl. Phys. Lett. 2015, 106, 043903. [Google Scholar] [CrossRef]
- Lu, S.G.; Rozic, B.; Zhang, Q.M.; Kutnjak, Z.; Li, X.; Furman, E.; Gorny, L.J.; Lin, M.; Malic, B.; Kosec, M.; et al. Organic and inorganic relaxor ferroelectrics with giant electrocaloric effect. Appl. Phys. Lett. 2010, 97, 162904. [Google Scholar] [CrossRef]
- Valant, M. Electrocaloric materials for future solid-state refrigeration technologies. Prog. Mater. Sci. 2012, 57, 980–1090. [Google Scholar] [CrossRef]
- Nair, B.; Usui, T.; Crossley, S.; Kurdi, S.; Guzmán-Verri, G.G.; Moya, X.; Hirose, S.; Mathur, N.D. Large electrocaloric effects in oxide multilayer capacitors over a wide temperature range. Nature 2019, 575, 468–472. [Google Scholar] [CrossRef]
- Moya, X.; Defay, E.; Mathur, N.D.; Hirose, S. Electrocaloric effects in multilayer capacitors for cooling applications. MRS Bull. 2018, 43, 291–294. [Google Scholar] [CrossRef]
- Fulanović, L.; Drnovšek, S.; Uršič, H.; Vrabelj, M.; Kuščer, D.; Makarovič, K.; Bobnar, V.; Kutnjak, Z.; Malič, B. Multilayer 0.9Pb(Mg1/3Nb2/3)O3–0.1PbTiO3 elements for electrocaloric cooling. J. Eur. Ceram. Soc. 2017, 37, 599–603. [Google Scholar] [CrossRef]
- Fulanović, L.; Koruza, J.; Novak, N.; Weyland, F.; Malič, B.; Bobnar, V. Fatigue-less electrocaloric effect in relaxor Pb(Mg1/3Nb2/3)O3 multilayer elements. J. Eur. Ceram. Soc. 2017, 37, 5105–5108. [Google Scholar] [CrossRef]
- Gevorgian, S. Ferroelectrics in Microwave Devces, Circuits and Systems, 1st ed.; Springer: London, UK, 2009. [Google Scholar]
- Neusel, C.; Jelitto, H.; Schmidt, D.; Janssen, R.; Felten, F.; Schneider, G.A. Thickness-dependence of the breakdown strength: Analysis of the dielectricand mechanical failure. J. Eur. Ceram. Soc. 2015, 35, 113–123. [Google Scholar] [CrossRef]
- Lee, H.Y.; Cho, K.H.; Nam, H.-D. Grain size and temperature dependence of electrical breakdown in BaTiO3 ceramic. Ferroelectrics 2006, 334, 165–169. [Google Scholar] [CrossRef]
- Owate, I.O.; Freer, R. Ac breakdown characteristics of ceramic materials. J. Appl. Phys. 1992, 72, 2418–2422. [Google Scholar] [CrossRef]
- Xu, X.; Hilmas, G.E. Effects of Ba6Ti17O40 on the dielectric properties of Nb-doped BaTiO3 ceramic. J. Am. Ceram. Soc. 2006, 89, 2496–2501. [Google Scholar] [CrossRef]
- Gerson, R.; Marshall, T.C. Dielectric breakdown of porous ceramics. J. Appl. Phys. 1959, 30, 1650–1653. [Google Scholar] [CrossRef]
- Tan, C.Y.; Yaghoubi, A.; Ramesh, S.; Adzila, S.; Purbolaksono, J.; Hassan, M.A.; Kutty, M. Sintering and mechanical properties of MgO-doped nanocrystalline hydroxyapatite. Ceram. Int. 2013, 39, 8979–8983. [Google Scholar] [CrossRef]
- Shrout, T.R.; Swartz, S.L. Dielectric properties of pyrochlore lead magnesium niobate. Mat. Res. Bull. 1983, 18, 663–667. [Google Scholar] [CrossRef]
- Swartz, S.L.; Shrout, T.R. Fabrication of perovskite lead magnesium niobate. Mat. Res. Bull. 1982, 17, 1245–1250. [Google Scholar] [CrossRef]
- Swartz, S.L.; Shrout, T.R.; Schulze, W.A.; Cross, L.E. Dielectric properties of lead-magnesium niobate ceramics. J. Am. Ceram. Soc. 1984, 67, 311–314. [Google Scholar] [CrossRef]
- Baláž, P.; Achimovičová, M.; Baláž, M.; Billik, P.; Cherkezova-Zheleva, Z.; Criado, J.M.; Delogu, F.; Dutková, E.; Gaffet, E.; Gotor, F.J.; et al. Hallmarks of mechanochemistry: From nanoparticles to technology. Chem. Soc. Rev. 2013, 42, 7571–7637. [Google Scholar] [CrossRef]
- Ursic, H.; Bencan, A.; Drazic, G.; Esteves, G.; Jones, J.L.; Usher, T.-M.; Rojac, T.; Drnovsek, S.; Deluca, M.; Jouin, J.; et al. Unusual structural-disorder stability of mechanochemically derived-Pb(Sc0.5Nb0.5)O3. J. Mater. Chem. C 2015, 3, 10309–10315. [Google Scholar] [CrossRef]
- Rojac, T.; Benčan, A.; Uršič, H.; Malič, B.; Kosec, M. Synthesis of a Li- and Ta-modified (K,Na)NbO3 solid solution by mechanochemical activation. J. Am. Ceram. Soc. 2008, 91, 3789–3791. [Google Scholar] [CrossRef]
- Baek, J.; Isobe, T.; Senna, M. Synthesis of pyrochlore-free 0.9Pb(Mg1/3Nb2/3)O3–0.1PbTiO3 ceramics via a soft mechanochemical route. J. Am. Ceram. Soc. 1997, 81, 973–981. [Google Scholar]
- Wang, J.; Wan, D.M.; Xue, J.M.; Ng, W.B. Mechanochemical synthesis of 0.9Pb(Mg1/3Nb2/3)O3–0.1PbTiO3 from mixes oxides. Adv. Funct. Mater. 1999, 11, 210–213. [Google Scholar] [CrossRef]
- Algueró, M.; Moure, A.; Pardo, L.; Holc, J.; Kosec, M. Processing by mechanosynthesis and properties of piezoelectric Pb(Mg1/3Nb2/3)O3–PbTiO3 with different compositions. Acta Mater. 2006, 54, 501–511. [Google Scholar] [CrossRef]
- Kuščer, D.; Holc, J.; Kosec, M.; Meden, A. Mechano-synthesis of lead magnesium-niobate ceramics. J. Am. Ceram. Soc. 2006, 89, 3081–3088. [Google Scholar] [CrossRef]
- Correia, T.; Zhang, Q. Electrocaloric Materials: New Generation of Coolers, 1st ed.; Springer: Berlin/Heidelberg, Germany, 2014. [Google Scholar]
- Kutnjak, Z.; Rožič, B.; Pirc, R. Electrocaloric Effect: Theory, Measuring, and Applications. In Wiley Encyclopedia of Electrical and Electronics Engineering; John Wiley & Sons: Hoboken, NJ, USA, 2015; pp. 1–19. [Google Scholar]
- Ursic, H.; Vrabelj, M.; Fulanovic, L.; Bradesko, A.; Drnovsek, S.; Malic, B. Specific heat capacity and thermal conductivity of the electrocaloric (1−x)Pb(Mg1/3Nb2/3O3–xPbTiO3 ceramics between room temperature and 300 °C. J. Microelectron. Electron. Compon. Mater. Inf. MIDEM 2015, 45, 260–265. [Google Scholar]
- Rozic, B.; Malic, B.; Ursic, H.; Holc, J.; Kosec, M.; Neese, B.; Zhang, Q.M.; Kutnjak, Z. Direct Measurements of the Giant Electrocaloric Effect in Soft and Solid Ferroelectric Materials. Ferroelectrics 2010, 405, 26–31. [Google Scholar] [CrossRef]
- Perantie, J.; Tailor, H.N.; Hagberg, J.; Jantunen, H.; Ye, Z.-G. Electrocaloric properties in relaxor ferroelectric (1-x)Pb(Mg1/3Nb2/3)O3–xPbTiO3 system. J. Appl. Phys. 2013, 114, 174105. [Google Scholar] [CrossRef]
- Shvartsman, V.V.; Kholkin, A.L. Evolution of nanodomains in 0.9PbMg1/3Nb2/3O3–0.1PbTiO3 single crystals. J. Appl. Phys. 2007, 101, 064108. [Google Scholar] [CrossRef]
- Rodriguez, B.J.; Jesse, S.; Morozovska, A.N.; Svechnikov, S.V.; Kiselev, D.A.; Kholkin, A.L.; Bokov, A.A.; Ye, Z.-G.; Kalinin, S.V. Real space mapping of polarization dynamics and hysteresis loop formation in relaxor-ferroelectric PbMg1/3Nb2/3O3–PbTiO3 solid solutions. J. Appl. Phys. 2010, 108, 042006. [Google Scholar] [CrossRef]
- Bai, F.; Li, J.F.; Viehland, D. Domain hierarchy in annealed (001)-oriented Pb(Mg1/3Nb2/3)O3-x%PbTiO3 single crystals. Appl. Phys. Lett. 2004, 85, 2313–2315. [Google Scholar] [CrossRef]
- Ursic, H.; Drnovsek, S.; Malic, B. Complex domain structure in polycrystalline Pb(Sc0.5Nb0.5)O3. J. Phys. D Appl. Phys. 2016, 49, 115304. [Google Scholar] [CrossRef]
- Huebner, W.; Xue, W.; Lu, P.W. Effect of tungsten additions on the fieldinduced piezoelectric properties of Pb(Mg1/3Nb2/3)O3-PbTiO3 ceramics. In Proceedings of the Tenth IEEE International Symposium on Applications of Ferroelectrics, East Brunswick, NJ, USA, 18–21 August 1996; pp. 703–706. [Google Scholar]
- Bencan, A.; Malic, B.; Drnovsek, S.; Tellier, J.; Rojac, T.; Pavlic, J.; Kosec, M.; Webber, K.G.; Rodel, J.; Damjanovic, D. Structure and the electrical properties of Pb(Zr,Ti)O3–zirconia composites. J. Am. Ceram. Soc. 2012, 95, 651–657. [Google Scholar] [CrossRef]
- Tajima, K.; Hwang, H.J.; Sando, M.; Niihara, K. PZT nanocomposites reinforced by small amount of oxides. J. Eur. Ceram. Soc. 1999, 19, 1179–1182. [Google Scholar] [CrossRef]
- Randall, C.A.; Hilton, A.D.; Barber, D.J.; Shrout, T.R. Extrinsic contributions to the grain size dependence of relaxor ferroelectric Pb(Mg1/3Nb2/3)O3–PbTiO3 ceramics. J. Mater. Res. 1993, 8, 880–884. [Google Scholar] [CrossRef]
- Wang, H.C.; Schulze, W.A. The role of excess magnesium oxide or lead oxide in determining the microstructure and properties of lead magnesium niobate. J. Am. Ceram. Soc. 1990, 73, 825–832. [Google Scholar] [CrossRef]
- Weeks, R.A.; Kinser, D.L.; Lee, J.M. Charge trapping and dielectric breakdown in lead silicate glasses. In Proceedings of the Conference 4: International Conference on Physics of Non-Crystalline Solids, Clausthal-Zellerfeld, Germany, 13 September 1976. [Google Scholar]
- Kohara, S.; Ohno, H.; Takata, M.; Usuki, T.; Morita, H.; Suzuya, K.; Akola, J.; Pusztai, L. Lead silicate glasses: Binary network-former glasses with large amounts of free volume. Phys. Rev. B 2010, 82, 134209. [Google Scholar] [CrossRef]
- Yi, Y.S.; Lee, S.K. Pressure-induced changes in local electronic structures of SiO2 and MgSiO3 polymorphs: Insights from ab initio calculations of O K-edge energy-loss near-edge structure spectroscopy. Am. Mineral. 2012, 97, 897–909. [Google Scholar] [CrossRef]
- Zhang, Q.; Wang, L.; Luo, J.; Tang, Q.; Du, J. Ba0.4Sr0.6TiO3/MgO composites with enhanced energy storage density and low dielectric loss for solid-state pulse-forming line. Int. J. Appl. Ceram. Technol. 2010, 7, E124–E128. [Google Scholar] [CrossRef]
- Huang, Y.H.; Wu, Y.J.; Qiu, W.J.; Li, J.; Chen, X.M. Enhanced energy storage density of Ba0.4Sr0.6TiO3–MgO composite prepared by spark plasma sintering. J. Eur. Ceram. Soc. 2015, 35, 1469–1476. [Google Scholar] [CrossRef]
- Yao, M.; Pu, Y.; Zheng, H.; Zhang, L.; Chen, M.; Cui, Y. Improved energy storage density in 0.475BNT–0.525BCTZ with MgO addition. Ceram. Int. 2016, 42, 8974–8979. [Google Scholar] [CrossRef]
- Lee, S.Y.; Tseng, T.Y. Electrical and dielectric behavior of MgO doped Ba0.7Sr0.3TiO3 thin films on Al2O3 substrate. Appl. Phys. Lett. 2002, 80, 1797–1799. [Google Scholar] [CrossRef]
- Rejab, N.A.; Azhar, A.Z.A.; Ratnam, M.M.; Ahmad, Z.A. The relationship between microstructure and fracture toughness of zirconia toughened alumina (ZTA) added with MgO and CeO2. Int. J. Refract. Met. Hard Mater. 2013, 41, 522–530. [Google Scholar] [CrossRef]
- Kishimoto, A.; Endo, K.; Nakamura, Y.; Motohira, N.; Yanagida, H. Effect of High-Voltage Screening on Strength Distribution for Titanium Dioxide Ceramics. J. Am. Ceram. Soc. 1995, 78, 2248–2250. [Google Scholar] [CrossRef]
- Schneider, G.A. A Griffith type energy release rate model for dielectric breakdown under space charge limited conductivity. J. Mech. Phys. Solids 2013, 61, 78–90. [Google Scholar] [CrossRef]
Publisher’s Note: MDPI stays neutral with regard to jurisdictional claims in published maps and institutional affiliations. |
© 2021 by the authors. Licensee MDPI, Basel, Switzerland. This article is an open access article distributed under the terms and conditions of the Creative Commons Attribution (CC BY) license (https://creativecommons.org/licenses/by/4.0/).