1. Introduction
Potassium tantalum niobate has the largest known quadratic electro-optic coefficient in the paraelectric phase [
1], which is about 70 times larger than that of lithium niobate [
2]. KTN crystal has obvious advantages when it is used as an electro-optic deflector [
3] or modulator [
4]. The KTN-based optic devices have broad application prospects in the fields of optic communications, biomedical imaging, and radar scanning [
5,
6]. As early as 2003, high-quality large KTN single crystal with a volume of over 30 cm
3 has been grown using the top seeded solution growth method. However, the incongruent melting behavior [
7] of KTN crystal growth causes the problem of growth-induced striation, which is generally difficult to overcome. The quadratic electro-optic coefficient of a KTN crystals is usually calculated by measuring its dielectric constant [
8], but the obtained result by this method is the average quadratic electro-optic coefficient of the KTN crystal. For the reason of composition inhomogeneity, we cannot accurately measure the quadratic electro-optic coefficient at a certain point by its dielectric constant. By contrast, an optic method is preferred as the more suitable method for the accurate measurement of the quadratic EO coefficient [
9]. In this paper, an electro-optic modulation system was adopted for measuring the quadratic electro-optic coefficient of KTN crystal. The influence of temperature, voltage, and frequency on the measurement of the quadratic electro-optic coefficient was obtained.
It is generally believed that the KTN crystal undergoes a phase transition from the paraelectric phase to the ferroelectric phase as the temperature decreases. It is in the paraelectric phase above the Curie temperature, T
c, and in the ferroelectric phase below the Curie temperature. However, recent studies show that the cubic-tetragonal phase transition in KTN is a relaxor-like phase transition [
10]. There exists a Burns temperature (TB) above the Curie point in the cubic phase of KTN. When T
c < T < TB, there are a large number of nano-polar microdomains inside the crystal [
11], which makes the paraelectric phase KTN crystal exhibit certain relaxation characteristics. These relaxor-like behaviors also have an impact on the accurate measurement of the quadratic electro-optic coefficient of KTN crystal. This problem will also be discussed in this paper.
2. Theoretical Analysis
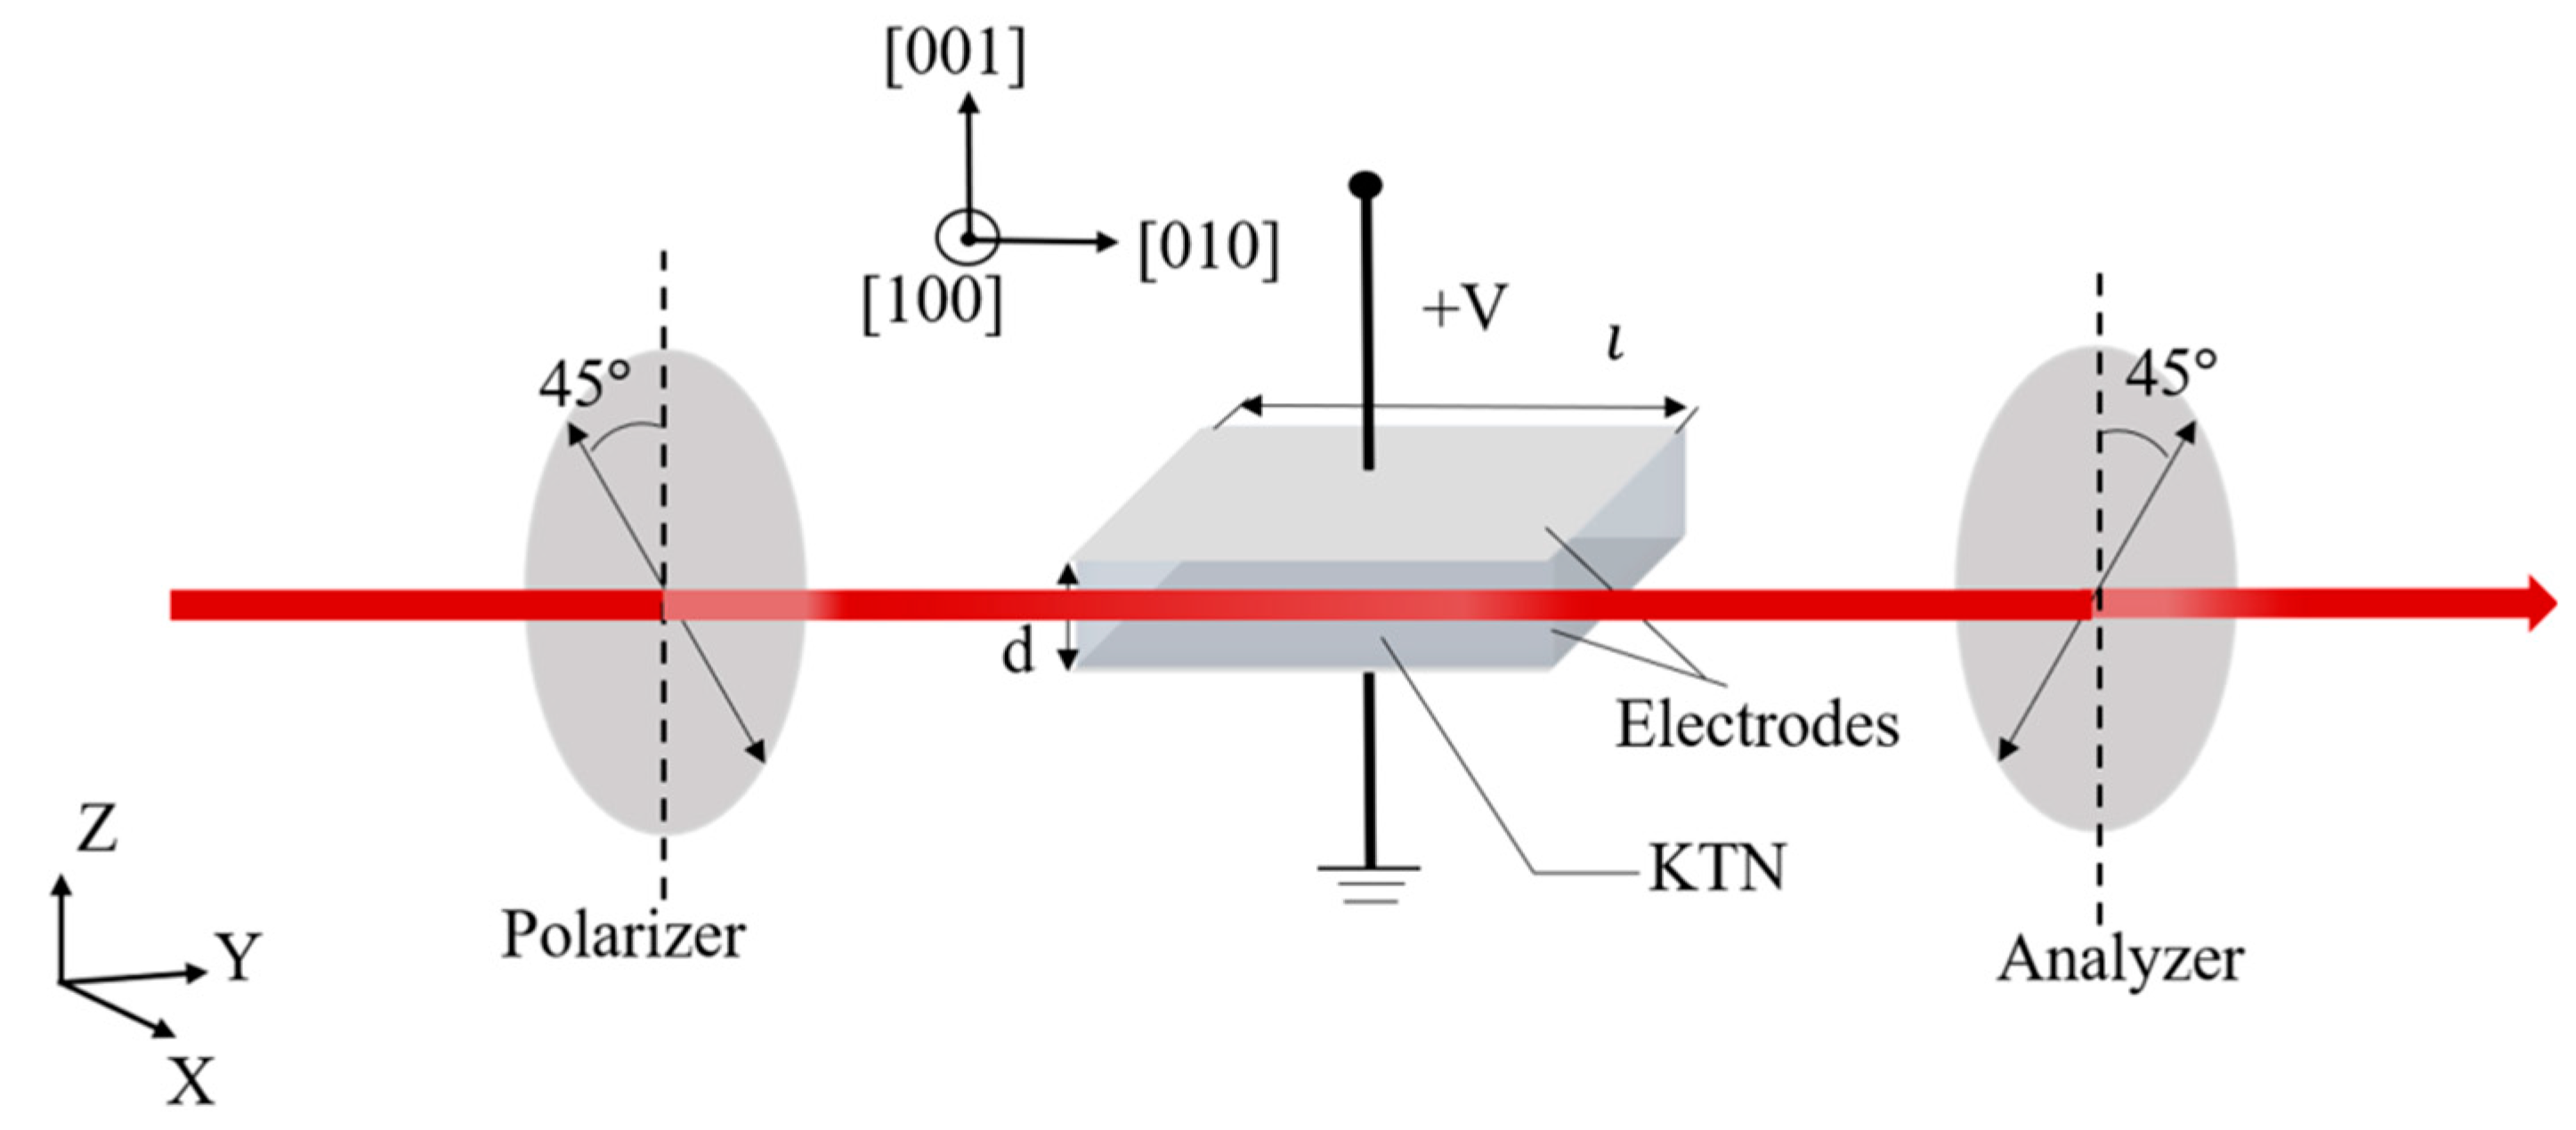
When a KTN crystal in its cubic phase is placed between a pair of crossed polarizers, the output light intensity will be modulated by the applied electric field on the crystal.
Figure 1 is a typical modulation system with a polarizer-sample-analyzer arrangement. The axis of the polarizer is at 45° of natural birefringence axes of the sample. The output light intensity, I, from the analyzer can be expressed as
where I
0 is the maximum light intensity, and
is the phase difference caused by natural birefringence [
11].
is the phase difference caused by the applied voltage under the electro-optic effect, which can be obtained from the following equation [
12]:
where λ is the laser wavelength,
is the refractive index change,
is the refractive index of the crystal when no electric field is applied, d is the distance between the electrodes, l is the crystal length in the light direction,
(
,
, are the abbreviations for the tensor describing the Kerr effect) is the effective quadratic electro-optic coefficient, and V is the applied voltage.
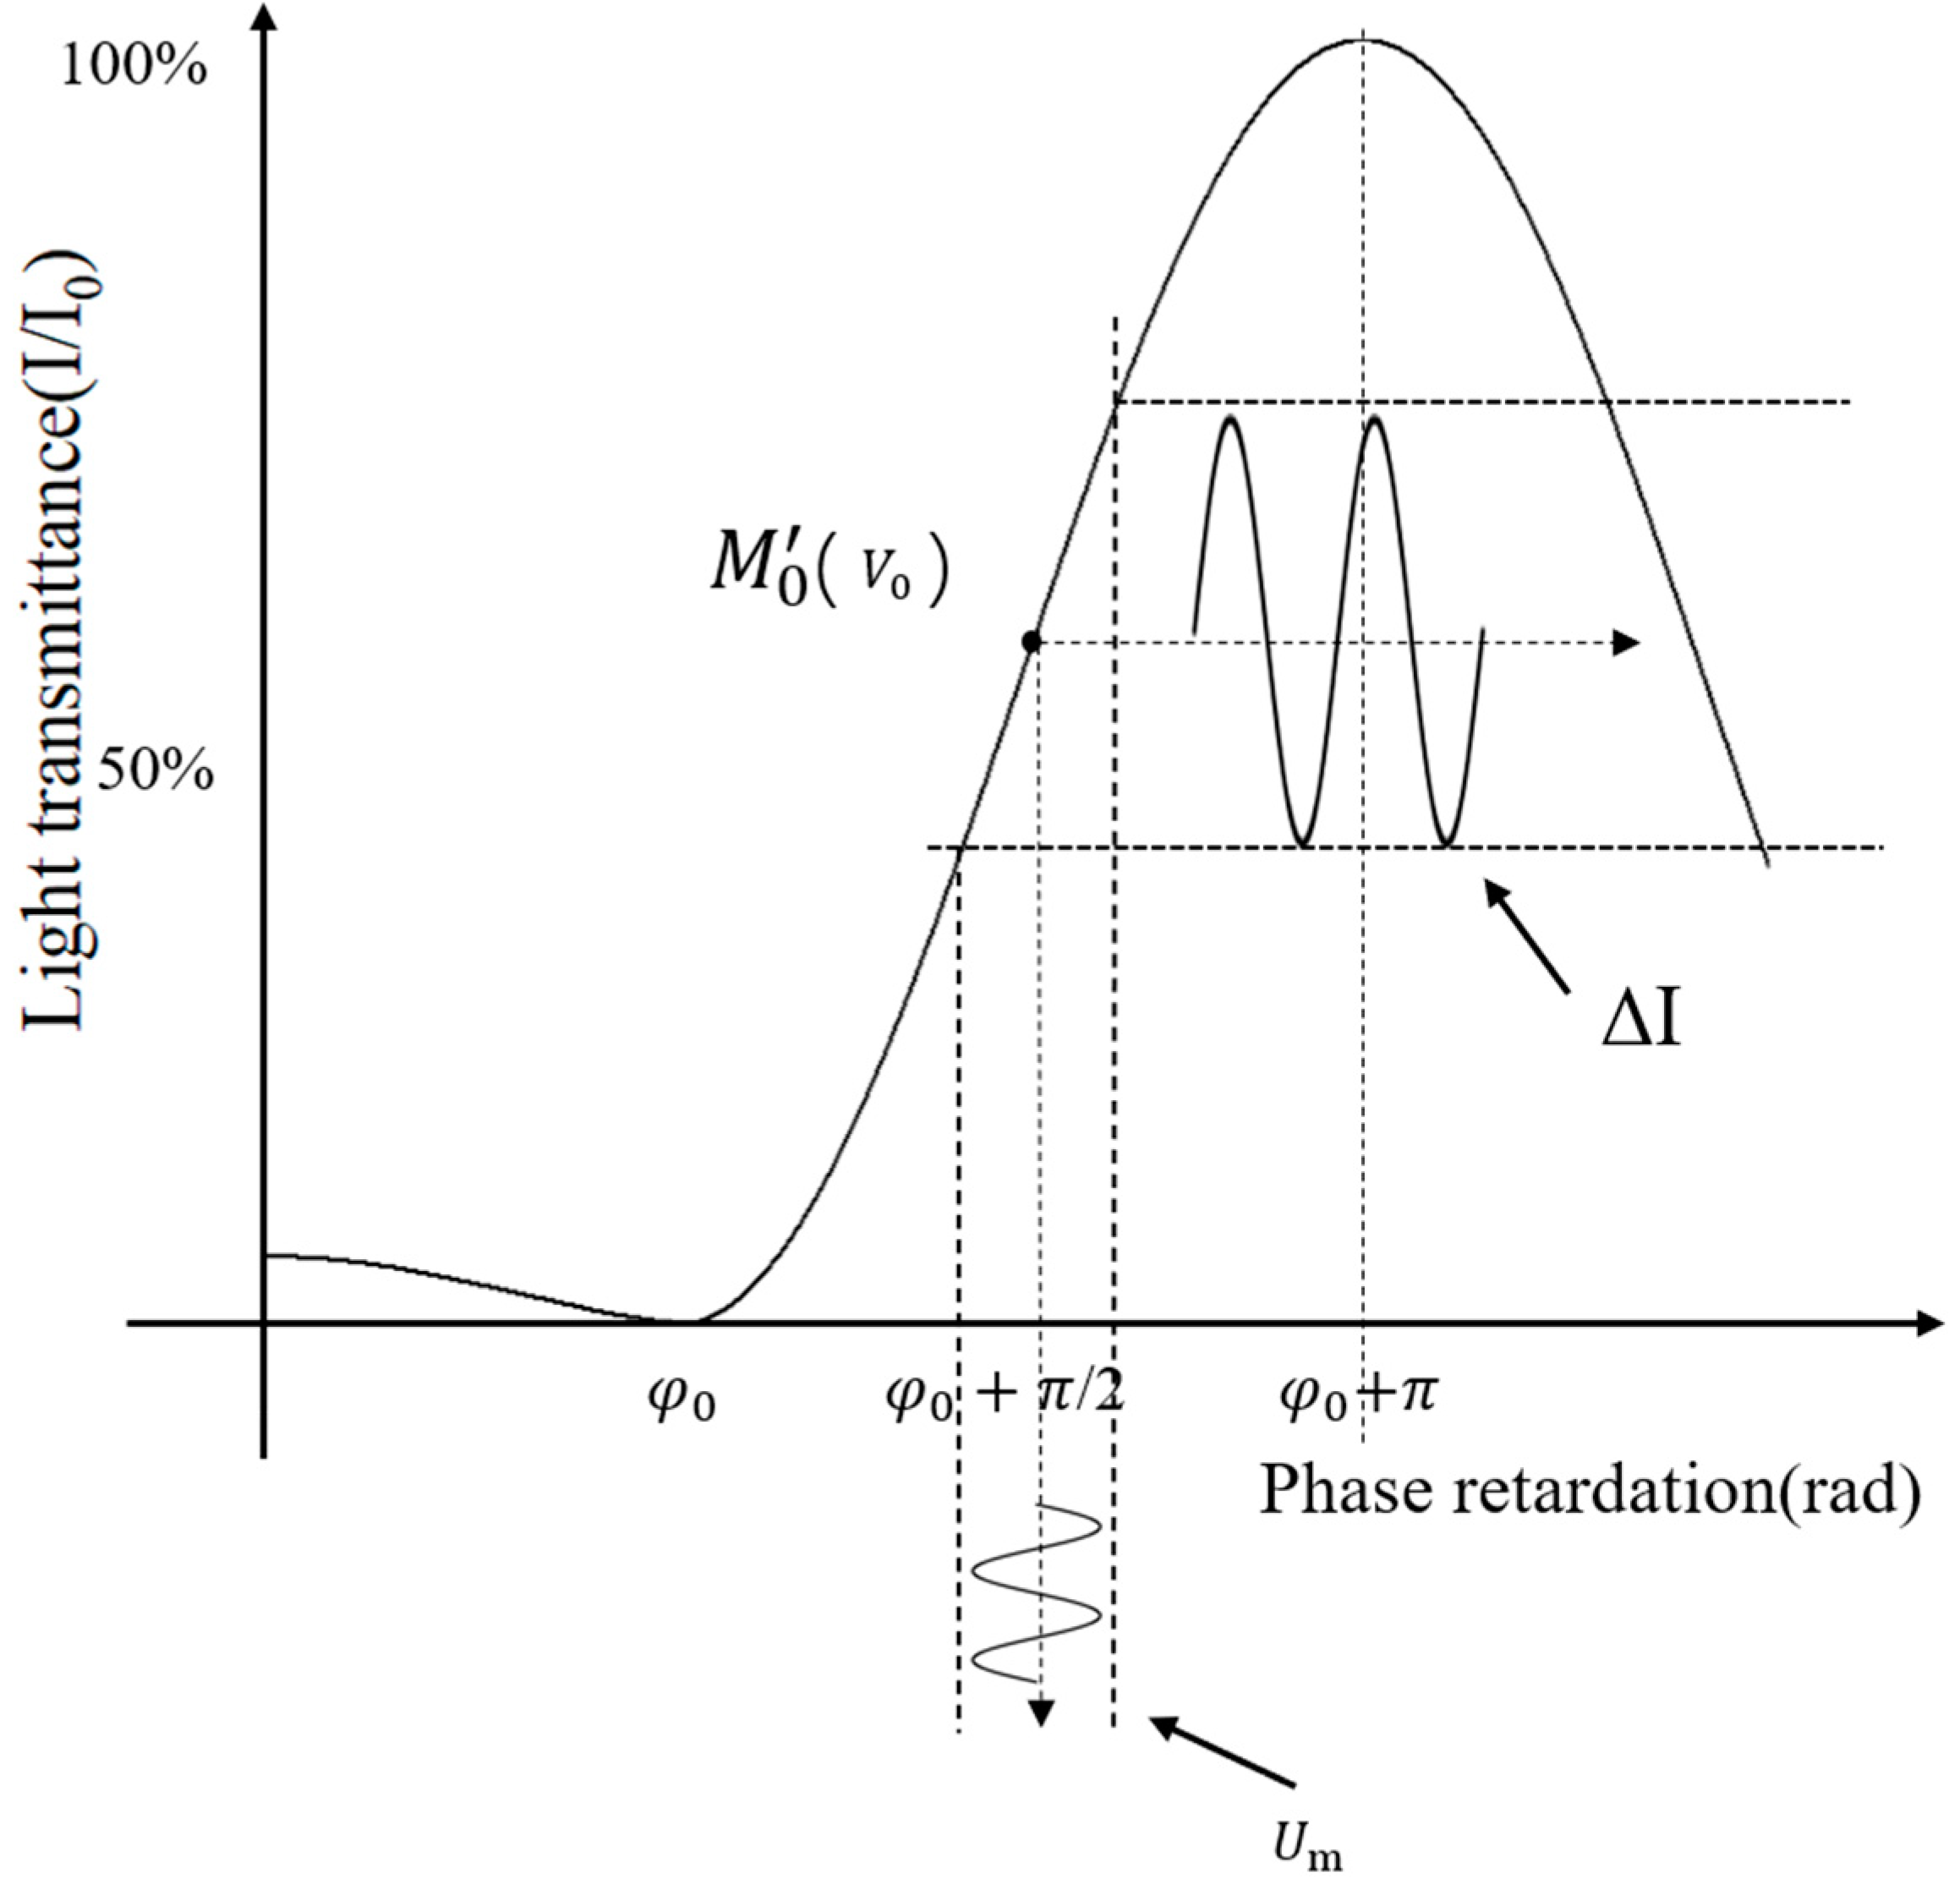
According to Equations (1) and (2), the transmittance curve of a typical KTN modulator is shown in
Figure 2. We choose point
as the operating point, which is corresponding to the full transmittance at half maximum. The corresponding dc bias voltage at this point is labeled as V
0.
In Formula (1), when
approaches zero, that is, the modulator is operated very close to point
, the small-angle approximation [
13] can be used and Equation (1) can be approximately rewritten as
In practice, the DC bias voltage V
0 is used to adjust the work point to
. Meanwhile, a sinusoidal modulating voltage with an amplitude U
m and a frequency ω
m is applied onto the sample at point
. According to Equations (2) and (3), the output light intensity change ΔI caused by the dynamic voltage can be expressed.
where U
m is the AC modulation voltage, and V
0 is the DC bias voltage. The effective quadratic electro-optic coefficient
can be given by
where the maximum light intensity I
0, the dc bias voltage V
0 at the half-maximum transmittance point, and output light intensity change ΔI caused by the dynamic voltage can be measured in the experiment. Hence, the effective quadratic electro-optic coefficient
can be obtained using the electro-optic modulation system in
Figure 1.
3. Results and Discussion
The high-quality KTa
0.65Nb
0.35O
3 single crystal was grown from the mixed solution of KTaO
3 (KT) and KNbO
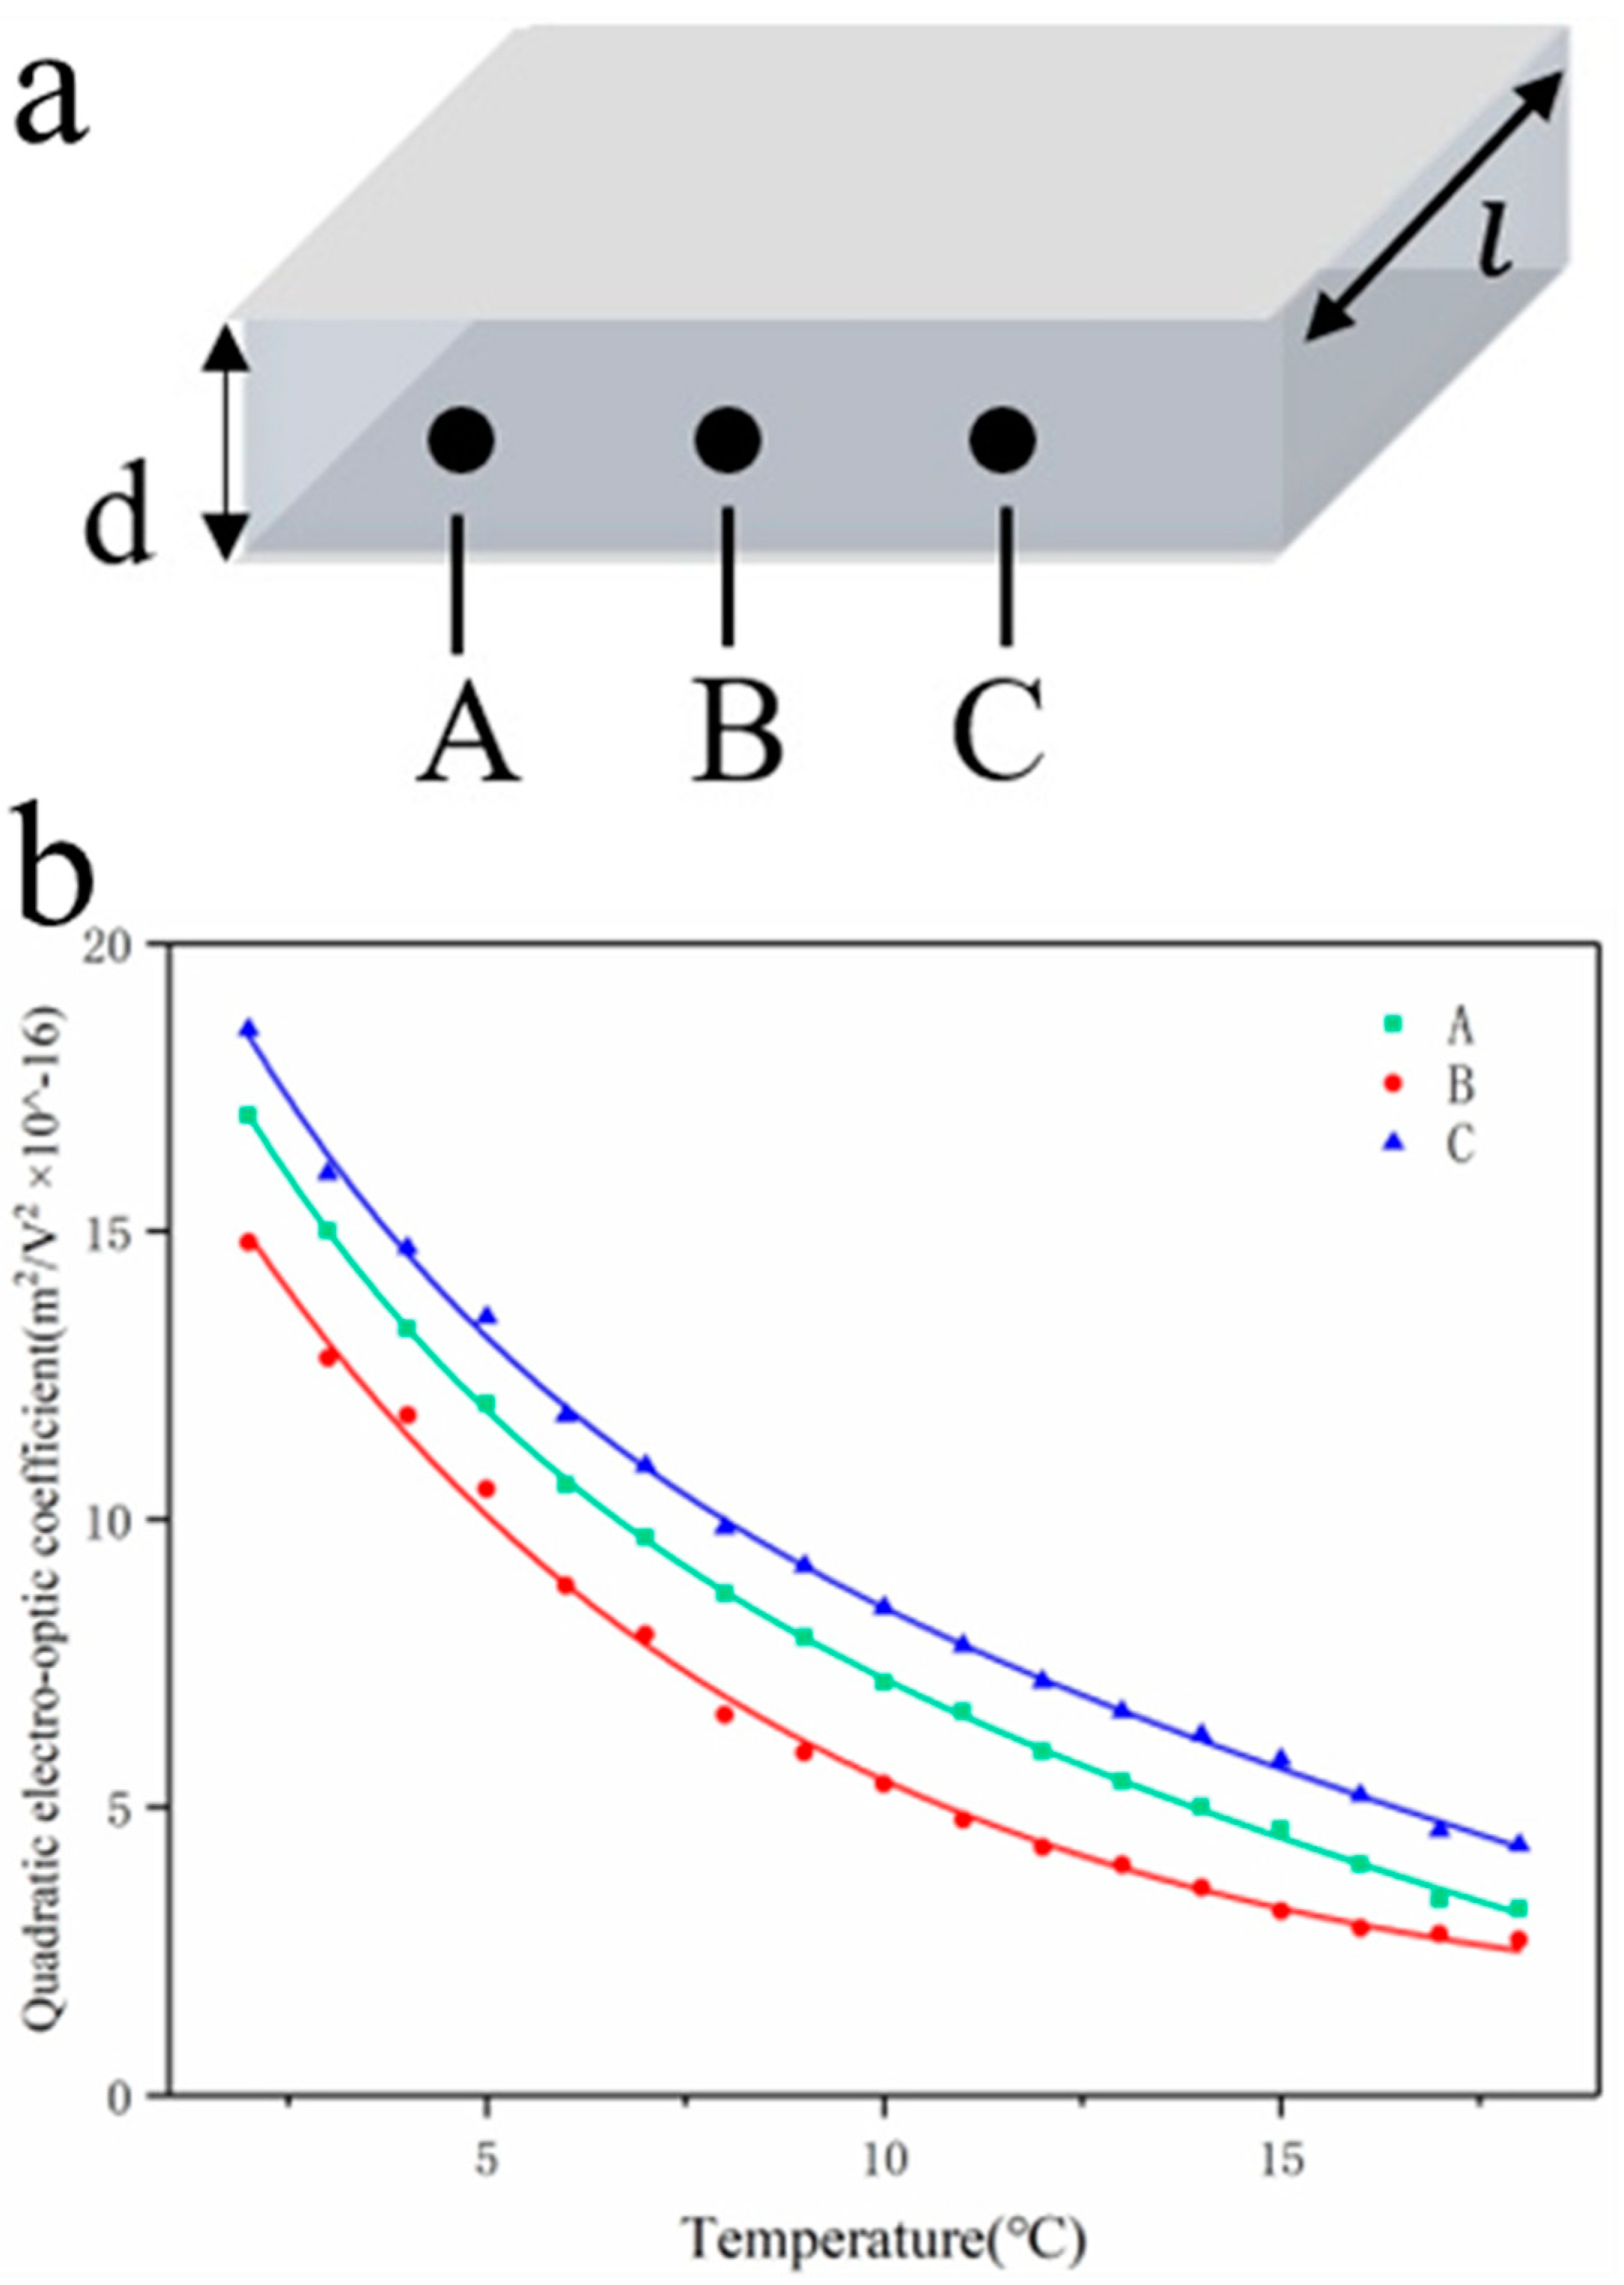
3 (KN) with a top-seeded solution growth method. We confine the three lengths of the block of 4 mm, 6 mm, and 2.5 mm to the three crystal axes x, y, and z, respectively. Two parallel light transmission surfaces were polished. Another two parallel surfaces normal to the direction of the applied electric field were sputtered with platinum electrode. The relative dielectric constant of the KTN crystal chip as a function of temperature could be obtained by a LCR digital bridge (HIOKI 3532-50) which is shown in
Figure 3. Through the dielectric thermograph data, we get that the Curie temperature of this KTN crystal chip is 0 °C.
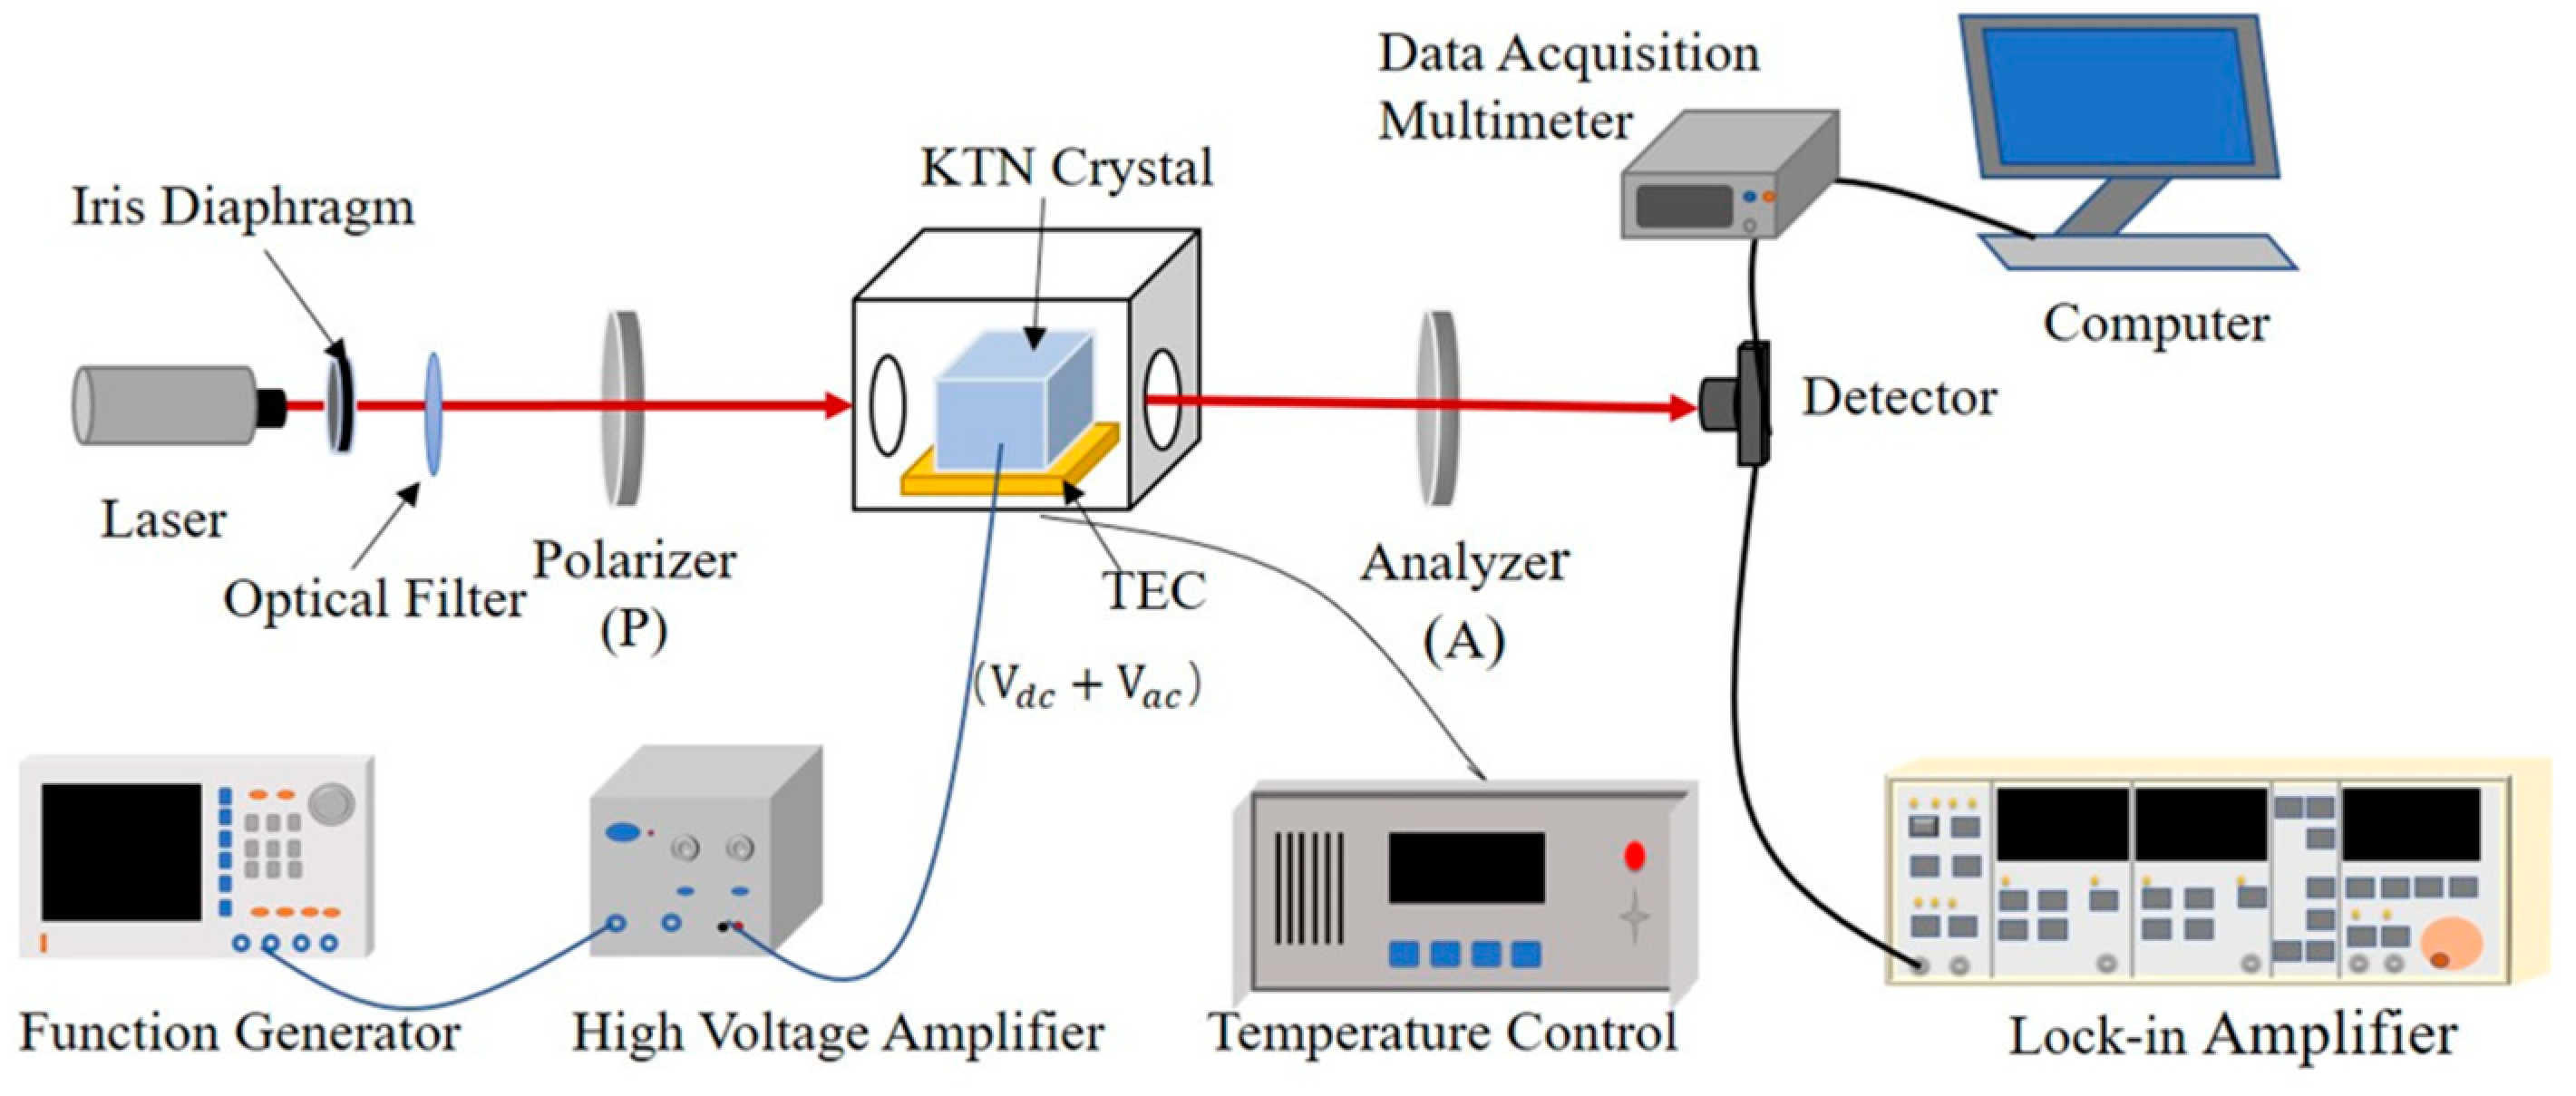
The experiment arrangement of the electro-optic modulation system for the quadratic electro-optic coefficient of KTN crystal is shown in
Figure 4. The temperature of the KTN crystal chip was controlled by a TEC temperature controller with an accuracy of ±0.1 °C. In order to ensure the temperature control accuracy and avoid water condensation on the crystal surface, the KTN sample and the TEC module were placed in a vacuum box. The light source is a linearly polarized He-Ne laser with λ = 632.8 nm. KTN crystal is placed between the crossed polarizer (P) and analyzer (A). The polarizing direction of the polarizer is set at 45° to the optic axis of the crystal. The voltage signal generated by the signal generator (RIGOL DG4062) is applied to the crystal through a high voltage amplifier (PINTECH HA-800). When the laser beam passes through the iris diaphragm and the ND filter, the spot diameter and the beam intensity are both reduced. Then, the beam is modulated by the polarizer-sample-analyzer system and the output light is converted into a voltage signal by the photodetector.
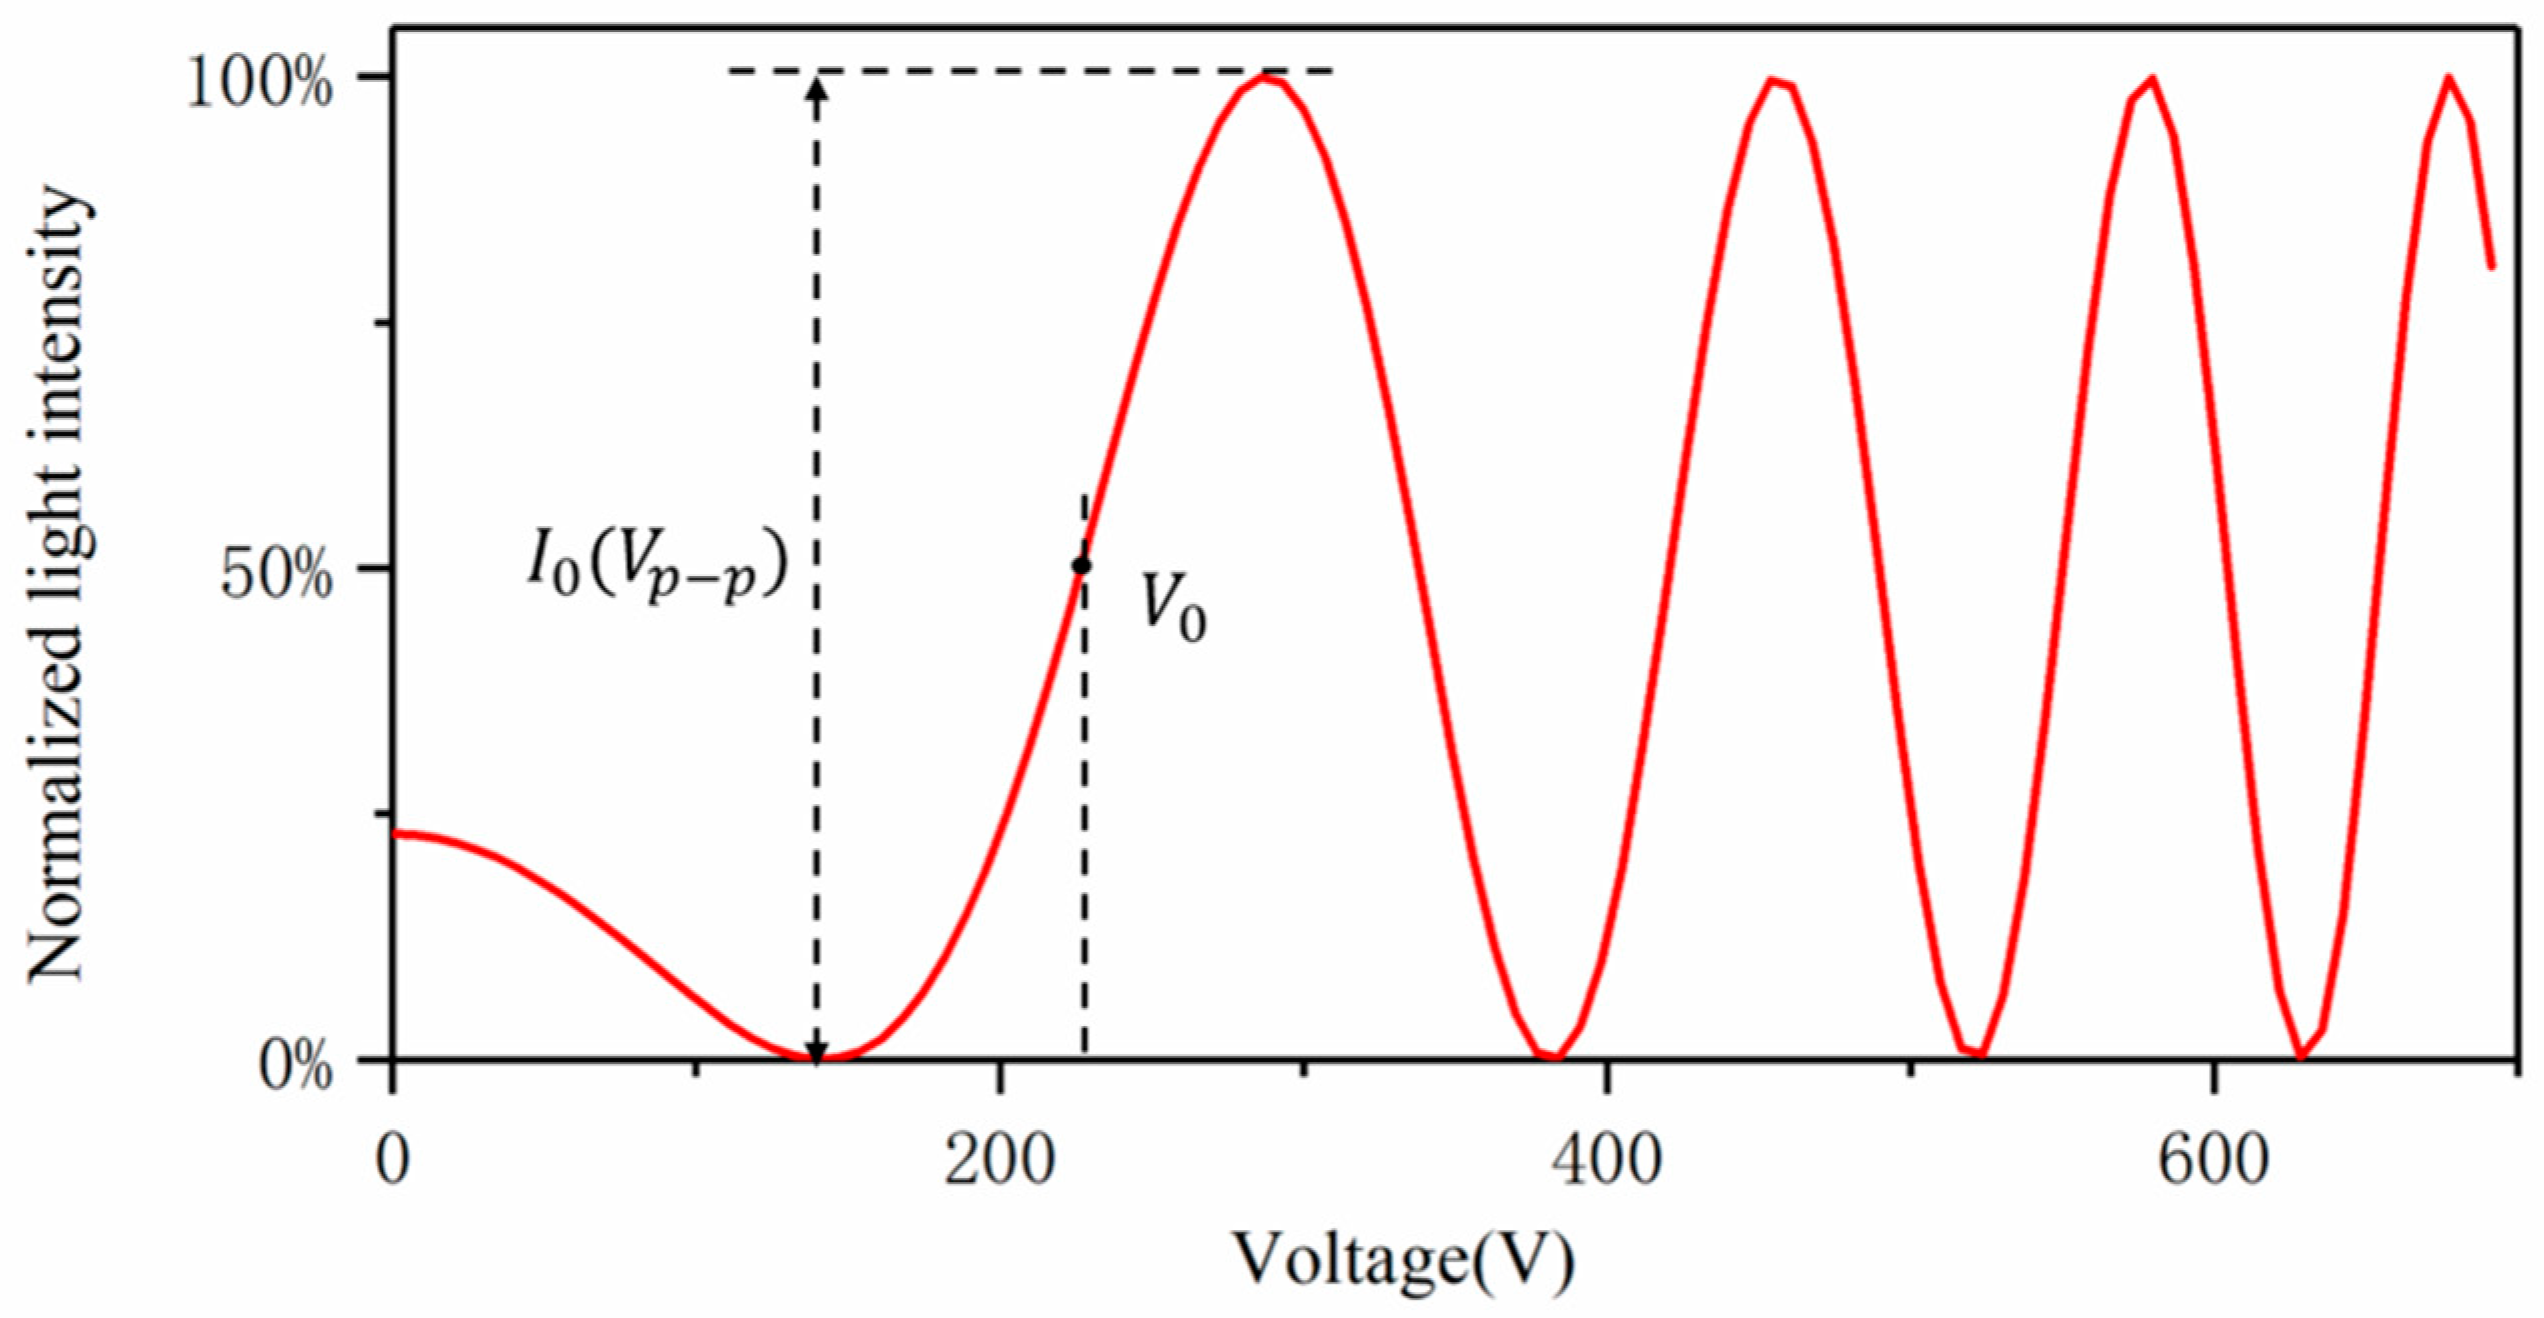
When a variable DC voltage is applied to the crystal, the output voltage signal from the detector, as well as the voltage applied to the crystal, was recorded by the data acquisition multimeter (Keithley DAQ6510). A typical light transmittance curve is shown in
Figure 5. We can determine the voltage V
0 applied on the crystal at the operating point
. We can also determine the maximum voltage output v
(p-p) from the detector, which is proportional to the maximum output light intensity. When AC voltage with amplitude U
m is applied at the operating point
, the amplitude of the output voltage signal v
out can be measured by a lock-in amplifier (Stanford SR830), and what we need to pay attention to is that the receiving frequency of the lock-in amplifier is 2ω
m. Finally, we get the equation
From Equations (6) and (7), the quadratic electro-optic coefficient can be calculated using the following formula:
Figure 6 shows the quadratic electro-optic coefficients of points A, B, and C at different temperatures. In the temperature range of 2–18 °C, the quadratic electro-optic coefficients of the three points all show a similar trend, and the quadratic electro-optic coefficients all increase rapidly as the temperature gets closer to the phase transition point. As mentioned earlier, in the TB interval above the Curie temperature, there are polar nano-domains in the crystal [
11]. So, as the temperature decreases, the size of the polar nano-region becomes larger and larger orderliness is also enhanced. Hence the electric susceptibility increases and the electro-optic effect is correspondingly enhanced. When the crystal is above the Curie temperature, its relative permittivity can be described by the Curie-Weiss law [
14]:
where
is the relative permittivity,
represents the maximum value of the relative permittivity, T
m represents the maximum characteristic temperature corresponding to the maximum value of the permittivity, which is approximately equal to the Curie temperature, T
C, C′ is the corrected Curie-Weiss constant, and
is the relaxation factor that quantifies the degree of dispersion of ferroelectric materials.
The relationship between the relative permittivity ε and the effective quadratic electro-optic coefficient is [
15]
where
and
are the quantifying nonlinearity of the medium, the change in the refractive index with the optical intensity. According to reports, the coefficients of KTN are
and
[
16]. Therefore, we can know that the relative permittivity
of the crystal will continue to increase as the temperature decreases, and the quadratic electro-optic coefficient will also increase.
In
Figure 6, we also noticed that the quadratic electro-optic coefficients at different positions of a certain crystal are significantly different. This is due to the fact that the incongruent melting behavior of KTN crystal growth causes the growth-induced striation, which makes the Curie temperature at these three points slightly different, so the electrical susceptibility and dielectric constant of each point at the same temperature are different. Being able to accurately measure the quadratic electro-optic coefficients at different points is also one of the advantages of this system.
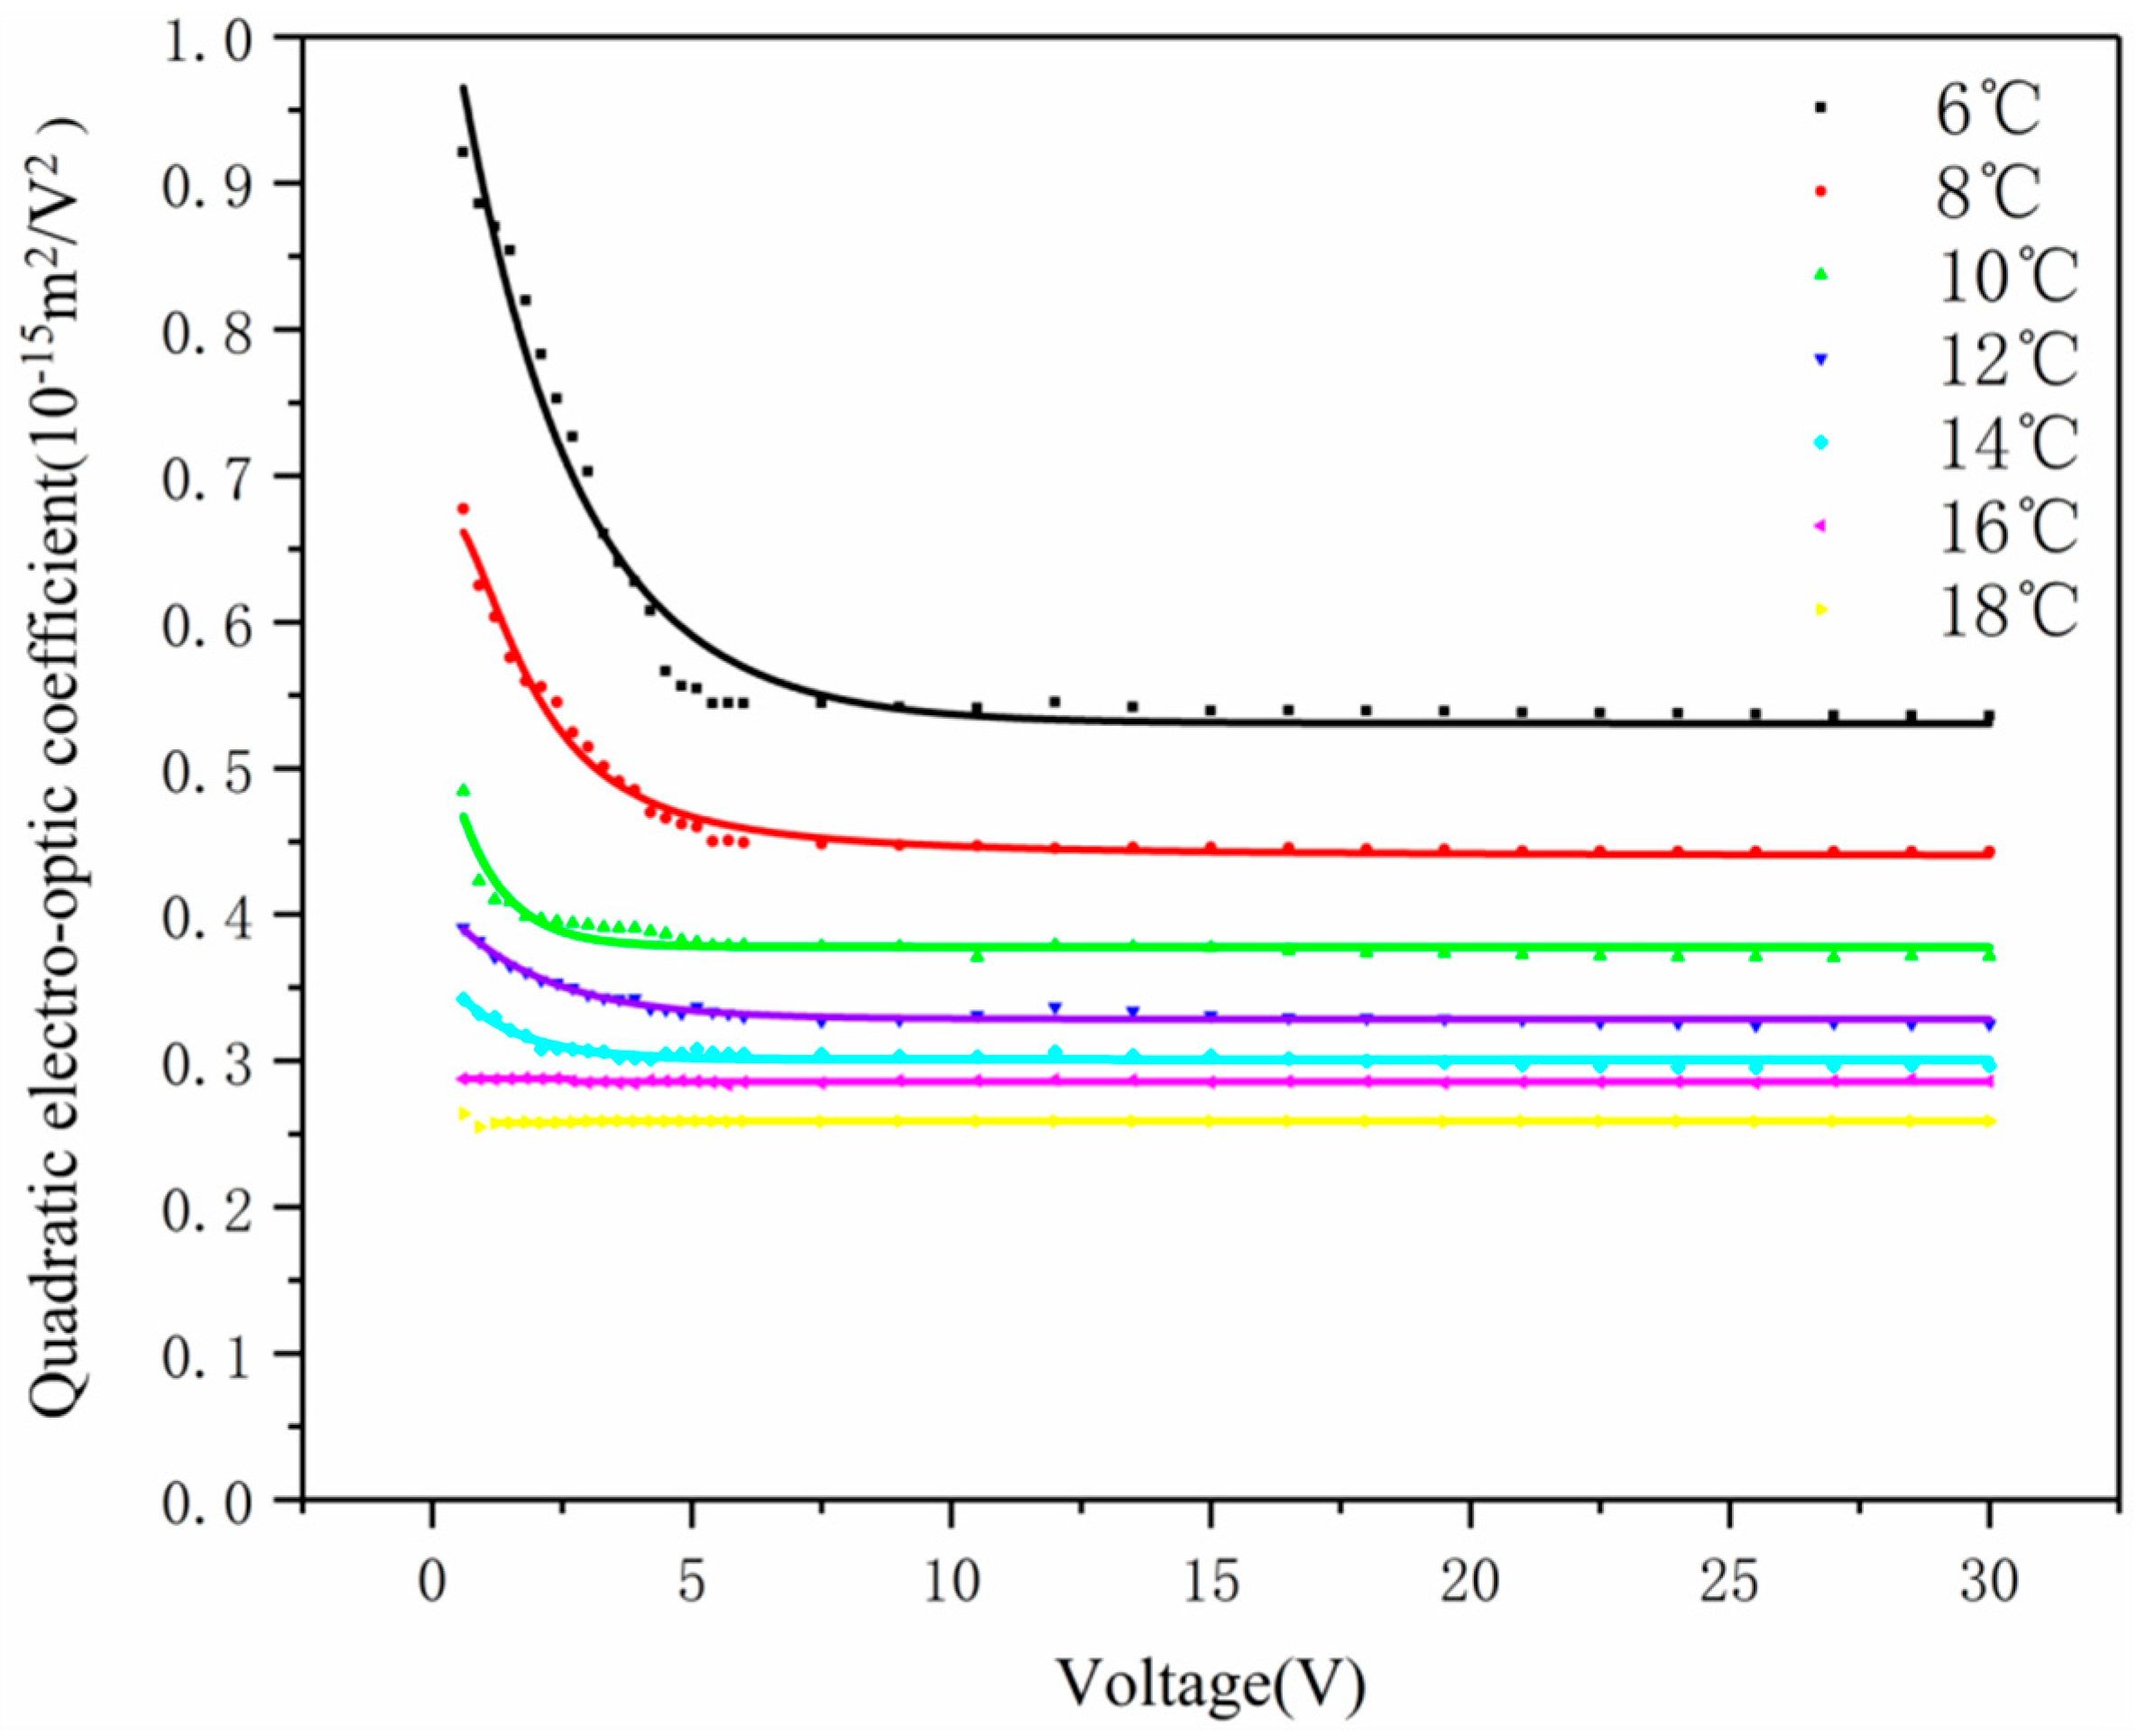
As mentioned earlier, the DC and AC superimposition method was used in the experiment. DC is used to control the operating point to
, and the amplitude of the AC voltage is variable under the condition of meeting the small-angle approximation. As shown in
Figure 7, we record the quadratic electro-optic coefficients under different AC voltages. We found that the quadratic electro-optic coefficient of the crystal will decrease rapidly and they tend to be stable with the increase of modulation voltage. The influence of AC voltage on
is more significant when the temperature is close to the crystal Phase transition point. We believe that the increased AC electric field suppresses the reorientation of PNRs which contributes the electro-optic effect. With the increment of the modulation voltage, the inhibition effect is saturated and the electro-optic effect tends to be stable.
We did not measure complete data in the range from 2 °C to 5 °C degrees Celsius, since we found that there is a linear electro-optical effect in this range. For a relaxor KTN crystal near the Curie temperature, the change of refractive index originates from intrinsic contribution (polarizable lattice) and extrinsic contribution (reorientation and vibration of PNRs). Therefore, the macroscopic polarization
is composed of
contributed by PNR and linear susceptibility
due to the paraelectric host, which can be expressed as [
17]
Following the quadratic electro-optic effect, the resulting refractive change is
where T
0 is the freezing temperature, u is the field unit vector,
is the density of clusters with dipole moment
,
is the Boltzmann’s constant the first term indicates the quadratic dependence on the electric field that can be neglected due to the small
contributed by the by paraelectric host, the second term of the above formula implies the linear relationship between the refractive index change and the electric field when
, and the third term suggests the quadratic dependence under the low electric field. Therefore, the increased electric field can induce the linear electro-optic effect.
As we know, there is a double frequency relationship between the applied AC voltage and the modulated light intensity when a quadratic electro-optic effect plays a role, so we can judge whether it is a linear electro-optic effect or a quadratic electro-optic effect by oscilloscope traces of the signal of modulation voltage and detector response. Under the low electric field, the optical signal indicates that the quadratic effect plays a leading role. With the increment of the electric field, linear and quadratic effects coexist. The electric field further increases, the linear effect is dominated.
The frequency of the AC voltage applied on the crystal chip is also a variable in the measurement procedure. As shown in
Figure 8, we have recorded the dependence of quadratic electro-optic coefficient with modulation frequency in the temperature range of 2 °C < T − T
c < 18 °C with the increase of electric field frequency, the quadratic electro-optic coefficient gradually decreases and finally tends to a stable value. This is due to the inevitable composition inhomogeneity of the KTN crystals, which makes it impossible for the size of the PNRs to be completely consistent. In an AC electric field, the dielectric permittivity will increase, which is attributed to the PNRs’ reorientation activated [
18]. The quadratic electro-optic effect is stronger at a low frequency. However, with the increase of the frequency of the electric field, the large-size PNRs can no longer be reoriented with the electric field. Therefore, its contribution to the quadratic electro-optic effect remains unchanged, resulting in the decrease of the quadratic electro-optic coefficient. This is more pronounced near the Curie temperature. In addition, PNRs are polar at the nanoscale and can behave as nanoresonators [
19]. When the crystal is close to the Curie temperature, a larger size PNR is often formed. The quadratic electro-optic effect is very strong, which is due to the stronger resonance phenomenon at low frequencies. However, as the frequency of the electric field increases, the resonance phenomenon weakens, and the quadratic electro-optic coefficient attenuates. The PNRs become smaller in size when the KTN crystals are far from the Curie temperature. Therefore, the resonance phenomenon is very weak at each frequency, and the quadratic electro-optic coefficient no longer attenuates even if the frequency increases.
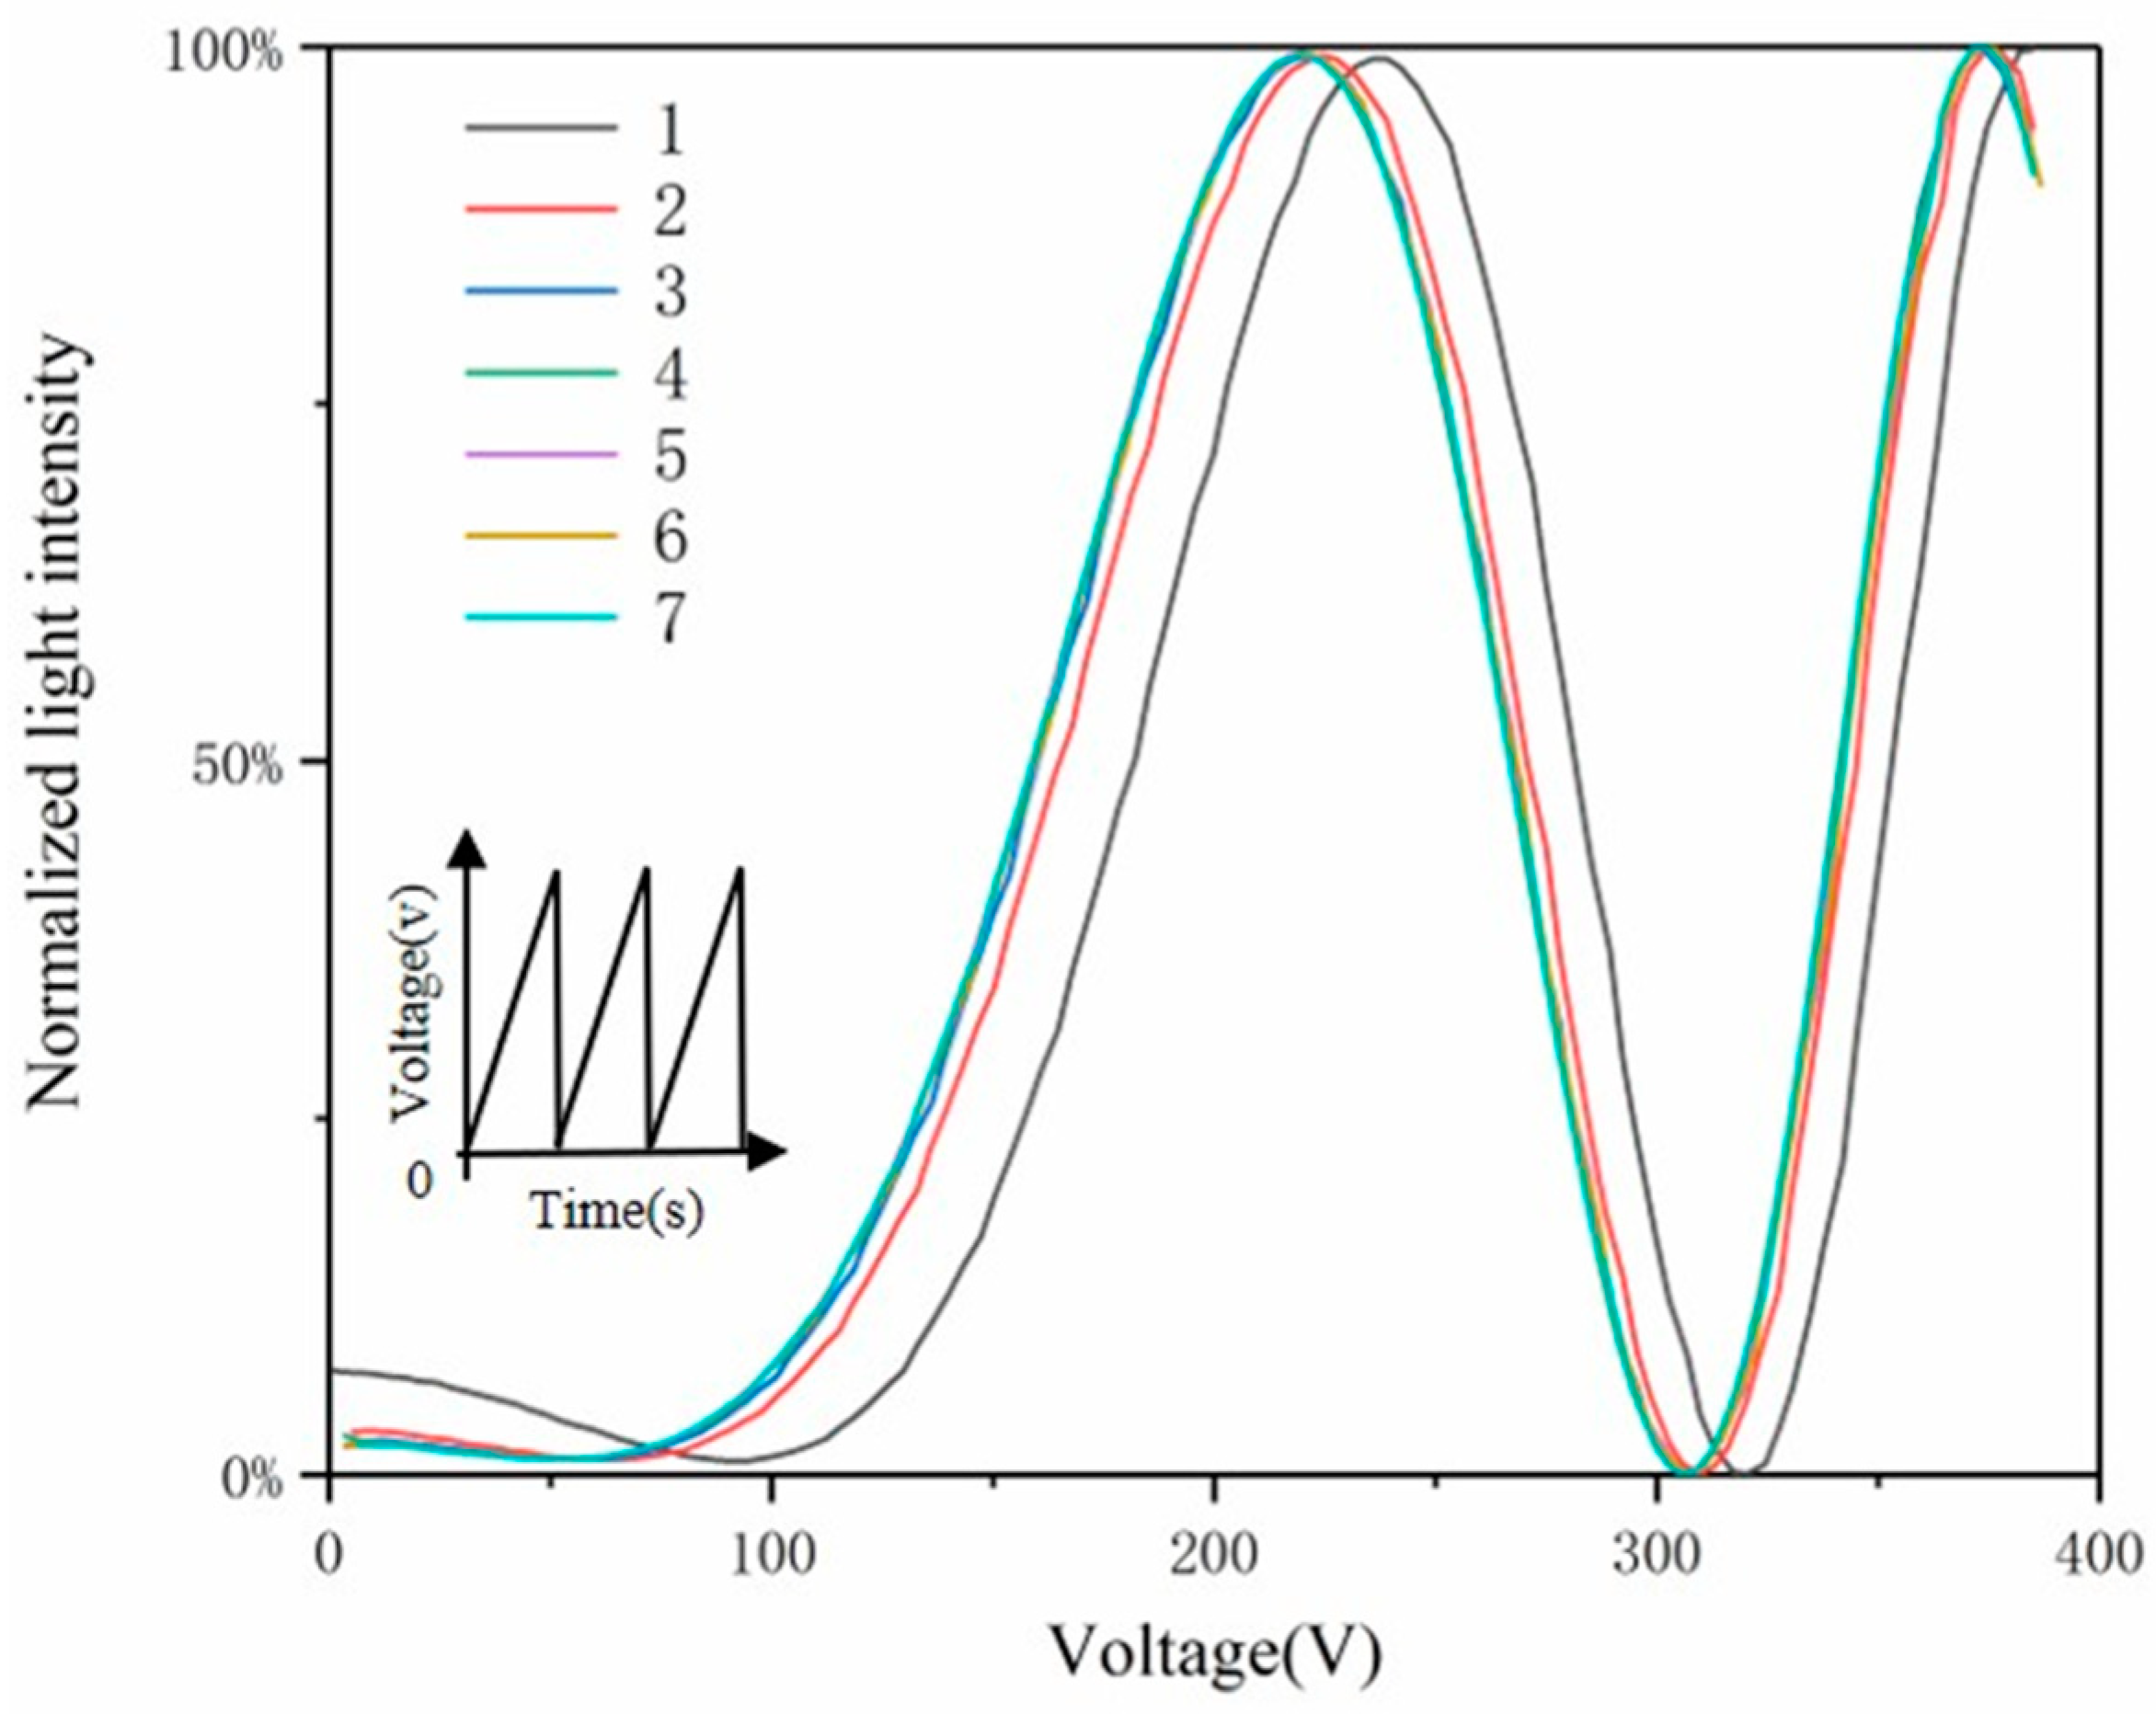
Through the previous experiments, it can be known that temperature, AC modulation voltage, and frequency have a great influence on the quadratic electro-optic coefficient, and it is more significant when it is close to the Curie temperature. In the previous experiment, we did not know whether the position of the operating point has changed, so we decided to test the stability of the operating point position. As shown in
Figure 9, we recorded multiple complete transmittance curve waveforms at T = 5 °C. We can see that the curves basically coincide after two or three voltage cycles, which indicates that the PNRs in the crystal reached an equilibrium state. When the inside of the crystal is polarized, the PNR also reaches an equilibrium state. The polarization characteristics in KTN crystals mainly come from the displacement of niobium ions [
20]. The microscopic local symmetry of KTN crystals is broken when voltage is applied to the crystal, and then the dipoles on the lattice scale appear. As the applied voltage increases, the random movement of polarization of dipoles in the crystal decreases, and they may group to form larger-sized PNRs [
20,
21]. This causes the refractive index of different areas inside the crystal to become different [
22]. Random scattering occurs when incident light enters, resulting in crystal depolarization and attenuation of the modulation depth. This polarization gradually saturates as the voltage continues to be applied. The modulation curve no longer changes, since the state of PNRs becomes stable. This also shows that the position of the operating point has not changed during the experiment.
The above problems will be encountered in practical applications, and we also need to notice them. The study of these influencing factors allows us to further understand the change law of the quadratic electro-optic coefficient of KTN crystal, which helps us to grow more homogeneity crystals and more accurately characterize the quadratic electro-optic coefficient of KTN crystals.


 ,
, 