Article

Time-Resolved Fluorescence Spectroscopy Study of Energy Transfer Dynamics in Phycobilisomes from Cyanobacteria Thermosynechococcus vulcanus NIES 2134 and Synechocystis sp. PCC 6803

1
State Key Laboratory of Optoelectronic Materials and Technologies, School of Physics, Sun Yat-Sen University, Guangzhou 510275, China
2
Institute of Advanced Science Facilities, Shenzhen 518107, China
3
Yantai Institute of Coastal Zone Research, Chinese Academy of Sciences, Yantai 264003, China
4
Center for Ocean Mega-Science, Chinese Academy of Sciences, Qingdao 266071, China
5
State Key Laboratory of Membrane Biology, Beijing Advanced Innovation Center for Structural Biology, School of Life Sciences, Tsinghua University, Beijing 100084, China
6
Institute of Marine and Environmental Technology, University of Maryland Center for Environmental Science, Baltimore, MD 21202, USA
*
Authors to whom correspondence should be addressed.
These authors contribute equally.
Crystals 2021, 11(10), 1233; https://doi.org/10.3390/cryst11101233
Submission received: 27 August 2021 / Revised: 27 September 2021 / Accepted: 12 October 2021 / Published: 13 October 2021

Abstract

:
As the largest light-harvesting complex in cyanobacteria, phycobilisomes (PBSs) show high efficiency and a high rate of energy transfer, owing to an elegant antenna-like assembly. To understand the structural influence on the dynamic process of the energy transfer in PBSs, two cyanobacterium species Thermosynechococcus vulcanus NIES 2134 (T. 2134) and Synechocystis sp. PCC 6803 (S. 6803) with different rod–core-linked assemblies were chosen for this study. The dynamic process of the energy transfer in both PBSs was investigated through time-resolved fluorescence spectroscopy (TRFS) with a time resolution of sub-picosecond. Via the fluorescence decay curves deconvolution, the pathways and related rates of the excitation energy transfer (EET) were determined. Three time components, i.e., 10, 80, and 1250 ps, were identified in the EET in the PBSs of T. 2134 and three, i.e., 9, 115, and 1680 ps, in the EET in the PBSs of S. 6803. In addition, a comparison of the dynamic process of the energy transfer between the two cyanobacteria revealed how the PBS assembly affects the energy transfer in PBSs. The findings will provide insight into future time-resolved crystallography.

1. Introduction

Cyanobacteria are the most ecologically important phototrophic bacteria on earth. They constitute a phylogenetically coherent group of morphologically and evolutionarily ancient diverse bacteria [1]. Cyanobacteria are characterized by their capability to photosynthesize. They synthesize PBSs as light-harvesting antennas composed of proteins that binding with various pigments. The PBSs exhibit extremely efficient light absorption and energy transfer properties [2]. Previous research has discovered the relationship between the intricate structural and functional organization of PBSs from cyanobacteria and their high energy transfer efficiency [3,4,5,6].
The geometry of a PBS molecule in cyanobacteria is an elegant antenna-like assembly, which is made up of phycobiliproteins (PBPs). A PBS molecule has a centrally located core composed of two to five allophycocyanin (APC), and in most cases surrounded by six to eight phycocyanin (PC) rods [7,8]. The mega architecture involves additional non-pigment-binding proteins called linker proteins (LP) [9], which are critical proteins for determining the directionality of excitation energy transfer [7]. The PBPs are assembled from subunits α, β. An α and β subunit combine into a monomer (αβ). A PC monomer involves three types of phycocyanobilin (PCB): α84, β84, and β155 [10,11,12], while an APC monomer involves only two types: β84 and α84 [13,14,15,16]. The monomers then assemble into trimers, hexamers, and further rods or cores, and finally form a complete PBS molecule.
Based on Förster resonance energy transfer (FRET) theory, researchers have proposed different mechanisms of excitation energy transfer (EET) between sub-complexes in cyanobacteria PBS. The chosen energy transfer pathways and energy transfer rate were determined by the relative distance between nearby chromophores and orientations of the dipole moments. Womick et al. showed a fast sub-picosecond EET component of 970 fs in the PC hexamer [17], Zhang et al. found a time component of 18 ps which described an EET pathway from a terminal PC trimer to the APC core [18]. Recently, Hirota et al. demonstrated the EET from the rod to the core and finally to the terminal emitter, taking place in a timescale from several ten picosecond seconds to nanoseconds within the PBS of Thermosynechococcus vulcanus by time-resolved fluorescence and pump-probe technique [19].
In most of the determined PC structures in cyanobacteria PBSs, the rod-like structures are hexamer–hexamer interactions. However, the thermophilic cyanobacterium T. 2134, consisting of three APC core cylinders surrounded by six PC rods, involves a special PC trimer (PC612) subunit that has been identified to date only in T. 2134 [20]. The special PC trimers locate at the terminal of the rods and fill the gap between the PC rods and the APC cores (Figure 1). Without forming (αβ)6 hexamers, the α subunit in the monomer of the special PC612 possesses a higher degree of flexibility. Moreover, the fact of PC612 isolation in conjunction with APC cores demonstrates the strong connection between the PC612 and the APC cores. As a result, the performance of energy transfer dynamics in T. 2134 PBS may alter due to the special PC trimer, especially the dynamics of the energy transfer between the PC rods and the APC cores. Although scientists have resolved the individual PBPs structures via crystallography [9,21,22], to the best of our knowledge, the T. 2134 PBS with complete structure has not been published. Thus, how the PBS assembly affects the energy transfer dynamics remains a mystery, and the structural foundations of energy transfer are still not well understood.
In this study, the PBS from T. 2134 with a special rod–core link structure was selected to investigate the structural induced energy transfer mechanism. Moreover, the PBS from S. 6803 with a similar PBS structure to that from T. 2134 was selected for comparison. The S. 6803 PBS is made up of three APC core cylinders surrounded by six PC rods, each consisting of three hexamers. The sequential energy flows in PBSs were provided by measuring both the steady-state and TRFS from T. 2134 and S. 6803 PBSs. The fluorescence decay curves at different emission wavelengths were deconvoluted for estimating the energy transfer components. In order to explore the structural basis of the energy transfer mechanism in a cyanobacteria PBS antenna, the differences between the energy transfer kinetics of the two cyanobacteria induced by the rod-core assembly were analyzed in detail.

2. Materials and Methods

2.1. Growth of Cyanobacteria and Isolation of PBSs

S. 6803 and T. 2134 were cultured at 22 °C constant low light illumination (40 w white tubes and light cycle 16 h, dark cycle 8 h) in BG11 medium. Contamination was inhibited by filtering the medium with 0.22 μm paper filters and the air supply with a cotton filter. PBSs from S. 6803 and T. 2134 were prepared according to the methods described in our previous studies [24] with modifications as follows: 0.75 mol·L-1 NaH2PO4-KH2PO4 buffer, PH 7.0 were added to cyanobacteria pellets, and then Phenylmethanesulfonyl fluoride (PMSF) were used as protease inhibitor on PBSs isolation. Shedding light is ensured for every step.

2.2. Detection of Steady-State and TRFS

A spectrophotometer (TU-1810, Persee) was used to record the absorption spectra, A spectrofluorometer (FL-4500, Hitachi) was used to measure the steady-state fluorescence spectra, and the radiation profile of a standard lamp was used to correct the spectral sensitivity of the fluorometer. The experiments were performed at room temperature (298 K).
A polychromator coupled synchroscan streak camera (C6860, Hamamatsu, Japan), with a time resolution of 700 fs, was used to measure the TRFS at 77 K, as shown in Figure 2. The PBSs samples were placed in a silica cuvette in the dark, frozen in liquid nitrogen. Glycerol was added to the PBSs samples as a cryoprotectant for 77 K spectral experiments. The pump source was a regenerative Ti:sapphire amplifier system (Legend Elite USP HE+, Coherent, Inc., Santa Clara, CA, USA), with output pulse laser at the wavelength of 570 nm, which brought about excitation of PBSs. The pulse duration is 35 fs and the pulse repetition rate is 1 kHz.

2.3. Analysis of the TRFS

With the temporal mode, we can obtain the fluorescence decay curves of PBSs. Then, we use a global optimization method to deconvolute the fluorescence decay curves [25]. The same lifetime parameters were used to analyze all the decay curves. The time resolution of fluorescence decay curves was approximately 2 ps after the deconvolution process. The FDAS was then provided by the amplitudes of the exponential components of the deconvoluted fluorescence decay curves as a function of emission wavelength [26].
The measured fluorescence was deconvolution after measurement by streak camera [27,28]. The measured fluorescence intensity F is described as:
F ( t ) = f N = f ( t ) N ( t t ) dt
where f is the pump laser pulse. The theoretical fluorescence intensity N was considered with the form of a sum of multi-exponential:
N ( t ) = ε i exp ( t / τ i )
On the basis of a global optimization algorithm, the deconvolution procedure was then applied to fit the isotropic fluorescence [26]. Here, τi represents the fluorescence isotropic decay constant, and A denotes the amplitude of τi:
I n ( λ , t ) = i = 1 n A i ( λ i ) exp ( t / τ i )

3. Results

3.1. Steady-State and Transient-State Spectroscopy Results

The steady-state results of the two cyanobacteria PBSs at room temperature were obtained and analyzed in detail, as shown in Figure 3. For the PBS from S. 6803, its absorption spectrum at room temperature exhibited a peak at 621 nm and with a shoulder at 573 nm, both of which were attributed to the absorption of PCB chromophores. In contrast, for the PBS from T. 2134, its PCB exhibited a peak at 621 nm and with a shoulder at 570 nm, which was slightly different from those of the PBS from S. 6803. Nevertheless, the absorption peaks of PC612 were not detected via absorption spectroscopy inspection of a complete PBS. The fluorescence spectra of the two cyanobacteria PBSs were obtained upon excitation at 570 nm. Specifically, the PBS from S. 6803 exhibited a fluorescence peak at 667 nm, while the peak of the T. 2134 PBS was at 661 nm. The integrity of cyanobacterial PBS is testified by Figure 3, that terminal emitter 667 nm is the main fluorescence emission peak of isolated PBSs.

3.2. Time-Resolved Spectroscopy Results

The steady-state fluorescence spectra combine the emissions from all fluorescence components, which cannot provide the energy transfer kinetics among them. Thus, the TRFS of the PBSs from the two cyanobacteria were measured at 77 K and analyzed in detail. At the temperature of 77 K, molecular vibration, environmental influence such as solvent effect could be neglected, resulting in the precise reflection of energy transfer. This allows large signal-to-noise ratios and makes sure that the TRFS results are close to the assumptions of theoretical models for EET [29].
Figure 4 describes the TFRS of the PBSs from S. 6803 and T. 2134 at 77 K as color gradations. The color profiles represent the fluorescence intensity recorded at various delay times after excitation. Such representation helps us to understand the energy flow in a more conceptual way. The spectral changes in both PBSs are featured by the relative intensity of fluorescence components. At 570 nm, the excitation wavelength for PCB chromophores, the TRFS of both PBSs showed an initial spike of the PC fluorescence band at 640–660 nm, followed by the APC emission band around 680 nm. The APC band rose as PC emission decayed. Moreover, compared with the PBS of S. 6803, the PC and APC bands of the T. 2134 PBS showed less overlap, which means less chromophore fluorescence leaking during the energy transfer process between the rod and the core. The result may indicate that the energy transfer process between the rod and the core is modulated by PC612, which has strong interactions with the APC core. The changes of the relative fluorescence components intensities reflect the EET from PC to APC in both PBSs.
Changes in the fluorescence spectra could be observed much more clearly in Figure 5. The synchroscan technology was used and the time-resolved fluorescence was obtained. The PC band emissions at 640–660 nm were detected in the frequency domain of the spectra of both PBSs. For the PBS from S. 6803, the PC emission band was the dominating band. Its peak was located at around 660 nm initially and then slowly exhibited a redshift. In contrast, the APC emission band around 680 nm rose gradually, growing higher than the PC band after 120 ps. Next, the APC emission took precedence, and the PC band gradually decreased and finally disappeared after 600 ps, suggesting that the rods converted all the absorbed solar energy to the core. For the PBS from T. 2134, its PC emission was also the dominating emission at the beginning. Then, the APC band rose as the PC emission decayed. The intensity of PC emission became relatively low after 280 ps and disappeared after 500 ps, indicating that the EET process from rod to core in the PBS from T. 2134 is faster than that in the PBS from S. 6803.

4. Discussion

The deconvolution of time-resolved fluorescence decays curves was conducted to determine the fluorescence decay constants of the PBSs, adopting the Monte Carlo method for the experimental data process. The fluorescence intensity decay curves at the emission wavelength of 640, 650, 660, 670, 680, and 690 nm were selected for multi-exponential deconvolution. The fitting results of both PBSs were shown in Figure S1 (see Supplementary Materials). Here, the fluorescence intensity decay curves at the emission wavelengths of 660, 670, and 690 nm were selected for comparison, as shown in Figure 6.
Table 1 and Table 2 list the three time components τ and correspondent amplitudes A at different emission wavelengths. The fluorescence decay of the PBS from S. 6803 was found to fit the three exponentials of 9, 115, and 1680 ps well, and the fluorescence decay of the PBS from T. 2134 fitted the three exponentials of 10, 80, and 1250 ps well. The two short time constants describe the time constant of the EET process, while the longest one time-constants can be determined as the terminal fluorescent emission lifetime. The negative amplitudes suggest their corresponding components are the energy acceptors engaged in the uprising stage of fluorescence; otherwise, the components are energy donors engaged in the downturn stage of fluorescence.
Based on the deconvolution results, FDAS were obtained to reveal the dynamics of the energy transfer process in PBSs. In the FDAS, the positive factors indicate the kinetic fall of the excited populations, while the negative factors indicate the kinetic rise of the excited populations. The positive and negative bands coupling in the FDAS is a clear demonstration of the energy transfer from the positive-band pigments to the negative-band ones. Figure 7 shows the FDAS of the PBSs both from S. 6803 and T. 2134, and the decay constants are identical to the exponentials calculated by deconvolution for both PBSs.
For the PBS from S. 6803, the time component of 9 ps reflects the EET in the PC rod. Because at the blue side, the amplitude of FDAS is positive with a maximum around 650 nm, while at the red side with no negative value (Figure 7a). Recently, Hirota et al. also identified an EET pathway with a time of 7.3 ps in the PC rod [19]. The time component of 115 ps could be assigned to the time of EET from the PC rod to the APC core. Because at the blue side, the amplitude of the FDAS was positive with a maximum around 670 nm, then quickly turned negative at the red side with the minimum around 680 nm. Based on the fluorescence spectra of the S. 6803 PBSs, it is reasonable to assign a time component of 115 ps to the time of EET between the PC rod and APC core. Similarly, Holzwarth et al. [30] found an EET pathway from a PC rod to APC within 80–120 ps, depending on the rod length. The time component of 1680 ps reflects the fluorescence lifetime of the terminal emitter.
For the PBS from T. 2134, the time component of 10 ps was due to the transfer time of the pathways from PC612 to the APC core. Because at the blue side, the amplitude of the FDAS is positive with a maximum around 650 nm, while at the red side, the amplitude turns to be negative with a minimum around 680 nm (Figure 7b). According to the fluorescence spectra of PC612 (Figure S2), it is reasonable to assign the time component of 10 ps to the time of EET from PC612 and APC. Next, the time component of 80 ps could be assigned to the time of EET from the PC rod to the APC core. Because at the red side, the amplitude of the FDAS is positive with a maximum around 660 nm, then turns to be negative at 690 nm. The energy transfer time of 80 ps between the rod and the core is faster than that in the PBS from S. 6803. We believe that the special PC612 trimer, with strong conjunction to the APC core, speeds up the energy transfer rate between the rod and the core. The time component of 1250 ps reflects the fluorescence lifetime of the terminal emitter.
According to the results, a fast energy transfer rate of 10ps from the special PC612 trimer to the APC core was identified in the PBS of T. 2134. This unambiguously shows that the function of energy transfer is affected by the structure and assembly of the PBS. Compared to the PBS of S. 6803 with a similar structure, the strong connection between the PC612 trimer and the APC core within the PBS of T. 2134 build a new energy transfer pathway that enables a faster energy transfer from the rod to the core.

5. Conclusions

We investigated the dynamic process of EET among PBPs in the PBSs from two cyanobacteria species by using femtosecond FRTS and deconvolution method, giving the energy transfer pathways and the energy transfer time constants. The results indicate that differences in the rod–core assemblies can significantly affect the rod–core energy transfer dynamics in PBSs. Furthermore, the strong conjunction between PC612 trimers and the APC core leads to the fast energy transfer dynamics from the former to the latter. Moreover, the special PC612 trimer serves as a bridge to accelerate the energy transfer from the PC rods to the APC cores, which enables faster energy transfer from the rods to the cores. Furthermore, the energy transfer dynamics in the core are also altered by the trimer, ensuring that more energy is converted faster to PSII with less APC fluorescence emissions. The results of energy transfer dynamics from time-resolved PBSs spectroscopy will provide insight into future time-resolved crystallography.

Supplementary Materials

The following is available online at https://www.mdpi.com/article/10.3390/cryst11101233/s1. Figure S1: 77 K fluorescence intensity decay curves and fitting results of PBSs from S. 6803 and T. 2134. Figure S2: 77 K fluorescence emission spectrum of the PBS from T. 2134.

Author Contributions

Project supervision, S.Q. and F.Z.; preparation of samples, W.L., Z.Z. and J.M., steady-state microscopy data collection and analysis, W.L. and M.X.; time-resolved spectroscopy measurement, M.X. and C.X.; analysis of spectroscopy results, M.X., W.L. and H.L.; writing—original draft preparation, M.X. and W.L.; writing—review and editing, F.Z. and S.Q.; funding acquisition, F.Z., M.X. and S.Q. All authors have read and agreed to the published version of the manuscript.

Funding

This research was funded by the National Natural Science Foundation of China (grant nos. 11274397, 41176144, 41376139, and 41906109), the Government of Guangdong Province for the NST (grant no. 2016B090918099).

Institutional Review Board Statement

Not applicable.

Informed Consent Statement

Not applicable.

Data Availability Statement

Experimental data are available upon reasonable request to the authors.

Acknowledgments

The authors thank X. Wang for discussion.

Conflicts of Interest

The authors declare no conflict of interest.

References

  1. Garcia-Pichel, F. Cyanobacteria. Encyclopedia of Microbiology, 3rd ed.; Moselio, S., Ed.; Academic Press: San Diego, CA, USA, 2009; pp. 107–124. [Google Scholar]
  2. Glazer, A.N. Light harvesting by phycobilisomes. Annu. Rev. Biophys. Biophys. Chem. 1985, 14, 47–77. [Google Scholar] [CrossRef]
  3. Liu, L.; Chen, X.; Zhang, Y.; Zhou, B. Characterization, structure and function of linker polypeptides in phycobilisomes of cyanobacteria and red algae: An overview. Biochim. Biophys. Acta 2005, 1708, 133–142. [Google Scholar] [CrossRef] [Green Version]
  4. Tian, L.; Gwezdala, M.; van Stokkum, I.H.M.; Koehorst, R.B.M.; Kirilovsky, D.; van Amerongen, H. Picosecond kinetics of light harvesting and photoprotective quenching in wild-type and mutant phycobilisomes isolated from the cyanobacterium synechocystis PCC 6803. Biophys. J. 2012, 102, 1692–1700. [Google Scholar] [CrossRef] [PubMed] [Green Version]
  5. Falamas, A.; Porav, S.A.; Tosa, V. Investigations of the energy transfer in the phycobilisome antenna of arthrospira platensis using femtosecond spectroscopy. Appl. Sci. 2020, 10, 4045. [Google Scholar] [CrossRef]
  6. Kolodny, Y.; Zer, H.; Propper, M.; Yochelis, S.; Paltiel, Y.; Keren, N. Marine cyanobacteria tune energy transfer efficiency in their light-harvesting antennae by modifying pigment coupling. FEBS. J. 2021, 288, 980–994. [Google Scholar] [CrossRef] [PubMed]
  7. Adir, N. Elucidation of the molecular structures of components of the phycobilisome: Reconstructing a giant. Photosynth. Res. 2005, 85, 15–32. [Google Scholar] [CrossRef] [PubMed]
  8. Gantt, E. Phycobilisomes. Annu. Rev. Plant Physiol. 1981, 32, 327–347. [Google Scholar] [CrossRef]
  9. David, L.; Marx, A.; Adir, N. High-resolution crystal structures of trimeric and rod phycocyanin. J. Mol. Biol. 2011, 405, 201–213. [Google Scholar] [CrossRef]
  10. Schirmer, T.; Bode, W.; Huber, R.; Sidler, W.; Zuber, H. X-ray crystallographic structure of the light-harvesting biliprotein c-phycocyanin from the thermophilic cyanobacterium mastigocladus laminosus and its resemblance to globin structures. J. Mol. Biol. 1985, 184, 257–277. [Google Scholar] [CrossRef]
  11. Berns, D.S.; MacColl, R. Phycocyanin in Physical Chemical Studies. Chem. Rev. 1989, 89, 807–825. [Google Scholar] [CrossRef]
  12. Adir, N.; Dobrovetsky, Y.; Lerner, N. Structure of c-phycocyanin from the thermophilic cyanobacterium synechococcus vulcanus at 2.5 Å: Structural implications for thermal stability in phycobilisome sssembly. J. Mol. Biol. 2001, 313, 71–81. [Google Scholar] [CrossRef] [Green Version]
  13. Brejc, K.; Ficner, R.; Huber, R.; Steinbacher, S. Isolation, crystallization, crystal structure analysis and refinement of allophycocyanin from the cyanobacterium spirulina platensis at 2.3 Å resolution. J. Mol. Biol. 1995, 249, 424–440. [Google Scholar] [CrossRef] [PubMed]
  14. Ying, L.; Xie, X. Fluorescence spectroscopy, exciton dynamics, and photochemistry of single allophycocyanin trimers. J. Phys. Chem. B 1998, 102, 10399–10409. [Google Scholar] [CrossRef]
  15. McGregor, A.; Klartag, M.; David, L.; Adir, N. Allophycocyanin trimer stability and functionality are primarily due to polar enhanced hydrophobicity of the phycocyanobilin binding pocket. J. Mol. Biol. 2008, 384, 406–421. [Google Scholar] [CrossRef] [PubMed]
  16. Wang, Q.; Moerner, W.E. Dissecting pigment architecture of individual photosynthetic antenna complexes in solution. Proc. Natl. Acad. Sci. USA 2015, 112, 13880–13885. [Google Scholar] [CrossRef] [Green Version]
  17. Womick, J.M.; Moran, A.M. Exciton coherence and energy transport in the light-harvesting dimers of allophycocyanin. J. Phys. Chem. B 2009, 113, 15747–15959. [Google Scholar] [CrossRef]
  18. Zhang, J.; Zhao, J.; Jiang, L.; Zheng, X.; Zhao, F.; Wang, H. Studies on the energy transfer among the rod-core complex from phycobilisome of Anabaena variabilis by time resolved fluorescence emission and anisotropy spectra. Biochim. Biophys. Acta Bioener. 1997, 1320, 285–296. [Google Scholar] [CrossRef] [Green Version]
  19. Hirota, Y.; Serikawa, H.; Kawakami, K.; Ueno, M.; Kamiya, N.; Kosumi, D. Ultrafast energy transfer dynamics of phycobilisome from Thermosynechococcus vulcanus, as revealed by ps fluorescence and fs pump-probe spectroscopies. Photosynth. Res. 2021, 148, 181–190. [Google Scholar] [CrossRef]
  20. Adir, N.; Lerner, N. The crystal structure of a novel unmethylated form of c-phycocyanin, a possible connector between cores and rods in phycobilisomes. J. Biol. Chem. 2003, 278, 25926–25932. [Google Scholar] [CrossRef] [Green Version]
  21. Marx, A.; Adir, N. Allophycocyanin and phycocyanin crystal structures reveal facets of phycobilisome assembly. Biochim. Biophys. Acta Bioener. 2013, 1827, 311–318. [Google Scholar] [CrossRef] [Green Version]
  22. David, L.; Prado, M.; Arteni, A.; Elmlund, D.; Blankenship, R.; Adir, N. Structural studies show energy transfer within stabilized phycobilisomes independent of the mode of rod-core assembly. Biochim. Biophys. Acta 2014, 1837, 385–395. [Google Scholar] [CrossRef] [PubMed] [Green Version]
  23. Adir, N.; Dines, M.; Klartag, M.; McGregor, A.; Melamed-Frank, M. Assembly and Disassembly of Phycobilisomes. In Complex Intracellular Structures in Prokaryotes. Microbiology Monographs, 1st ed.; Shively, J.M., Ed.; Springer: Berlin/Heidelberg, Germany, 2006; Volume 2, pp. 47–77. [Google Scholar]
  24. Ma, J.; You, X.; Sun, S.; Wang, X.; Qin, S.; Sui, S. Structural basis of energy transfer in Porphyridium purpureum phycobilisome. Nature 2020, 579, 146–151. [Google Scholar] [CrossRef] [PubMed]
  25. Wang, H.; Zhao, J.; Jiang, L. Energy transfer processes in phycobilisome model complex at 77 K. China Ser. B-Chem. 2000, 43, 233–239. [Google Scholar] [CrossRef]
  26. Zhao, F.; Zheng, X.; Zhang, J.; Wang, H.; Yu, Z.; Zhao, J.; Jiang, L. Energy transfer in allophycocyanin hexamer from Anabaena variabilis by time-resolved spectroscopy. J. Photochem. Photobiol. B 1998, 45, 144–149. [Google Scholar] [CrossRef]
  27. Sandstrom, A.; Gillbro, T.; Sandstrom, U.; Fischer, R.; Scheer, H. Picosecond study of energy transfer within 18-S particles of AN 112 (a mutant of Synechococcus 6301) phycobilisomes. Biochim. Biophys. Acta Bioener. 1988, 933, 54–64. [Google Scholar] [CrossRef]
  28. Zhang, J.; Zhao, F.; Zheng, X.; Wang, H. Direct measurement of excitation transfer dynamics between two trimers in C-phycocyanin hexamer from cyanobacterium Anabaena variabilis. Chem. Phys. Lett. 1999, 304, 357–364. [Google Scholar] [CrossRef]
  29. Zhao, F.; Zhang, J.; Zheng, X.; Wang, H. Energy transfer among proteins in the phycobilisome of red algae. II. Energy transfer in synthesized complex of R-PE/R-PC and R-PE/APC. Zhongshan Da Xue Xue Bao. Zi Ran Ke Xue Ban Acta Sci. Nat. Univ. Sunyatseni 1998, 37, 18–23. [Google Scholar]
  30. Holzwarth, A.R.; Wendler, J.; Suter, G.W. Studies on chromophore coupling in isolated phycobiliproteins: II. Picosecond energy transfer kinetics and time-resolved fluorescence spectra of C-phycocyanin from synechococcus 6301 as a function of the aggregation state. Biophys. J. 1987, 51, 1–12. [Google Scholar] [CrossRef] [Green Version]
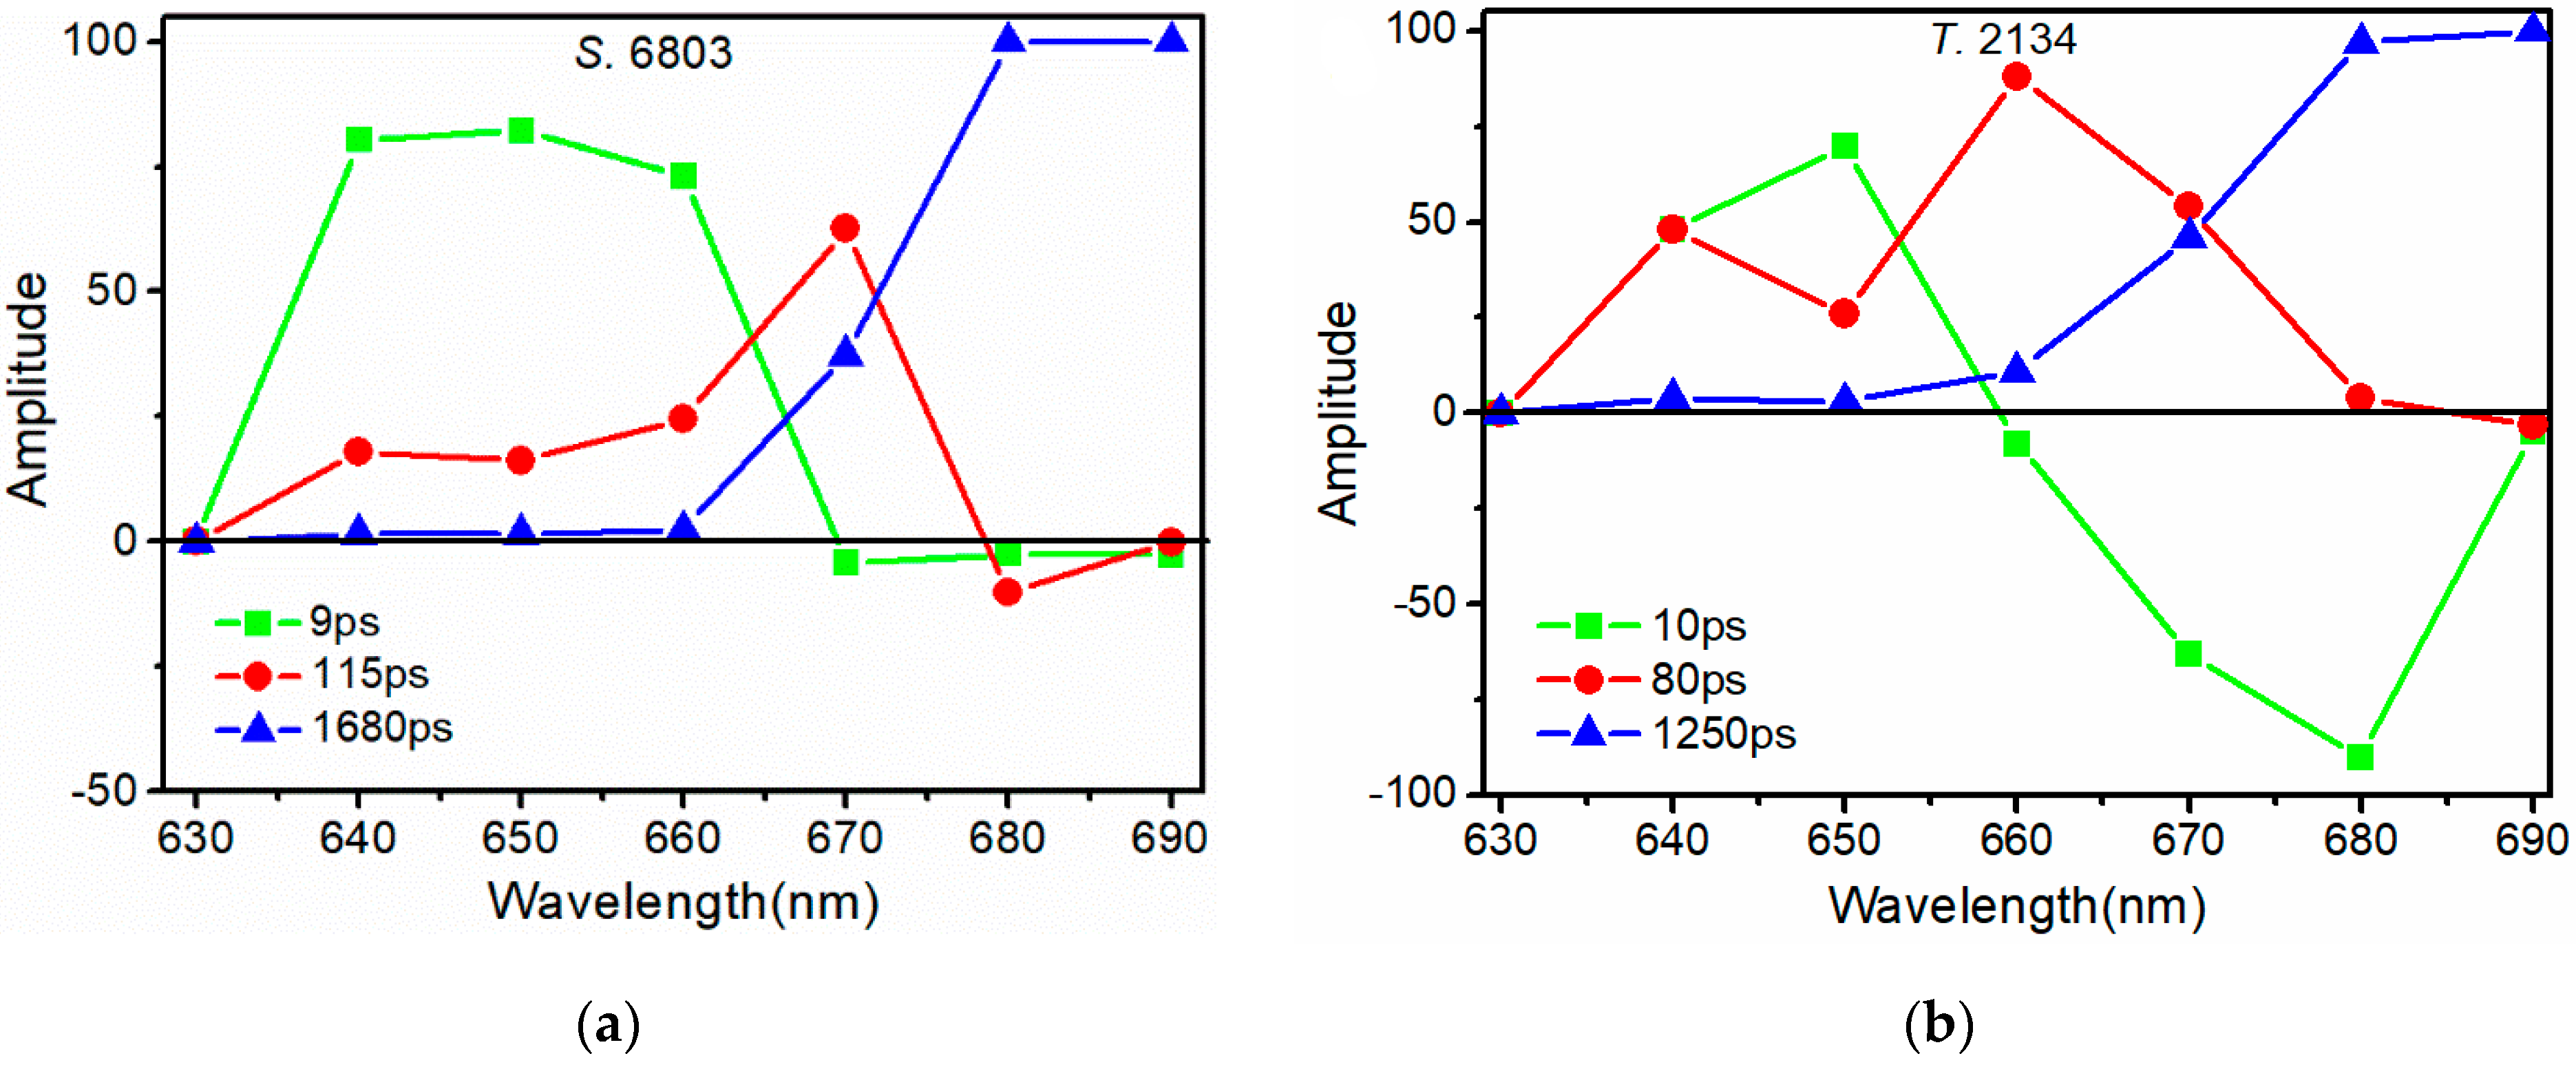
Figure 1. Architecture diagram of the rod–core assembly of PBSs from T. 2134 [23].
Crystals 11 01233 g001
Figure 2. Experimental setup for time-resolved spectra measurement. 1: fs Amplifier system; 2,3,5: mirror; 4: beam splitter; 6: OPA; 7: aperture; 8: attenuator; 9,12,13: lens; 10: cuvette; 11: cryostat; 14: streak camera.
Crystals 11 01233 g002
Figure 3. Absorption and fluorescence spectra of PBSs from S. 6803 and T. 2134 at room temperature.
Crystals 11 01233 g003
Figure 4. Time-resolved fluorescence spectra of the PBSs from (a) S. 6803 and (b) T. 2134 at 77 K. Excitation was set at 570 nm.
Crystals 11 01233 g004
Figure 5. Evolution of the time-resolved fluorescence spectra of (a) S. 6803 and (b) T. 2134 at 77 K. The spectra were obtained at the time of 40, 80, 120, 160, 200, 280, 500, and 600 ps, respectively, after excitation. Excitation was set at 570 nm.
Crystals 11 01233 g005
Figure 6. Fluorescence intensity decay curves and fitting results of PBSs from two PBSs at 77 K. The detection wavelength was set at 660, 670, 690 nm. Excitation was set at 570 nm. Triangles represent the experimental data of S. 6803, squares represent the experimental data of T. 2134, and colored lines represent the fitting results (labeled as S 660 with green line, S 670 with blue line, S 690 with violet line, T 660 with pink line, T 670 with red line, T 690 with orange line, respectively).
Crystals 11 01233 g006
Figure 7. Fluorescence decay-associated spectra of the PBSs from (a) S. 6803 and (b) T. 2134.
Crystals 11 01233 g007
Table 1. Deconvolution results for S. 6803. Excitation was set at 570 nm.
Eem/nmτ1/psA1/%τ2/psA2/%τ3/psA3/%
6401280931816922
65011821271615402
6609731502516132
6708−412062129137
6809−1116−101869100
6908−388−12088100
Average9 115 1680
Table 2. Deconvolution results for T. 2134. Excitation was set at 570 nm.
Eem/nmτ1/psA1/%τ2/psA2/%τ3/psA3/%
6401448764810994
65010701012611233
6609−8638892911
67011−6310454121846
68010−90764174497
6908−566−31369100
Average10 80 1250
Publisher’s Note: MDPI stays neutral with regard to jurisdictional claims in published maps and institutional affiliations.

