1. Introduction
Cholesteric liquid crystals (CLC) are a class of organic small molecules that self-organize into a one-dimensional photonic material with a helicoidal superstructure. These structured optical materials exhibit a circularly polarized selective reflection, [
1,
2] with the center of the reflection notch in CLCs expressed as λ
0 = n
avg × P
0, where n
avg = (n
o + n
e)/2 is the average refractive index of the liquid crystal (LC). The P
0 is the pitch, and the n
o and n
e are the ordinary and extraordinary refractive indices, respectively. The bandwidth of the reflection band in a CLC is a simple product of the birefringence of the nematic liquid crystal host and the cholesteric pitch length, Δλ = Δn × P
0, where Δn = n
e − n
o is the birefringence. The bandwidth of a CLC is typically in the range of 50–100 nm in the visible wavelength of the electromagnetic spectrum.
It is well known that CLCs with positive dielectric anisotropy (Δε > 0) pass through the metastable focal-conic state upon relaxation from the field-induced homeotropic state to the planar cholesteric state [
3,
4,
5]. This relaxation process is relatively slow and, in many cases, polymer stabilization is used to improve the relaxation kinetics [
6,
7,
8]. Conversely, CLCs with negative dielectric anisotropy (Δε < 0) do not experience a field induced rotation in the planar state upon application of a DC bias. Over the past several years, we have extensively studied the dynamic electro-optic response of polymer-stabilized cholesteric liquid crystals (PSCLCs) with negative dielectric anisotropy, including bandwidth broadening [
9,
10,
11], red shifting tuning [
12,
13,
14], and blue shifting tuning [
15] of the CLC reflection band. As shown in
Figure 1a, an unreacted CLC mixture (LC with Δε < 0, photoinitiator, chiral dopants, and LCM) in the planar state shows no EO response when a DC field is applied prior to polymer stabilization. However, after the CLC mixture is photopolymerized, the polymer stabilizing networks (5–10 wt%) impart varying, dynamic EO responses that are dependent on the processing conditions (e.g., UV intensity, cure time) and material formulations (e.g., photoinitiator, LCM).
Figure 1b,c demonstrates how the EO response of PSCLCs formulations can be drastically altered by simple changes in preparation. By systematically varying processing conditions, we proposed a potential mechanism for the dynamic EO response of PSCLCs with Δε < 0, which is based on the DC field-induced deformation of the polymer network in the CLC medium [
11,
13,
16,
17,
18].
The concentration of ions trapped in the polymer network has a considerable influence on the deformation behavior of the polymer network. In liquid crystals or liquid crystal mixtures, concentrations of ionic species can range of 10
9–10
14 ions cm
−3 originating from impurities (initiators, catalysts, salts, moisture) generated during the synthesis and purification processes [
19]. Further increase in the ion density can be associated with the UV curing process, which can degrade liquid crystals [
20,
21,
22,
23] and alignment layers [
24]. The movement of ions trapped in the polymer network leads to the physical deformation of the polymer network, and the anchored low-molecular-weight CLC molecules deform accordingly, observed directly with fluorescence confocal microscopy [
11,
13].
Figure 1d illustrates the mechanism for the EO response of PSCLCs. Upon application of a DC field, the polymer network deforms towards the negative electrode. Since the number of pitches must remain constant, this deformation induces pitch expansion near the positive electrode and pitch contraction near the negative electrode. The mechanism is described in detail reference [
18]. The degree of deformation of the polymer stabilizing network in the CLC medium at various DC voltages is affected by the viscoelastic properties of the polymer network [
13,
25] and the type and concentration of ions trapped in the polymer network [
15,
19].
In this work, we isolate the contribution of ionic impurities originating from liquid crystalline monomer (LCM) on the EO response of PSCLCs prepared without photoinitiators. Polymer networks are successfully formed by direct photoinitiation of the LCM in the CLC mixture by exposure to UV light. The contribution of ionic impurities associated with LCMs are isolated by subjecting these materials to additional purification. Purified LCMs have a lower ion density than as-received LCMs, whereas LCMs obtained from the residual solution have a high ion density. The PSCLC prepared from purified LCM with low ion density shows bandwidth broadening, whereas the PSCLC prepared from the residual LCM with high ion density exhibits red tuning of the reflection band. This indicates that the ion concentration in the LCM controls the type and the extent of the EO responses of PSCLCs. The chirality of the LCM also affects the EO response. PSCLCs prepared from chiral LCMs show a larger EO response than PSCLCs prepared from achiral LCMs, despite having similar ion concentrations. This study helps to further clarify the mechanism for the dynamic EO response of PSCLCs.
2. Materials and Methods
Preparation of cells and PSCLC samples. Alignment cells were prepared using indium tin oxide (ITO) coated glass slides (Colorado Concepts). The glass substrates were cleaned in acetone and methanol and then treated with air plasma for several minutes. The substrate was spin-coated with a polyimide solution and baked on the hot plate at 200 °C for 30 min. The polyimide alignment layer was rubbed with a cloth and the cell was constructed to ensure planar alignment conditions. The cell gap was controlled by mixing a 15 μm thickness glass rod spacer into an optical adhesive (Norland Optical Adhesive 65, NOA) which was exposed to a UV lamp for several minutes. The thickness of the cells was measured using an optical method based on the interference pattern of reflected light by the glass substrates in each empty cell [
26]. Liquid crystal mixtures were prepared by mixing two right-handed chiral dopants (R1011 and R811, Merck, Kenilworth, NJ, USA), 6 wt% a liquid crystal monomer (a right-handed chiral LC monomer (SL04151, AlphaMicron, Inc., Cleveland/Akron, OH, USA) or achiral monomer (C3M or C6M, Merck)), and Δε < 0 nematic LC MLC-2079 (Merck) with T
NI = 102 °C, Δε = 6.1, and Δn = 0.15 at λ = 589 nm. Chemical structures of the molecules are shown in
Figure S1. The pitch length (and thus reflection band position) of the CLC is adjusted by the concentration of the chiral dopants and is monitored using an Ocean Optic spectrometer. The polymer stabilizing network was formed by photopolymerization with 100~200 mW cm
−2 of 365 nm light (OmniCure LX500 LED Spot UV Curing System) for 5–30 min.
Experimental Setup and Measurements. Transmission spectra were collected with a fiber optic spectrometer (Ocean Optics). Unpolarized or right-handed circularly polarized light (RH CPL) was used as the probe beam. Transmission spectra were collected before, during, and after the application of DC fields and the DC voltage increased either progressively at the scanning rate of 1 V s−1 or directly in a single step. The ion density of the mixtures was measured using a commercial instrument from LC Vision in 4 μm thickness homeotropic alignment cells (LC Vision, LLC). For the ion density experiment, the sample was subjected to a 1 Vp bias at a frequency of 3 Hz. There is no switching response of the liquid crystals with Δε < 0 because the applied alternating voltage (1 Vp) is below the threshold voltage. The ion density values are the average of five measurements. The ion density is calculated from current measurements with the triangle method (Software). Optical and polarized optical microscopy was used to characterize the morphology of PSCLCs. Real-time FTIR (RTIR) measurements were performed using a Nicolet iS50 FTIR (Thermo Scientific). The LC mixture was placed between KBr plates. Acrylate conversion was measured as the decrease in the peak areas from 985 to 980 cm−1 and 1638 to 1633 cm−1. Series scans were taken at one scan per second.
3. Results and Discussion
We have previously reported on the initiator-less polymerization of LCMs to form both thin film liquid crystalline networks (LCNs) and PSCLCs [
27]. Upon exposure to UV light, radicals were generated in the LCM melts or LC mixtures and confirmed by electron paramagnetic resonance (EPR) measurement. The conversion of the acrylate groups of the liquid crystal monomer was monitored using in situ FTIR measurements, and LCNs prepared with or without a photoinitiator exhibited similar mechanical properties. The PSCLCs prepared without a photoinitiator show a bandwidth broadening response when increasing the DC field. A potential mechanism for the initiator-less photopolymerization is through type II Norrish mechanism [
28]. Liquid crystals can aggregate through π−π and head−tail interactions between mesogens. The self-assembled stacked structure induces red-shifted absorption (bathochromic) through J-type aggregation, which shows different stacking offset angles due to transverse slippages between mesogens [
29,
30]. Thus, highly aggregated liquid crystal mesogens through π−π interaction in high concentration mixtures or pure LC melt can absorb longer wavelengths of light compared to when the materials are in solution.
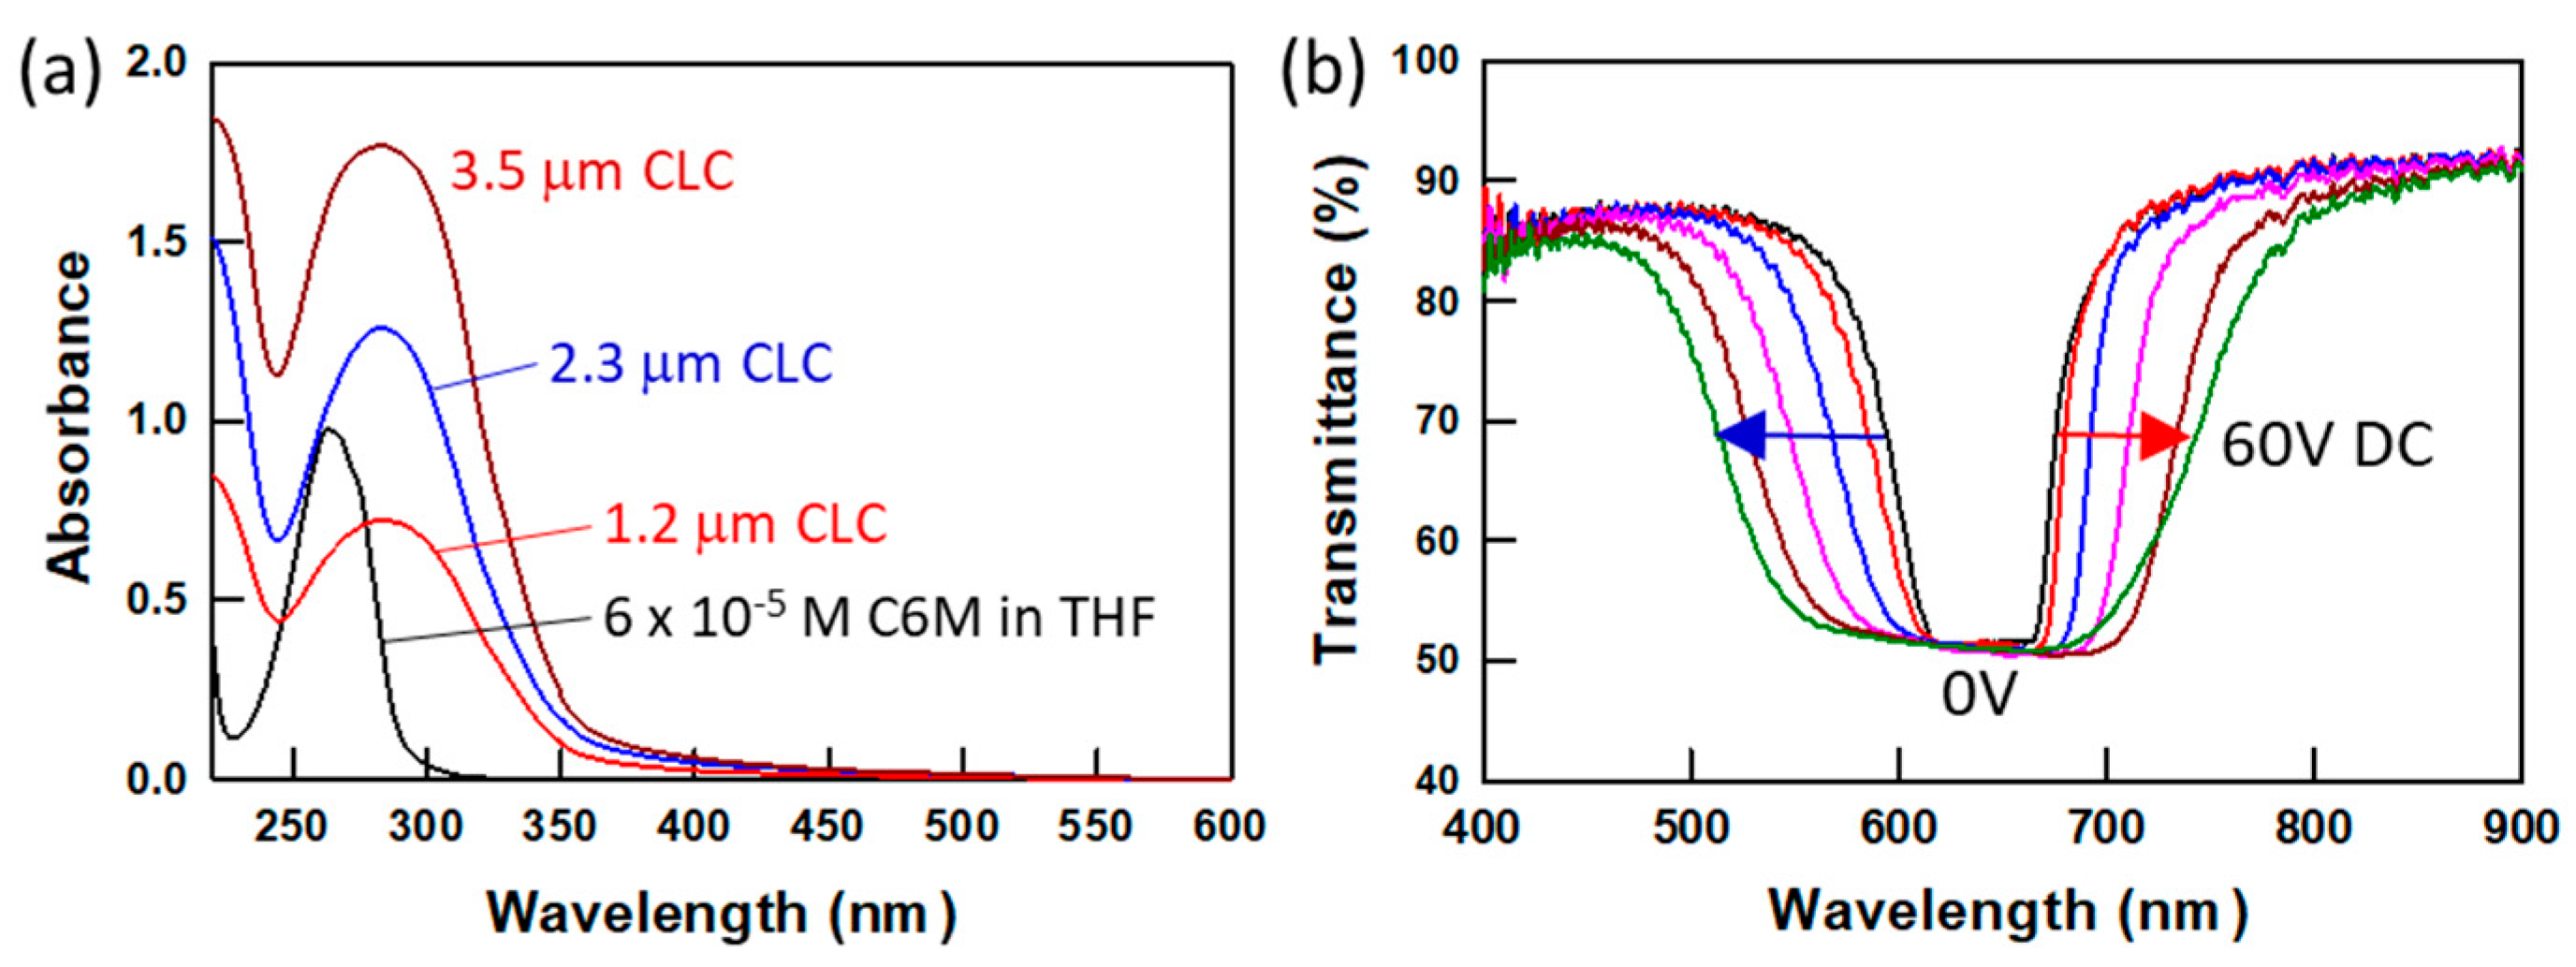
Figure 2 shows the absorption spectra of the liquid crystal monomer C6M in tetrahydrofuran (THF) and CLC mixture with various thicknesses. The 6 × 10
−5 M C6M solution in THF has an absorption peak centered around 265 nm, while the CLC mixture has a relatively broad absorption peak at around 290 nm and weak absorption at longer wavelengths (>400 nm). The conjugated LC aggregates can be excited by absorbing UV light with a wavelength of 365 nm, and the excited aggregates can abstract the hydrogen in the proton-donating molecules (acrylate group) [
31]. The radicals from the proton-donating molecules are generated by the hydrogen abstraction process, a type II initiation. The generated radicals can attack the acrylate groups in LC monomers and start polymerization without photoinitiators. The 15 μm-thick PSCLC sample prepared from the CLC mixture containing 5 wt% as-received C6M, 5 wt% R1011, 5 wt% R811 and 85 wt% MLC-2079 by irradiation with UV light for 10 min shows roughly threefold increase in bandwidth as the DC voltage increases to 60 V DC, as shown in
Figure 2b.
The EPR study in
Figure S2 demonstrates the radical generation of the C6M solutions in THF at various concentrations of 5–70 wt% when exposed to UV light [
27]. All solutions were deoxygenated by purging with nitrogen gas for one hour. No radical species were observed in the solutions before UV exposure, and the appearance of a radical signal upon illumination was dependent on the monomer concentration. In the most diluted solution (5 wt% C6M), no radical species were observed before or after UV irradiation, indicating that Type II initiation does not occur due to the absence of monomer aggregation. An EPR signal appears at 30 wt% C6M, and the intensity of the EPR signal increases as the monomer concentration increases. The radicals generated directly from the LCMs can react with acrylate groups to cause radical propagation and polymerization.
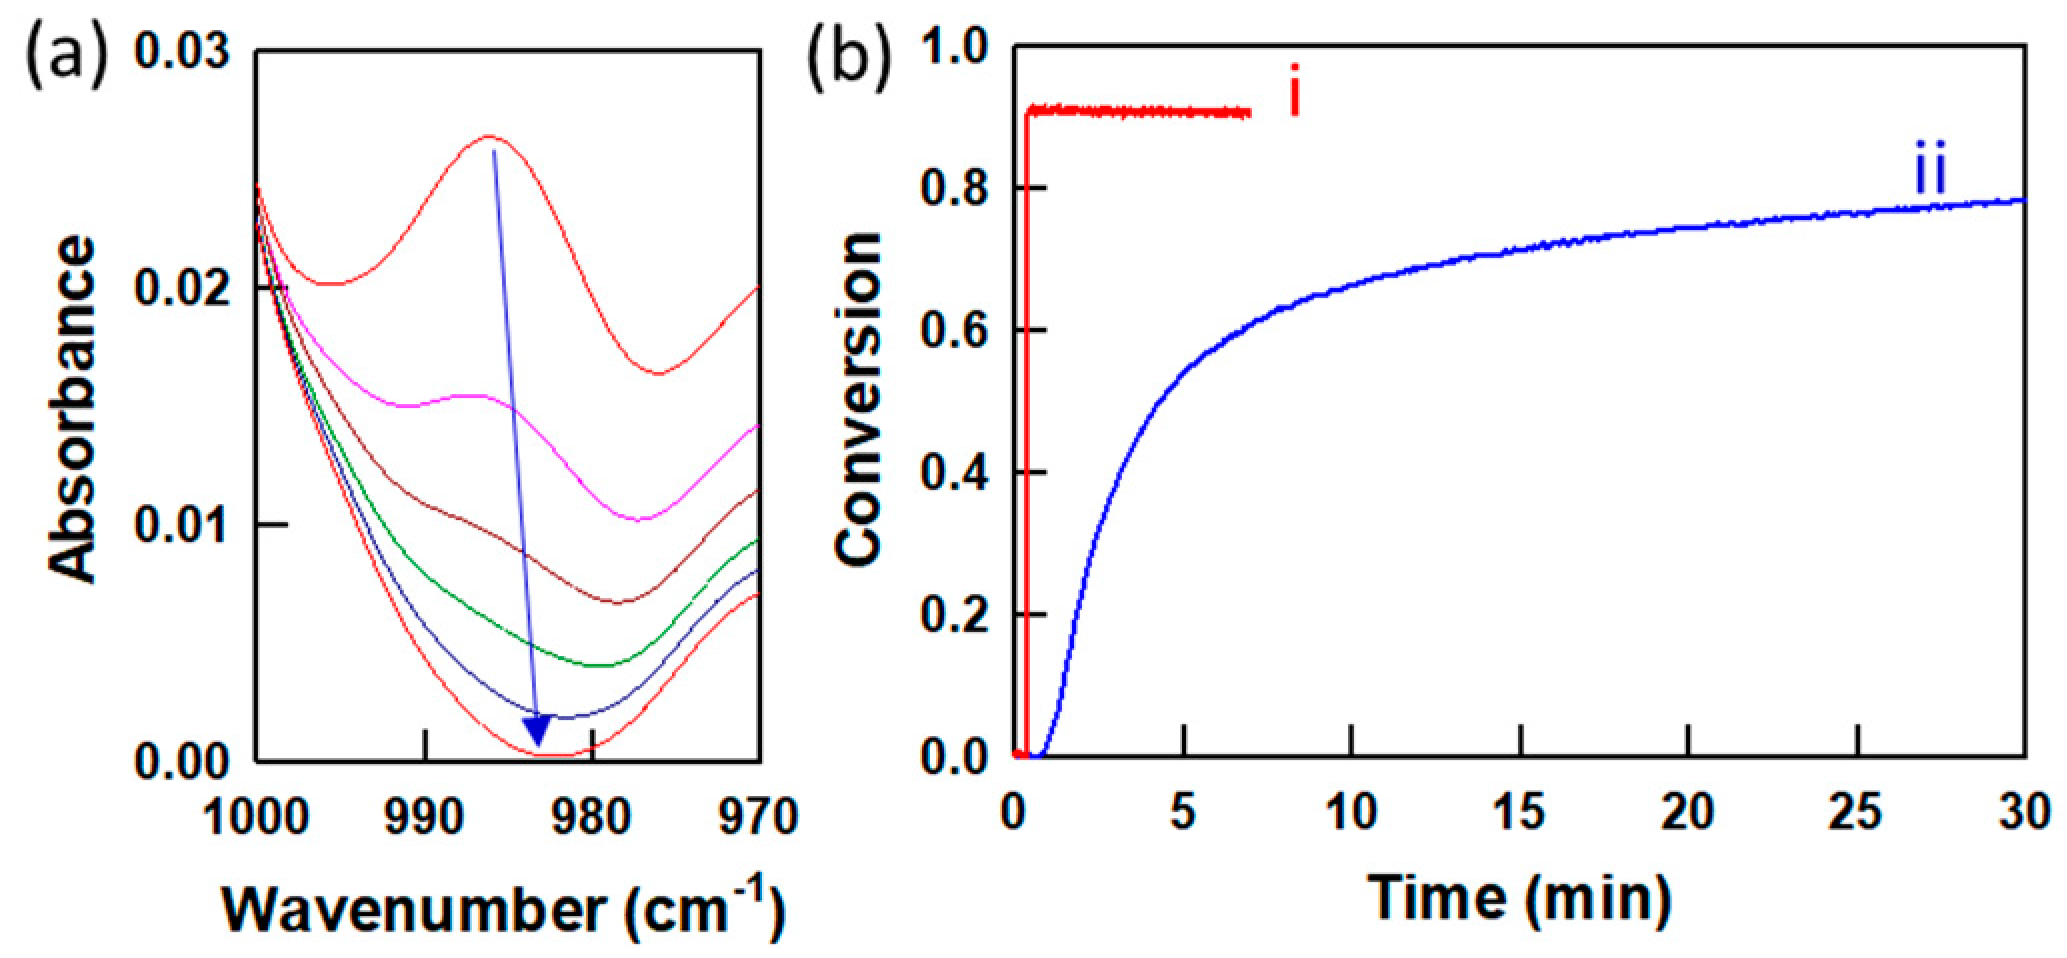
The conversion of C6M acrylate group in the mixture during UV exposure was monitored using real-time FTIR.
Figure 3 shows the conversion of the acrylate group of C6M in two LC mixtures containing 10 wt% C6M, 5 wt% R1011 and E7 mixed with or without 1 wt% Irgacure 369. The peak at 980 cm
−1 corresponds to the carbon−carbon double bond in the acrylate moiety, and the conversion of acrylate functional groups is measured by the decrease in peak area with time. When exposed to 200 mW cm
−2 UV light, the mixture with 1 wt% photoinitiator shows a fast conversion of the acrylate groups, and an almost complete conversion of the acrylate groups in the LC mixture occurs within 10 s (
Figure 3b(i)). However, the LC mixture without photoinitiator shows a much slower conversion of the acrylate groups, and only about 80% conversion is observed after 30 min exposure to 200 mW cm
−2 UV light (
Figure 3b(ii)). This slow conversion can occur through a slow Type II initiation process compared to a Type I initiation.
The dynamic EO response occurs due to the deformation of the polymer stabilizing network when applying a DC field. The deformation of the polymer network is affected by two factors: the viscoelastic properties of the polymer network and the concentration of ions trapped in the polymer network. Thus, the EO response can be manipulated by varying the alkyl spacer length of the LCM and by the concentration of ions trapped in the polymer network [
32]. All PSCLCs used for this study were prepared from CLC mixtures without photoinitiator, were irradiated with high intensity UV light (100–200 mW cm
−2) for 30 min, and have similar crosslink density (~80% conversion of LCM). Our initial report on initiator-less polymerization of LCM to prepare PSCLCs employed a six-carbon spacer between the mesogenic core and the acrylate. Herein, we utilize and LCM with a shorter, three-carbon spacer mesogen (C3M). The ion concentration of the C3M monomer was varied by recrystallizing the material from methanol. The C3M monomer was dissolved in boiling methanol, slowly cooled down to room temperature, and the resulting crystals were filtered and dried under vacuum (see inset in
Figure 4). The remaining supernatant was subsequently evaporated and dried under vacuum. We refer to this product as residual C3M. Recrystallized and residual C3M monomers were white and pale yellow color, respectively. Purified and residual C3M was characterized using
1H NMR and no noticeable difference was observed between the two C3M monomers (
Figure S3). The ion densities of mixtures containing C3M and the nematic LC (MLC-2079) were measured with 1 V
peak AC applied at 3 Hz (so called “transient current method”) and then calculated using the triangle method [
27,
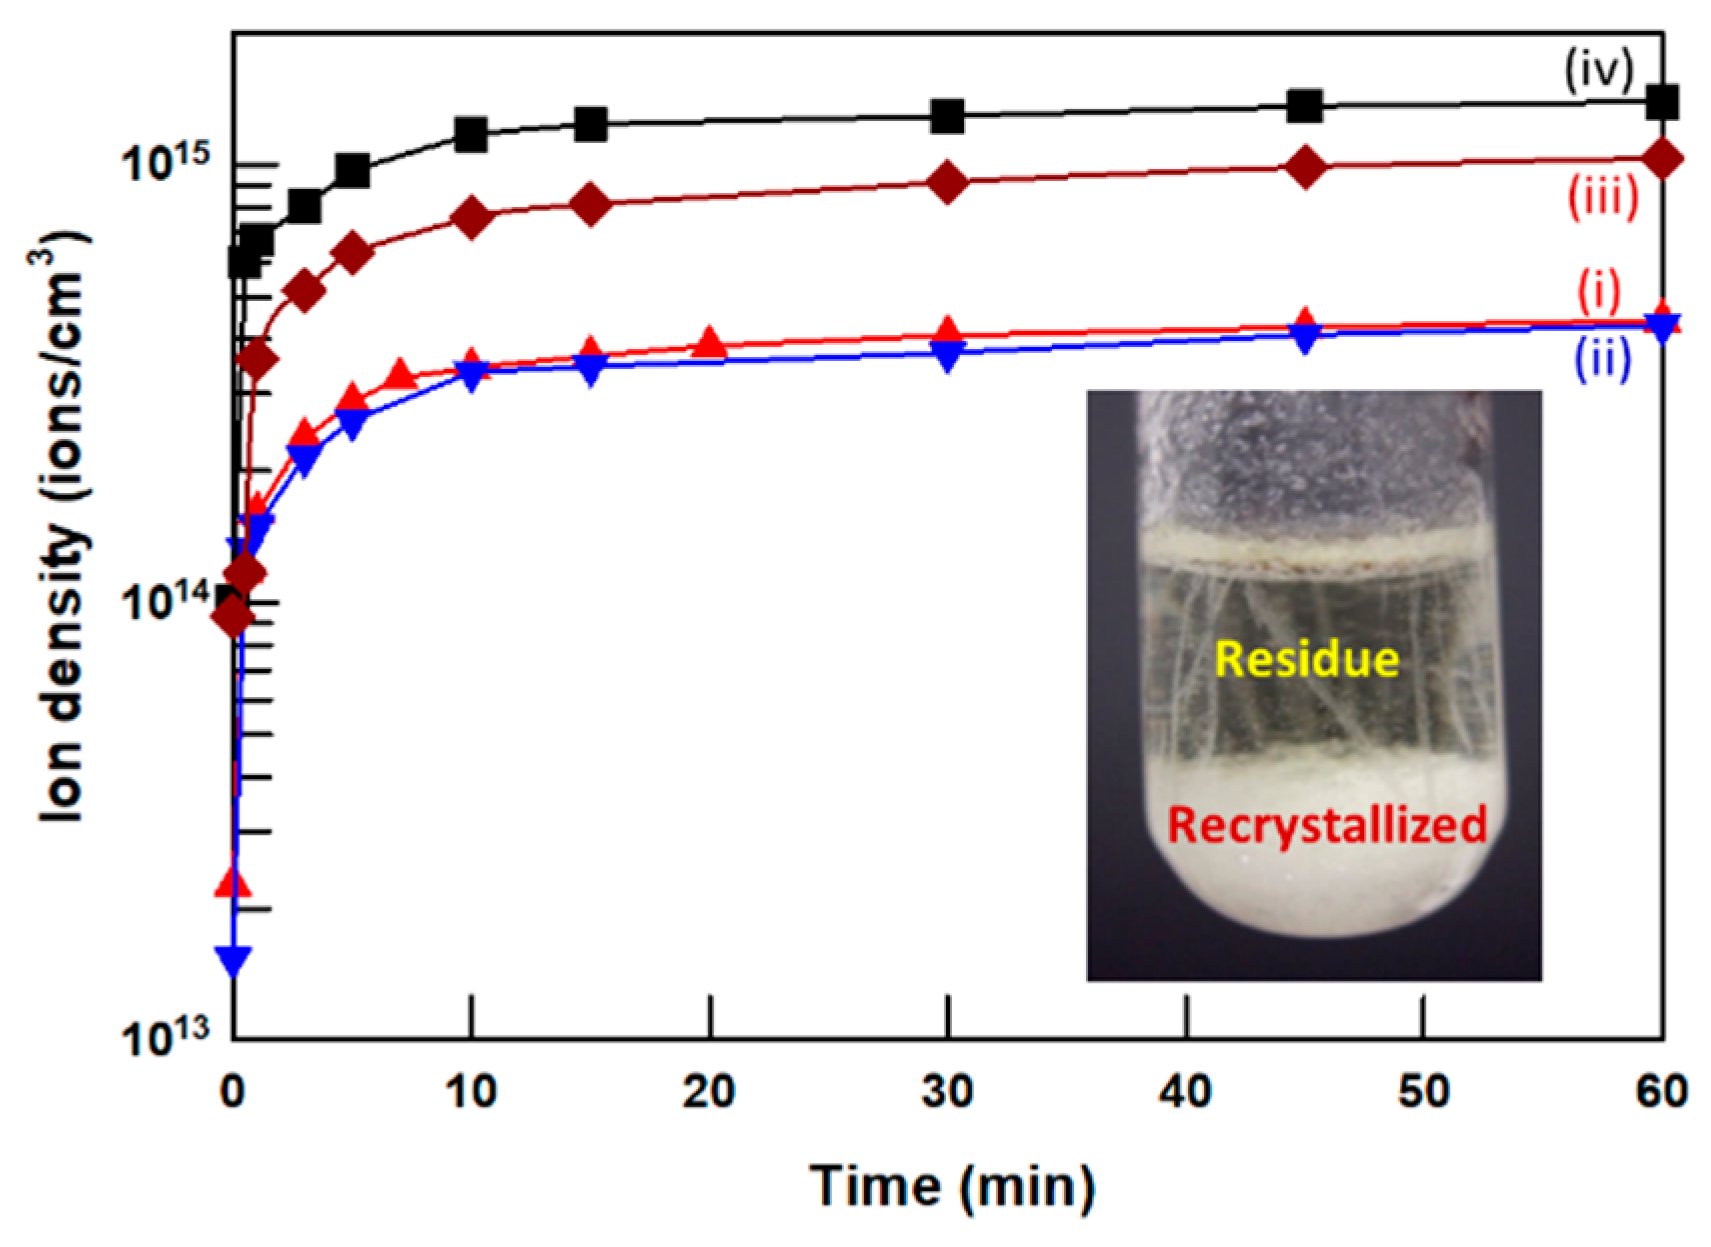
33]. The ion density values of these mixtures and MLC-2079 were monitored during 60 min exposures to 365 nm wavelength UV light, as shown in
Figure 4 and summarized in
Table S1. The initial average ion density of liquid crystal MLC-2079 is 2.3 × 10
13 ions cm
−3, which increases immediately upon exposure to UV light and reaches 4.4 × 10
14 ions cm
−3 after exposure. The photoinduced changes in ion density have been reported previously and are possibly due to the photoionization of associated ions [
22,
23,
24,
25,
26,
27,
28,
29,
30,
31,
32,
33,
34]. The two LC mixtures of 10 wt% purified or residual C3M and 90 wt% MLC-2079 show very different ion densities. Expectedly, the residual C3M and MLC-2079 mixture has a much higher ion density than the purified C3M and MLC-2079 mixture. The purified C3M and MLC-2079 mixture shows almost identical ion density as MLC-2079 before and during 60 min UV exposure. For reference, the 1 wt% Irgacure 369 and 99 wt% MLC-2079 mixture shows a significant increase in ion concentration before and after 60 min of UV exposure, as shown in
Figure 4(iv) and
Table S1. [
15,
19].
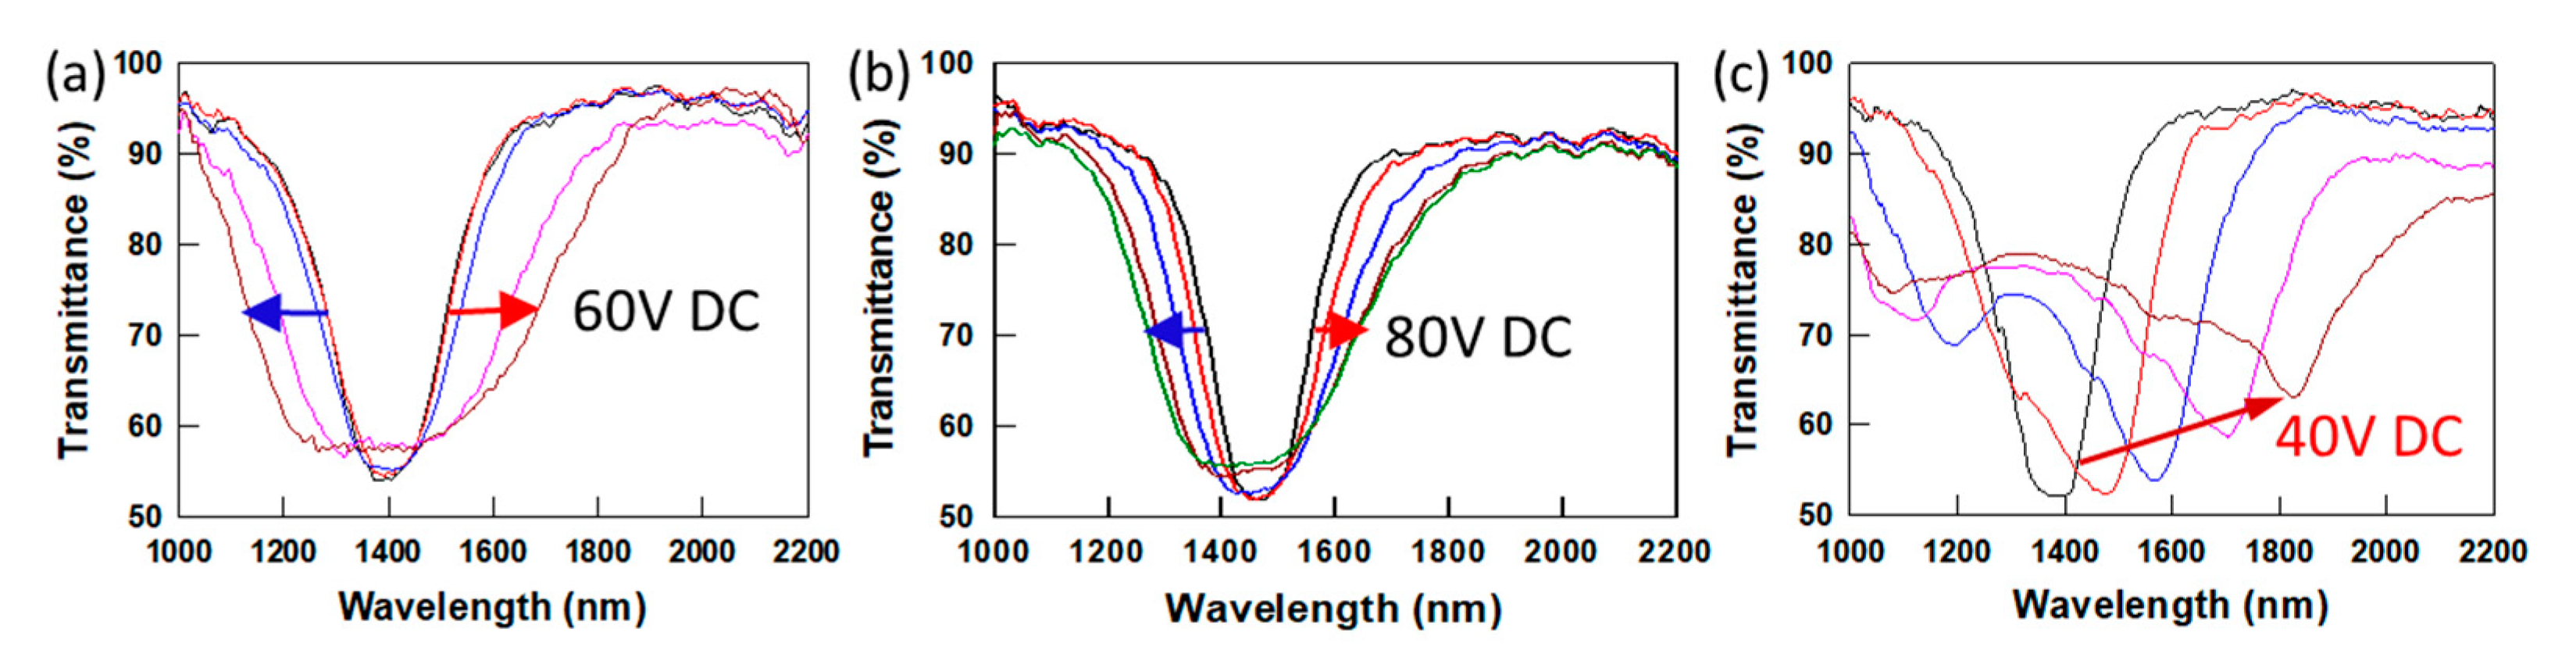
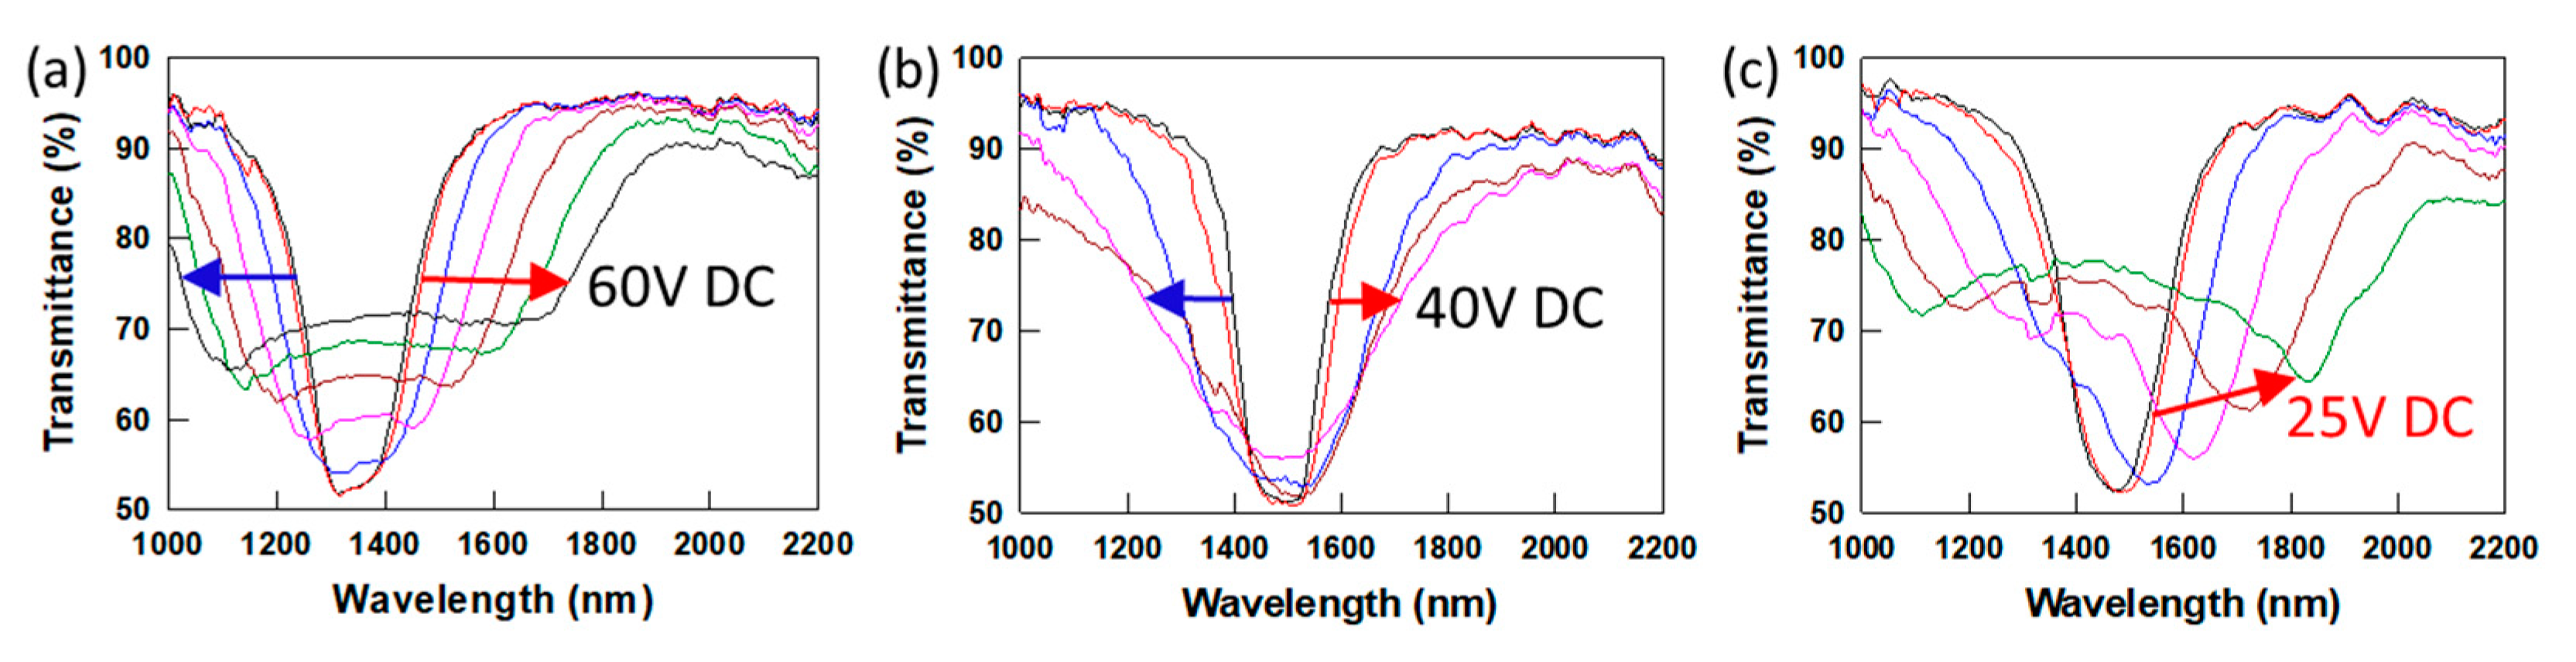
Figure 5 shows the EO response of three separate PSCLCs prepared from CLC mixtures with 6 wt% C3M monomers (as-received, purified, and residual C3M monomers), 3.5 wt% R1011 and 90.5 wt% MLC-2079 exposed. Samples were flipped every 5 min to avoid heat build-up in the sample during UV curing. The acrylate conversion of the recrystallized C3M/MLC-2079 and residual C3M/MLC-2079 mixtures were similar (as observed by FTIR,
Figure S4), which indicates the concentration of ions in the CLC mixture does not interfere with polymerization. Even though the three PSCLC systems have similar conversion and thus, crosslink density; the dynamic EO responses of these material systems are highly differentiated. PSCLC samples prepared with the as-received C3M monomer have an initial ion density of 7.6 × 10
13 ions cm
−3 and display a bandwidth increase of 3.5~4 times upon application of 60 V DC (
Figure 5a) [
27]. The PSCLC prepared with purified C3M (small ion density of 1.6 × 10
13 ions cm
−3) exhibits small bandwidth broadening (≤2 times increase in bandwidth) even at higher DC voltage (80 V DC) (
Figure 5b). Different magnitudes of bandwidth broadening responses are observed between the PSCLCs prepared with as-received C3M and purified C3M. Interestingly, the PSCLC prepared with residual C3M monomer shows a high ion density of 9.3 × 10
13 ions cm
−3, and as the DC voltage increases to 40 V DC, a red shift of the reflection band is observed from 1380 nm to 1840 nm (460 nm tuning) (
Figure 5c). When exposed to UV light, the C3M diacrylate monomer can form a polymer network, and the ions in the monomers can be trapped in the polymer network. The ion concentration in the C3M monomer, which forms the polymer networks, affects the type and magnitude of the dynamic EO responses of PSCLCs. As shown in
Figure 1d, the deformed polymer network induced by DC field application modulates the pitch across the cell gap. For the bandwidth broadening samples, the pitch deforms linearly [
11], while nonlinear pitch deformation is reported for the red tuning samples across the cell gap [
13].
Two recrystallized and residual C6M monomers with an alkyl chain length longer than C3M are also prepared through recrystallization of the as-received C6M. PSCLC samples prepared using as-received C6M, recrystallized C6M and residual C6M show 7.8 × 10
13 ions cm
−3, 2.6 × 10
13 ions cm
−3 (low ion concentration) and 1.1 × 10
14 ions cm
−3 (high ion concentration), respectively. The CLC mixture contains 6% residual or recrystallized C6M, 3.5% R1011 and MLC-2079. The dynamic EO response of these PSCLC samples is shown in
Figure 6. The PSCLC sample prepared using as-received C6M monomer shows bandwidth broadening of the reflection band by increasing the DC voltage to 60 V (~4.14 V/mm), whereas the PSCLC prepared using purified C6M (low ion density) shows small bandwidth broadening of the reflection band by increasing DC voltage to 40 V (~2.7 V·μm
−1). Interestingly, the PSCLC sample with high ion density shows a red shift of the CLC reflection band from 1480 nm to 1830 nm when the DSC voltage increases to 25 V DC (~1.7 V·μm
−1). The EO response of PSCLC is related to the ion density and viscoelastic properties of the polymer network. For PSCLCs with similar ion densities, the viscoelastic properties of the polymer network influence the magnitude of the dynamic response of the PSCLC. PSCLCs prepared using C6M (
Figure 6) show larger bandwidth broadening or red shifting tuning response than PSCLCs prepared using short alkyl chain length C3M monomer (
Figure 5) due to the large molecular weight between crosslinks.
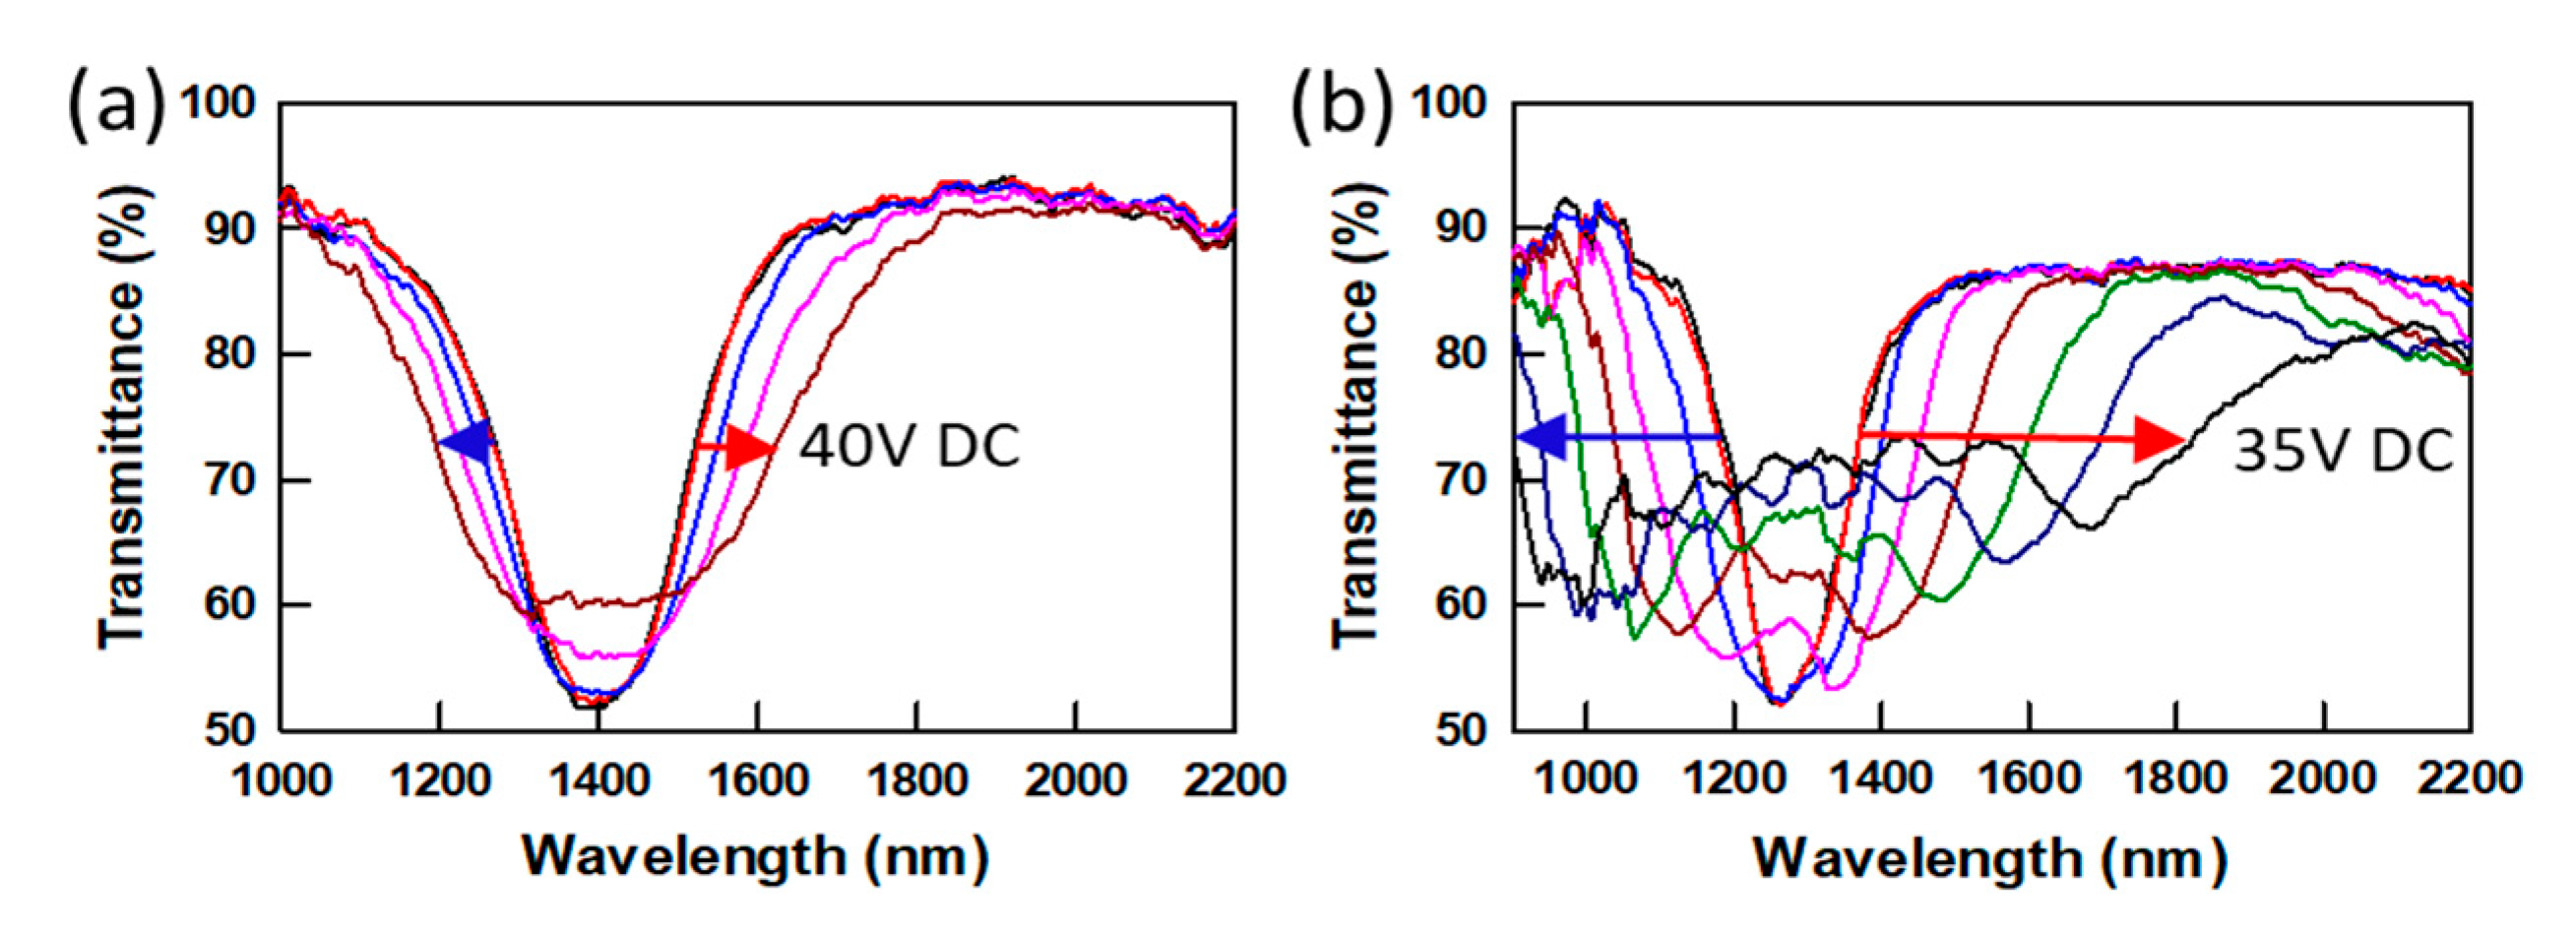
In addition to the chain length effect, the chirality of LCMs was also studied in
Figure 7. PSCLCs were prepared from mixtures containing 6 wt% purified achiral C6M or 6 wt% purified chiral LCM (SL04151, AlphaMicron, Inc) mixed with MLC-2079 and have similar ion density values. PSCLCs prepared with chiral SL04151 exhibit a much larger bandwidth increase (~ fivefold) at 35 V DC voltage, compared to the achiral C6M case shows a small increase in bandwidth (≤ twofold) at 40 V DC voltage. Video 1 shows the large and reversible bandwidth broadening response of a PSCLC sample prepared using 6 wt% chiral LCM. The chiral polymer networks, which are formed from chiral monomer SL04151, show much larger deformation than the polymer network formed from achiral LC monomer. This is probably due to the network being more elastic than that formed from achiral LCM. The chirality of LCM, which affects the viscoelastic property of the polymer network, affects the EO response of PSCLCs.


