Article

Effect of Scan Length on Densification and Crystallographic Texture Formation of Pure Chromium Fabricated by Laser Powder Bed Fusion

1
Division of Materials and Manufacturing Science, Graduate School of Engineering, Osaka University, 2-1, Yamadaoka, Suita, Osaka 565-0871, Japan
2
Anisotropic Design & Additive Manufacturing Research Center, Osaka University, 2-1, Yamadaoka, Suita, Osaka 565-0871, Japan
3
Department of Materials Processing, Graduate School of Engineering, Tohoku University, 6-6-02 Aza Aoba, Aramaki, Aoba-ku, Sendai 980-8579, Japan
*
Authors to whom correspondence should be addressed.
Crystals 2021, 11(1), 9; https://doi.org/10.3390/cryst11010009
Submission received: 6 December 2020 / Revised: 21 December 2020 / Accepted: 22 December 2020 / Published: 24 December 2020

Abstract

:
Processing of pure chromium (Cr) encounters substantial challenges due to its high melting point and intrinsic brittleness. Although laser powder bed fusion processing (LPBF) offers a novel processing approach by reaching the temperature required to melt pure Cr, the high ductile-to-brittle transformation temperature (DBTT) of pure Cr prevents the density of the as-built Cr component from reaching the level of industrial acceptance. This study focuses on raising the quality of the as-built pure Cr components to the industrial level while considering the effect of scan length on densification and crystallographic texture. It was found that short scan length induced by feature size improved the density of as-built specimens while strengthening the texture suggesting uniform heat distribution and lower thermal gradients as a result of short time intervals in scanning tracks and layers. It was discovered that cracking caused by residual stress was detrimental to densification due to the DBTT characteristic of pure Cr, which was localized at high-angle grain boundaries (HAGBs) with high misorientation. The decrease in density and misorientation of HAGBs owing to the increase in grain size and texture strength, respectively, improved the density of as-built Cr up to 97.6% and altered its mechanical properties. Therefore, these findings offer new insight into the LPBF processing of metals with high DBTT characteristics.

1. Introduction

Chromium (Cr) metal has attracted significant attention as a possible base for alloy systems since the late 1950s because of its higher melting point (1863 °C), lower density, and higher thermal conductivity compared with that of Ni-based superalloys [1,2,3]. However, the use of Cr metal as a viable substitute for Ni-based alloys has been impeded due to its high ductile-to-brittle transition temperature (DBTT), which is approximately 150 °C for pure Cr [3,4,5]. Below the DBTT, pure Cr exhibits a brittle behavior. In the early periods of Cr research, Klopp [1] highlighted the difficulty in melting and casting Cr in pure conditions and the exceptional sensitivity of Cr to minor imperfections such as impurities, particularly nitrogen. The nitrogen impurities disrupt the slip planes and free migration of dislocations in the crystal, resulting in an increase in DBTT. Due to its brittleness, Cr is among the materials that is difficult to use in plastic work.
Since additive manufacturing (AM) is featured by its flexible shaping ability, it has been utilized for the fabrication of a variety of products with complicated three-dimensional structures [6,7,8,9,10,11]. AM is expected to be suitable for near-net shape processing of difficult-to-process materials, and its application to such metal materials has begun to be tested [12,13,14]. Recently, our group [15] reported the successful production of pure Cr using a laser powder bed fusion (LPBF) process. In this study, the purity of Cr was maintained, and the oxidation performance was enhanced with crystallographic texture control. However, the density of the as-built Cr components was insufficient to consider its industrial applications. The components that are fabricated by the LPBF process have an extremely complicated thermal history due to the layer-by-layer characteristic of the melting process. The component is subjected to rapid heating and solidification, repeated re-heating and re-cooling, and highly directional heat extraction. This leads to accumulation of residual stresses within the component [16,17]. The residual stress can build up to a point where crack initiation and propagation occur within the component during processing [18], whereas DBTT renders Cr susceptible to crack formation from built-up residual stresses [19], thus resulting in insufficient mechanical strength for industrial applications.
Studies on tungsten (W), which has a high DBTT similar to that of Cr, show that defects can be minimized by optimizing various process conditions in LPBF processing. However, relative densities do not exceed 96.5%, and cracks are still present [20]. There are several approaches to avoid cracking, such as alloying in general; however, in this study the purity was intended to maintain in order to prevent further purification process of recycled pure metals, thereby achieving resource sustainability. Process controlled parameters of LPBF such as energy density, preheat, re-scan, scan strategy, and reducing scan length can be altered to improve density and prevent the formation of defects in the component without alloying [21,22,23,24,25]. These effective considerations are listed as follows:
  • The effect of energy density on densification of pure W showed an increase in bulk density up to 97% with increasing the energy density, while micro cracks and defects still existed due to the residual stress [21].
  • Preheating the build platform to reduce the temperature gradient in the as-built component has been among the most commonly used methods. It was reported that preheating reduced residual stress by 46% and increased density by 2.9%, while considering that preheat can reach higher than the DBTT to improve ductility of the build part [22].
  • The remelting of the processed layer during LPBF improved the surface quality and microstructure, achieving 98.4% relative density regarding the recovery of cracks with a subsequent scan [23].
  • The scan strategy affects the heat distribution and ultimately the defect location and distribution. Generally, an island scan strategy is suggested to avoid the accumulation of defects by homogenizing the residual stress distribution by dividing the scan area into small islands, resulting in a reduction in scan length [24].
  • Therefore, LPBF fabrication with short scan length to decrease the defects and cracks showed reduced residual stress due to short time intervals between tracks and layers, uniform thermal distribution, small thermal gradient, and overall high ambient temperature during processing [25].
Therefore, the aim of this study is to clarify the effect of scan length (feature size), which alters the residual stress and thermal history, and to improve the density, texture, and mechanical properties of pure Cr components and promote its as-built quality to conform to the expectations of the industry. To the best of our knowledge, there has been no study focusing on pure Cr while preventing cracking and improving the density to promote its industrial applications.

2. Materials and Methods

Pure Cr powder (>99% purity) was supplied by JFE Material (Japan), as shown in Figure 1a. The average particle size was measured using a Mastersizer 3000E particle size analyzer (Malvern Panalytical, Worcestershire, UK), which was Dv50 44.8 μm. The irregularly shaped pure Cr powder exhibited good flowability compared with that of commercial Ti6Al4V spherical powders (EOS, Munich, Germany) [14].
An LPBF-machine (EOS M290, Munich, Germany) equipped with a 400 W Yb laser was used to manufacture the pure Cr specimens with dimensions of 10 × 10 × 5 mm and 5 × 5 × 5 mm along the x-, y-, and z-axes, respectively (Table 1). The LPBF process was conducted in a high-purity argon atmosphere (99.9%) to avoid the scavenging of reactive oxygen while maintaining the oxygen content below 100 ppm. The building stage was pre-heated to 80 °C. A meander scan strategy with the scan lines spanning the entire 10 and 5 mm length was used, and the laser scanning direction was rotated by 90° between adjacent layers to minimize the internal residual stress, as shown in Figure 1b [26]. This was conducted to promote crystallographic texture formation with sufficient intensity [27]. Based on a series of preliminary experiments, the LPBF parameters were optimized as follows: laser power (P) = 300 W, laser scan speed (v) = 600 mm/s, hatch space (h) = 80 µm, and powder layer thickness (d) = 20 µm, which is equal to a line energy input of 0.5 J/mm. The line energy (EL) is defined by Equation (1):
E L = P v
Microstructural and crystallographic texture analyses of the as-built Cr specimens fabricated with scan lengths of 10 and 5 mm (Figure 1c,d) were conducted to clarify the possible effect of the feature sizes of the Cr specimens on the crystallographic texture characteristics.
The as-built Cr specimens were sectioned on the y–z plane representing the scan direction in the x plane by electrical discharge wire cutting. The surfaces of the as-built Cr specimens were mechanically ground with SiC paper up to #1000 and mirror polished with an alumina suspension (AP-D Powder 0.3 μm, Struers, Ballerup, Denmark) for further examination.
The crystallographic texture was examined using an electron backscatter diffraction system (EBSD, Nordlys Max3 system, Oxford Instruments, Cambridge, UK) mounted on a field-emission scanning electron microscope (FE-SEM; JIB-4610 F, JEOL, Tokyo, Japan) operated with at an accelerating voltage of 20 kV and a step size of 1.5 μm. Then, HKL Channel 5 software (Oxford Instruments, Cambridge, UK) was used to obtain the quantitative analysis of the grain orientation ratios, average grain size, grain size distribution, and number fraction and mapping of high-angle grain boundaries (HAGBs) for more than 1000 grains per map.
The microstructure observations of crack formation were studied using optical microscopy (OM, Nikon, Eclipse LV150, Tokyo, Japan), and an FE-SEM equipped with an EBSD detector and energy dispersive X-ray spectroscope (EDS, AZtec 3.1, Oxford Instruments, Cambridge, UK) system.
The density of the as-built Cr specimens was determined by the image analysis method (optical density) and Archimedes’ method. The relative density determined by image analysis was measured from a mirror-polished y–z cross section (x-scan direction) as an average of five measurements. The Archimedes’ density was measured five times using ethanol (99.5% purity, Wako, Tokyo, Japan) at room temperature (~24 °C). To evaluate the relative density, theoretical density of pure Cr (at room temperature), 7.19 g/cm3, was used.
The microhardness of the as-built Cr specimens was measured on the y–z plane using a micro Vickers tester (Akashi MVK-E, Tokyo, Japan) with a load of 500 gf for 20 s, and the average value was determined from 15 measurements in which 5 measurements were recorded at the bottom, center, and top regions of the specimen.

3. Results and Discussion

3.1. LPBF Processing and Densification

To obtain a better understanding of the effect of scan length on densification in the LPBF process of Cr components, the scan areas of 10 × 10 mm and 5 × 5 mm were investigated under the same process conditions, indicating the same energy density as shown in Table 1. Owing to the characteristics of the LPBF, there are more defects along the build direction in general [23]. Although Archimedes’ method presents the overall density of the component, the optical density of the y–z plane (cross-section of the build direction) of the Cr specimens was evaluated by the image analysis method in this study (see Table 2). The corresponding relative density results ranged between 95% and 97% for the bulk densities obtained by Archimedes’ method. However, the values of optical density measured were slightly higher corresponding to previous reports [21].
The C10 specimen reached 95.5% relative density, which was comparable to our previous report with the highest recorded relative density of 95.47% [15]. However, this study focused on a higher laser power (300 W) compared with the process conditions in a previous study (250 W). The relative density of Cr showed no further increase even though higher energy density fabrication was used. It has been reported that an increase in energy density improved the relative density [18]; however, it can be suggested that further increases in energy density were ineffective in improving the density of pure Cr due to defects caused by the DBTT characteristics of Cr and residual stress during processing.
Residual stress magnitudes can be influenced by parameters such as energy density, hatch space, scan rotation between successive layers, baseplate preheating, and scan length [28]. Among these, a reduction in scan length has been reported to reduce residual stress by up to 40% [29]. Therefore, in this study, the scan length determined by the feature size of the Cr component was studied to improve the density. Moreover, the approach for improving the density is to reduce the defect formation while reducing the residual stresses. Because a short scan vector length reduces the residual stress, the relative density of the C5 specimen reached 97.4% under the same energy density condition, as shown in Table 1 and Table 2. This result indicated a decrease in residual stress and defect formation, thus resulting in an improvement in the relative density.
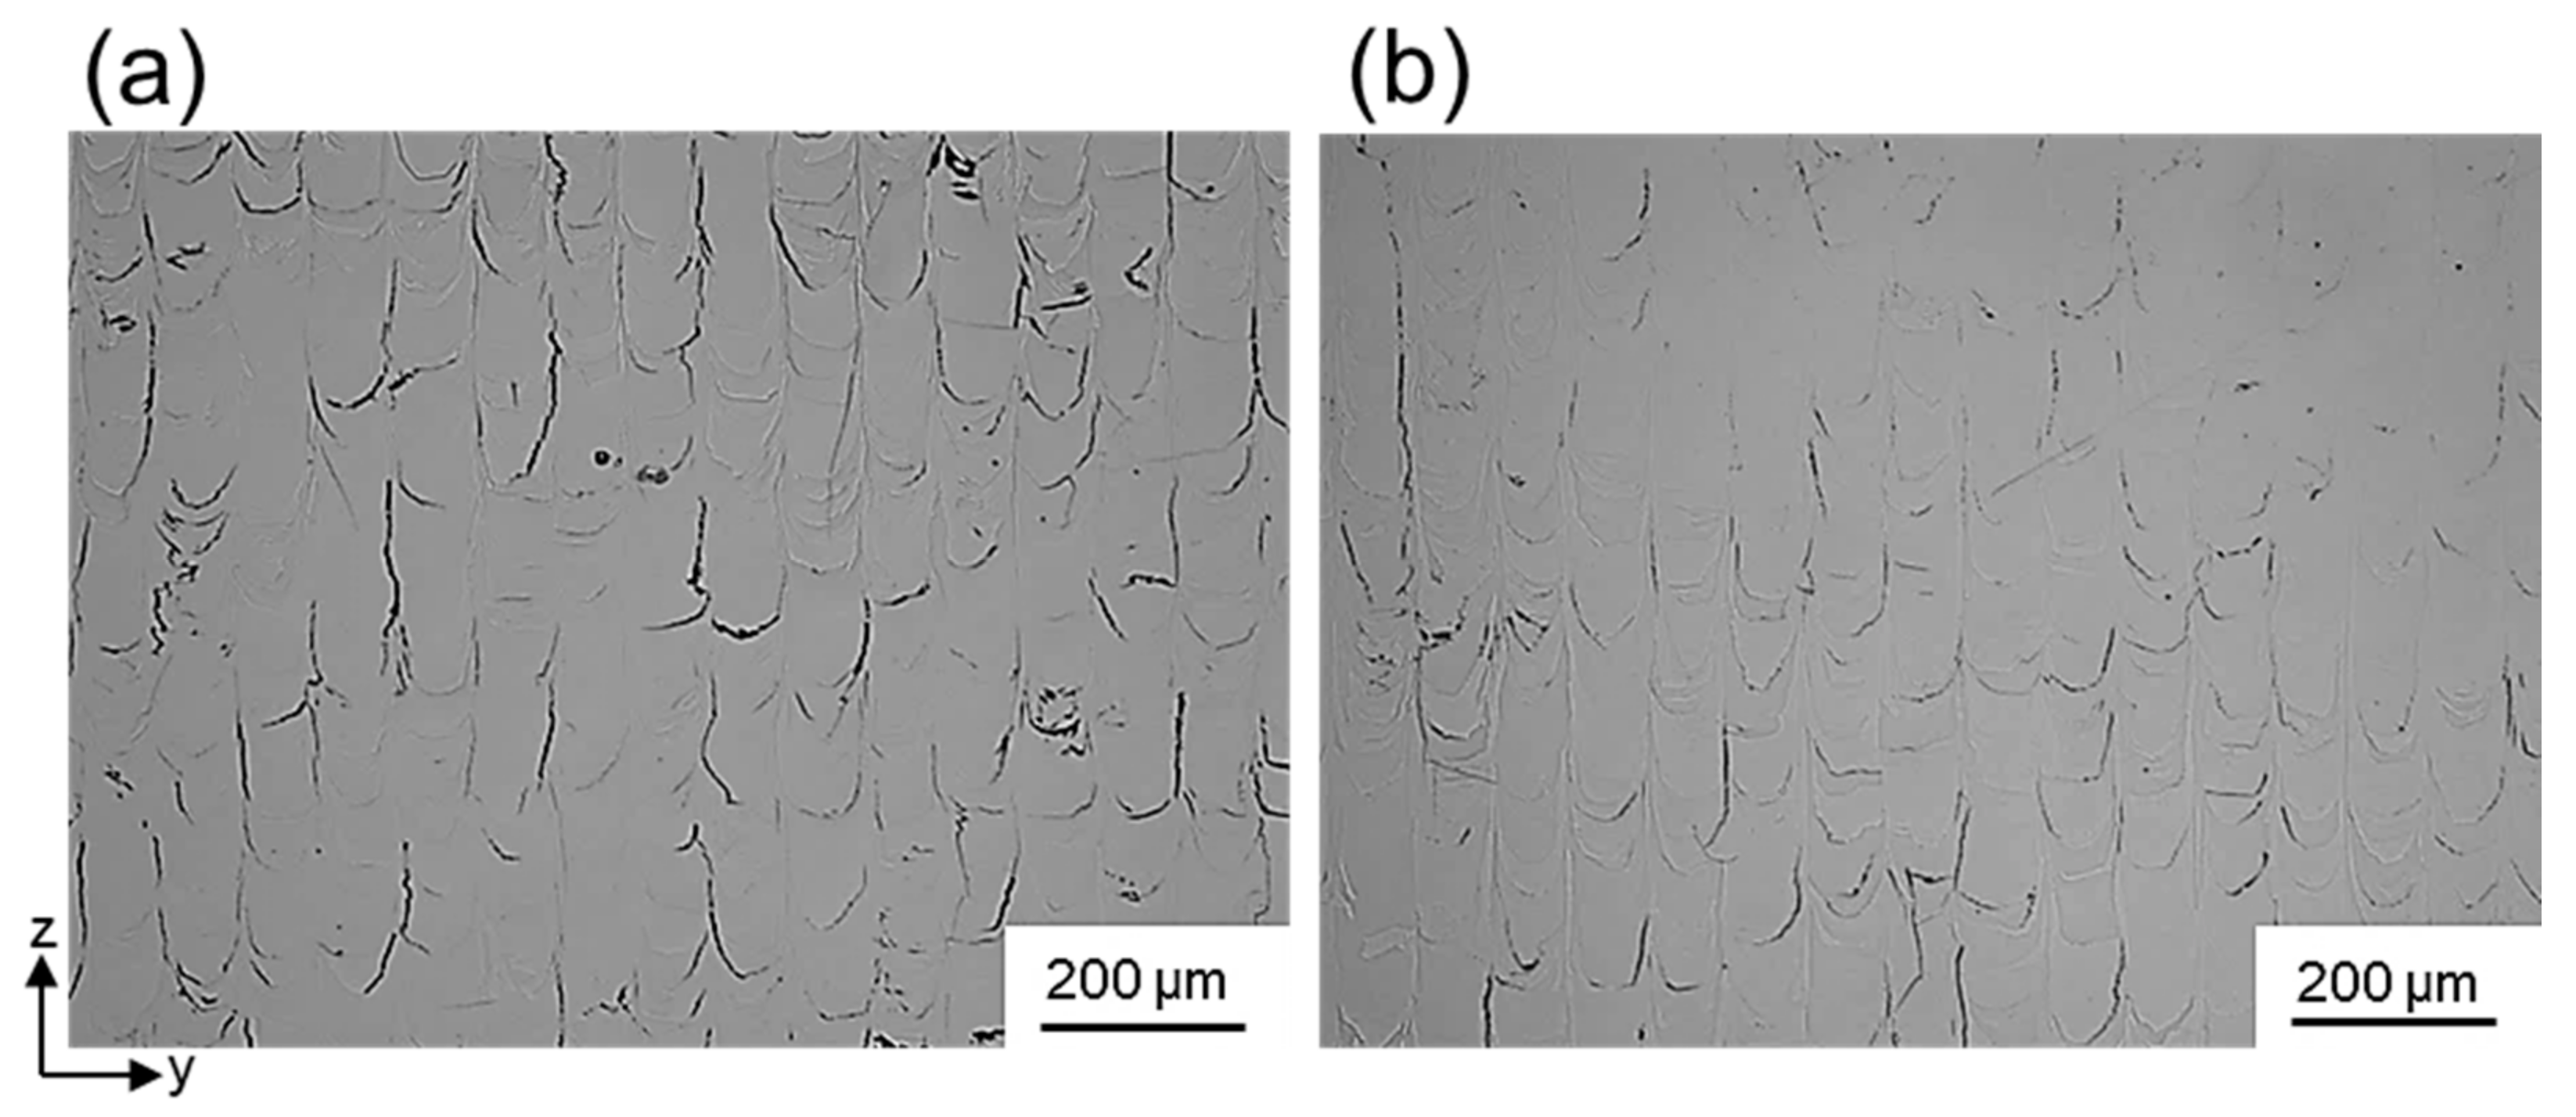
Cross-sectional images (y–z plane) of C10 and C5 specimens confirmed the presence of irregular crack formation without any lack of fusion or porosity, as shown in Figure 2. Although the residual stresses were suggested to decrease with shorter scan lengths in C5 specimens, crack formation was inevitable due to the DBTT characteristic of Cr. However, the crack density decreased from 2.8% in C10 to 1.9% in C5 specimens (Table 2). Regarding the density of tungsten specimens, Sidambe et. al. stated that it is not possible to eliminate the final 2% of defects in high-temperature materials with DBTT characteristics [21].

3.2. Microstructure and Crystallographic Texture

To evaluate the effect of the feature size of Cr specimens on the formation of cracks, a set of investigations was performed to characterize the grain size, grain boundary characteristics, and grain orientation. According to the fact that the cracks were located at the melt pool center where the HAGB existed [30] as a crack initiation site, as seen in Figure 2, an understanding of the effect of scan length on the microstructure of Cr specimens is required.
The EBSD inverse pole figure (IPF) maps colorized according to the crystallographic orientation in the y–z plane are shown in Figure 3a,b, along with the related HAGB (15° ≤ θ) maps represented by the red lines (c, d), and the corresponding pole figures (e, f). In both IPF-maps, the red colored area corresponds to a {100} pole aligned with the y–z plane; furthermore, the C5 specimen forms an even stronger {100} texture compared to the red area of the C10 specimen. Based on the multiples of uniform distribution (MUD) within pole figures described in Table 2 (see Figure 3e,f), the {100} texture for a short scan length (max MUDC5 = 6.2) was stronger than that of the long scan length (max MUDC10 = 4.7). The MUD number is one measure of the texture strength in an EBSD pole figure, with higher values indicating stronger alignment.
The fraction of crystal orientation obtained by the HKL Channel 5 software tool, regarding the {100}, {110}, and {111} orientations, of the as-built Cr specimens with respect to the change in scan length (C10 and C5) are shown in Figure 4. A higher fraction of {100} oriented grains and a corresponding decrease in the fraction of {110}- and {111}-oriented grains with a decrease in the scan length were detected, which corresponded to the maximum MUD values.
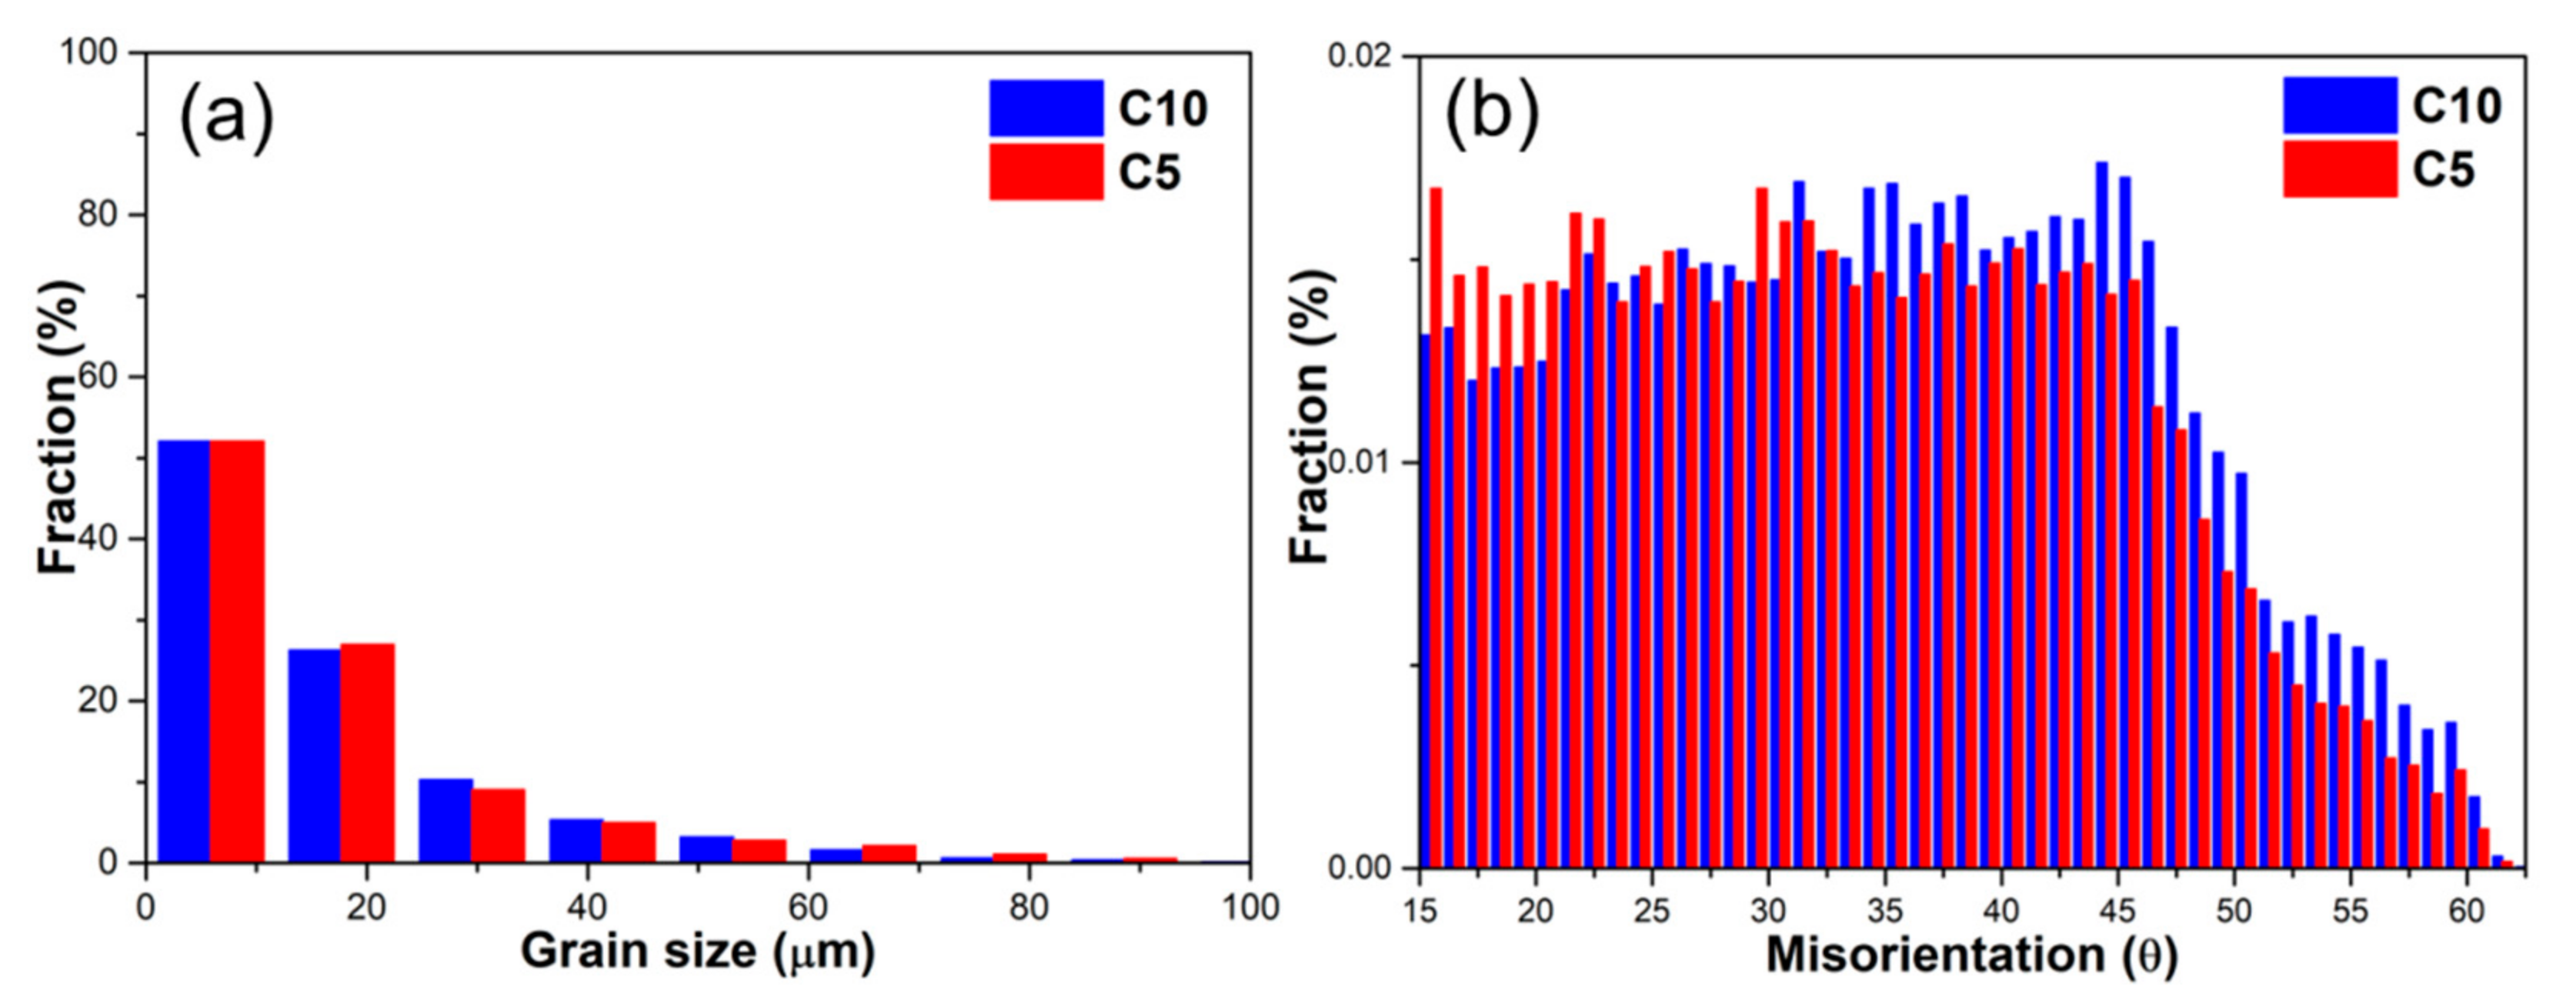
The progress of the texture with the decrease in scan length can be explained by the altered thermal history regarding the shorter time intervals of scan tracks [31], resulting in required cooling conditions to form grains in the {100} directions, which are the fastest growth directions for BCC crystals [32], additionally resulting in an increase in the grain size (Table 2). Although the grain size distribution (see Figure 5a) did not show a significant tendency for grain growth, the increase in average grain size with short scan length eventually exhibited a decrease in the density of HAGBs, as shown in Figure 3. The quantitative analysis of HAGB density is reported in Table 2. Moreover, the distribution of HAGB shifted towards a lower angle misorientation with the strengthening in texture for a short scan length, as seen in Figure 5b. HAGB is introduced intentionally to increase the resistance of slip transmission at GB and to tailor a yield stress [33]; however, that strategy is not beneficial in Cr.
The change in HAGB characteristics correlates with the increase in average grain size due to the altered thermal history of Cr specimens with short scan lengths. While altering the HAGB, which is known as the grain boundary engineering method, the texture and average grain size characteristics of as-built Cr specimens were altered with changes in the scan vector length of the LPBF process in this study, indicating the possibility of enhancement in the properties of pure Cr components related to grain boundary and texture characteristics. It is necessary to note that, for pure Cr with DBTT characteristics, an improvement in the density of pure Cr can be realized by shortening the scan length because of the decrease in HAGB density, which is a crack initiation site. Wu et al. [34] investigated the effect of island scan sizes in 316L stainless steel parts in which 3 × 3 m islands reduced tensile residual stress compared to 5 × 5 mm islands. Similarly, Lu et al. [35] reported that the 5 × 5 island size for Inconel 718 parts had lower residual stress than the parts with an island size of 7 × 7 mm or 3 × 3 mm. The literature mainly focused on the island scan strategy and the effect of island size [18,28]. Moreover, it has been reported that the geometry of the as-built part also influences the residual stress magnitude and distribution [25]. However, regardless of the scan length used in this study, the Cr specimens were cracked. Therefore, our research group is currently investigating the possible effect of scan length, preheat, and variation in process parameters on the thermal history of as-built components with finite element methods (FEM) and experimental studies to correlate with material properties in the as-built state.

3.3. Crack Formation and Hardness

Because of the distinctive layer-by-layer process of LPBF, the residual stresses are usually large in as-built samples, causing crack formation, as mentioned previously. Although the residual stresses are not always detrimental to cracking and failure, the cracking intensity corresponds to the material properties. As such, the high DBTT characteristic of pure Cr magnifies the effect of residual stress on cracking. The magnitude of the thermal stress ( σ t ) can be expressed by Equation (2) [20]:
σ t = E α 1 ν Δ T
where ΔT is the temperature difference, α is the linear expansion coefficient, ν is the Poisson’s ratio, and E is Young’s modulus. Theoretically, cracks are initiated when the inner thermal stress exceeds the ultimate tensile strength ( σ U T S ): σ t >   σ U T S . Considering this phenomenon, the cracking criterion can be expressed as
σ U T S 1 ν E α > Δ T
Notably, the parameters to consider for crack initiation/resistance are material properties, as seen in Equation (3). It is also worth noting that the linear thermal expansion of Cr increases rapidly at high temperatures [36]. Moreover, the high DBTT characteristic of Cr is expected to promote crack initiation at high energy/angle grain boundaries.
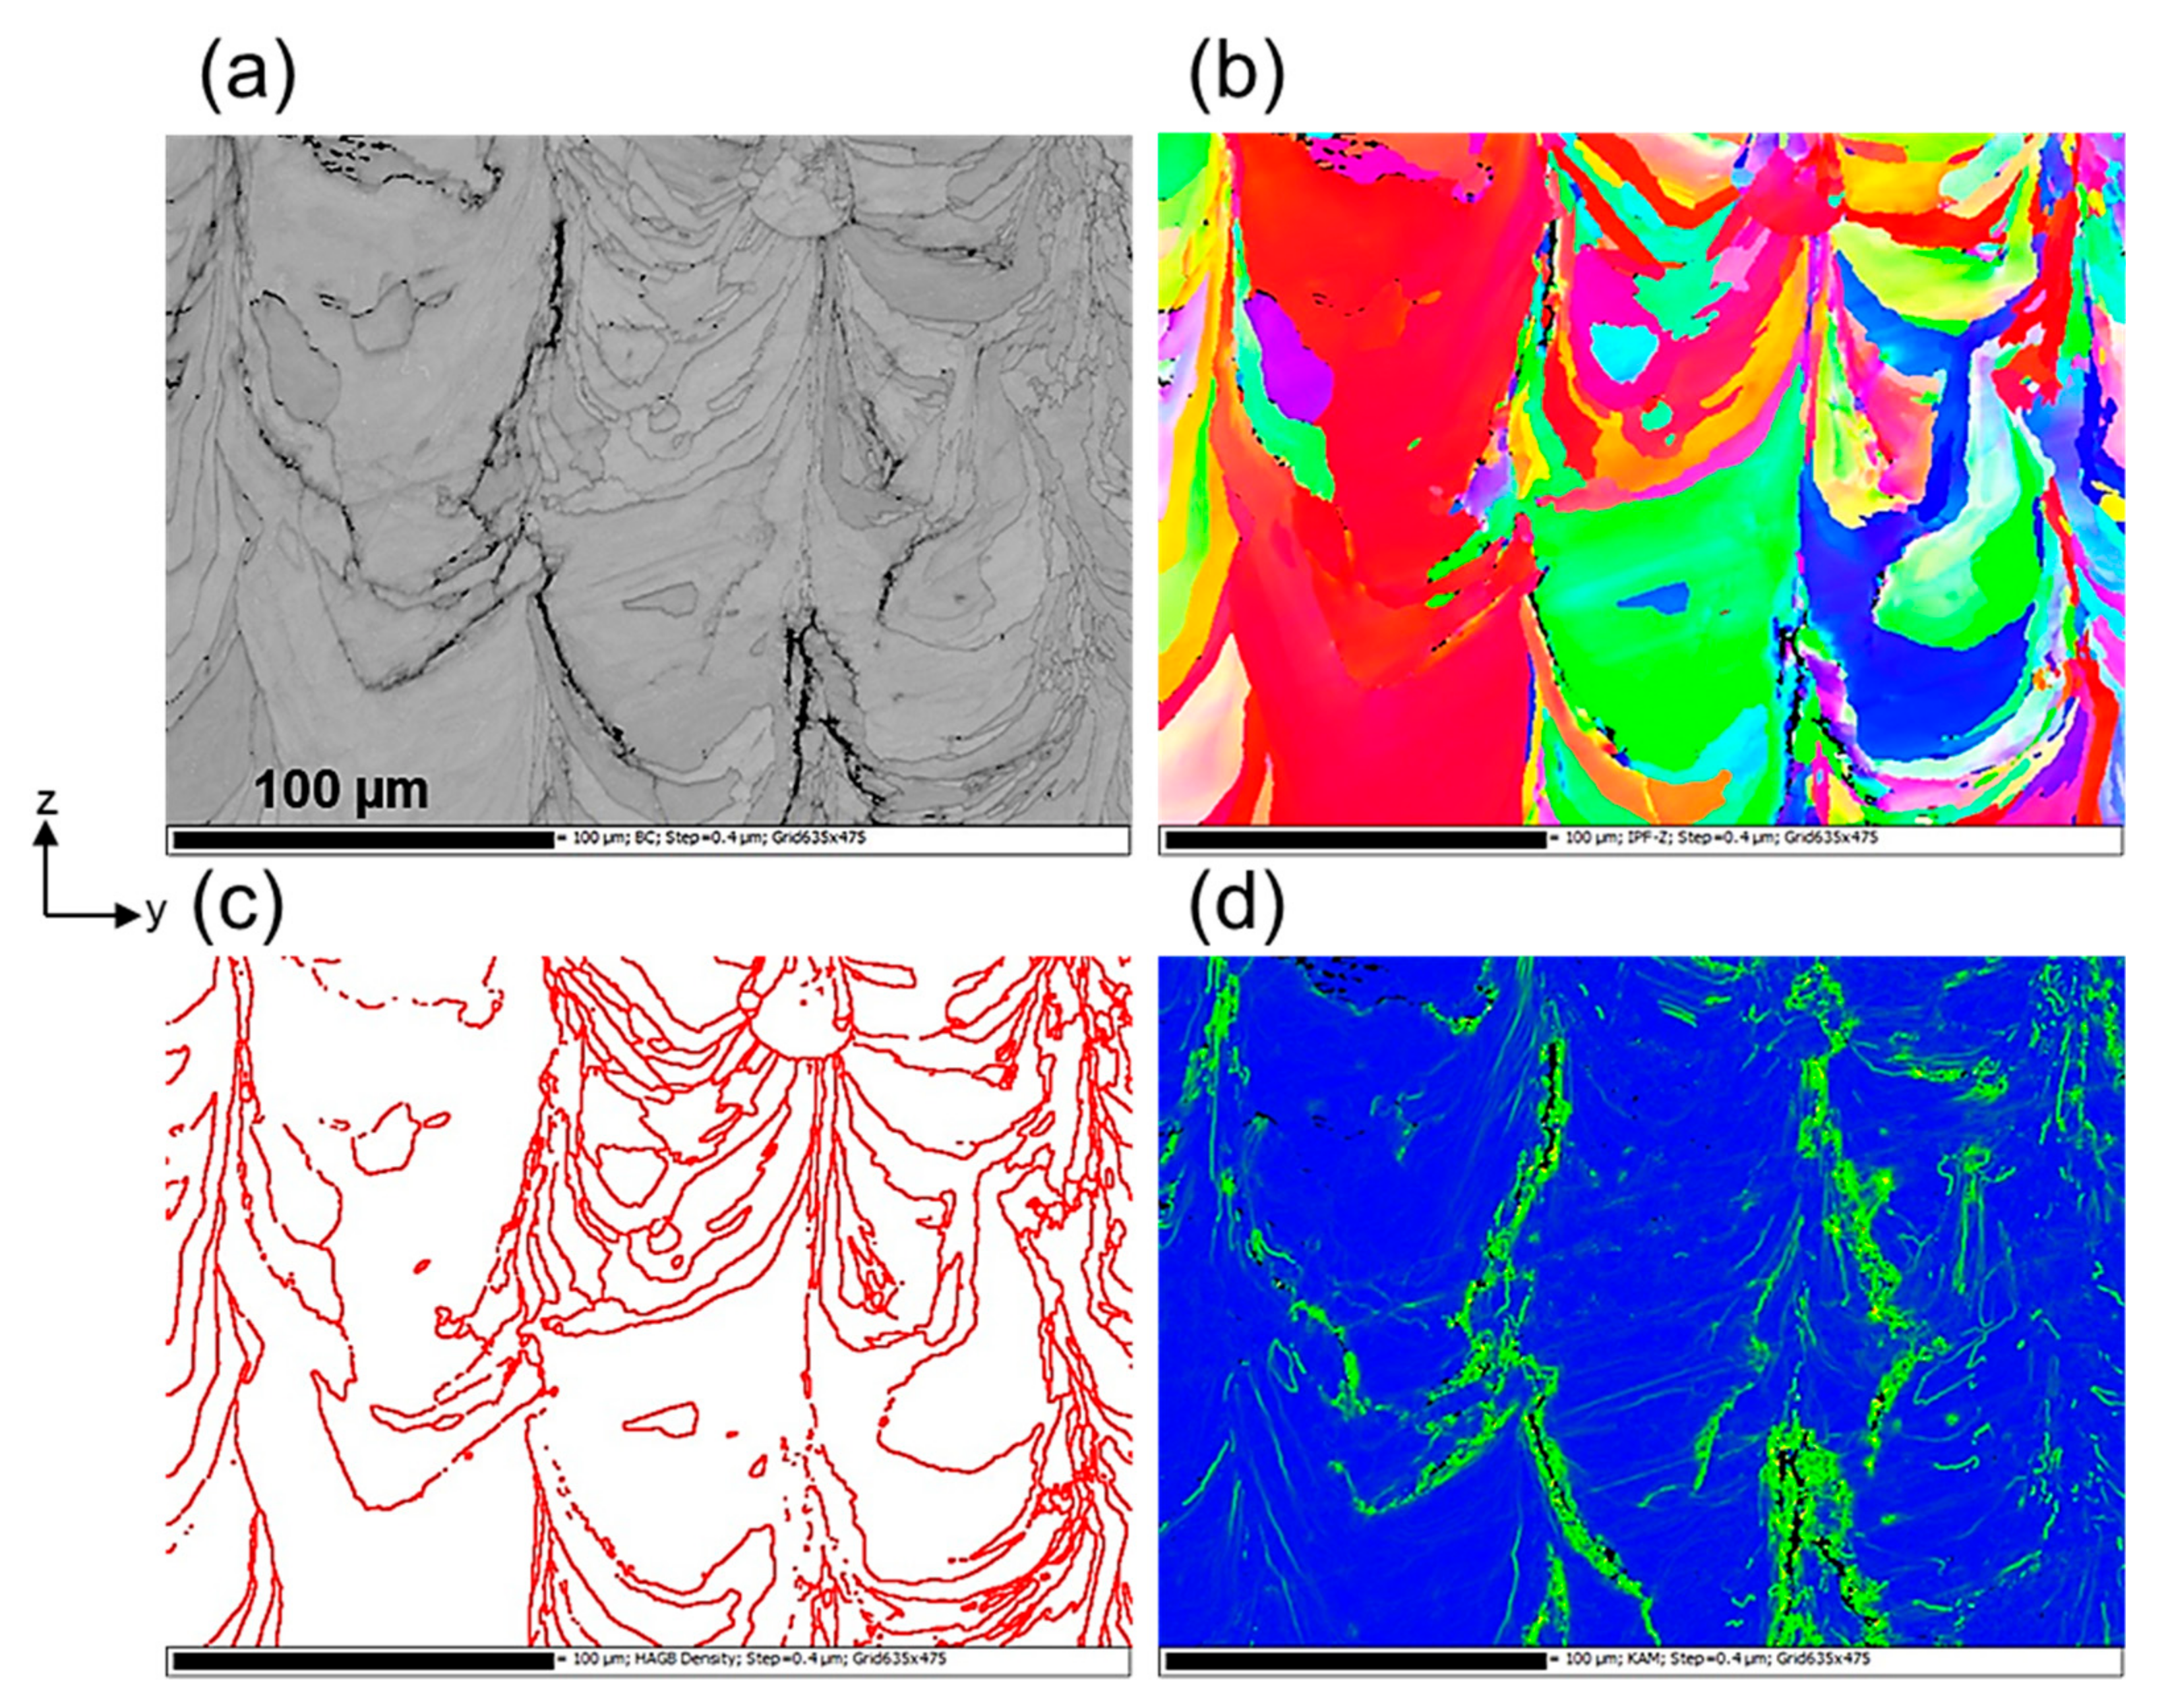
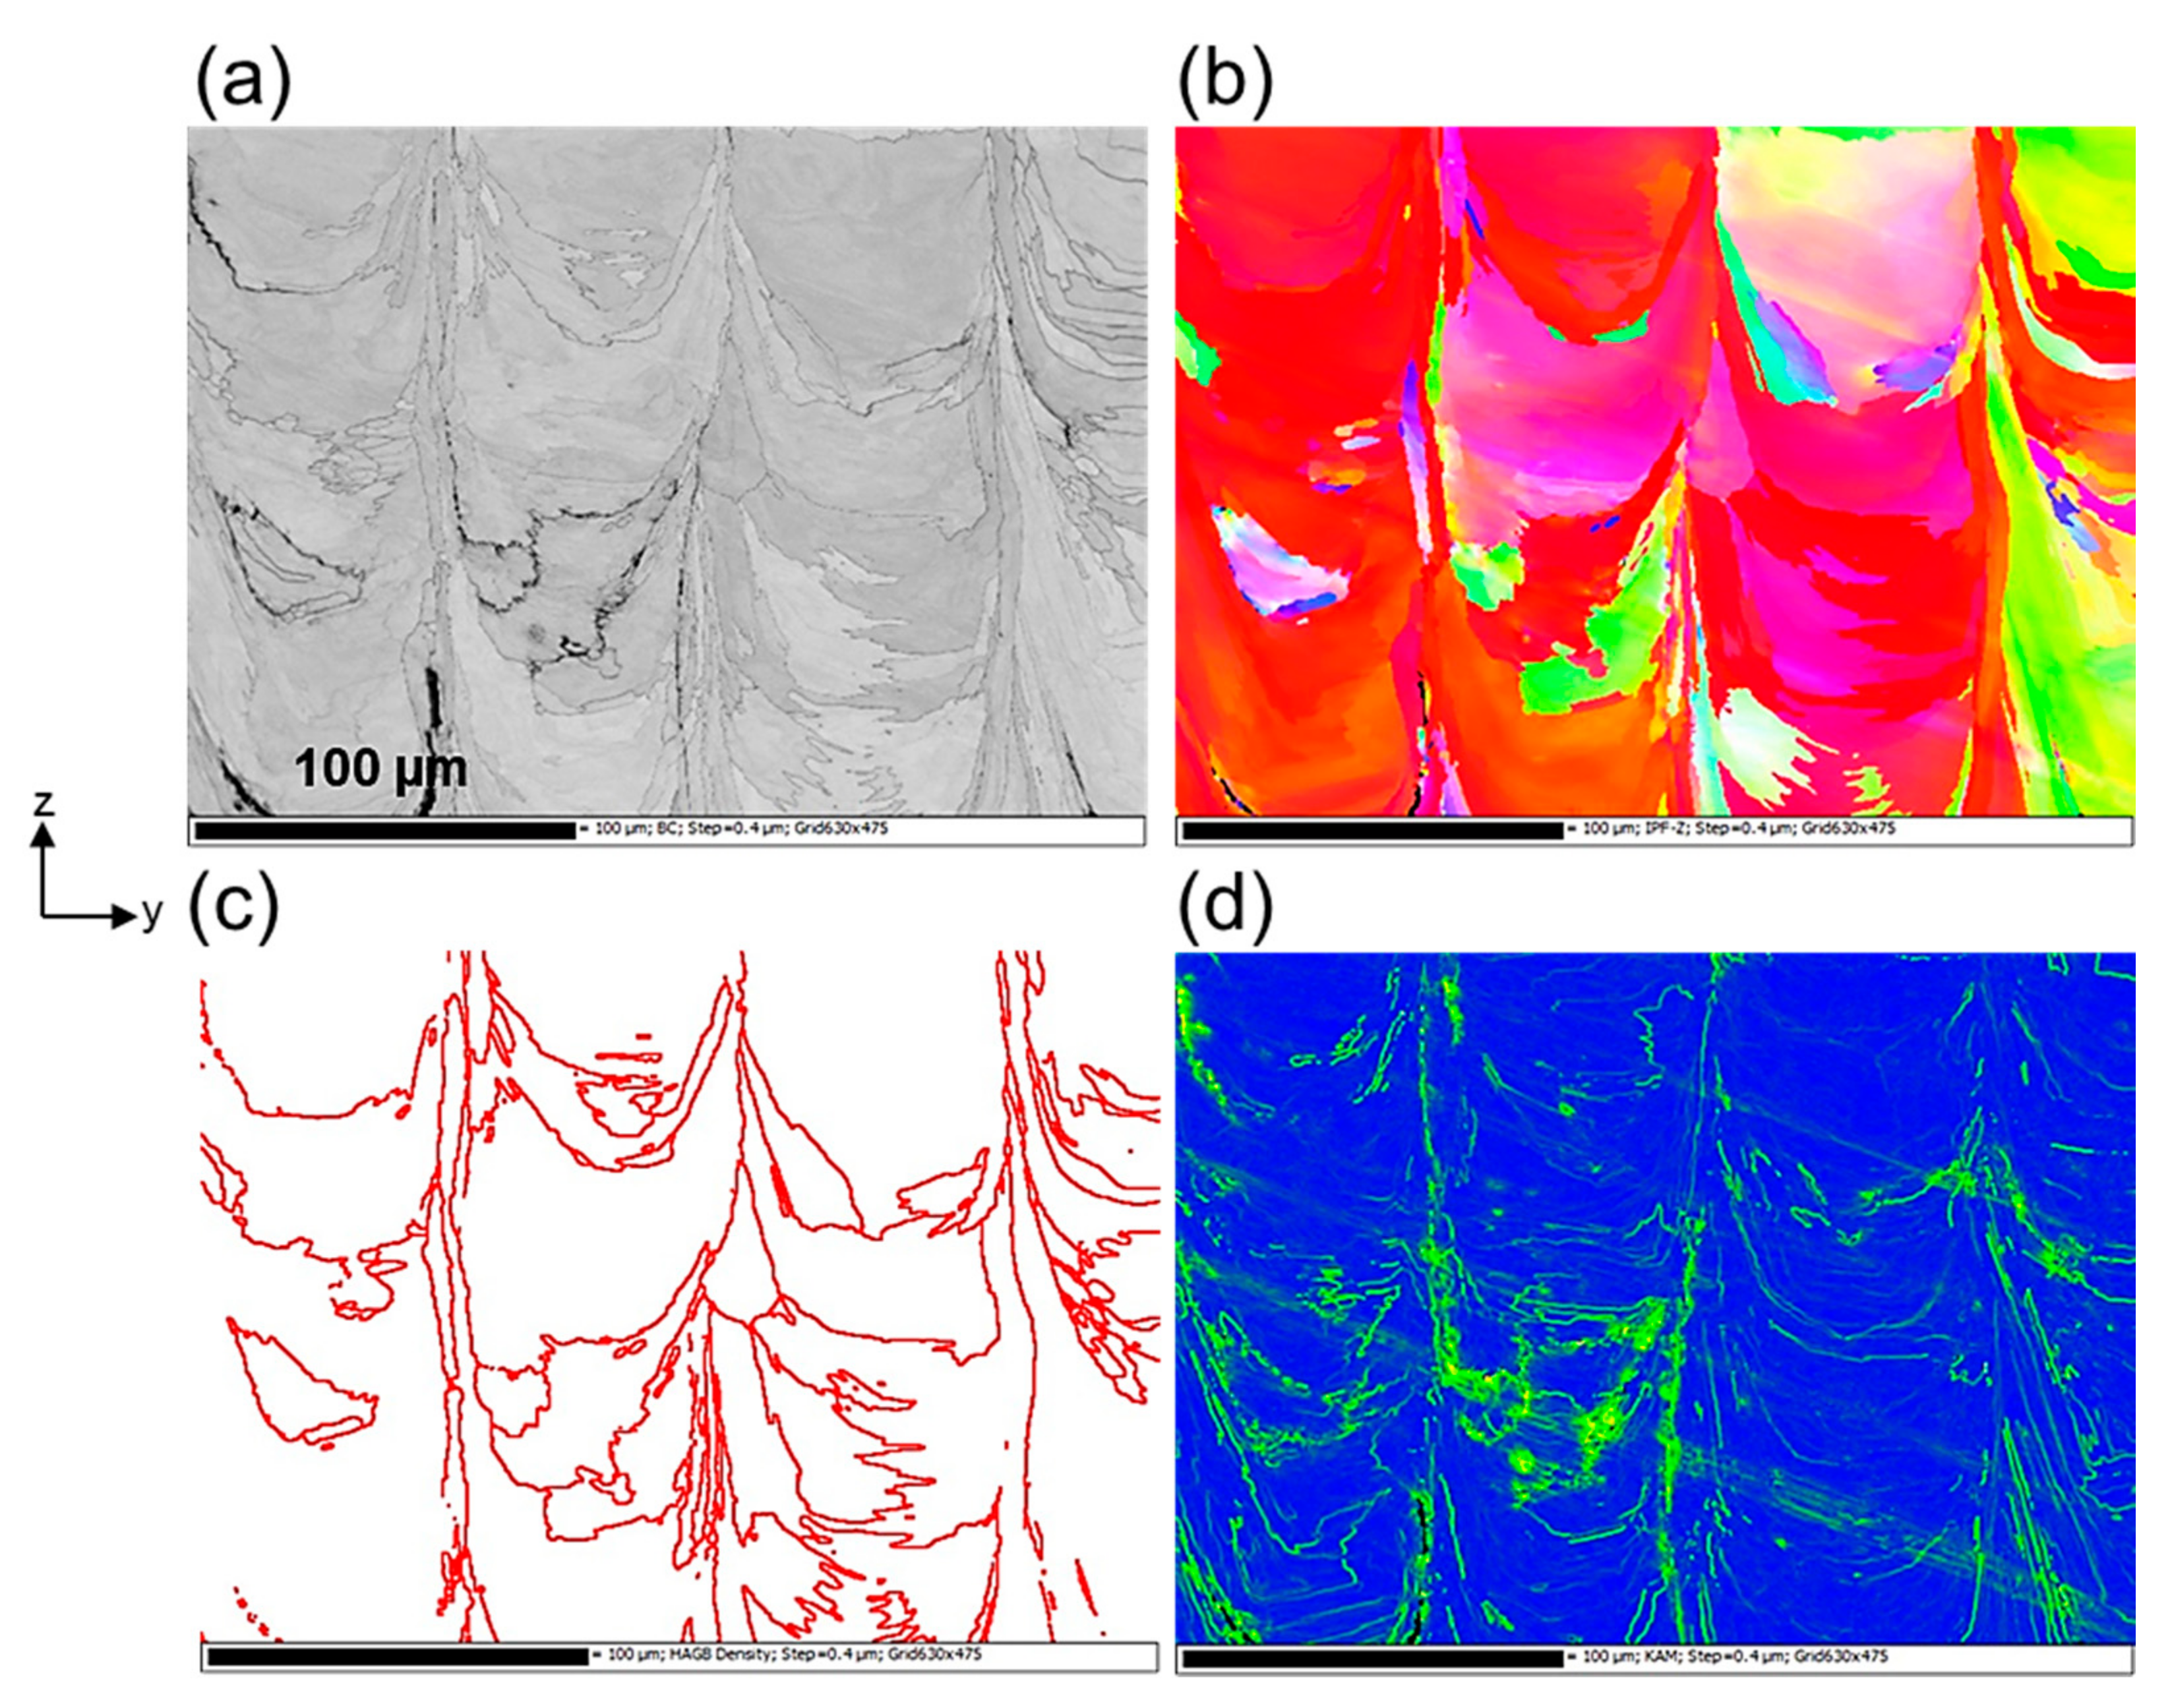
Figure 6 shows the EBSD results of the as-built C10 specimen, particularly the (a) band contrast (BC) map on the y–z plane of the examined area containing several cracks and corresponding (b) IPF map, (c) HAGB map, and (d) kernel average misorientation (KAM) map. Figure 7 presents the EBSD results of the as-built C5 specimen with a stronger (100) texture as a comparison to as-built C10 specimen in terms of cracking with the (a) BC map and corresponding (b) IPF map, (c) HAGB map, and (d) KAM map. Considering the BC and IPF maps together, it can be seen that crack initiation and growth direction were associated with the deviation of grain orientation, which correlates with the HAGB map (Figure 6 and Figure 7c). The KAM map was obtained by calculating the average misorientation between a pixel and its neighboring pixels; therefore, it provides the local misorientation in which yellowish-green indicates high misorientations. While residual strain appears as local variations in lattice orientation, the KAM map is effective for estimating the extent of deformation or strain at the microscale [37]. According to this consideration, the KAM maps of C10 and C5 specimens (Figure 6 and Figure 7d) presenting high strain grain boundaries where cracks initiate and propagate were detected, indicating similar cracking mechanism for both scan length strategy. Wang et al. revealed that the misorientation analysis of tungsten exhibited preferential crack growth along the relatively higher angle (>50°) GBs rather than the lower ones (<30°) [38], corresponding to the results of this study, which lower HAGB distribution in C5 resulting improved in densification.
These results exhibit a significant correlation between texture strength and HAGB density/misorientation versus relative density and crack formation. As stated in Section 3.2, C5 specimens with shorter scan lengths exhibited stronger texture formation and lower HAGB density, shifting to lower misorientation compared with fabrication with longer scan lengths. Therefore, C5 specimens reached higher relative density with delayed crack initiation and propagation, regarding the decrease in residual stresses (~40%) [29], owing to short time intervals of scan tracks and altered thermal history of the LPBF process.
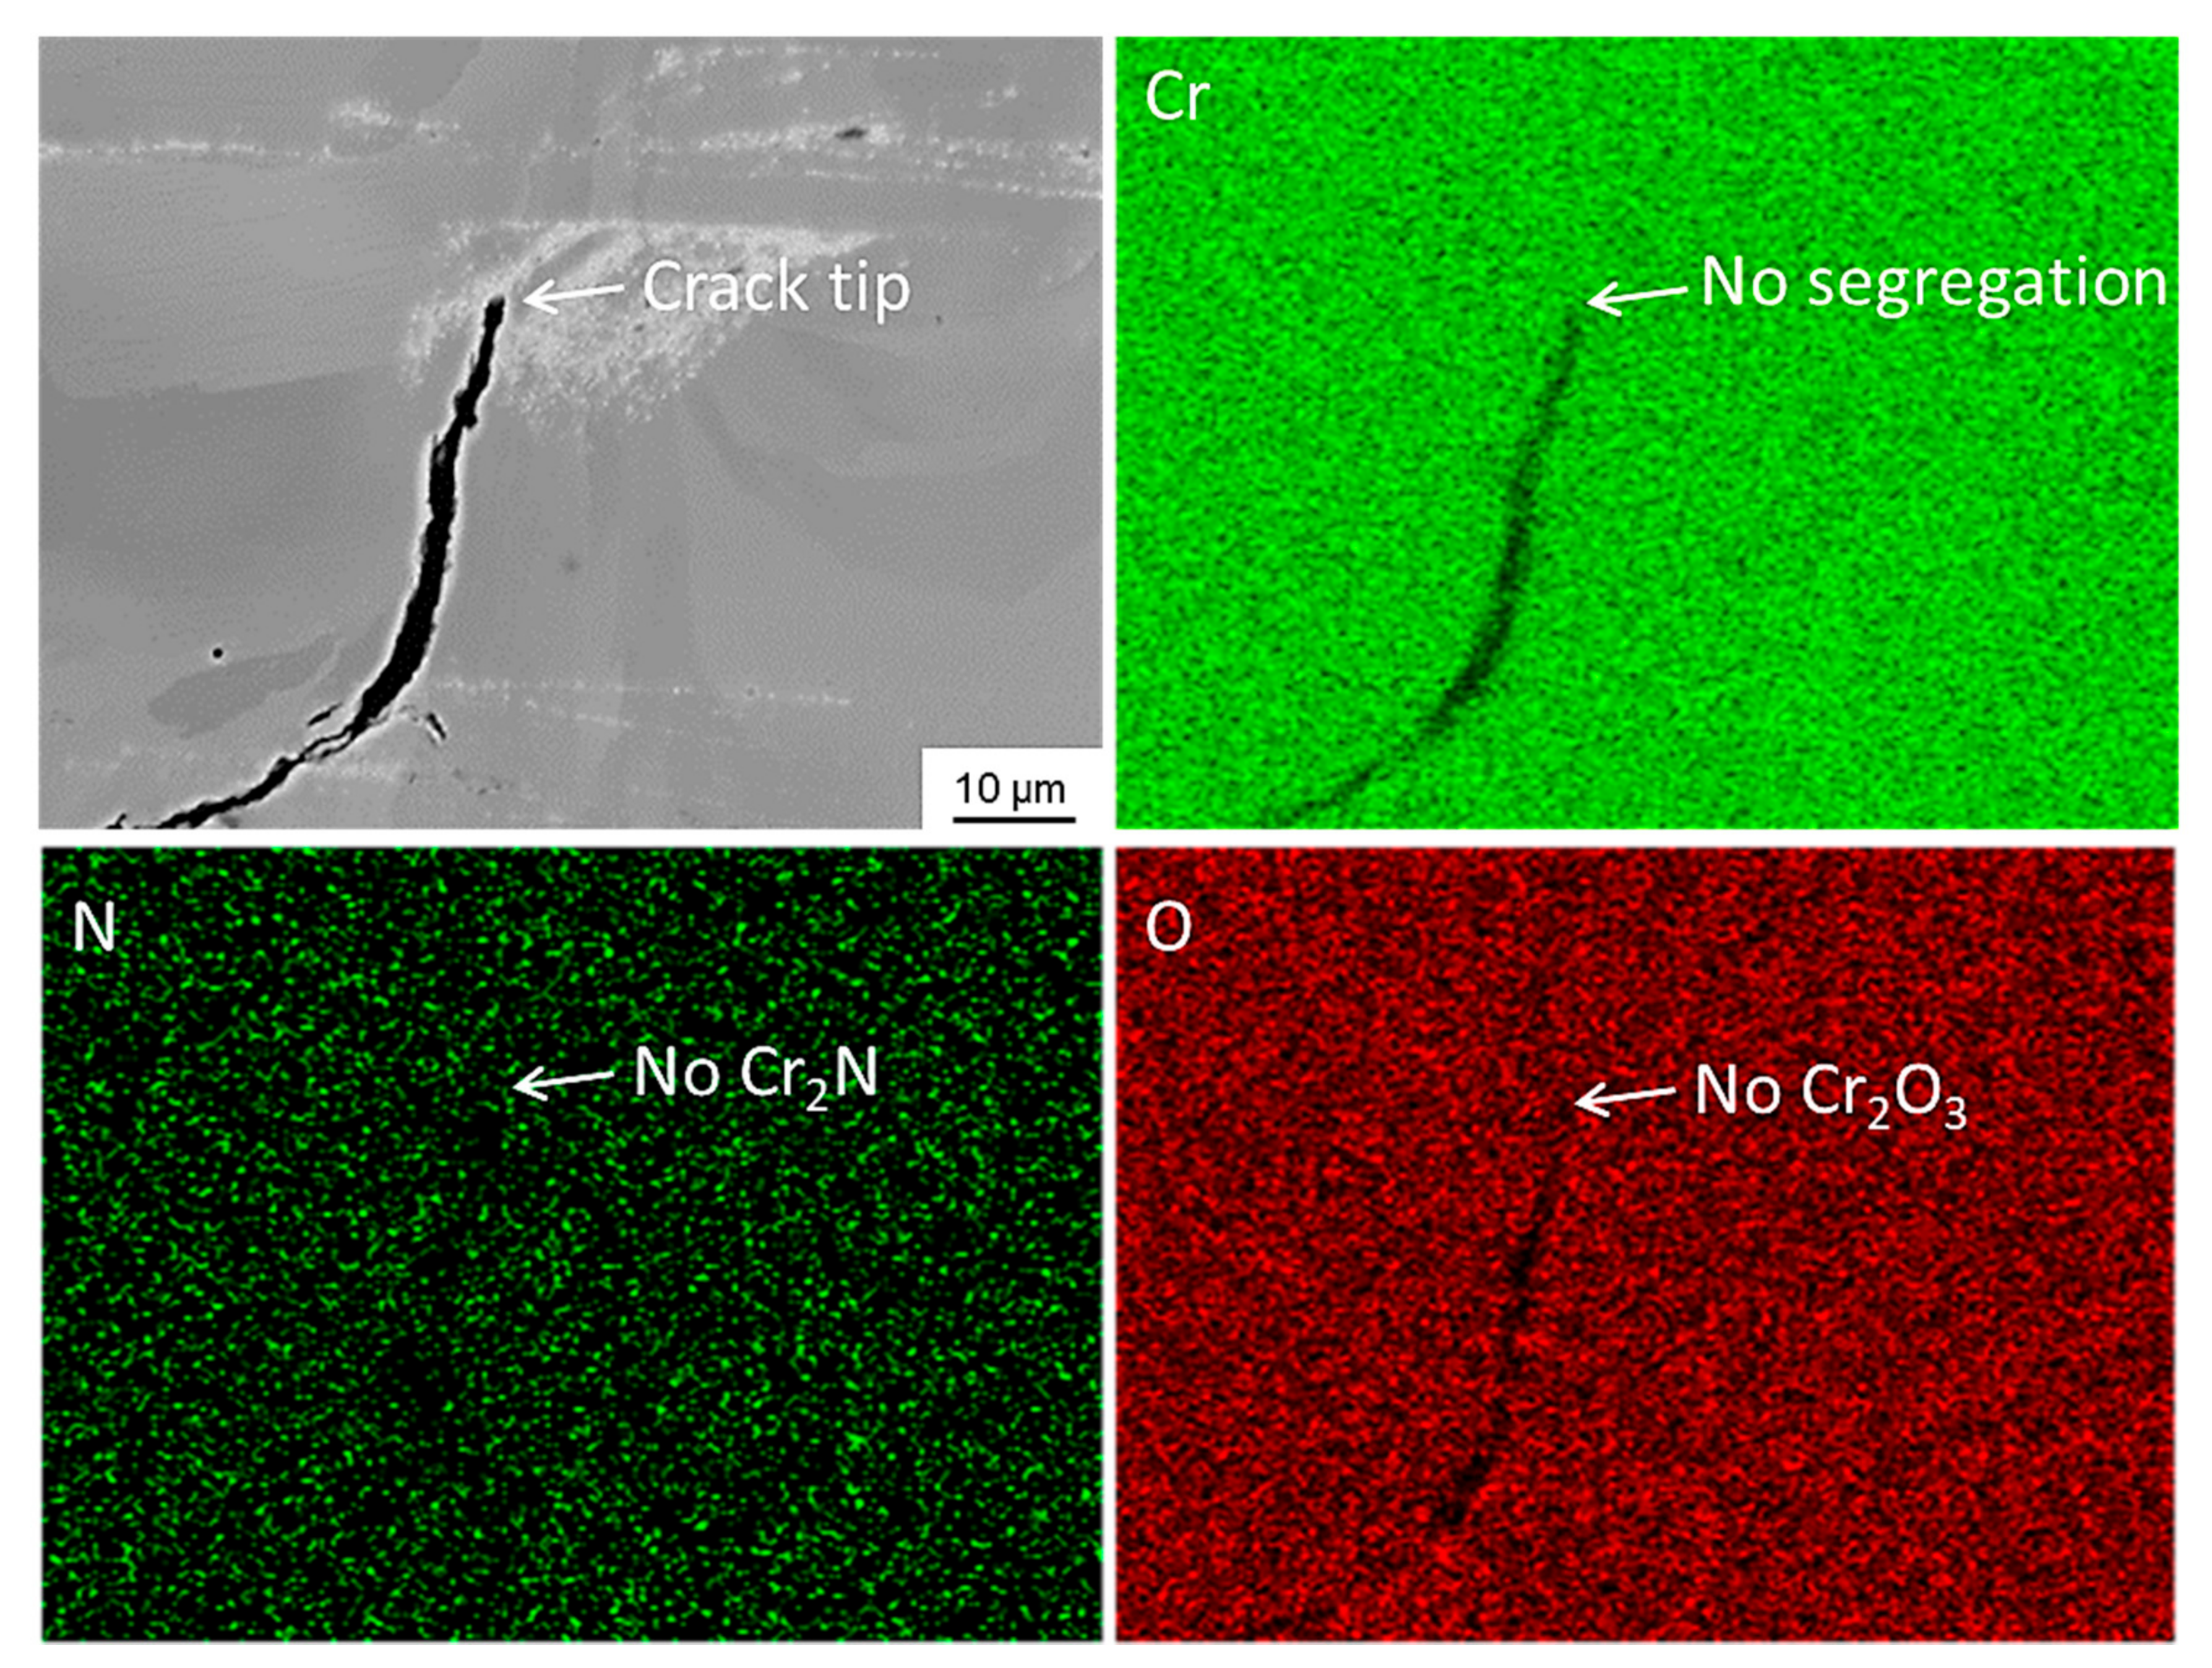
We previously reported Cr2O3 and Cr2N as oxidation products of pure Cr fabricated by LPBF [15]. Even though the LPBF fabrications were executed in a low-oxygen atmosphere, crack formation is still eventually observed because segregation of impurities and oxidation in the as-built specimen can provide fast channels where the dislocations would accumulate and increase the local strain [37]. Therefore, the chemical composition of the crack initiation and growth zone was confirmed by EDS mapping, as shown in Figure 8 representing crack in C10. However, there was no significant segregation or oxidation product to initiate crack formation in C10, which was expected to be the same in C5 specimens due to low oxygen content during the LPBF process. Thus, it can be concluded that crack initiation and growth in Cr specimens are related mainly to the HAGB ratio and residual stress rather than to inclusion or oxidation products.
Table 3 summarizes the effect of scan length on localized Vickers hardness and average hardness measured on the y–z plane of the as-built Cr specimens. The maximum hardness of 223 Hv was measured at the bottom of the C10 specimen. Similarly, the hardness at the bottom part of the C5 specimen exhibited the highest value. The consistency of the high hardness value at the bottom parts of the C10 and C5 specimens is observed due to the thermal expansion differences between the 316L baseplate and pure Cr, which has a high linear expansion coefficient at high temperatures. Thus, the gradual decrease in hardness of C5 from the bottom to the top layer can be explained by the decrease in residual stress regarding the uniform heat distribution with short scan length promoting less residual stress compared to the C10 specimen. In contrast, the C10 specimen exhibited higher hardness on top of the specimen than the average value, which was attributed to the accumulation of residual stress due to the long scan length. The slight decrease in the hardness of the center region in the case of C10 can be related to the difference in the distribution of residual stress. Some of the experimental and simulation studies showed that the top and bottom parts of additively manufactured parts are generally in the state of tensile stress, while the middle part is in the state of compressive stress [39,40].
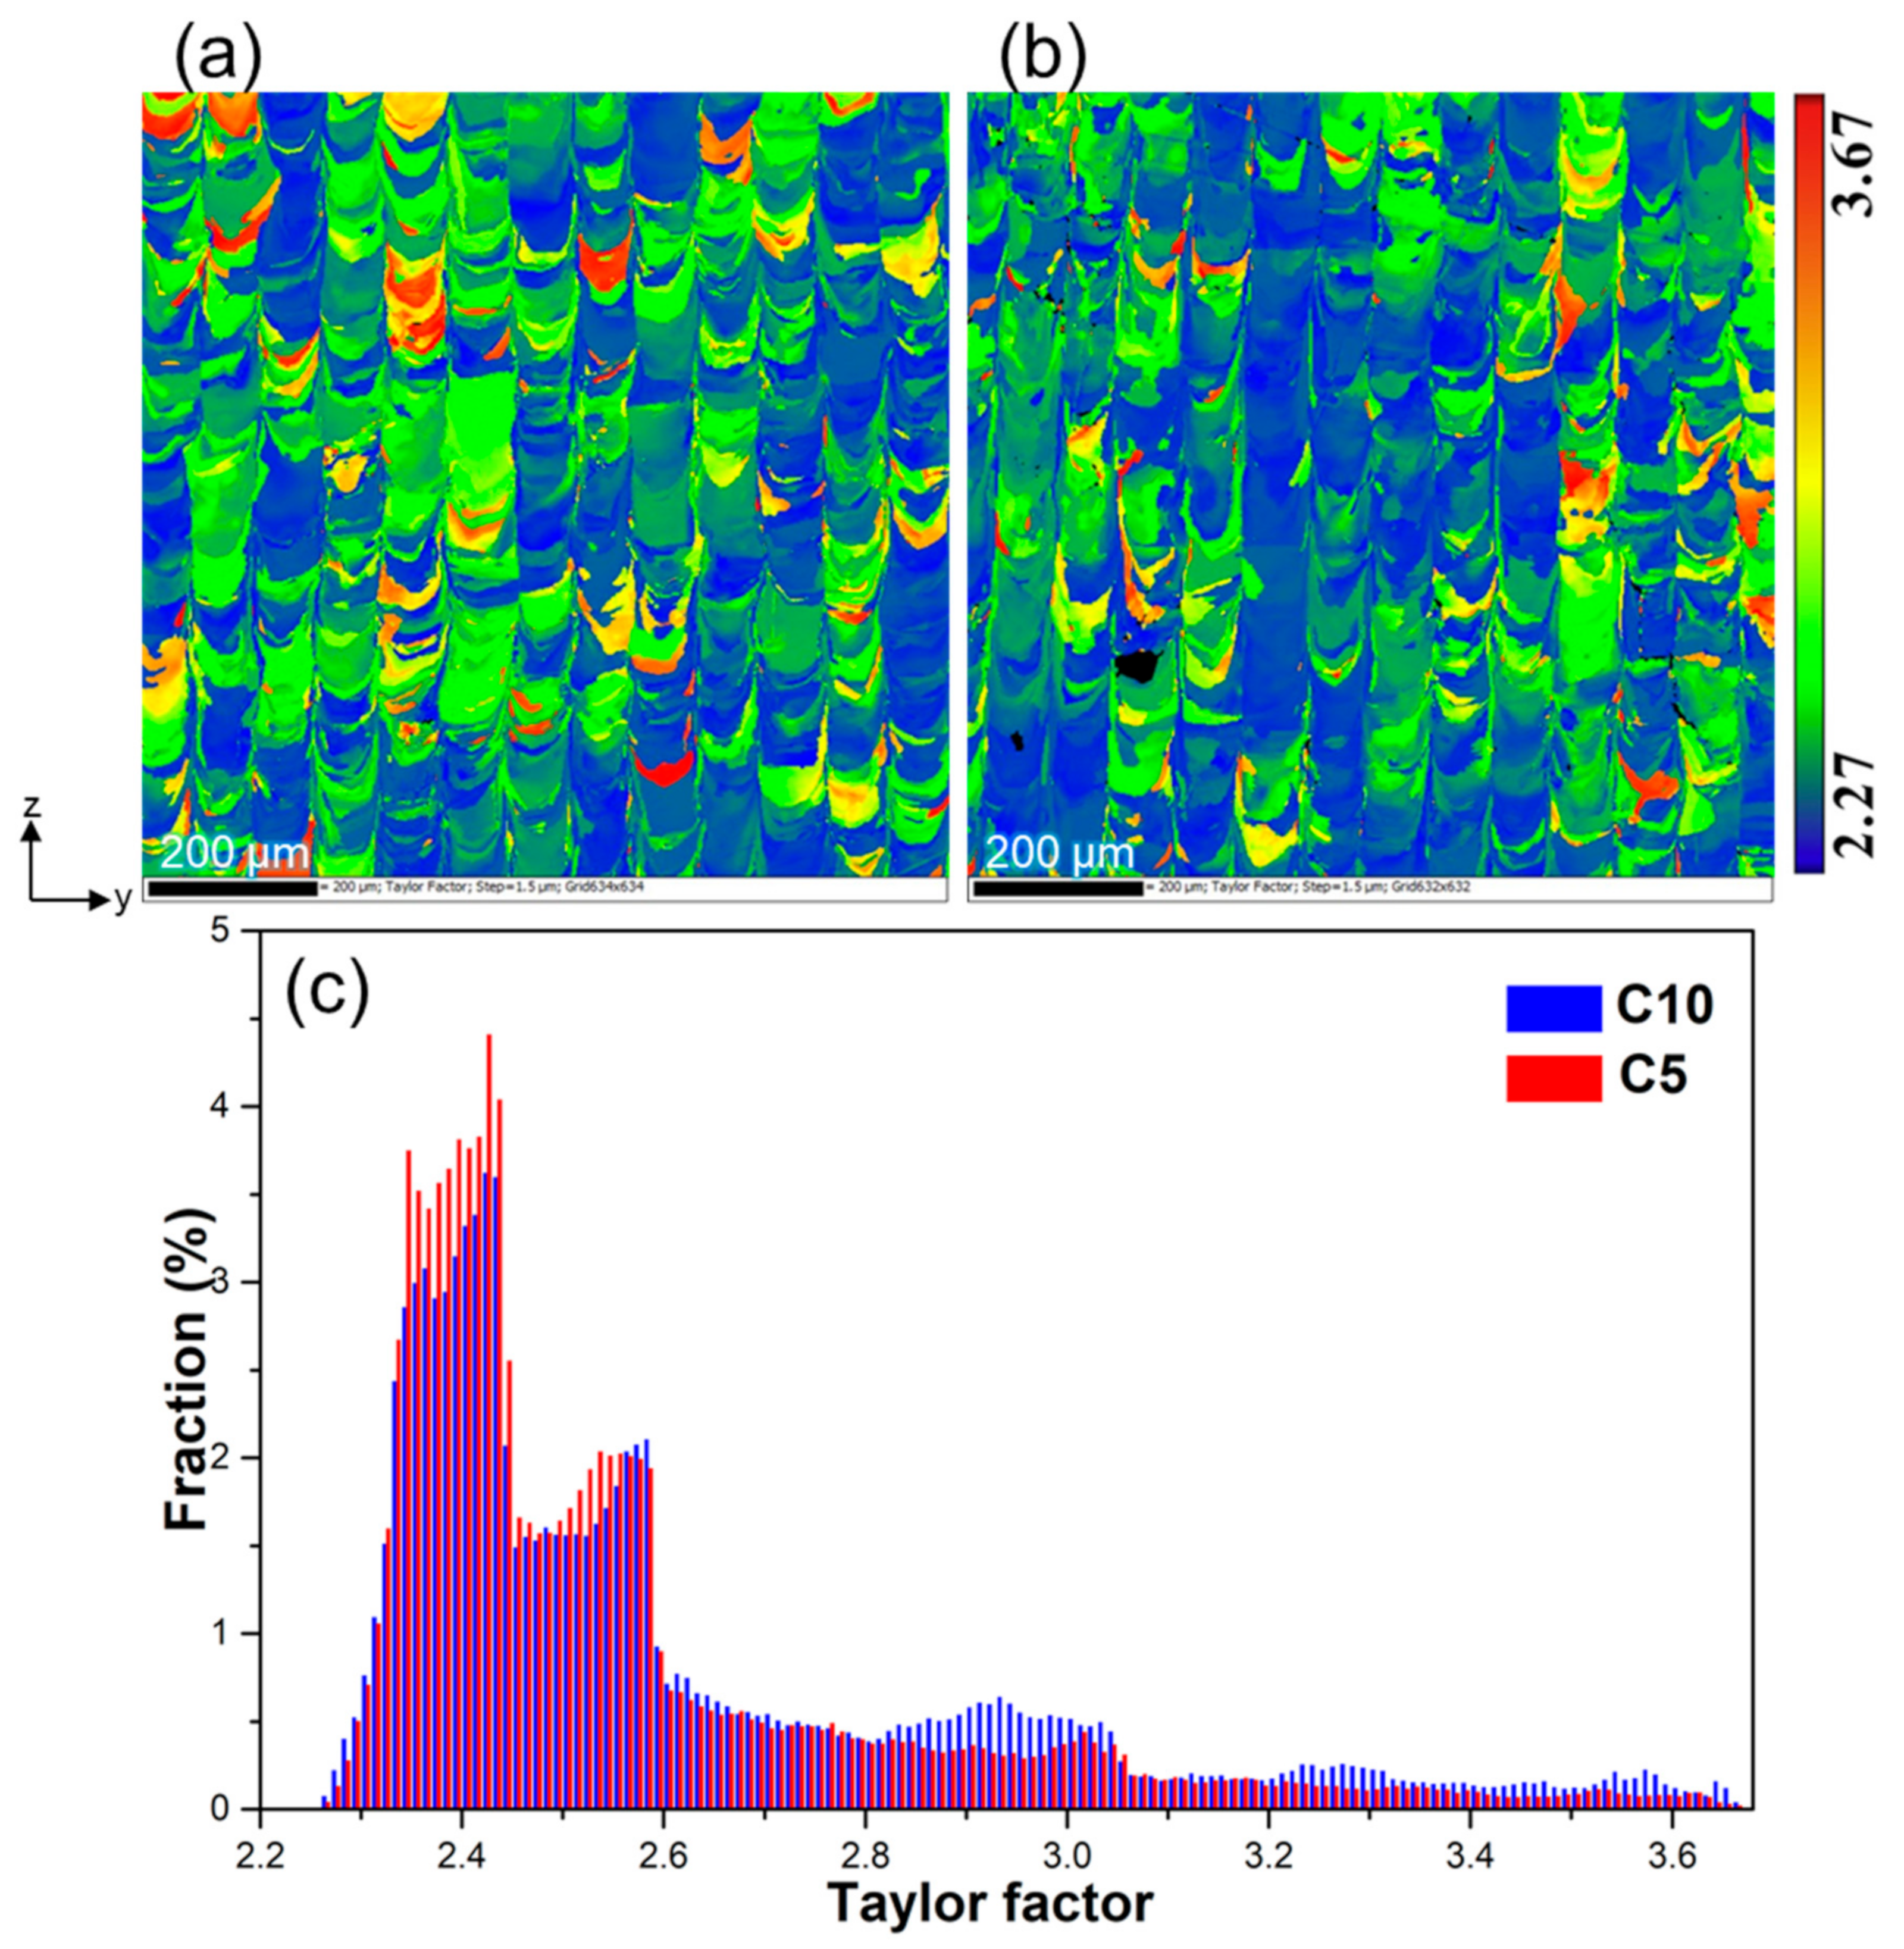
In the LPBF process, the large and non-uniform residual stresses are developed in the components owing to the very high cooling rate and inherent thermal gradient, which strongly affect the mechanical properties [28,31]. A detailed investigation of the mechanical properties of pure Cr fabricated by LPBF is in progress. However, the effect of residual stress on the mechanical properties of Cr specimens can be suggested based on the difference in the Taylor factors. Figure 9a,b present the Taylor factor mapping of the C10 and C5 specimens, respectively. In addition, Figure 9c compares the Taylor factor distributions of the C10 and C5 specimens, showing the average Taylor factors of 2.62 and 2.57 for the C10 and C5 specimens, respectively. The Taylor factor can be used to determine whether the grain is easily deformed during tensile deformation [41]; a higher Taylor factor indicates more resistance to plastic deformation. This indicates that the C10 specimens with a long scan length stored plastic strain higher than C5 specimens, indicating the difference in the residual stress intensity. Thijs et al. reported an increase in the average Taylor factor with an increase in plastic strain for LPBF-fabricated pure tantalum [42], which is consistent with the findings of this study for pure Cr. Wang et al. discussed the anisotropic residual stresses due to different scan strategies and recorded a higher Taylor factor for the scan strategy with higher residual stress formation [31]. As Boes et al. reported [43], there are various process parameters which affect the density of the as-built components such as process gas, but hot isostatic pressing as a second process can be suggested to improve the density while closing the pores and cracks in the components. Thus, the common approach to avoid cracking and enhance the mechanical properties is alloy design and process optimization as Sabzi et al. studied [44] for 316L stainless steel.
Among the significant approaches to improve the density without changing the composition is to reduce the scan length; this study highlighted its favorable effect on densification and texture formation in pure Cr components. However, the short scan length strategy improved the density of pure Cr to the level of 97.5%, although the industrial level component density is required to reach over 99.5% [43,44]. Thus, the density of the pure Cr requires further improvement for application in industrial components, which is challenging due to the DBTT characteristics of pure Cr.

4. Conclusions

Considering the novelty of LPBF-processed pure Cr reported for the first time by our group, herein, we investigated the improvement in the density of Cr components and strengthening texture using a scan length approach. The C5 specimen with short scan length promoted a stronger texture due to the uniform heat distribution with shorter time intervals between scan tracks, resulting in an increase in grain size and a decrease in the HAGB ratio. Moreover, the misorientation distribution of HAGBs also shifted towards lower angles when the component was fabricated with a short scan length; thus, these improvements in microstructural characteristics prevented crack initiation and propagation, establishing higher bulk density. The study in detailed thermal characteristics of the difference in scan lengths is in progress, which is planned to be reported elsewhere. This strategy can be applied for difficult-to-process metals and alloys such as Cr with a high DBTT characteristic to enhance the as-built quality to promote its use in the industry.

Author Contributions

Author Contributions: Conceptualization: O.G.; Investigation: O.G., T.T., R.S. and R.F.; Method-ology: T.I.; Project administration: T.N. (Takayoshi Nakano); Supervision: T.N. (Takayoshi Nakano); Validation: O.G.; Visualization: O.G.; Writing—original draft: O.G.; Writing—review and editing: T.I., T.N. (Takayuki Narushima) and T.N. (Takayoshi Nakano). All authors have read and agreed to the published version of the manuscript.

Funding

This work was supported by Grants-in-Aid for Scientific Research (JP18H05254) from the Japan Society for the Promotion of Science (JSPS). This work was also partly supported by the Cross-Ministerial Strategic Innovation Promotion Program (SIP), Materials Integration for Revolutionary Design System of Structural Materials, Domain C1: “Development of Additive Manufacturing Process for Ni-based Alloy” from the Japan Science and Technology Agency (JST).

Conflicts of Interest

The authors declare that they have no known competing financial interests or personal relationships that could have appeared to influence the work reported in this paper.

References

  1. Klopp, W.D. Recent developments in chromium and chromium alloys. JOM 1969, 21, 23–32. [Google Scholar] [CrossRef] [Green Version]
  2. Medvedeva, N.I.; Gornostyrev, Y.N.; Freeman, A.J. Carbon stabilized A15 Cr3Re precipitates and ductility enhancement of Cr-based alloys. Acta Mater. 2002, 50, 2471–2476. [Google Scholar] [CrossRef]
  3. Gu, Y.F.; Ro, Y.; Harada, H. Tensile properties of chromium alloyed with silver. Metall. Mater. Trans. A 2004, 35, 3329–3331. [Google Scholar] [CrossRef]
  4. Wilms, G.R.; Rea, T.W. Atmospheric contamination of chromium and its effect on mechanical properties. J. Less Common Met. 1959, 1, 152–156. [Google Scholar] [CrossRef]
  5. Henderson, F.; Quaass, S.T.; Wain, H.L. The fabrication of chromium and some dilute chromium-base alloys. J. Inst. Metals. 1954, 83, 4400440. [Google Scholar]
  6. Wang, P.; Lib, X.; Jianga, Y.; Nai, M.L.S.; Ding, J.; Wei, J. Electron beam melted heterogeneously porous microlattices for metallic bone applications: Design and investigations of boundary and edge effects. Addit. Manuf. 2020, 36, 101566. [Google Scholar] [CrossRef]
  7. Plocher, J.; Panesar, A. Review on design and structural optimisation in additive manufacturing: Towards next-generation lightweight structures. Mater. Des. 2019, 183, 108164. [Google Scholar] [CrossRef]
  8. Ishimoto, T.; Ozasa, R.; Nakano, K.; Weinmann, M.; Schnitter, C.; Stenzel, M.; Matsugaki, A.; Nagase, T.; Matsuzaka, T.; Todai, M. Development of TiNbTaZrMo bio–high entropy alloy (BioHEA) super–solid solution by selective laser melting, and its improved mechanical property and biocompatibility. Scr. Mater. 2021, in press. [Google Scholar] [CrossRef]
  9. Wang, P.; Li, X.; Luo, S.; Nai, M.L.S.; Ding, J.; Wei, J. Additively manufactured heterogeneously porous metallic bone with biostructural functions and bone-like mechanical properties. J. Mater. Sci. Technol. 2021, 62, 173–179. [Google Scholar] [CrossRef]
  10. Tancogne-Dejean, T.; Spierings, A.B.; Mohr, D. Additively-manufactured metallic micro-lattice materials for high specific energy absorption under static and dynamic loading. Acta Mater. 2016, 116, 14–28. [Google Scholar] [CrossRef]
  11. Wang, P.; Song, J.; Nai, M.L.S.; Wei, J. Experimental analysis of additively manufactured component and design guidelines for lightweight structures: A case study using electron beam melting. Addit. Manuf. 2020, 33, 101088. [Google Scholar] [CrossRef]
  12. Field, A.C.; Carter, L.N.; Adkins, N.J.E.; Attallah, M.M.; Gorley, M.J.; Strangwood, M. The effect of powder characteristics on build quality of high-purity tungsten produced via laser powder bed fusion (LPBF). Metal. Mater. Trans. A 2020, 51, 1367–1378. [Google Scholar] [CrossRef] [Green Version]
  13. Hu, Z.; Zhao, Y.; Guan, K.; Wang, Z.; Ma, Z. Pure tungsten and oxide dispersion strengthened tungsten manufactured by selective laser melting: Microstructure and cracking mechanism. Addit. Manuf. 2020, 36, 101579. [Google Scholar] [CrossRef]
  14. Hagihara, K.; Nakano, T.; Suzuki, M.; Ishimoto, T.; Sun, S.H. Successful additive manufacturing of MoSi2 including crystallographic texture and shape control. J. Alloy Compd. 2017, 696, 67–72. [Google Scholar] [CrossRef] [Green Version]
  15. Gokcekaya, O.; Hayashi, N.; Ishimoto, T.; Ueda, K.; Narushima, T.; Nakano, T. Crystallographic orientation control of pure chromium via laser powder-bed fusion and improved high temperature oxidation resistance. Addit. Manuf. 2020. [Google Scholar] [CrossRef]
  16. Yin, B.; Ma, H.; Wang, J.; Fang, K.; Zhao, H.; Liu, Y. Effect of CaF2 addition on macro/microstructures and mechanical properties of wire and arc additive manufactured Ti-6Al-4V components. Mater. Lett. 2017, 190, 64–66. [Google Scholar] [CrossRef]
  17. Bobbio, L.D.; Otis, R.A.; Borgonia, J.P.; Dillon, R.P.; Shapiro, A.A.; Liu, Z.-K.; Beese, A.M. Additive manufacturing of a functionally graded material from Ti-6Al-4V to Invar: Experimental characterization and thermodynamic calculations. Acta Mater. 2017, 127, 133–142. [Google Scholar] [CrossRef]
  18. Zhang, B.; Li, Y.; Bai, Q. Defect formation mechanisms in selective laser melting: A review. Chin. J. Mech. Eng. 2017, 30, 515–527. [Google Scholar] [CrossRef] [Green Version]
  19. Sims, C.T. The case for chromium. JOM 1963, 15, 127–132. [Google Scholar] [CrossRef]
  20. Wang, D.Z.; Li, K.L.; Yu, C.F.; Ma, J.; Liu, W.; Shen, Z.J. Cracking behavior in additively manufactured pure tungsten. Acta Metall. Sin. 2019, 32, 127–135. [Google Scholar] [CrossRef] [Green Version]
  21. Sidambe, A.T.; Tian, Y.; Prangnell, P.B.; Fox, P. Effect of processing parameters on the densification, microstructure and crystallographic texture during the laser powder bed fusion of pure tungsten. Int. J. Refract. Met. Hard Mater. 2019, 78, 254–263. [Google Scholar] [CrossRef]
  22. Malý, M.; Höller, C.; Skalon, M.; Meier, B.; Koutný, D.; Pichler, R.; Sommitsch, C.; Paloušek, D. Effect of process parameters and high-temperature preheating on residual stress and relative density of Ti6Al4V processed by selective laser melting. Materials 2019, 12, 930. [Google Scholar] [CrossRef] [PubMed] [Green Version]
  23. Xiong, Z.; Zhang, P.; Tan, C.; Dong, D.; Ma, W.; Yu, K. Selective laser melting and remelting of pure tungsten. Adv. Eng. Mater. 2020, 22, 1901352. [Google Scholar] [CrossRef]
  24. Wang, D.; Wu, S.; Yang, Y.; Dou, W.; Deng, S.; Wang, Z.; Li, S. The effect of a scanning strategy on the residual stress of 316L steel parts fabricated by Selective Laser Melting (SLM). Materials 2018, 11, 1821. [Google Scholar] [CrossRef] [PubMed] [Green Version]
  25. Phutela, C.; Aboulkhair, N.T.; Tuck, C.J.; Ashcroft, I. The effects of feature sizes in selectively laser melted Ti-6Al-4V parts on the validity of optimised process parameters. Materials 2019, 13, 117. [Google Scholar] [CrossRef] [Green Version]
  26. Cheng, B.; Shrestha, S.; Chou, K. Stress and deformation evaluations of scanning strategy effect in selective laser melting. Addit. Manuf. 2016, 12, 240–251. [Google Scholar] [CrossRef]
  27. Sun, S.-H.; Hagihara, K.; Nakano, T. Effect of scanning strategy on texture formation in Ni-25 at.%Mo alloys fabricated by selective laser melting. Mater. Des. 2018, 140, 307–316. [Google Scholar] [CrossRef]
  28. Fang, Z.-C.; Wu, Z.-L.; Huang, C.-G.; Wu, C.-W. Review on residual stress in selective laser melting additive manufacturing of alloy parts. Opt. Laser Technol. 2020, 129, 106283. [Google Scholar] [CrossRef]
  29. Li, C.; Fu, C.H.; Guo, Y.B.; Fang, F.Z. A multiscale modeling approach for fast prediction of part distortion in selective laser melting. J. Mater. Process. Technol. 2016, 229, 703–712. [Google Scholar] [CrossRef]
  30. Zhou, W.; Zhu, G.; Wang, R.; Yang, C.; Tian, Y.; Zhang, L.; Dong, A.; Wang, D.; Shu, D.; Sun, B. Inhibition of cracking by grain boundary modification in a non-weldable nickel-based superalloy processed by laser powder bed fusion. Mater. Sci. Eng. A 2020, 791, 139745. [Google Scholar] [CrossRef]
  31. Wang, Y.C.; Lei, L.M.; Shi, L.; Wan, H.Y.; Liang, F.; Zhang, G.P. Scanning strategy dependent tensile properties of selective laser melted GH4169. Mater. Sci. Eng. A 2020, 788, 139616. [Google Scholar] [CrossRef]
  32. Ishimoto, T.; Hagihara, K.; Hisamoto, K.; Sun, S.-H.; Nakano, T. Crystallographic texture control of beta-type Ti–15Mo–5Zr–3Al alloy by selective laser melting for the development of novel implants with a biocompatible low Young’s modulus. Scr. Mater. 2017, 132, 34–38. [Google Scholar] [CrossRef]
  33. Sun, S.-H.; Ishimoto, T.; Hagihara, K.; Tsutsumi, Y.; Hanawa, T.; Nakano, T. Excellent mechanical and corrosion properties of austenitic stainless steel with a unique crystallographic lamellar microstructure via selective laser melting. Scr. Mater. 2019, 159, 89–93. [Google Scholar] [CrossRef]
  34. Wu, A.S.; Brown, D.W.; Kumar, M.; Gallegos, G.F.; King, W.E. An experimental investigation into additive manufacturing-induced residual stresses in 316L stainless steel. Metall. Mater. Trans. A 2014, 45, 6260–6270. [Google Scholar] [CrossRef]
  35. Lu, Y.; Wu, S.; Gan, Y.; Huang, T.; Yang, C.; Junjie, L.; Lin, J. Study on the microstructure, mechanical property and residual stress of SLM Inconel-718 alloy manufactured by differing island scanning strategy. Opt. Laser Technol. 2015, 75, 197–206. [Google Scholar] [CrossRef]
  36. Dubrovinskaia, N.A.; Dubrovinsky, L.S.; Saxena, S.K.; Sundman, B. Thermal expansion of Chromium (Cr) to melting temperature. Calphad 1997, 21, 497–508. [Google Scholar] [CrossRef]
  37. Zhang, X.; Chen, H.; Xu, L.; Xu, J.; Ren, X.; Chen, X. Cracking mechanism and susceptibility of laser melting deposited Inconel 738 superalloy. Mater. Des. 2019, 183, 108105. [Google Scholar] [CrossRef]
  38. Wang, D.; Wang, Z.; Li, K.; Ma, J.; Liu, W.; Shen, Z. Cracking in laser additively manufactured W: Initiation mechanism and a suppression approach by alloying. Mater. Des. 2019, 162, 384–393. [Google Scholar] [CrossRef]
  39. Denlinger, E.R.; Gouge, M.; Irwin, J.; Michaleris, P. Thermomechanical model development and in situ experimental validation of the Laser Powder-Bed Fusion process. Addit. Manuf. 2017, 16, 73–80. [Google Scholar] [CrossRef]
  40. Vrancken, B.; Cain, V.; Knutsen, R.; Van Humbeeck, J. Residual stress via the contour method in compact tension specimens produced via selective laser melting. Scr. Mater. 2014, 87, 29–32. [Google Scholar] [CrossRef] [Green Version]
  41. Liu, S.Y.; Li, H.Q.; Qin, C.X.; Zong, R.; Fang, X.Y. The effect of energy density on texture and mechanical anisotropy in selective laser melted Inconel 718. Mater. Des. 2020, 191, 108642. [Google Scholar] [CrossRef]
  42. Thijs, L.; Montero Sistiaga, M.L.; Wauthle, R.; Xie, Q.; Kruth, J.-P.; Van Humbeeck, J. Strong morphological and crystallographic texture and resulting yield strength anisotropy in selective laser melted tantalum. Acta Mater. 2013, 61, 4657–4668. [Google Scholar] [CrossRef] [Green Version]
  43. Boes, J.; Röttger, A.; Theisen, W. Microstructure and properties of high-strength C + N austenitic stainless steel processed by laser powder bed fusion. Addit. Manuf. 2020, 32, 101081. [Google Scholar] [CrossRef]
  44. Sabzi, H.E.; Maeng, S.; Liang, X.; Simonelli, M.; Aboulkhair, N.T.; Rivera-Díaz-del-Castillo, P.E.J. Controlling crack formation and porosity in laser powder bed fusion: Alloy design and process optimisation. Addit. Manuf. 2020, 34, 101360. [Google Scholar] [CrossRef]
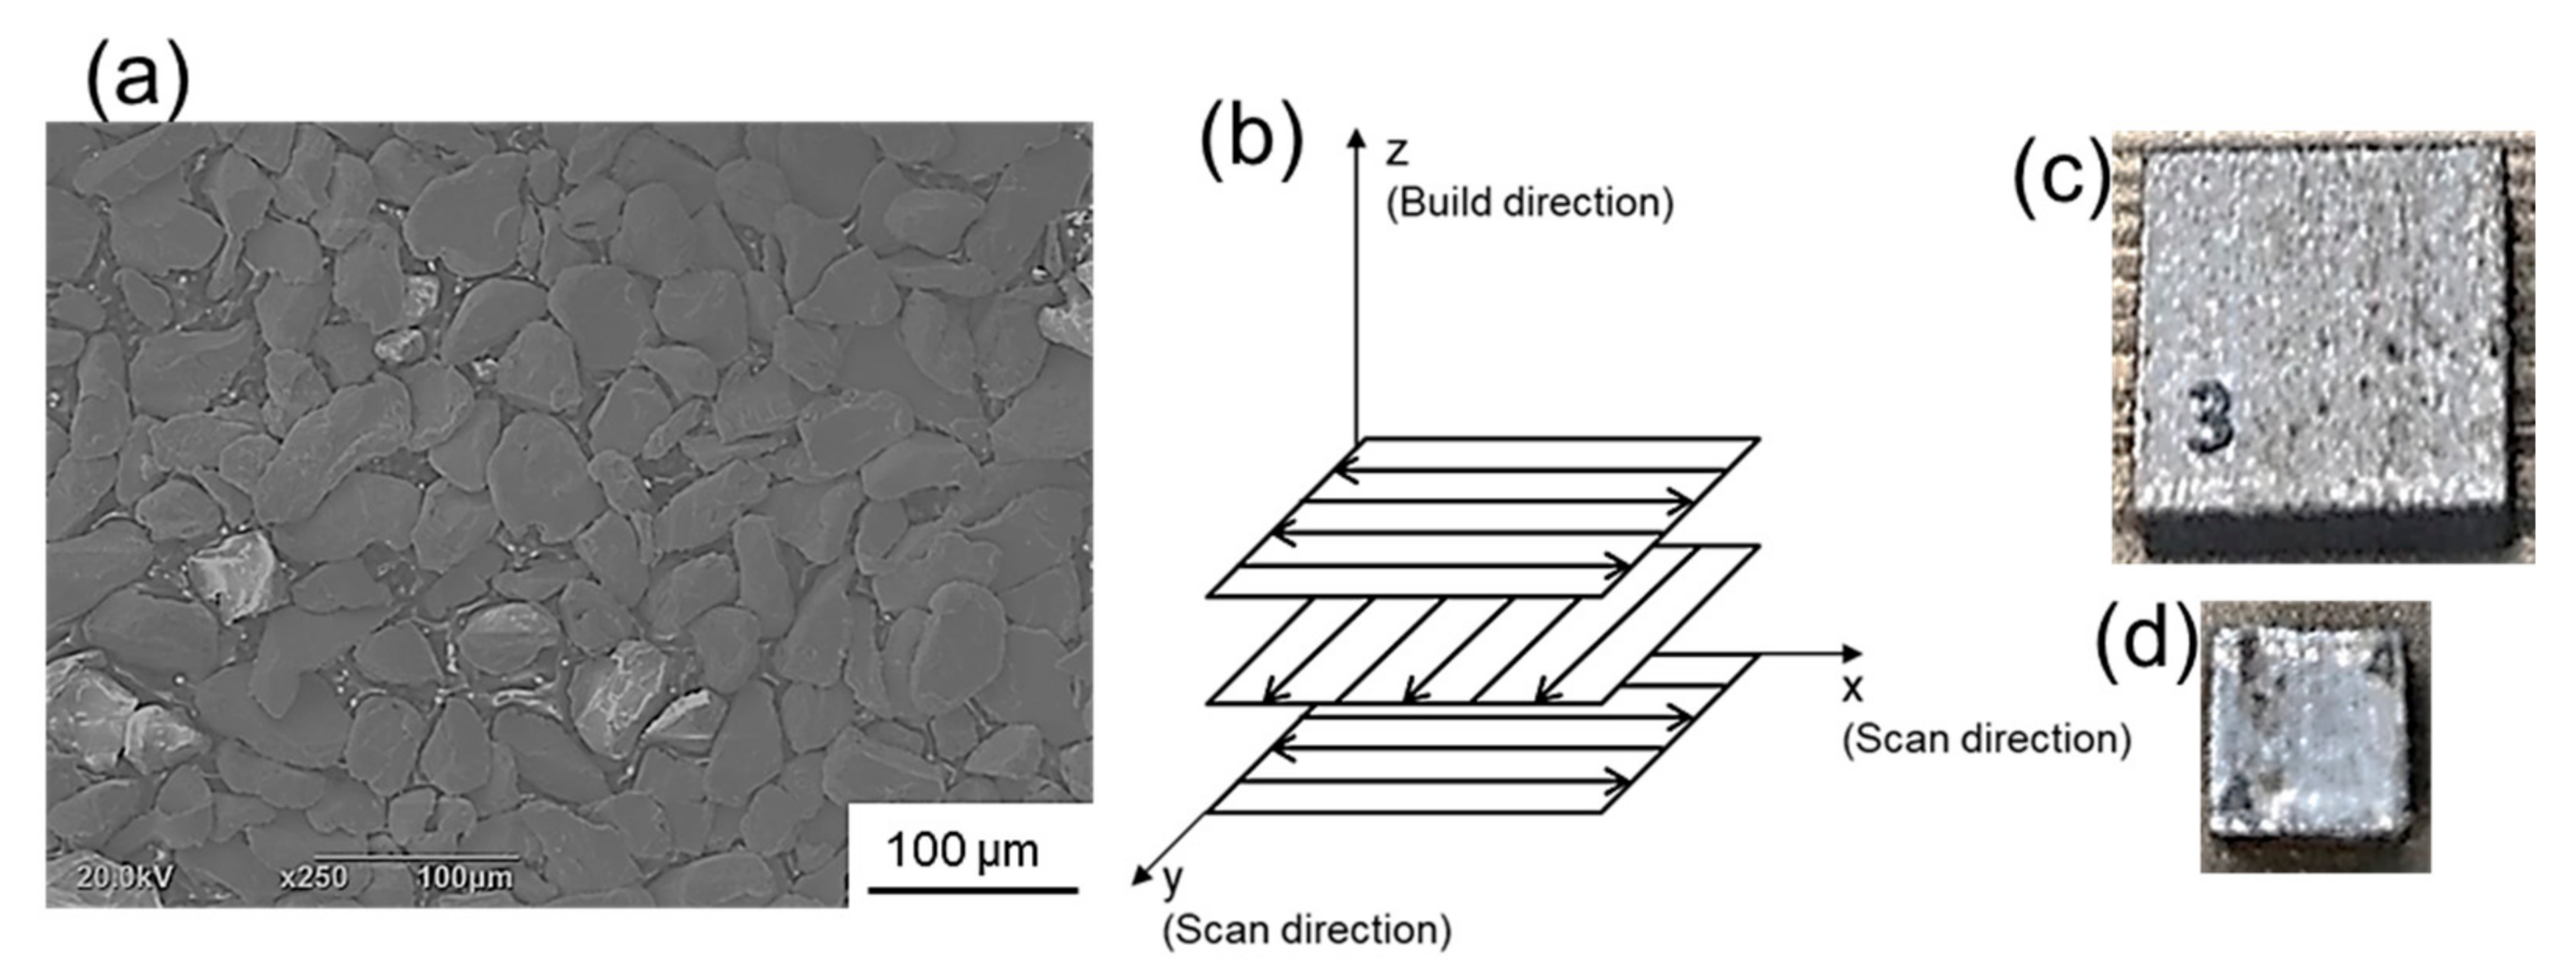
Figure 1. (a) Morphology of pure Cr powders used in laser powder bed fusion processing (LPBF), (b) schematic presentation of the laser scan strategy, and (c,d) appearance of as-built Cr specimens with dimensions of 10 × 10 × 5 mm and 5 × 5 × 5 mm along the x-, y-, and z-axes, respectively.
Crystals 11 00009 g001
Figure 2. y–z Cross sectional images of as-built Cr specimens fabricated by LPBF with (a) 10 × 10 mm and (b) 5 × 5 mm scan areas.
Crystals 11 00009 g002
Figure 3. Electron backscatter diffraction system (EBSD) inverse pole figure (IPF) maps showing variation in the texture of as-built Cr for (a) long scan length and (b) short scan length with corresponding (c,d) HAGB maps and (e,f) {100} pole figures for the y–z plane.
Crystals 11 00009 g003
Figure 4. Texture ratio of as-built Cr components with long scan length (C10) and short scan length (C5).
Crystals 11 00009 g004
Figure 5. (a) Grain size and (b) HAGB distributions in y–z plane of as-built Cr components with long scan length (C10) and short scan length (C5).
Crystals 11 00009 g005
Figure 6. EBSD analysis including (a) band contrast (BC) map with corresponding (b) IPF map, (c) HAGB map, and (d) kernel average misorientation (KAM) map of as-built Cr components with long scan length (C10).
Crystals 11 00009 g006
Figure 7. EBSD analysis including (a) BC map with corresponding (b) IPF map, (c) HAGB map, and (d) KAM map of as-built Cr components with short scan length (C5).
Crystals 11 00009 g007
Figure 8. Energy dispersive X-ray spectroscope (EDS) map of as-built Cr components with long scan length (C10) exhibiting no segregation or impurity considering Cr, N, and O distribution.
Crystals 11 00009 g008
Figure 9. Taylor factor maps of as-built Cr components with (a) long scan length (C10) and (b) short scan length (C5). (c) The distribution of the Taylor factor of C10 and C5 specimens.
Crystals 11 00009 g009
Table 1. Abbreviations and corresponding linear energy, feature size, and scan lengths of Cr specimens fabricated by LPBF.
AbbreviationLinear Energy
Density
Feature SizeScan Length
(mm)
C100.510 × 10 × 5x = 10 mm,
y = 10 mm
C50.55 × 5 × 5x = 5 mm,
y = 5 mm
Table 2. Relative and optical densities of as-built Cr specimens with corresponding crack density, average grain size, high-angle grain boundary (HAGB) density, and texture strength.
Relative Density
(%)
Optical Density
(%)
Crack Density
(%)
Average
Grain Size (µm)
HAGB Density
(%)
Max MUD
C1095.596.72.817.327.94.7
C597.497.61.917.924.16.2
Table 3. Average hardness values and distribution with respect to the position in as-built Cr specimens.
Average Hardness (Hv)Hardness (Hv)
BottomCenterTop
C10221223218222
C5203218204187
Publisher’s Note: MDPI stays neutral with regard to jurisdictional claims in published maps and institutional affiliations.