Abstract
Hydrocalumite is a layered double hydroxide (LDH) that is finding increased application in numerous scientific fields. Typically, this material is produced through environmentally polluting methods such as co-precipitation, sol-gel synthesis and urea-hydrolysis. Here, the hydrothermal green (environmentally friendly) synthesis of hydrocalumite (CaAl-OH) from Ca(OH)2 and Al(OH)3 in water and the parameters that influence its formation are discussed. The parameters investigated include the reaction temperature, reaction time, molar calcium-to-aluminium ratio, the morphology/crystallinity of reactants used, mixing and the water-to-solids ratio. Hydrocalumite formation was favoured in all experiments, making up between approximately 50% and 85% of the final crystalline phases obtained. Factors that were found to encourage higher hydrocalumite purity include a low water-to-solids ratio, an increase in the reaction time, sufficient mixing, the use of amorphous Al(OH)3 with a high surface area, reaction at an adequate temperature and, most surprisingly, the use of a calcium-to-aluminium ratio that stoichiometrically favours katoite formation. X-ray diffraction (XRD) and Rietveld refinement were used to determine the composition and crystal structures of the materials formed. Scanning electron microscopy (SEM) was used to determine morphological differences and Fourier-transform infrared analysis with attenuated total reflectance (FTIR-ATR) was used to identify possible carbonate contamination, inter alia. While the synthesis was conducted in an inert environment, some carbonate contamination could not be avoided. A thorough discussion on the topic of carbonate contamination in the hydrothermal synthesis of hydrocalumite was given, and the route to improved conversion as well as the possible reaction pathway were discussed.
1. Introduction
Hydrocalumite (HC) is a CaAl-LDH with the general formula
where x is the ratio of trivalent to total cations in the layered double hydroxide (LDH) lattice, X is the interlayer anion, q its charge and n the amount of water present in the interlayer [1]. As a result of its corrugated-iron-like structure, the ratio of Ca:Al is limited to 2:1 (x = 0.) [2]. In nature, HC occurs with chloride and hydroxide anions in the interlayer, but many other anions can be intercalated.
HC is used in numerous scientific fields, including catalysis [3,4,5], sensors [6,7], medical applications [8,9], environmental remediation [10,11,12], agriculture [13], polymers [6,14,15] and occurs in cementitious phases during curing [16]. As with other LDHs for study in applications, this material is typically produced using co-precipitation—the most widely used synthesis technique for LDHs [1,17]. While co-precipitation has many advantages, such as simplicity, speed and high tailorability of the materials produced, it is also one of the most polluting synthesis methods available to produce LDHs, causing large amounts of salt-rich waste water.
Co-precipitation synthesis utilises a mixture of metal salts (typically metal chlorides, nitrates or sulphates) and a base (frequently NaOH or KOH) which are added dropwise to a beaker, typically containing the anion to be intercalated. While many derivatives of this method exist, the basic concept remains. During synthesis, LDH precipitates out of solution. After synthesis, this precipitate must be filtered from the resulting slurry to further process the material. During filtering, large amounts of water are used to wash the filtrate liquor—that would otherwise dry with the LDH filter cake and contaminate the final product—out of the material. Depending on the chemicals used, the resulting filtrate can be rich in sodium or potassium and chlorides, nitrates or sulphates and, of course, excess intercalant ions. In addition to large-scale environmental pollution associated with these untreated waste-streams (if released to the environment), the chemicals required for the synthesis of LDHs are expensive. Considering worsening environmental pollution and the drive to reduce the impact of the chemical industry on the environment, it has become evermore important to find alternative syntheses for these materials.
There exist a multitude of synthesis routes to produce LDHs. Urea hydrolysis and sol-gel syntheses are often used. These methods use urea (for urea hydrolysis) or metal alkoxides, alcohol and acids as chelating agents (for sol-gel synthesis). While these are not environmentally friendly alternatives to co-precipitation, attempts have been made to make sol-gel synthesis more environmentally-friendly [18]. In addition to these, there exist less frequently used methods that can be used in an environmentally friendly manner, such as hydrothermal or mechanochemical synthesis. In both methods, metal hydroxides or metal oxides are common starting materials that are mixed with water and processed at elevated temperatures and pressures (hydrothermal method) or milled together (mechanochemical synthesis). Use of the metal hydroxides and oxides as starting materials is hereby key to producing less polluting waste streams. In previous work, we have shown that the hydrothermal process can produce very pure phases of MgAl-LDH, even with a recycle-based system that reduces waste-streams [19]. It has been shown that mechanochemical synthesis (wet-milling) of Ca(OH)2 and Al(OH)3 could lead to an HC-phase content similar to that achieved in this work [20].
HC has been synthesised using a hydrothermal method in previous works, with a great interest in the effects of the presence of CaO/Ca(OH)2 and Al(O)OH/Al(OH)3/Al2O3 in presence of water and CO2 on the curing of cement [16,21,22,23]. In fact, some of the earliest reports concerning the study of the material and its characterisation used a hydrothermal synthesis [22,24,25]. HC is especially well suited to hydrothermal synthesis because of the metal oxides and hydroxides that can be used at mild conditions to produce the desired phase. In these early reports of hydrothermal HC synthesis and related studies, HC (also frequently referred to in cement and concrete literature as tetracalcium monocarboaluminate, a carbonate intercalated CaAl-LDH) was synthesised using several approaches. Ref. [25] synthesised HC by reacting Ca(OH)2, Al(OH)3 and CaCO3 in water for one month at 2 kbar and at 100 C. Ref. [26] prepared HC using different sources of aluminium (gibbsite and boehmite) and CaCO3 (with different surface areas and particle sizes), and Ca(OH)2 at varying temperatures and reacting the mixture for 24 h to 48 h. They also did a small study on the effect of temperatures between 70 C and 90 C, and found that the largest fraction of HC is formed at 80 C. It was found that the reaction temperature significantly affects the product formed, being HC or katoite (Ca3Al2(OH)12). In our own study of the effect of temperatures between 30 C and 90 C on the hydrothermal synthesis of HC using Ca(OH)2 and highly crystalline Al(OH)3, similar results were obtained [27]. Ref. [28] investigated the crystal structure and phase transitions in HC from −115 C to 45 C. They used Ca(OH)2, Al(OH)3, CaCl2·6H2O and CaCO3 to create single crystals at 120 C and 2 kbar in two months. They prepared powder HC samples by reacting Ca3Al2O6, CaCl2·6H2O and CaCO3 in water at room temperature and under inert atmosphere for four weeks. Ref. [29] synthesised HC using CaO, Al2O3 and K2CO3 within an hour at 100 C with microwave irradiation assistance. There also exist several thermodynamic studies [21,22,23,24] and studies concerning pressure-induced reactions [16] in the system CaO-Al2O3-H2O. These studies have shown that the species formed can be similar to HC [24]. Ref. [3] used a carbonate-free approach for the synthesis of HC by reacting Ca(OH)2 and Al(O)OH in water under an inert atmosphere at 80 C for 3 h. However, it was shown that the calcium hydroxide used for synthesis was contaminated with calcite. No FTIR analysis was conducted to determine the interlayer anions, but preparation of the HC-like compounds with nitric acid led to the formation of a pure HC-like phase similar to nitrate intercalated HC.
From the above literature it is evident that several attempts on the hydrothermal synthesis of HC have been made; however, most of these attempts were either time-intensive or time- and energy-intensive, because of the long reaction times, temperatures and pressures required. Further, most work has focused on the synthesis of a carbonate-intercalated LDH. To create a CaAl-CO3-LDH, a carbonate source is required during synthesis. In others works, this was achieved using CaCO3 or K2CO3. However, as carbonate uptake is favoured, it is difficult to reverse. As many HC applications have anion-exchange reactions as a subsequent step or end goal, the presence of carbonate is frequently undesirable. Removing the interlayer carbonate, usually involves calcination—a process that may alter the structure and morphology of the LDH, which can be undesirable. Thus, this contribution focuses on the preparation of CaAl-OH-LDH by using Ca(OH)2, Al(OH)3 and water under low-temperature and atmospheric-pressure conditions. The purpose of this paper is to investigate whether it is possible to achieve a high purity HC using hydrothermal synthesis with this minimal number of chemicals and at which synthesis conditions this is possible, if at all. Several parameters can influence the hydrothermal synthesis of HC, these being temperature, time, molar calcium-to-aluminium ratio, chemical morphology/crystallinity of the reactants, mixing and the water-to-solids ratio used. The influence of these on the conversion of reactants to HC will be discussed in the following text.
2. Results
The method chosen leads to a self-regulated-pH synthesis through a dissolution-precipitation mechanism. The only externally variable parameters during the reaction are those that will be discussed in this paper (temperature, time, molar calcium-to-aluminium ratio, mixing, chemical morphology/crystallinity and water-to-solids ratio) and the use of other reactants, such as oxides, etc. which will not be discussed here. In addition to these, the chosen system was self-contained. During the synthesis, the system remained in an inert atmosphere to mitigate atmospheric carbonate contamination. The synthesis pH was sampled at regular intervals and was recorded continuously during some syntheses.
2.1. The Standard LDH and Its Carbonate Form
One LDH was common between all sets of experiments, with it synthesised at 80 C for 3 h, a stirring speed of 750 rpm, a water-to-solids ratio of 80:20, at a molar calcium-to-aluminium ratio of 4:2 and using amorphous aluminium hydroxide (SA).
The standard sample was synthesised in triplicate to determine the repeatability of the synthesis method used and the trustworthiness of the Rietveld refinement applied to the wet-phase XRD data. The XRD and FTIR-ATR results for the standard LDHs are shown in Figure 1a,b, respectively.
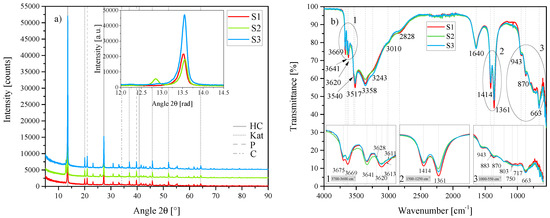
Figure 1.
(a) XRD results of the three standard hydrocalumite (HC) layered double hydroxides (LDHs) S1, S2 and S3 between 5 2 and 90 2. Each scan is y-shifted by 2500 counts. The inset depicts the primary LDH peaks and change in position. HC = hydrocalumite, Kat = katoite, P = portlandite and C = calcite. (b) FTIR-ATR scans of the three standard HC LDHs S1, S2 and S3 between 4000 and 550 . The three insets show the regions: (1) 3700 –3600 , (2) 1500 –1250 , (3) 1000 –550 in detail. Dashed and solid grey lines indicate the maxima of vibrations.
As a result of cation ordering and interlayer offsets, HC is typically presented in monoclinic form but has also been found in nature in the 6T polytype [2]. Other polytypes also exist, especially in the synthetically produced HCs, although a comprehensive review of all different polytypes of HC is lacking. The standard HCs were best described by HC of the formula [Ca4Al2(OH)12][(CO3)·5H2O] in the anorthic (triclinic) crystal system and P1 space group with crystal parameters a = 5.7747 Å, b = 8.4689 Å and c = 9.9230 Å (reference code: 98-005-9327). The XRD patterns of the three standard HC LDHs were very similar with the exception of S2 which had a secondary phase that could not be identified. Contaminants of katoite (Ca3Al2(OH)12), portlandite (Ca(OH)2) and calcite (CaCO3) were found in all three LDHs to varying degrees.
FTIR-ATR analysis showed that the standard HC LDHs S1, S2 and S3 all portrayed almost identical vibrational responses at 3675 , 3669 , 3641 , 3620 , 3540 , 3517 , 3358 , 3243 , 3010 , 2828 , 1640 , 1414 , 1361 , 943 , 883 , 870 , 803 , 750 , 717 and 663 . Typically, for LDHs, vibrations in the region between 3700 and 2500 are ascribed to OH str. vibrations of hydroxides bonded to the metal ions, of interlayer water or of water bonded to carbonate in the interlayer region. Ref. [30] assigned the vibrations around 3500 and 3305 to the Al–OH str. and Ca–OH str. vibration in the brucite-like lattice, respectively and the vibrations around 3100 and between 2915 and 2935 to the OH str. vibrations of interlayer water and water bonded to interlayer carbonate, respectively. A similar assignment has been made for MgAl-LDHs, spanning different synthesis methods [31]. Thus, the vibrations at 3517 , 3358 , 3243 and 3010 were assigned to the OH str. vibrations of Al–OH and Ca–OH bonds, and interlayer H2O and CO32− bonded to interlayer H2O, respectively. The vibration at 3641 could be assigned to the remaining portlandite in the samples (see Figure 2b). Some of the other vibrations between 3700 and 3500 have been observed in spectra of gibbsite (Al(OH)3) [32] and have also been ascribed to different OH species [26]. The vibration at 2828 could be a combination band as mentioned by [31]. On the lower end of the spectrum, the vibration at 1640 could be present due to both, vibrations of interlayer anions (such as hydroxides or carbonates) and (H2O) [31,32]. The vibration at 1414 corresponds strongly to calcite (see Figure 2b) and is frequently assigned with 1365 as the doublet (CO32−) vibration [33]. However, [31] have found this vibration to also correspond to the vibration of the interlayer anion (for both, CO32− and OH-). The vibrations at 943 , 870 , 717 and 663 could be assigned to (OH), (CO32−) (interlayer and contaminant CaCO3), contaminant CaCO3 and (CO32−), respectively. Vibrations at 803 and 750 have been observed in gibbsite spectra but remained unassigned [32]. The vibration at 803 has also previously been assigned to katoite [26].
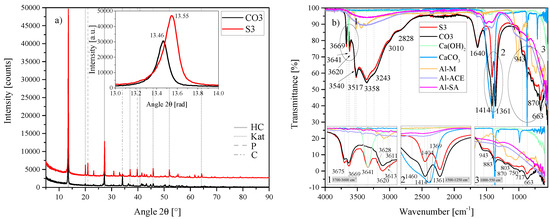
Figure 2.
(a) XRD results of the HC-CO3-LDH plotted against the standard HC LDH S2 between 5 2 and 90 2. Each scan is y-shifted by 2500 counts. The inset depicts the primary LDH peaks and change in position. HC = hydrocalumite, Kat = katoite, P = portlandite and C = calcite. (b) FTIR-ATR scans of the HC-CO3-LDH plotted against the standard HC LDH S2 and the starting materials used (Al(OH)3, Ca(OH)2 and CaCO3) between 4000 and 550 . The three insets show the regions: (1) 3700 – 3600 , (2) 1500 – 1250 , (3) 1000 – 550 in detail. Dashed and solid grey lines indicate the maxima of vibrations.
The best-fit crystal structure of HC—as identified by XRD—contained carbonate in the interlayer, contrary to the carbonate-free synthesis utilised. Although this, of course, is not evidence enough of carbonate intercalation, FTIR also showed the existence of carbonate-related vibrations. An HC LDH containing carbonate (sample ID: CO3) was, therefore, synthesised, the characteristics of which are shown in Figure 2.
The standard and CO3 specimens had the anorthic [Ca4Al2(OH)12][(CO3)·5H2O] phase as best fit (Figure 2a). However, the primary reflection of CO3 proved to be shifted to the left of that of S3. The FTIR-ATR results (Figure 2b) showed that some differences exist between these two phases. Synthesis of HC-CO3-LDH was conducted with adjustment for the stoichiometric amount of CO32− required through replacement of Ca(OH)2) with CaCO3. No Ca(OH)2 was detected at the end of this synthesis but a large amount of CaCO3 remained. This is clearly evident on the FTIR scans (Figure 2b) through an increase in vibration strength at 1414 , 870 , 717 and 663 , and the disappearance of the vibration at 3641 .
Rietveld refinement of S1 and S3 showed that a material consisting of approximately 60% HC could be obtained, the rest being katoite (approximately 28%), portlandite (approximately 10%) and calcite (approximately 2%). No Rietveld refinement could be performed on S2 due to the presence of the unidentifiable phase. CO3 consisted of approx 70% LDH, 10% katoite and 20% calcite. The analysis of S3 will be used for comparative purposes in the remainder of the text.
Figure 3 depicts the micrographs obtained for S1, S2, S3, CO3 and the Ca(OH)2, Al(OH)3 and CaCO3 used in the synthesis.
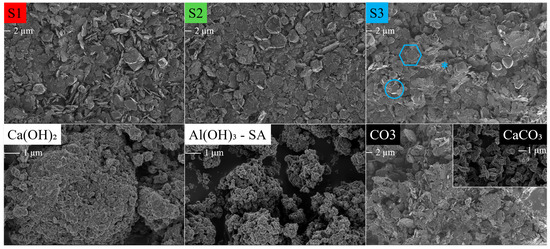
Figure 3.
SEM micrographs of the HC LDHs S1, S2, S3 and CO3 at 1 keV and 2k magnification, and Ca(OH)2, Al(OH)3-SA (amorphous) and CaCO3 at 1 kEV and 10k magnification. The scale bar is indicated under the label. LDH: turquoise hexagon, katoite: turquoise circle, calcite: turquoise asterisk.
LDH platelet formation was evident in all of the synthesised materials in Figure 3 and constituted the majority of the identifiable phase with thin, large hexagonal platelets, typically with an elongated facet. Katoite was visually identifiable as faceted garnet-like balls and calcite as cubic crystals. Small particulate matter was present in all samples, sticking on the LDH platelets and other phases and sometimes forming small agglomerates. This could be either Ca(OH)2 or Al(OH)3 left over. While no left-over Al(OH)3 was identified through XRD (unsurprisingly, since an amorphous Al(OH)3 was used in the synthesis) it is possible that the small structures are either portlandite or amorphous Al(OH)3, which proved to be similar in size and appearance. SEM showed that CO3 consisted of smaller platelets than the standard LDHs. It was also more difficult to find remnants of the left-over CaCO3 used, even though this LDH consisted of 72.47% LDH, 9.24% katoite and 18.29% calcite, according to Rietveld refinement. This could be attributed to the CaCO3 consisting of ill-defined oblong shapes that would be difficult to identify on SEM micrographs. It does, however, introduce a difference between the calcite fed with Ca(OH)2 (cubic crystals) and the calcite supplied to CO3.
pH measurements during the reaction showed that the self-regulated pH remained close to 11 for the duration of the synthesis at 80 C for S1, S2 and S3. pH fluctuations were, however, common—especially after 1 h to 1.5 h of reaction time when the reaction mixture considerably thickened up—and, overall, the pH decreased slightly with time during the 3 h of synthesis. The pH during synthesis of CO3 was significantly lower than that of S1, S2 and S3. The pH probe (used for sampled pH recording) required substantial agitation to read the pH correctly after 2 h. As a result of these fluctuations and sampling difficulties, even though the results showed very good comparability, the pHs shown in this work are to be taken as an estimate. Figure 4 shows the pH readings obtained for S1, S2 and S3 over 3 h.
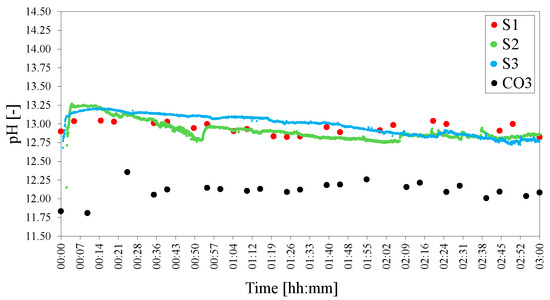
Figure 4.
pHs of the standard HC LDHs S1, S2, S3 and CO3. The pH was adjusted to 25 C to facilitate comparison.
For S1 a sampling pH method was used where the pH probe was cleaned before every measurement. The pH of S2 and S3 was measured continuously. The pH of S2 exhibited greater fluctuations than that of S3. This could be attributed to the encased pH probe used for S2 which was subject to material build-up. Due to the sampling method employed for other experiments, the pH measurements of S1 will be used for comparative purposes in the remainder of the text.
In the following sections, only deviations from the standard S3 discussed in this section—caused by varying one of the studied parameters—will be highlighted. S3 will thus, in the following text, be synonymous with T4, t2, MR2, A1, M2 and WS2.
2.2. Reaction Temperature
The reaction temperature was varied between 20 C and 90 C (T1 = 20 C, T2 = 40 C, T3 = 60 C, T4 = 80 C and T5 = 90 C). The corresponding XRD (a) and ATR-FTIR (b) results are shown in Figure 5.
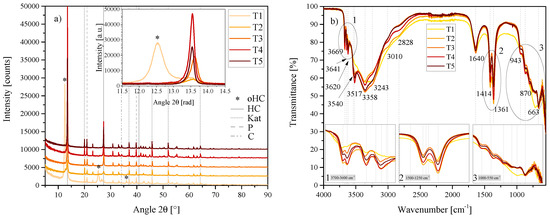
Figure 5.
(a) XRD results of the temperature series T1, T2, T3, T4 and T5 between 5 2 and 90 2. Each scan is y-shifted by 2500 counts. The inset depicts the primary LDH peaks and change in position. HC = hydrocalumite, oHC = secondary HC-like phase, Kat = katoite, P = portlandite and C = calcite. (b) FTIR-ATR scans of the temperature series T1, T2, T3, T4 and T5 between 4000 and 550 . The three insets show the regions: (1) 3700 – 3600 , (2) 1500 – 1250 , (3) 1000 – 550 in detail. Dashed and solid grey lines indicate the maxima of vibrations. T1 = 20 C, T2 = 40 C, T3 = 60 C, T4 = 80 C and T5 = 90 C.
The [Ca4Al2(OH)12][(CO3)·5H2O] anorthic phase once again proved to be the best fit for the phase produced. However, in this series some additional phases were present, depending on the synthesis temperature. As shown in the inset of Figure 5a, an increase in temperature led to first the formation and then the disappearance of an LDH-like phase with a layered structure, imitating HC. This phase was most prominent in the synthesis at 20 C and was not present at 60 C. The phase was best fit by 3CaO·Al2O3·0.5Ca(OH)2·0.5CaCO3·11·5H2O, a rhombohedral structure. Being an outdated entry, however, the closest fit that could be used for Rietveld refinement is the structure identified by [34] for calcium hemicarboaluminate, a partially carbonated (low carbonate content) phase that is formed at the start of carbonation reactions in cement Ca4Al2(OH)12(OH)(CO3)0.5·4 H2O. The first phase, a calcium aluminate carbonate hydrate was studied by [35]. At the time it was noted that this compound could be a meta-stable phase that forms in cement but had not been found in Portland cement at the time. In T2, this phase was still present but its reflection shifted slightly to the right—closer resembling calcium hemicarboaluminate—and more of the always-observed HC phase [Ca4Al2(OH)12][(CO3)·5H2O] was present. With an increase in temperature, HC formation increased up to 80 C. Katoite and portlandite were present in all samples, while calcite was only present in T4 and T5. Calcite content increased at 90 C. Table 1 shows the progression of the phase contents with temperature as determined by Rietveld refinement.

Table 1.
Rietveld refinement of the temperature series of LDHs T1 = 20 C, T2 = 40 C, T3 = 60 C, T4 = 80 C and T5 = 90 C. HC indicated the phase [Ca4Al2(OH)12][(CO3)·5H2O], oHC indicates the phase Ca4Al2(OH)12(OH)(CO3)0.5·4 H2O, Kat is katoite, P is portlandite and C is calcite. All values are given in percentages of the crystalline phases.
Some differences in spectra could also be observed with FTIR-ATR, most notably in T1 and T2—which showed a shoulder left of the vibrations at 3669 and changed intensity of other vibrations as indicated in the insets of Figure 5b and in the region between 3517 and 2828 . With an increase in temperature, the 3010 and 2828 vibrations decreased in intensity. The 3620 Al–OH str. vibration was significantly reduced in T1. Further, T1 showed less definition of the 1414 /1361 doublet and a greater resemblance of the calcite vibration in this region shown in Figure 2b. T1 also showed less definition in the vibrations between 1000 and 550 .
SEM micrographs showed clear differences in the materials obtained and a change in distribution of phases (Figure 6).
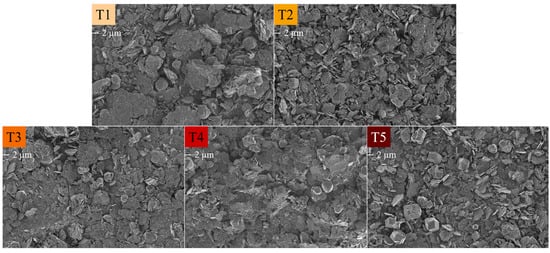
Figure 6.
SEM micrographs of the HC LDHs T1 = 20 C, T2 = 40 C, T3 = 60 C, T4 = 80 C and T5 = 90 C at 1 keV and 2k magnification. The scale bar is indicated under the label.
All samples showed plate-like structures. In T1, these structures were highly agglomerated and packed into stacks of ill-defined platelets. Round, ball-like structures were mixed in-between these platelet agglomerates. It is possible that these were ill-defined katoite structures. T2 showed better definition of the platelet structures, albeit with them still being small and unevenly crystallised, and a large amount of katoite, which was omnipresent between stacks of platelets. No cubic calcite structures were visible in these micrographs. T3, T4 and T5 showed well-defined platelets, with the best-defined platelets being present in T4. Katoite and cubic calcite structures were visible in all three micrographs, corresponding to the Rietveld analysis. Particulate matter was visible in all samples and could again be either unreacted Ca(OH)2 or amorphous Al(OH)3. The secondary calcium aluminate carbonate hydrate phase or calcium hemicarboaluminate phase present in T1 and T2 could not be discerned from other phases.
The pH documented during synthesis varied greatly with temperature. Figure 7 shows the sampled pHs (adjusted to 25 C) as a function of time for comparative purposes.
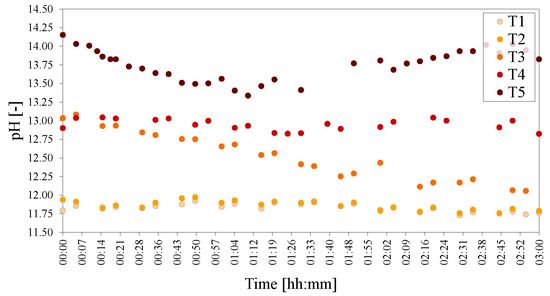
Figure 7.
pHs of the temperature series of LDHs T1 = 20 C, T2 = 40 C, T3 = 60 C, T4 = 80 C and T5 = 90 C. The pH was adjusted to 25 C to facilitate comparison.
The recorded pH rose with an increase in temperature. The pHs at 20 C and 40 C were almost identical. Increasing the temperature to 60 C led to the start of the reaction at a higher pH, lowering with the progression of time. At 80 C the pH stayed constant (only decreasing slightly with time), while at 90 C, the pH was very high at the start of reaction and dipped before rising again after 2 h of reaction time had passed.
2.3. Reaction Time
The impact of three reaction times on HC formation was tested (t1 = 1 h, t2 = 3 h and t3 = 6 h), the XRD and FTIR-ATR results of which are shown in Figure 8a and Figure 8b, respectively.
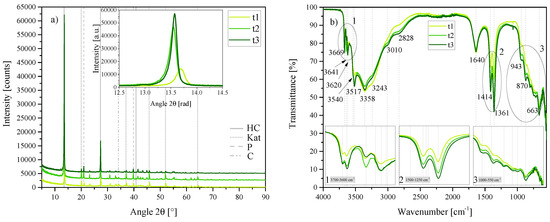
Figure 8.
(a) XRD results of the time series t1, t2 and t3 between 5 2 and 90 2. Each scan is y-shifted by 2500 counts. The inset depicts the primary LDH peaks and change in position. HC = hydrocalumite, Kat = katoite, P = portlandite and C = calcite. (b) FTIR-ATR scans of the time series t1, t2 and t3 between 4000 and 550 . The three insets show the regions: (1) 3700 – 3600 , (2) 1500 – 1250 , (3) 1000 – 550 in detail. Dashed and solid grey lines indicate the maxima of vibrations. t1 = 1 h, t2 = 3 h and t3 = 6 h.
XRD showed a large similarity between the phases formed; however, the LDH phase formed in t1 was shifted to the right (see inset of Figure 5a, more closely resembling the primary reflection position of the phase formed in T2. The best-fit LDH crystal structure for all three, t1, t2 and t3, was again anorthic [Ca4Al2(OH)12][(CO3)·5H2O]. A small additional phase with a similar crystal structure to chloride-intercalated HC was detected in t3 ([Ca4Al2(OH)12][(CO3)0.5Cl4·8H2O]). Overall, Rietveld refinement showed that an increase in reaction time led to an increase in LDH phase and decrease in katoite and portlandite present. Calcite content also decreased slightly with an increase in reaction time. Table 2 depicts the Rietveld refinement results obtained for the different reaction times.
Table 2.
Rietveld refinement of the time series of LDHs t1 = 1 h, t2 = 3 h and t3 = 6 h. HC indicates the phase [Ca4Al2(OH)12][(CO3)·5H2O], HC2 indicates the phase [Ca4Al2(OH)12][(CO3)0.5Cl4·8H2O], Kat is katoite, P is portlandite and C is calcite. All values are given in percentages of the crystalline phases.
FTIR scans of the three LDHs were similar; most notably showing an increase in vibration in the doublet at 1414 /1361 , corresponding to a decreased amount of calcite and possible increased intercalation of carbonate into the interlayer. Most vibrations increased in strength with an increase in reaction time, except the vibration at 3243 , which showed a stronger vibration in t1. Further, the vibration at 3641 (linked to unreacted Ca(OH)2) was notably stronger in t2, even though this LDH contained less Ca(OH)2 according to Rietveld refinement.
Morphologically, the three materials were very similar; the only easily noticeable differences being the amount of particulate matter clinging to the other phases, improved crystallisation of the platelets and a weak correlation between the amount of katoite and calcite observed, and Rietveld refinement results (Figure 9).
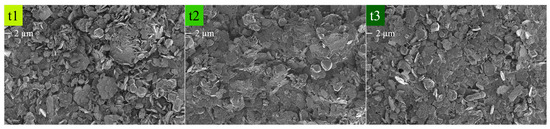
Figure 9.
SEM micrographs of the time series of HC LDHs t1 = 1 h, t2 = 3 h and t3 = 6 h at 1 keV and 2k magnification. The scale bar is indicated under the label.
Recording the pH for the duration of the 6 h t3 experiment showed that the pH approximately levels out after 3 h (Figure 10). Small differenced between the pH measurements were observed between t1, t2 and t3 in their respective time-frames.
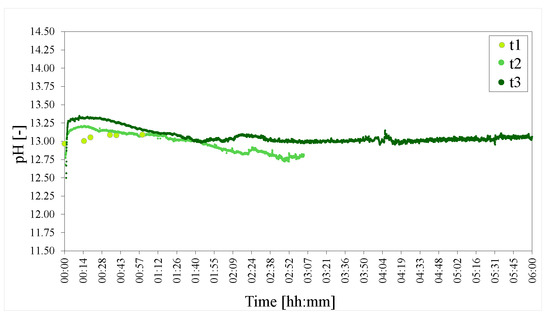
Figure 10.
pHs of the time series of LDHs t1 = 1 h, t2 = 3 h and t3 = 6 h. The pH was adjusted to 25 C to facilitate comparison.
2.4. Molar Calcium-to-Aluminium Ratio
The reaction of Ca(OH)2 and Al(OH)3 to form HC stands in competition with the formation of katoite (Ca3Al2(OH)12) [26,27]. Three molar calcium-to-aluminium ratios were, thus, tested to determine the effect of this ratio on the formation of HC. MR1 (3:2) should favour katoite formation (based on stoichiometry), while MR2 (4:2) should favour HC formation and MR3 (6:2) would provide an excess of Ca(OH)2 to the reaction. Out of all results, the result of this series was most surprising, inverting expectations. XRD (shown in Figure 11) showed that, once again, similar phases formed, just with different ratios and that the [Ca4Al2(OH)12][(CO3)·5H2O] phase again provided the best fit for the crystal structure of the LDH formed.
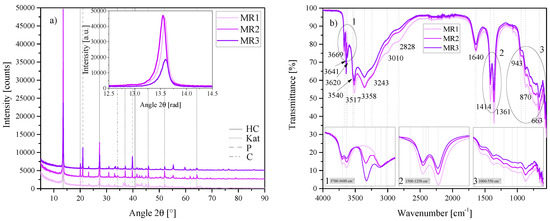
Figure 11.
(a) XRD results of the molar calcium-to-aluminium ratio series MR1, MR2 and MR3 between 5 2 and 90 2. Each scan is y-shifted by 2500 counts. The inset depicts the primary LDH peaks and change in position. HC = hydrocalumite, Kat = katoite, P = portlandite and C = calcite. (b) FTIR-ATR scans of the molar calcium-to-aluminium ratio series MR1, MR2 and MR3 between 4000 and 550 . The three insets show the regions: (1) 3700 – 3600 , (2) 1500 – 1250 , (3) 1000 – 550 in detail. Dashed and solid grey lines indicate the maxima of vibrations. MR1 = 3:2, MR2 = 4:2 and MR3 = 6:2.
The primary MR3 LDH peak was slightly shifted to the right of MR1 and MR2 (inset of Figure 11a). No significant amounts of other LDH phases were formed in this series. However, Rietveld refinement revealed that MR1 led to the greatest purity HC phase (>80%), while MR3 resulted in a purity of less than 50%. The Rietveld refinement results of this series are shown in Table 3.
Table 3.
Rietveld refinement of the molar calcium-to-aluminium series of LDHs MR1 = 3:2, MR2 = 4:2 and MR3 = 6:2. HC indicates the phase [Ca4Al2(OH)12][(CO3)·5H2O], Kat is katoite, P is portlandite and C is calcite. All values are given in percentages of the crystalline phases.
FTIR-ATR results (Figure 11b showed good correlation between the Rietveld results and the vibrational intensities of each sample. The vibration at 3641 , linked to unreacted Ca(OH)2, showed excellent correlation between the Rietveld and FTIR results, increasing in intensity with an increase in left-over portlandite. The twin-peak at 1414 /1361 correlated well with the shift in primary LDH reflection position and possible carbonate content. In the region between 1000 and 550 the vibration strength decreased with an increase in molar ratio.
Morphologically, clear differences were visible between the amount of particulate matter present (Ca(OH)2 or amorphous Al(OH)3) in each sample (Figure 12). MR3 contained the largest amount of particulate matter, correlating well with the Rietveld refinement results. MR3 also contained visibly more katoite and calcite, as expected. The platelets showed some differences too. MR1 produced smaller, rugged platelets with many broken edges and the agglomeration of different platelet sizes. MR2 produced much smoother, better defined and larger platelets than MR1 and MR3. The platelets of MR3 were less rugged than those of MR1, but due to the coverage in particulate matter, proper description of their definition was challenging.
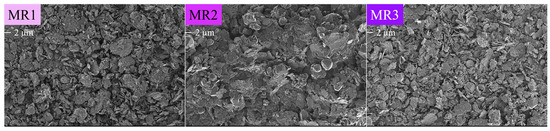
Figure 12.
SEM micrographs of the series of molar calcium-to-aluminium ratio MR1 = 3:2, MR2 = 4:2 and MR3 = 6:2 at 1 keV and 2k magnification. The scale bar is indicated under the label.
The pHs of MR1 and MR3 were very similar and dropped slightly with time in comparison with MR2. MR3 started with a slightly elevated pH (as expected due to the large amount of Ca(OH)2 present). Conversely, MR1 had a lower starting pH, as expected, due to the lower amount of Ca(OH)2 present and MR2 lay between the two at the start—as portrayed in Figure 13. With progression in time, the pHs of MR1 and MR3 fell slightly below that of MR2.
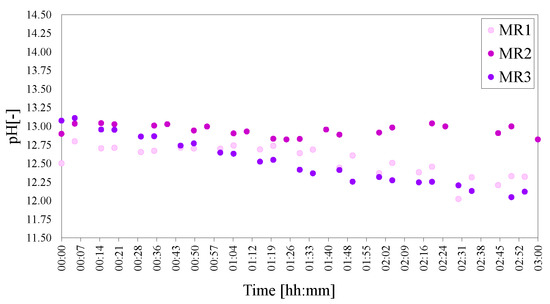
Figure 13.
pHs of the molar calcium-to-aluminium series of LDHs MR1 = 3:2, MR2 = 4:2 and MR3 = 6:2. The pH was adjusted to 25 C to facilitate comparison.
2.5. Chemical Morphology/Crystallinity of the Al(OH)3
Three different Al(OH)3 sources were tested in this work. The first (A1), from Sigma Aldrich (SA) was used as the standard source in all experiments. This Al source proved to be amorphous by XRD and have a surface area of 59.35 . The second Al source (A2) from ACE Chemicals (ACE) proved to be minimally crystalline boehmite with a surface area of 69.12 (due to the low crystallinity it is possible that some of the phase consisted of other amorphous crystal structures or polymorphs). The third Al source (A3) from Merck (M) proved to be highly crystalline gibbsite with a surface area of 0.75 . Figure 14 shows the XRD results for these three sources and isotherms obtained for the determination of the Brunauer–Emmett–Teller (BET) surface area.
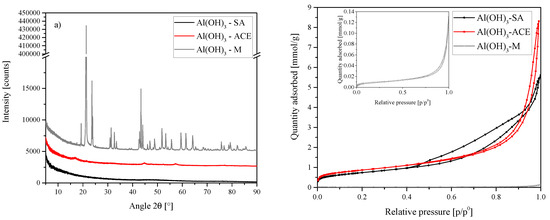
Figure 14.
(a) XRD results of the Al sources used for the synthesis of A1, A2 and A3. SA = amorphous, ACE = boehmite and M = gibbsite—Sigma Aldrich (SA), ACE Chemicals (ACE) and Merck (M). Each scan is y-shifted by 2500 counts. (b) Isotherms obtained for each Al source. Sigma Aldrich (SA), ACE Chemicals (ACE) and Merck (M).
The Al sources used thus had very different crystallinities and crystal structures. SEM further showed that the morphologies of the three Al sources were very different (see Figure 15).
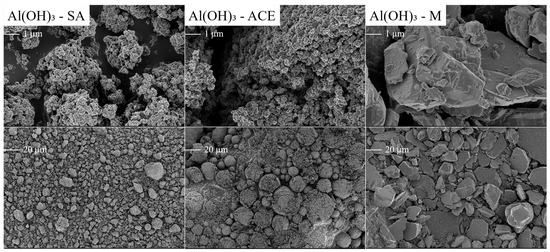
Figure 15.
SEM micrographs of the three different Al(OH)3 sources used from Sigma Aldrich (SA), ACE Chemicals (ACE) and Merck (M) taken at 1 keV and 10k (top) and 500 times (bottom) magnification. The scale bar is indicated on each micrograph.
The SA and ACE reagents had similarly sized particles but different “macro” morphologies. Where SA consisted of a carpet-like covering of small dot-like particles (agglomerated into random shapes), ACE consisted of the same size particles but agglomerated into a myriad of variably sized balls. These balls were damaged in the sample preparation process, breaking up/squashing and revealing some of the internal structure. The M source, on the other hand, consisted of large, thick chunks of gibbsite.
These three materials caused the formation of three very different reaction outcomes. The outcome of A1 (the standard sample S3) has already been discussed. In comparison, A2 consisted of two HC phases, being mainly the typical one with a crystal structure similar to [Ca4Al2(OH)12][(CO3)·5H2O] but also a small fraction of the HC phase with a crystal structure similar to [Ca4Al2(OH)12][(CO3)0.5Cl·4·8H2O], as already present in t3. These two phases are clearly distinguishable on the XRD inset in Figure 16a depicting the primary LDH reflections.
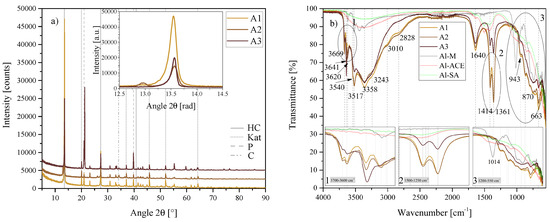
Figure 16.
(a) XRD results of the chemical morphology/crystallinity of Al(OH)3 series A1, A2 and A3 between 5 2 and 90 2. Each scan is y-shifted by 2500 counts. The inset depicts the primary LDH peaks and change in position. HC = hydrocalumite, HC2 = hydrocalumite phase 2, Kat = katoite, P = portlandite, C = calcite and G = gibbsite. (b) FTIR-ATR scans of the chemical morphology/crystallinity of Al(OH)3 A1, A2 and A3 between 4000 and 550 . The three insets show the regions: (1) 3700 – 3600 , (2) 1500 – 1250 , (3) 1200 – 550 in detail. Dashed and solid grey lines indicate the maxima of vibrations. A1 = Al(OH)3-SA, A2 = Al(OH)3-ACE and A3 = Al(OH)3-SA.
A3 consisted of only one phase of LDH but at a lower overall purity—with large amounts of Ca(OH)2 remaining unreacted as shown through Rietveld refinement in Table 4. A2 produced the most katoite and A3 contained no calcite, but large amounts of unreacted gibbsite. Both A2 and A3 showed slight right-shifts in their primary LDH reflection in comparison to A1.
Table 4.
Rietveld refinement of the morphology/crystallinity series of LDHs A1 = SA, A2 = ACE and A3 = M. HC indicates the phase [Ca4Al2(OH)12][(CO3)·5H2O], HC2 is [Ca4Al2(OH)12][(CO3)0.5Cl4·8H2O], Kat is katoite, P is portlandite, C is calcite and G is gibbsite. All values are given in percentages of the crystalline phases.
There were also differences between the FTIR-ATR scans of A1, A2 and A3 depicted in Figure 16b. While the scans for A1 and A2 were quite similar, A3 deviated from almost all major vibrations with either a decreased or increased vibration. The large amount of unreacted portlandite in A3 was clearly visible at 3641 . Most other vibrations, however, were weaker in A3—most notably those indicating the OH str. vibration of water bonded to interlayer carbonate (3010 ) and the combination band at 2828 as well as the twin peak at 1414 /1361 associated with both, interlayer carbonate and interlayer hydroxide anions. The scan for A3 gained an additional band at 1014 which correlates to the strongest vibration of the Al(OH)3-M source itself. The remaining vibrations between 1000 and 550 were less strongly defined than those of A1 and A2. There also existed some stark differences between the FTIR scans of the three Al(OH)3 sources, which are also depicted in Figure 16b. Al(OH)3-M showed defined vibrations in the 3700 to 3300 region and between 1200 and 550 , while Al(OH)3-SA and Al(OH)3-ACE were very similar and had much less strongly defined features. Both consisted of a broad band in the 3700 to 3300 region and immolated well the 1000 to 550 region. Both materials, however, had a doublet feature blue-shifted from the 1414 /1361 doublet. This feature has been linked to adsorbed carbonate species [36,37,38] and will be discussed in-depth later in the text.
Morphological examination of these three materials showed that A1 and A2 formed similar structures but that A3 formed much larger HC platelets (Figure 17). A far greater quantity of particulate matter was also present in A3, as expected from the sample consisting of almost 50% of portlandite and gibbsite. No large chunks of gibbsite (as initially present from the reactant) were visible, though, indicating that these chunks of gibbsite must have broken up during synthesis.
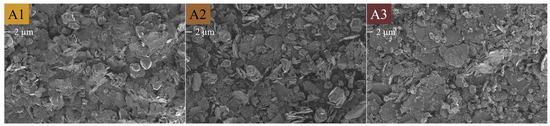
Figure 17.
SEM micrographs of the chemical morphology/crystallinity of Al(OH)3 series A1 = SA, A2 = ACE and A3 = M taken at 1 keV and 2k magnification. The scale bar is indicated below the label.
Even though the phase compositions were very different for A1, A2 and A3, the synthesis pHs observed were almost identical throughout the reaction, as shown in Figure 18—indicating that Al(OH)3 crystallinity and surface area, and the subsequent dissoluted Al-species, do not contribute to the mixture pH significantly.
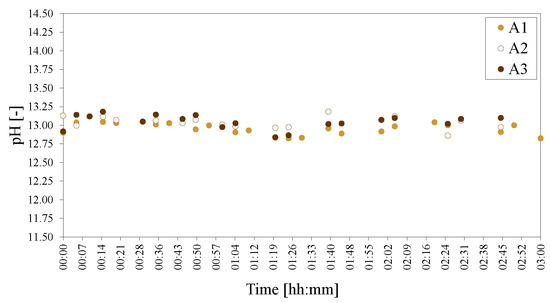
Figure 18.
pHs of the morphology/crystallinity of Al(OH)3 series of LDHs A1 = SA, A2 = ACE and A3 = M. The pH was adjusted to 25 C to facilitate comparison.
2.6. Mixing
The mixing during synthesis was varied by altering the rotational speed of the magnetic stirrer used. Three rotational speeds were used: M1 = 500 rpm, M2 = 750 rpm and M3 = 1000 rpm. During the synthesis, these rotational speeds led to mixing at full incorporation at all times (1000 rpm), sufficient mixing to keep the system visibly agitated but cause a thin condensate film forming (750 rpm) and mixing that kept the reaction mixture agitated but led to the formation of a thicker condensate film on top of the mixture (500 rpm). Little difference was observed in the outcome of the reaction in XRD and FTIR-ATR results, as shown in Figure 19a,b.
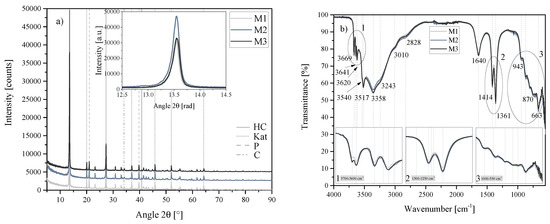
Figure 19.
(a) XRD results of the mixing series M1, M2 and M3 between 5 2 and 90 2. Each scan is y-shifted by 2500 counts. The inset depicts the primary LDH peaks and change in position. HC = hydrocalumite, Kat = katoite, P = portlandite and C = calcite. (b) FTIR-ATR scans of the mixing series M1, M2 and M3 between 4000 and 550 . The three insets show the regions: (1) 3700 – 3600 , (2) 1500 – 1250 , (3) 1000 – 550 in detail. Dashed and solid grey lines indicate the maxima of vibrations. M1 = 500 rpm, WS2 = 750 rpm and WS3 = 1000 rpm.
Rietveld refinement further confirmed the similarity between these three reaction outcomes. As shown in Table 5, only small variations in HC, katoite, portlandite and calcite content were observed. Unsurprisingly, SEM (Figure 20) also showed very little difference in the morphologies of M1, M2 and M3.
Table 5.
Rietveld refinement of the mixing series of LDHs M1 = 500 rpm, M2 = 750 rpm and M3 = 1000 rpm. HC indicates the phase [Ca4Al2(OH)12][(CO3)·5H2O], Kat is katoite, P is portlandite and C is calcite. All values are given in percentages of the crystalline phases.
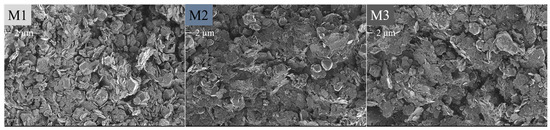
Figure 20.
SEM micrographs of the mixing series M1 = 500 rpm, M2 = 750 rpm and M3 = 1000 rpm taken at 1 keV and 2k magnification. The scale bar is indicated below the label.
However, surprisingly, even though there was almost no difference seen between M1, M2 and M3 in terms of the other results, the pH of M1 and M3 decreased notably with time in comparison to that of M2 (Figure 21).
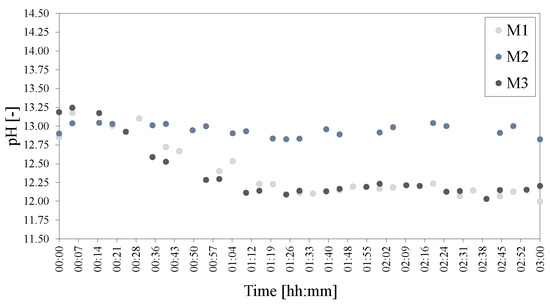
Figure 21.
pHs of the mixing series of LDHs M1 = 500 rpm, M2 = 750 rpm and M3 = 1000 rpm. The pH was adjusted to 25 C to facilitate comparison.
2.7. Water-to-Solids Ratio
The final parameter investigated was the effect of the water-to-solids ratio on the formation of HC. Three water-to-solids ratios were tested, being WS1 = 70:30, WS2 = 80:20 and WS3 = 90:10. During the reaction, these three ratios behaved very differently. Where, usually, reaction mixtures with an 80:20 ratio thickened considerably after 1 h to 1.5 h, WS1 had already thickened considerably after 30 min. After 2 h, this mixture became difficult to agitate even with the pH probe during measurement and was mixing with great difficulty until the 3 h of reaction time had passed. WS3, on the contrary, never thickened to a considerable degree, fully incorporating all mixture contents continuously.
The XRD and FTIR-ATR results depicted in Figure 22 show some differences between the three materials formed.
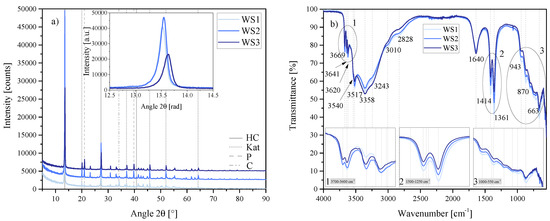
Figure 22.
(a) XRD results of the water-to-solids ratio series WS1, WS2 and WS3 between 5 2 and 90 2. Each scan is y-shifted by 2500 counts. The inset depicts the primary LDH peaks and change in position. HC = hydrocalumite, Kat = katoite, P = portlandite and C = calcite. (b) FTIR-ATR scans of the water-to-solids ratio series WS1, WS2 and WS3 between 4000 and 550 . The three insets show the regions: (1) 3700 – 3600 , (2) 1500 – 1250 , (3) 1000 – 550 in detail. Dashed and solid grey lines indicate the maxima of vibrations. WS1 = 70:30, WS2 = 80:20 and WS3 = 90:10.
The primary LDH peak of HC was shifted somewhat to the right for WS3 with respect to WS1 and WS2 (inset in Figure 22a). [Ca4Al2(OH)12][(CO3)·5H2O] remained the best fitting crystal structure analogue in all three materials, however. FTIR-ATR showed little difference between the three materials, although there was a clear reduction in the 3641 peak associated with unreacted Ca(OH)2. Intensity of vibration also decreased in the 1414 /1361 doublet with an increase in water-to-solids ratio; as did the vibrations between 1000 and 550 . Rietveld refinement, however, showed very large differences between these three materials. WS1 led to a HC purity greater than 70%, while WS3 achieved only approximately 55%. There were also large differences in the amount of katoite formed and the amount of portlandite left unreacted, as well as the amount of calcite remaining, as shown in Table 6.
Table 6.
Rietveld refinement of the water-to-solids ratio series of LDHs WS1 = 70:30, WS2 = 80:20 and WS3 = 90:10. HC indicates the phase [Ca4Al2(OH)12][(CO3)·5H2O], Kat is katoite, P is portlandite and C is calcite. All values are given in percentages of the crystalline phases.
Even with this large difference in the amount of each phase present, crystallisation of the LDH phases appeared similar on the SEM micrographs, shown in Figure 23. However, less particulate matter was present in WS1 and more in WS3, in good correlation with the decreased amount of portlandite present. An increased amount of katoite was also present in WS2 and WS3. The large amount of calcite determined through the Rietveld analysis for WS1 was not observed in its micrograph.
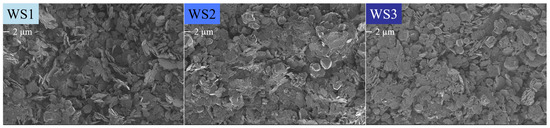
Figure 23.
SEM micrographs of the water-to-solids ratio series WS1 = 70:30, WS2 = 80:20 and WS3 = 90:10 taken at 1 keV and 2k magnification. The scale bar is indicated below the label.
The pHs recorded for WS1, WS2 and WS3 showed that significant differences existed between the starting pH of the reaction mixture and the behaviour during synthesis with time (Figure 24). WS1, as expected due to the larger amount of reactants present, had a very high initial pH but then exhibited a considerable reduction in pH over time. WS3, on the other hand started off with a much lower pH, which remained almost constant throughout the reaction. WS1 and WS3 had opposing viscosities, the one being very thick, the other very thin. Yet they still ended on a similarly low pH after 3 h.
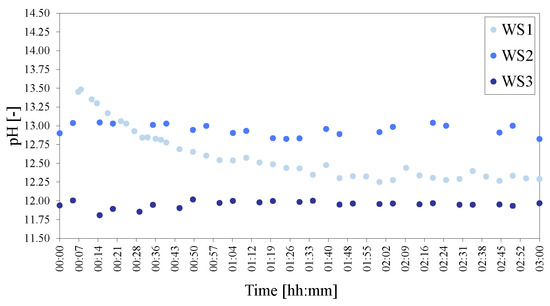
Figure 24.
pHs of the water-to-solids ratio series of LDHs WS1 = 70:30, WS2 = 80:20 and WS3 = 90:10. The pH was adjusted to 25 C to facilitate comparison.
3. Discussion
The results of this work have shown that the synthesis of an LDH phase (with high purity, max. = 84.91%) is possible using only Ca(OH)2, Al(OH)3 and water at mild synthesis conditions (atmospheric pressure and temperatures less than boiling point) as well as in a short period of time (3 h). This section serves to discuss the following points:
- carbonate contamination;
- increasing conversion to HC;
- and a hint towards the reaction mechanism of the formation of HC in a hydrothermal process.
3.1. Carbonate Contamination
The synthesis of carbonate-free HC from metal oxides and hydroxides has not been attempted with this aim in literature before, to our knowledge. However, some authors have used only calcium and aluminium oxides and hydroxides for their HC synthesis which could facilitate the formation of a CaAl-OH-LDH phase [3,23,24,25]. In most of these studies involving the formation of HC, especially when attempting to form nitrate or chloride forms or studying the thermodynamics, carbonate contamination was limited. When carbonate contamination occurred, it was typically said to have occurred during synthesis, filtering or drying. In the studies where carbonate intercalation was not desired, great care was taken to carry out the synthesis in an inert environment (glove boxes or covered systems), use freshly precipitated Ca(OH)2 and/or dried materials under nitrogen or in a desiccator to minimise contact with CO2 [3,23,24,25].
In this study, an inert environment was accomplished by synthesising the LDHs under a slight over-pressure induced by constant nitrogen flow. The materials were filtered in open atmosphere but only required approximately 5 min to filter. XRD and FTIR-ATR analysis was carried out wet and within 0.5 h and 1 h after synthesis, respectively. The only possible CO2 contamination from the atmosphere could have occurred during the 5 min of filtering (after which the filtered samples were sealed from air immediately and only unsealed for the wet XRD analysis and again for wet FTIR-ATR analysis). To put this into perspective, if the carbonate contamination were to come from CO2 in air, at the atmospheric conditions in Pretoria, South Africa, where these experiments were conducted, 6.69 of air would have needed to pass through the sample and every available mol of CO2 absorbed within the 5 min of filtration time or surface adsorbed during XRD and subsequently intercalated. As this is essentially impossible, the interlayer carbonate, if present to a significant degree, thus had to come from a different source.
For the synthesis of the materials, a fresh bottle of analytical grade Ca(OH)2 was used. Unfortunately, after synthesis and our surprise of this possible CO2 contamination, it was found that the Ca(OH)2 used nevertheless consisted to 3.76% of calcite. This constitutes only 13.36% of the amount of calcite stoichiometrically required to form a fully carbonate intercalated CaAl-LDH, though. Taking into account theoretical requirements of carbonate to form a fully carbonate intercalated CaAl-LDH, one could thus expect that the LDH consisted of 13.36% carbonate in the interlayer. However, almost every material synthesised contained some calcite at the end of the synthesis. In prior studies [25,26,28], CaCO3 was used as a carbonate source during synthesis and most of these studies produced very pure CaAl-CO3-LDHs. Considering the approximately dried material yield, our materials consisted of between 0.5 g to 1 g of calcite after synthesis (approximately 2% as determined from Rietveld refinement). This is approximately as much as initially fed with the Ca(OH)2, indicating that a small amount of carbonate could have been taken up by the CaAl-OH-LDHs, but a large fraction remained as calcite.
Our Rietveld refinement results showed that between 1% and 3% calcite typically remained in the material after synthesis. However, there were some outliers. Some materials (MR1, WS3, T1, T2 and A3) contained no or less than 1% calcite, while others (WS1 and T5) consisted of close to 10% calcite and CO3 even of 20% calcite. MR1, due to the use of less Ca(OH)2 during synthesis to achieve the required molar calcium-to-aluminium ratio would contain less calcite to begin with. This result is thus not entirely surprising. WS3 contained less material in general to achieve the desired water-to-solids ratio. In this case, one could argue, that the calcite could have dissolved better due to a higher shear synthesis induced by the thinner reaction mixture (the same would apply to MR1 and A3). However, FTIR-ATR showed a decreased vibrational strength in the doublet 1414 /1361 vibration, which in most literature is designated to interlayer carbonate. T1 and T2 both showed no remaining calcite, however, the primary phase present in these materials was found to most likely be a calcium aluminate carbonate hydrate of the form 3CaO·Al2O3·0.5Ca(OH)2·0.5CaCO3·11.5H2O, which could explain where some of the CaCO3 was used. Interestingly, the calcium aluminate hydrate phases presented by [23] at 20 and 30 were not observed. The only difference between A3 and its other series materials (A1 and A2) was the use of a highly crystalline gibbsite as Al source. While interlayer carbonate was present in this material as identified through FTIR-ATR analysis, it had a much lower vibrational response at 1414 /1361 and 663 , three vibrations that are typically linked to interlayer carbonate—especially the vibration at 663 , where this material had by far the least intense vibrational response of all materials.
This leads to the discussion of the importance of the blue-shifted doublet (from the doublet 1414 /1361 ) vibrations of the Al(OH)3-SA and Al(OH)3-ACE sources indicated in the results section. To our amazement, the possibility of carbonate contamination in HC through adsorption of CO2 onto the surface of Al(OH)3 has not been indicated in any previous research, to our knowledge. We were also unable to find any FTIR spectra of Al sources used in previous research for the synthesis of HC. It is, however, well established in the catalytic field that aluminium oxides and hydroxides adsorb carbonate species. CO2 adsorption onto boehmite and other aluminium phases was studied by [38] at different activation temperatures and pressures of CO2. While their findings of the adsorbed species do not match our vibrational responses, the amorphous nature of the Al(OH)3 sources used in this text could still allow for good explanation of the reason why CO2 adsorbed onto the surface of Al(OH)3-SA and Al(OH)3-ACE and not onto the crystalline gibbsite phase. Amorphicity of materials typically goes hand in hand with some degree of disorder in these systems, thus making it more likely to adsorb CO2 onto coordinatively unsaturated Al atoms with octahedral coordination that are very active toward CO2 adsorption. Another explanation could come from the presence of small amounts of sodium present in the amorphous Al(OH)3. While Al does not form carbonates itself, the presence of Na easily leads to the formation of dawsonite (NaAl( OH)2CO3) phases. Prior to the mid-1990s, several authors reported vibrational bands between 1520 –1570 and/or 1350 –1410 cm that were linked to CO2 adsorption on -alumina phases. Ref. [36] linked these to carbonate vibrations of the bidentate form which is enhanced through the reaction of moisture, CO2 and Na to dawsonite-like phases that are vibrationally active in this region. The amorphous Al(OH)3 used in this work, unfortunately, did not have an elemental analysis provided by the manufacturer, but some Na was present in Al(OH)3-M. If small amounts of Na were present, this is a possible reason for these vibrations. The vibrational intensity also scaled with the surface area of the Al sources used. Ref. [37] also found these vibrations on their amorphous Al(OH)3 but ascribed them to the monodentate carbonate form. They performed experiments reacting amorphous aluminium hydroxide with sodium bicarbonate solutions of different concentrations. The wet environment could be the reason for the difference in carbonate orientation as later described by [39] for the adsorption of CO2 onto hydrotalcites in the presence of water vapour. Nevertheless, the different amounts of sodium bicarbonate solution used by [37] could give an indication towards the amount of carbonate adsorbed on the amorphous Al(OH)3. The absorbance spectrum of their sample prepared in 0.1 M sodium bicarbonate solution (corresponding to 0.26 Al(OH)3 on the surface) fit the spectra obtained for Al(OH)3-SA and Al(OH)3-ACE best. If this was the amount of carbonate adsorbed on the surface of Al(OH)3-SA, this would make the starting materials consist of an additional 1.56% of carbonate. Thus equalling a total carbonate (not calcium carbonate) percentage of approximately 2% supplied with the raw materials during synthesis.
If this was the amount of carbonate present in the system initially, this would not, however, explain the large amounts of calcite remaining in WS1, T5 and CO3. The 20% content of calcite in CO3 is easily explained by the calcite fed to the system to prepare this carbonate-intercalated form. The relatively high percentage of calcite in WS1 can be reasoned through the large amount of starting material present to achieve the desired water-to solids ratio. In T5 the only difference between this material and that synthesised with S3 is the reaction temperature (90 C). A much higher pH was also recorded during this synthesis, which can easily be explained by the effect of temperature on the dissolution of the solid phases. There exist two possibilities for this increased amount in calcite. Either the high temperature reaction favours the formation of CaCO3 (and insolubility of this phase) instead of a carbonate intercalated LDH at this elevated temperature and pH—thus depicting a close approximation to the "true" amount of carbonate in the system—or there was simply more carbonate present to start with and it is also less soluble at these conditions. CaCO3 solubility is known to decrease at increasing temperatures and also at increasing pHs (at 25 C and 1 bar) [40]. As all Ca(OH)2 and Al(OH)3 was taken from the same bottle, the last explanation thus seems unlikely, albeit not impossible.
While carbonate contamination definitely occurred (due to the variety of reasons mentioned), the phases formed in this work most likely consisted mainly of CaAl-OH-LDH as desired and as can be inferred by considering the difference in FTIR spectra of A3 and A1 in terms of the presence of adsorbed carbonate species on the Al sources and overall carbonate supplied to the system.
3.2. Increasing Conversion to HC
Considering the results presented in this work, it was evident that certain reaction parameters had a larger influence on the reaction outcome than others. Generally speaking, a higher purity HC was obtained by lowering the water-to-solids ratio, increasing the reaction time, having sufficient mixing, using an amorphous Al(OH)3 source with high surface area, using an adequate reaction temperature (80 C for the highest purity within 3 h) and most surprisingly, by using a calcium-to-aluminium ratio stoichiometrically favouring katoite formation. It is possible that this occurred because of an overall slightly lower pH during synthesis. pH sampling results showed that the materials with the highest HC purity (WS1 and MR1, 73.48% and 84.91%, respectively) followed a similar pH behaviour during synthesis, starting with a high pH and ending on a lower pH. We expect that this occurred due to the conversion to the LDH phase. It is possible that the high initial pH facilitates better dissolution of the phases (especially Al(OH)3) for reaction. Unpublished results of the same molar-ratio-experiment (but conducted for a shorter period of time) indicated that the best purity was achieved by using the stoichiometric ratio for hydrocalumite formation, contradicting the results found here [41]. Time, especially in this regard, thus seems a very important factor.
During one of our previous studies, entirely different results were obtained for the temperature series by using a more crystalline Al(OH)3 source and a shorter reaction time [27]. While the Al(OH)3 used in that study was also sourced from ACE Chemicals, it showed to be a highly crystalline material, akin to the Merck source used in this work. Reaction kinetics were thus seemingly very different and the LDH-like phases formed in T1 and T2 remained undetected. The morphology, surface area, crystallinity and even crystal structure of the starting materials most likely remains one of the main contributing factors towards a successful synthesis in a short period of time. As seen by comparison of even our own results, the choice of starting materials can change the reaction outcome completely. Conversion to better crystallised and more morphologically even HCs seems to be achievable by using a higher crystallinity Al source. This is possibly observed due to lower reaction rates, a subsequent slower crystal growth and hence higher crystallinity and larger platelets formed.
In closing the discussion in this section, the presence of the particulate matter in LDHs formed and XRD identified phases deserve some discussion. As shown through the morphological evaluation of the Ca(OH)2 and Al(OH)3 phases used, it was difficult to discern these using SEM. Due to the high amount of portlandite remaining in many samples, it is highly likely that this particulate matter is a mixture of the two phases and that an increase in reaction time would increase the yield of the HC phase. As the cyrstal structure of the amorphous Al(OH)3 could not be determined, it is also possible that slightly too little aluminium was fed to the system, which could have an effect on the final outcome with sufficient reaction time. During XRD, most scans contained very, very small amounts of phases that remained unidentified. It is possible that small amounts of especially the Cl-intercalated HC form exist in some more samples. However, due to shifted peaks and/or other effects, these phases could not be assigned. Further, any Rietveld refinement results (as mentioned in the text) were only applicable to the crystalline phases formed. The fraction of amorphous material present in each material remains undetermined.
3.3. A Hint Towards the Reaction Mechanism of the Formation of HC in a Hydrothermal Process
Finally, a short discussion on what could potentially be inferred regarding the reaction mechanism through which HC phases form using hydrothermal synthesis. The temperature experiments showed that, at least at low temperatures, an alternate LDH-like phase was formed. Some research suggests that this compound be a meta-stable phase that forms in cement (although it had not been found in Portland cement at the time) [35]. It is possible that this is a sort of pre-cursor to the HC phase, at least in low temperature systems. This seems likely considering observations in cement literature. Ref. [42] investigated the time dependent formation of calcium carboaluminate phases. They found that calcium hemicarboaluminate transforms into calcium monocarboaluminate given time and reaches high conversion after 100 days of reaction in the cement phase. Only the calcium monocarboaluminate phase is present in well-hydrated fully cured cement. Further, the calcium hemicarboaluminate form occurs early in the hydration process of cement, even if large quantities of calcium carbonate are present. Ref. [43] described how these calcium carboaluminate phases only really constitute a large fraction of the cement phase after about a day of reaction.
No study of the hydrothermal formation mechanism of HC exists (to our knowledge), especially at elevated temperatures. At elevated temperatures, these calcium hemi/monocarboaluminate phases could not be identified, but there seems to be a strong relationship to the formation/depletion of katoite during synthesis. In our previous results [27], these and those of [26], katoite was present to a large degree at a synthesis temperature of 90 . Katoite was also present in larger amounts at lower temperatures than 80 C. The higher katoite content at 90 could indicate that this is the more stable phase past 80 . No elevated temperatures are required, however, to form katoite, which made up a large fraction of the phases formed even at 20 . The largest fraction of katoite was present at 40 and 90 , though, possibly indicating that HC is the favoured phase between these two temperatures. The time experiments also revealed a great amount regarding the progression of the phase contents with time. At 6 h, only approximately a quarter of the katoite present after 1 h was observed. This seems to be a strong suggestion that, given enough time, katoite is converted into HC during synthesis and could thus be a precursor to the HC phase.
4. Materials and Methods
Chemically pure Ca(OH)2 and Al(OH)3 were sourced from ACE Chemicals (analytical reagent grade) and Sigma Aldrich (SA) (reagent grade). Two other Al(OH)3 sources were used in the experiments. They were sourced from ACE Chemicals (chemical purity grade) and from Merck Chemicals (95% purity). Distilled and dissolved gas free (boiled prior to use and cooled/heated to the desired temperature under nitrogen flow) water was used in all experiments.
Experiments were performed using a bench top reactor set up as shown in Figure 25. The figure also depicts all variables that were investigated (time: t, temperature: T, mixing: M, molar ratio: MR, aluminium source: A and water-to-solids ratio: WS). An inert N2 environment was maintained in all experiments at slight over-pressure. The dry reactant powders were added to preheated water at the desired temperature under constant stirring. The mixture was kept in suspension by magnetic stirring at the desired speed and reacted for the desired time at the desired temperature. pH measurements were taken intermittently. The samples were filtered using vacuum filtration, immediately sealed and analysed as a wet paste within 0.5 h with XRD and 1 h with ATR-FTIR.
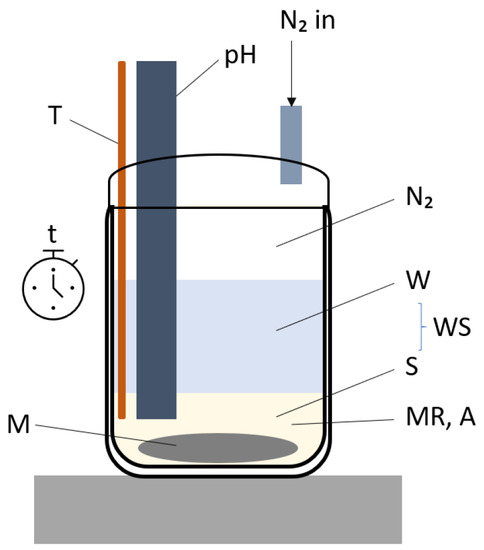
Figure 25.
Setup used for the synthesis of hydrocalumite.
The synthesis of HC using Ca(OH)2, Al(OH)3 and H2O stands in competition with the formation of katoite Ca3Al2(OH)12 (a member of the hydrogrossular family) as shown Equation (2).
All lower case letters represent stoichiometric coefficients. A denotes the desired intercalated anion. Table 7 shows the experimental conditions used for each experiment group.
Table 7.
Experimental conditions used for each of the experiments performed. The experiment IDs and colour codes defined in the table were used for each experiment in the text. Purple: molar Ca:Al ratio, red: temperature, green: time, blue: water: solids ratio, brown: Al source, grey: mixing. Note: S1, S2, S3 = MR2, T4, t2, WS2, A1 and M2. *Ca(OH)2 used in CO3 was partially substituted with CaCO3 as described in the text to achieve stoichiometric carbonate intercalation.
XRD measurements were performed on a Panalytical X’Pert PRO X-ray diffractometer in configuration, using Fe filtered Co-K radiation ( Å), an X’Celerator detector and variable divergence- and fixed receiving slits. The data were collected in the angular range of 5° 90° with a step size and time of ° and 13 , respectively. Phases were identified using X’Pert Highscore plus software. Molar fractions of phases present were determined using Rietveld refinement. The samples were analysed wet in order to minimise carbonate contamination and changes in the crystal structure due to drying effects. This process was chosen to closely simulate in-situ XRD.
ATR-FTIR spectra were obtained using a Perkin Elmer 100 Spectrophotometer. Samples were pressed in place with a force arm. Spectra were obtained in the range of 550–4000 cm−1 each with 32 scans at a resolution of 2 cm−1.
SEM micrographs were obtained using a Zeiss Ultra PLUS FEG SEM at 1 keV. Samples were coated with 1.4 nm carbon prior to analysis. The LDH samples were dried in a desiccator prior to study with SEM.
The BET surface areas of the materials were determined using isotherms recorded at 77.35 K with a Micromeritics TriStar II 3020. The samples were degassed at 80 C for 1.5 h prior to the analysis.
5. Conclusions
In conclusion, HC formation was favoured in all experiments, making up between approximately 50% and 85% of the final crystalline phases obtained. The formation of HC stood in competition with the formation of katoite, with constituted a large fraction of the remaining phases. It is expected that only small amounts of carbonate were present in the CaAl-OH-LDH and that any carbonate contamination came from the Ca(OH)2 (as calcite) and from the Al(OH)3 as surface adsorbed carbonate species rather than from the air as previously suggested. At high temperatures, CaCO3 formation seemed to be favoured instead of carbonate intercalation. The low solubility of carbonate species at elevated temperatures could be contributing factor to the low amount of carbonate intercalated.
The largest effect on HC purity was seen using a low water-to-solids ratio, increasing the reaction time, having sufficient mixing, using an amorphous Al(OH)3 with a high surface area, using an adequate reaction temperature and most surprisingly, by using a calcium-to-aluminium ratio stoichiometrically favouring katoite formation instead of HC formation. The morphology, surface area and crystallinity of the starting materials played a significant role. pH effects caused by the amount of reactants supplied could also have played a role in the increased purity observed—possibly by facilitating better dissolution of the Al(OH)3 phase—especially for low water-to-solids ratios and the stoichiometrically unfavoured molar calcium-to-aluminium ratios.
Finally, it was possible to obtain a hint regarding the reaction mechanism at elevated temperatures. At lower temperatures, it is possible that the formation of HC follows through the formation of calcium aluminate carbonate hydrate phases in conjunction with katoite, while at high temperatures, katoite formation seems to precede the formation of HC.
Author Contributions
Conceptualisation, B.R.G. and F.J.W.J.L.; methodology, B.R.G.; validation, B.R.G.; formal analysis, B.R.G.; investigation, B.R.G.; resources, F.J.W.J.L.; data curation, B.R.G.; writing—original draft preparation, B.G.; writing—review and editing, B.R.G. and F.J.W.J.L.; visualisation, B.R.G.; supervision, F.J.W.J.L.; project administration, F.J.W.J.L.; funding acquisition, F.J.W.J.L. All authors have read and agreed to the published version of the manuscript.
Funding
This research was funded by Techsparks (Pty) Ltd and the Technology and Human Resources for Industry Programme (THRIP) administered by the Department of Trade and Industry, South Africa, (grant number THRIP/133/31/03/2016). The APC was funded by the University of Pretoria, South Africa.
Acknowledgments
Particular thanks are extended to Wiebke Gröte (X-ray diffraction analyst) at the Department of Geology, University of Pretoria, South Africa, for making these time sensitive wet XRD measurements possible and performing the subsequent Rietveld refinement. We also thank David Viljoen for his assistance in the laboratory to allow for a timely publication of the results and editing the manuscript for language.
Conflicts of Interest
The authors declare no conflict of interest. The funders had no role in the design of the study, in the collection, analyses, or interpretation of data or in the writing of the manuscript. They consented to publish the results.
References
- Forano, C.; Hibino, T.; Leroux, F.; Taviot-Guého, C. Chapter 13.1 Layered Double Hydroxides. In Handbook of Clay Science; Bergaya, F., Theng, B.K., Lagaly, G., Eds.; Elsevier: Amaterdam, The Netherlands, 2006; Volume 1, pp. 1021–1095, Developments in Clay Science. [Google Scholar]
- Mills, S.J.; Christy, A.G.; Génin, J.M.R.; Kameda, T.; Colombo, F. Nomenclature of the hydrotalcite supergroup: Natural layered double hydroxides. Mineral. Mag. 2012, 76, 1289–1336. [Google Scholar] [CrossRef]
- Sánchez-Cantú, M.; Camargo-Martínez, S.; Pérez-Díaz, L.M.; Hernández-Torres, M.E.; Rubio-Rosas, E.; Valente, J.S. Innovative method for hydrocalumite-like compounds’ preparation and their evaluation in the transesterification reaction. Appl. Clay Sci. 2015, 114, 509–516. [Google Scholar] [CrossRef]
- Sankaranarayanan, S.; Antonyraj, C.A.; Kannan, S. Transesterification of edible, non-edible and used cooking oils for biodiesel production using calcined layered double hydroxides as reusable base catalysts. Bioresour. Technol. 2012, 109, 57–62. [Google Scholar] [CrossRef]
- Sipos, P.; Pálinkó, I. As-prepared and intercalated layered double hydroxides of the hydrocalumite type as efficient catalysts in various reactions. Catal. Today 2018, 306, 32–41. [Google Scholar] [CrossRef]
- Shamitha, C.; Mahendran, A.; Anandhan, S. Effect of polarization switching on piezoelectric and dielectric performance of electrospun nanofabrics of poly(vinylidene fluoride)/Ca–Al LDH nanocomposite. J. Appl. Polym. Sci. 2020, 137, 48697. [Google Scholar] [CrossRef]
- Soussou, A.; Gammoudi, I.; Kalboussi, A.; Grauby-Heywang, C.; Cohen-Bouhacina, T.; Baccar, Z.M. Hydrocalumite Thin Films for Polyphenol Biosensor Elaboration. IEEE Trans. NanoBiosci. 2017, 16, 650–655. [Google Scholar] [CrossRef]
- Saha, S.; Ray, S.; Acharya, R.; Chatterjee, T.K.; Chakraborty, J. Magnesium, zinc and calcium aluminium layered double hydroxide-drug nanohybrids: A comprehensive study. Appl. Clay Sci. 2017, 135, 493–509. [Google Scholar] [CrossRef]
- Shahabadi, N.; Razlansari, M.; Zhaleh, H.; Mansouri, K. Antiproliferative effects of new magnetic pH-responsive drug delivery system composed of Fe3O4, CaAl layered double hydroxide and levodopa on melanoma cancer cells. Mater. Sci. Eng. C 2019, 101, 472–486. [Google Scholar] [CrossRef] [PubMed]
- Dutta, K.; Pramanik, A. Synthesis of a novel cone-shaped CaAl-layered double hydroxide (LDH): Its potential use as a reversible oil sorbent. Chem. Commun. 2013, 49, 6427–6429. [Google Scholar] [CrossRef] [PubMed]
- Xu, Y.; Xu, X.; Hou, H.; Zhang, J.; Zhang, D.; Qian, G. Moisture content-affected electrokinetic remediation of Cr(VI)-contaminated clay by a hydrocalumite barrier. Environ. Sci. Pollut. Res. 2016, 23, 6517–6523. [Google Scholar] [CrossRef] [PubMed]
- Chrysochoou, M.; Dermatas, D. Evaluation of ettringite and hydrocalumite formation for heavy metal immobilization: Literature review and experimental study. J. Hazard. Mater. 2006, 136, 20–33. [Google Scholar] [CrossRef] [PubMed]
- Bernardo, M.P.; Moreira, F.K.; Ribeiro, C. Synthesis and characterization of eco-friendly Ca-Al-LDH loaded with phosphate for agricultural applications. Appl. Clay Sci. 2017, 137, 143–150. [Google Scholar] [CrossRef]
- Das, S.; Roy, S. A newly designed softoxometalate [BMIm]2[DMIm][α−PW12O40]@hydrocalumite that controls the chain length of polyacrylic acid in the presence of light. RSC Adv. 2016, 6, 37583–37590. [Google Scholar] [CrossRef]
- Labuschagne, F.J.W.J.; Molefe, D.M.; Focke, W.W.; Van Der Westhuizen, I.; Wright, H.C.; Royeppen, M.D. Heat stabilising flexible PVC with layered double hydroxide derivatives. Polym. Degrad. Stab. 2015, 113, 46–54. [Google Scholar] [CrossRef]
- Moon, J.H.; Oh, J.E.; Balonis, M.; Glasser, F.P.; Clark, S.M.; Monteiro, P.J. Pressure induced reactions amongst calcium aluminate hydrate phases. Cem. Concr. Res. 2011, 41, 571–578. [Google Scholar] [CrossRef]
- Rives, V. Layered Double Hydroxides: Present and Future; Nova Science Publishers: New York, NY, USA, 2001; pp. 39–92. [Google Scholar]
- Muráth, S.; Somosi, Z.; Kukovecz, Á.; Kónya, Z.; Sipos, P.; Pálinkó, I. Novel route to synthesize CaAl- and MgAl-layered double hydroxides with highly regular morphology. J. Sol-Gel Sci. Technol. 2019, 89, 844–851. [Google Scholar] [CrossRef]
- Labuschagné, F.J.; Wiid, A.; Venter, H.P.; Gevers, B.R.; Leuteritz, A. Green synthesis of hydrotalcite from untreated magnesium oxide and aluminum hydroxide. Green Chem. Lett. Rev. 2018, 11, 18–28. [Google Scholar] [CrossRef]
- Ferencz, Z.; Kukovecz, A.; Kónya, Z.; Sipos, P.; Pálinkó, I. Optimisation of the synthesis parameters of mechanochemically prepared CaAl-layered double hydroxide. Appl. Clay Sci. 2015, 112–113, 94–99. [Google Scholar] [CrossRef]
- Peppler, R.; Wells, L. The system of lime, alumina, and water from 50-degrees to 250-degrees C. J. Res. Natl. Bur. Stand. 1954, 52, 75–92. [Google Scholar] [CrossRef]
- Majumdar, A.J.; Roy, R. The system CaO−Al2O3−H2O. J. Am. Ceram. Soc. 1956, 40, 434–442. [Google Scholar] [CrossRef]
- Lothenbach, B.; Pelletier-Chaignat, L.; Winnefeld, F. Stability in the system CaO−Al2O3−H2O. Cem. Concr. Res. 2012, 42, 1621–1634. [Google Scholar] [CrossRef]
- Buttler, F.G.; Glasser, D.; Taylor, H.F.W. Studies on 4 CaO·Al2O3·13H2O and the Related Natural Mineral Hydrocalumite. J. Am. Ceram. Soc. 1958, 42, 121–126. [Google Scholar] [CrossRef]
- Renaudin, G.; Francois, M.; Evrard, O. Order and disorder in the lamellar hydrated tetracalcium monocarboaluminate compound. Cem. Concr. Res. 1999, 29, 63–69. [Google Scholar] [CrossRef]
- Gabrovšek, R.; Vuk, T.; Kaučič, V. The preparation and thermal behavior of calcium monocarboaluminate. Acta Chim. Slov. 2008, 55, 942–950. [Google Scholar]
- Gevers, B.R.; Labuschagné, F.J. Temperature effects on the dissolution-precipitation synthesis of hydrocalumite. In AIP Conference Proceedings; The American Institute of Physics: College Park, MD, USA, 2019; Volume 2055. [Google Scholar] [CrossRef]
- Mesbah, A.; Rapin, J.P.; François, M.; Cau-Dit-Coumes, C.; Frizon, F.; Leroux, F.; Renaudin, G. Crystal structures and phase transition of cementitious Bi-anionic AFm-(Cl−, CO32−) compounds. J. Am. Ceram. Soc. 2011, 94, 262–269. [Google Scholar] [CrossRef]
- Abd-El-Raoof, F.; Tawfik, A.; Komarneni, S.; Ahmed, S.E. Hydrotalcite and hydrocalumite as resources from waste materials of concrete aggregate and Al-dross by microwave-hydrothermal process. Constr. Build. Mater. 2019, 207, 10–16. [Google Scholar] [CrossRef]
- Mora, M.; López, M.I.; Jiménez-Sanchidrián, C.; Ruiz, J.R. Ca/Al mixed oxides as catalysts for the meerwein-ponndorf-verley reaction. Catal. Lett. 2010, 136, 192–198. [Google Scholar] [CrossRef]
- Kagunya, W.; Baddour-Hadjean, R.; Kooli, F.; Jones, W. Vibrational modes in layered double hydroxides and their calcined derivatives. Chem. Phys. 1998, 236, 225–234. [Google Scholar] [CrossRef]
- Schroeder, P. Infrared spectroscopy in clay science. Teach. Clay Sci. 2002, 11, 181–206. [Google Scholar]
- Kloprogge, J.T.; Ruan, H.D.; Frost, R.L. Thermal decomposition of bauxite minerals: Infrared emission spectroscopy of gibbsite, boehmite and diaspore. J. Mater. Sci. 2002, 37, 1121–1129. [Google Scholar] [CrossRef]
- Runčevski, T.; Dinnebier, R.E.; Magdysyuk, O.V.; Pöllmann, H. Crystal structures of calcium hemicarboaluminate and carbonated calcium hemicarboaluminate from synchrotron powder diffraction data. Acta Crystallogr. Sect. B: Struct. Sci. 2012, 68, 493–500. [Google Scholar] [CrossRef] [PubMed]
- Carlson, E.T.; Berman, H.A. Some observations on the calcium aluminate carbonate hydrates. J. Res. Nation. Bureau Stand. Sect. A Phys. Chem. 1960, 64A, 333–341. [Google Scholar] [CrossRef]
- Lee, D.H.; Condrate, R.A. An FTIR spectral investigation of the structural species found on alumina surfaces. Mater. Lett. 1995, 23, 241–246. [Google Scholar] [CrossRef]
- Su, C.; Suarez, D.L. In situ infrared speciation of adsorbed carbonate on aluminum and iron oxides. Clays Clay Miner. 1997, 45, 814–825. [Google Scholar] [CrossRef]
- Morterra, C.; Emanuel, C.; Cerrato, G.; Magnacca, G. Infrared study of some surface properties of boehmite (γ-AlO2H). J. Chem. Soc. Faraday Trans. 1992, 88, 339–348. [Google Scholar] [CrossRef]
- Coenen, K.; Gallucci, F.; Mezari, B.; Hensen, E.; van Sint Annaland, M. An in-situ IR study on the adsorption of CO2 and H2O on hydrotalcites. J. CO2 Util. 2018, 24, 228–239. [Google Scholar] [CrossRef]
- Coto, B.; Martos, C.; Peña, J.L.; Rodríguez, R.; Pastor, G. Effects in the solubility of CaCO3: Experimental study and model description. Fluid Phase Equilibria 2012, 324, 1–7. [Google Scholar] [CrossRef]
- Gevers, B.R.; Labuschagné, F.J.W.J. Parameters influencing the formation of katoite. 2020; unpublished. [Google Scholar]
- Ipavec, A.; Gabrovšek, R.; Vuk, T.; Kaučič, V.; Maček, J.; Meden, A. Carboaluminate phases formation during the hydration of calcite-containing Portland cement. J. Am. Ceram. Soc. 2011, 94, 1238–1242. [Google Scholar] [CrossRef]
- Bizzozero, J.; Scrivener, K.L. Limestone reaction in calcium aluminate cement-calcium sulfate systems. Cem. Concr. Res. 2015, 76, 159–169. [Google Scholar] [CrossRef]
© 2020 by the authors. Licensee MDPI, Basel, Switzerland. This article is an open access article distributed under the terms and conditions of the Creative Commons Attribution (CC BY) license (http://creativecommons.org/licenses/by/4.0/).