Abstract
Optical performance in terms of light efficiency, color crosstalk and ambient contrast ratio were analyzed for blue GaN-based micro-light emitting diodes (micro-LEDs) combined with red/green quantum dots (QDs)-polymethyl methacrylate (PMMA) films. The thickness and mass ratio of QDs films are two critical factors in affecting the performance of micro-LEDs. Firstly, the precise optical modeling of QDs-PMMA films is established based on the double integrating sphere (DIS) testing system and inverse adding doubling algorithm (IADA) theory. Red and green QDs-PMMA films are composed of ZnCdSe/ZnS QDs and green ZnCdSeS/ZnS QDs, respectively. The fundamental optical parameters of QDs-PMMA films, including scattering, absorption and anisotropy coefficients, are obtained successfully. Secondly, based on these optical parameters, the Monte Carlo ray tracing method is applied to analyze the effect of a QDs-PMMA film’s thickness and mass ratio on the optical performance of micro-LEDs. Results reveal that the light efficiency first increases and then decreases with the increase of a QDs film’s thickness or mass ratio, owing to the scattering characteristics of QDs. Different from the variation tendencies of light efficiency, the crosstalk between adjacent pixels increases as the QDs-PMMA film’s thickness or mass ratio increases, and the ambient contrast ratio is kept stable when the thickness increases. The mass ratio variation of QDs film can change the optical performance of micro-LEDs more effectively than thickness, which demonstrates that mass ratio is a more important factor affecting the optical performance of micro-LEDs.
1. Introduction
Owing to their advantages of low power consumption, long life, high brightness and excellent reliability, light-emitting diodes (LEDs) have been developed rapidly for many years [1,2,3]. As a novel technology applied in the display field, micro-light emitting diodes (micro-LEDs) have attracted lots of attention in recent years. Compared with traditional LEDs, the micro-LED is reduced to micrometer-scale size (< 50 μm) [4,5,6]. For realizing the full color display of micro-LEDs, different technologies have been presented, such as combining the three colorized red, green and blue (RGB) micro-LED chip and color conversion material methods [7,8,9,10,11]. The combining RGB micro-LED chips method arrays red, green and blue micro-LED chips on the panel, which has the disadvantage of a complex driving circuit. Moreover, as the color attenuation of RGB micro-LED chips is different, the color stability of the RGB method will deteriorate after a long working time. Therefore, the blue micro-LED chip is used to excite light conversion material to generate full color, which is a preferable method. Liu et al. presented the method of an ultraviolet micro-LED coated with RGB phosphor [7]. However, the phosphor cannot be uniformly coated on a micro-LED due to its large size (>10 μm), leading to an uneven color distribution and a low light conversion efficiency. It has recently been discovered that colloidal quantum dots (QDs) as a novel light conversion material can solve the above issue [8], and the micro-LED display combined with a QD has the properties of high resolution, a wide color gamut and a superior color rendering index. Kuo et al. sprayed QDs on ultraviolet micro-LEDs to generate an RGB trichromatic light, and then realized the full color display [9,10]. Furthermore, blue micro-LEDs were also used to stimulate the red and green QDs, and the distributed Bragg reflector (DBR) was introduced to improve light utilization efficiency [11].
However, previous studies mostly focused on the fabrication process of QDs-based micro-LEDs, whereas the influence of QDs’ parameters on the optical performance of micro-LEDs has rarely been investigated. Therefore, the optical performance analysis for red/green QDs-based blue GaN-based micro-LEDs should be conducted for guiding the design of colorful micro-LEDs. In this paper, the precise optical modeling of red/green QDs is first established. Red ZnCdSe/ZnS QDs and green ZnCdSeS/ZnS QDs are both colloidal QDs in terms of core-shell alloy structures, which are easy to synthesize and have better stability due to their larger size. Based on the optical measurement of QDs-polymethyl methacrylate (PMMA) films through the double integrating sphere (DIS) testing system and the inverse adding doubling algorithm (IADA), the fundamental optical properties of a QDs-PMMA film are obtained. Then, based on the Monte Carlo ray tracing method, the optical performance for different mass ratios (MR) of QDs to PMMA and the thickness of QDs films are simulated. Optical performance, including light efficiency, color crosstalk and ambient contrast ratio for GaN-based micro-LEDs combined with a QDs film are obtained through this simulation. The simulation result is analyzed, and the optimal parameters of the QDs film will then be obtained.
2. Models, Analysis and Discussion
2.1. Establishing the Precise Optical Modeling for QDs
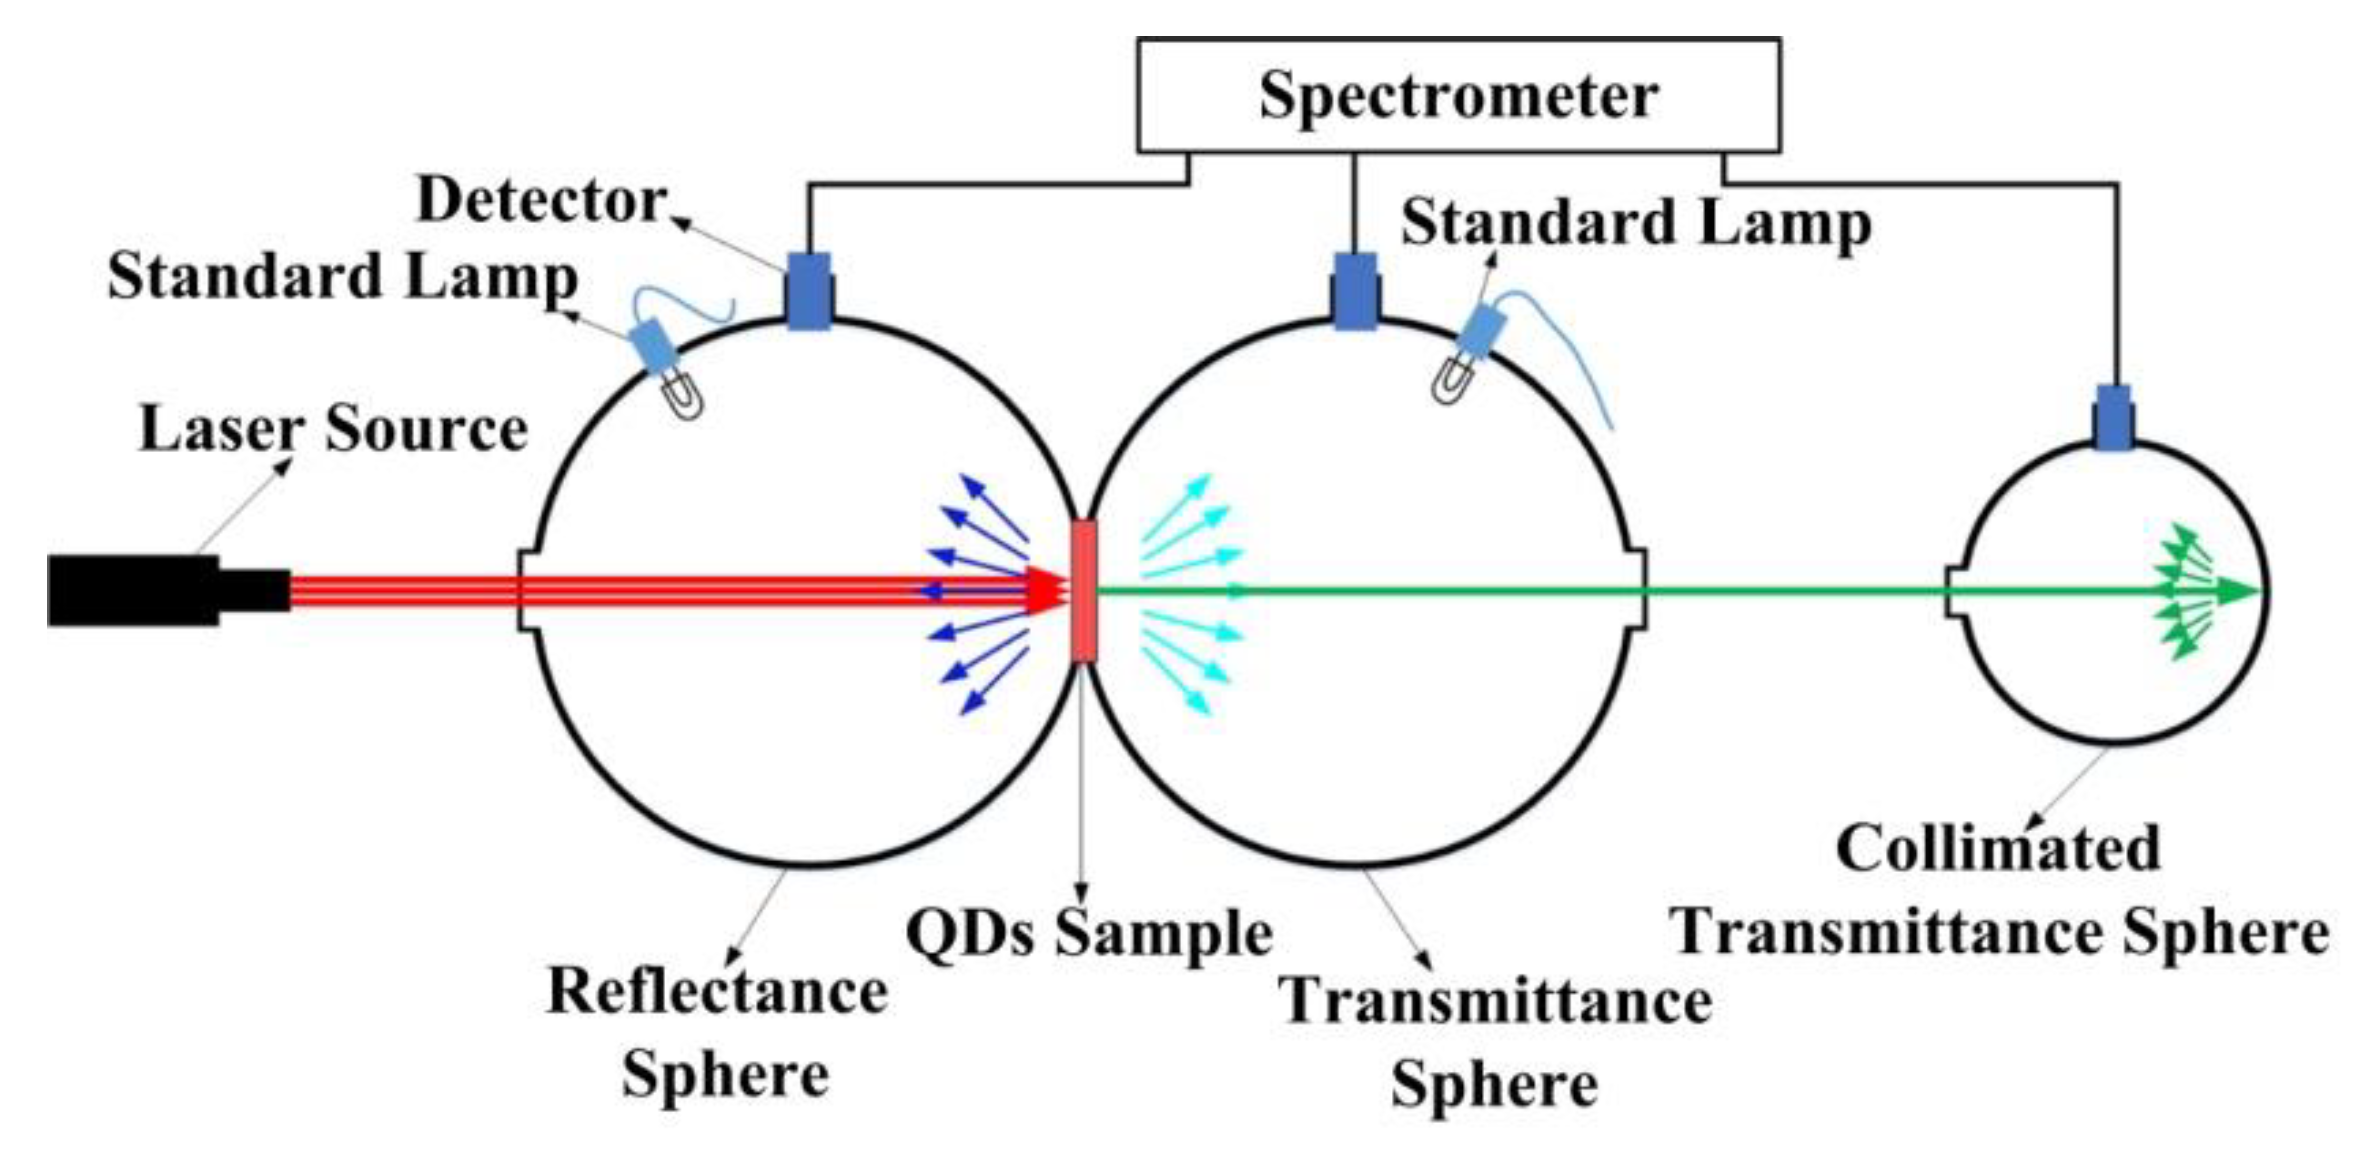
Firstly, the fundamental optical properties of QDs need to be obtained. The double integrating sphere (DIS) testing system and inverse adding doubling algorithm (IADA) theory are used to generate the above optical properties [12,13,14]. The DIS testing system is used for measuring the primary optical parameters in terms of the reflectance ratio Vr, transmittance ratio Vt and collimated transmittance ratio Vc, whose structure diagram is shown in Figure 1. The QDs sample to be measured is clamped in the middle between the reflectance integrating sphere and the transmission integrating sphere. The collimated blue lights emitting from the laser source irradiate on the sample. Reflection, transmission and collimated transmission integrating spheres collect the reflected light energy, transmitted light energy and collimated transmission light energy, respectively. According to photoelectric detectors, the received light signal is converted to an electric signal, and transmitted to the spectrometer for processing and analysis. The reflectance ratio Vr, transmittance ratio Vt and collimated transmittance ratio Vc are calculated by the following equations:
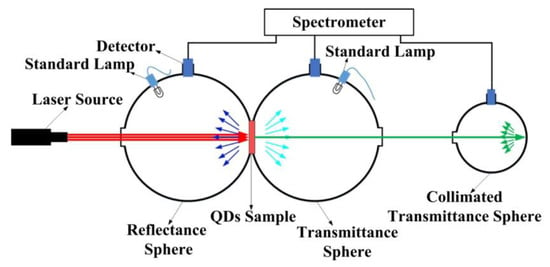
Figure 1.
Schematic of the double integrating sphere testing system.
After the QDs sample is placed between two integrating spheres, Pr, Pt and Pc are the light power measured by the reflectance integrating sphere, transmittance integrating sphere and collimated transmittance integrating sphere, respectively. Ptotal is total light power of incident light without the sample measured by the integrating sphere. Finally, the reflectivity, transmission and collimated transmission ratio of the sample for the incident light are obtained.
The QDs samples used in the above measurement need be synthesized by a series of chemical methods. Firstly, the colloidal alloyed ZnxCd11-xSeyS1-y QDs are synthesized as the following [15,16,17]. For a typical synthesis of green Zn0.83Cd0.17Se0.64S0.36 QDs (x = 0.83, y = 0.64), the TOP (trioctylphosphine) -S-Se solution is prepared, first by mixing 2.7 mmol Se powder, 1.5 mmol S powder and 2.5 mL TOP into a 5 mL vial, and then stirring to obtain a clear solution at room temperature. Next, the Cd-(oleate)2 and Zn-(oleate)2 solution is prepared by adding 0.98 mmol CdO, 3.22 mmol Zn-(Ac)2 (zinc acetate), 6 mL OA (oleic acid) and 15 mL ODE (octadecene) into a 100 mL three-neck round bottom flask. The solution is dried under a vacuum at 130 °C for 30 min to remove the oxygen and water, and the solution is then heated to 300 °C under a high-purity N2 atmosphere. At this elevated temperature, as-prepared TOP-S-Se solution (2.5 mL) is swiftly injected. The reaction temperature is maintained at 300 °C for 10 min, and then cooled to 260 °C, and 2 mmol Zn-(oleate)2 solution and 2 mmol TOP-S are injected to grow a ZnS shell. Finally, the product is purified several times by repeating the precipitation/redispersion processes using methanol and toluene. A similar process is used to synthesize red Zn0.67Cd0.33Se QDs; 2.7 mmol Se powder and 1.5 mmol S powder are replaced by 4.2 mmol Se powder to dissolve into the TOP, and the 0.98 mmol CdO and 3.22 mmol Zn-(Ac)2 are replaced with 1.4 mmol CdO and 2.8 mmol Zn-(Ac)2.
Then, the preparation process of QDs-PMMA film is as follows. Firstly, 1.18 g of polymethyl methacrylate (PMMA) powder and 15 ml of toluene are mixed in a three-neck flask. The mixed solution is stirred for 2 hours, until the PMMA powder is completely dissolved in toluene to form a transparent PMMA-toluene solution. Similarly, 59 mg of red/green QDs powder is dissolved into 1ml of toluene, and then 15 ml of PMMA-toluene solution and 1 ml of QDs-toluene solution are transferred to a centrifuge tube and stirred for 10 minutes, until QDs are dispersed evenly in the PMMA-toluene solution. After that, a mixed solution with a certain viscosity is obtained. Finally, the uniform mixed solution is introduced into a customized mold, which is then placed on a horizontal platform, and the red/green QDs films are then obtained after toluene volatilizing. Similarly, by changing the mass of the QDs powder from 11.8 mg to 129.8 mg, a QDs-toluene solution with a different mass ratio (MR) can be obtained. Repeating the above preparation steps, the film samples with a different MR of QDs to PMMA can be obtained. The MR of QDs to PMMA will be used as an important factor to evaluate the effect of QDs on the optical performance of micro-LEDs in later simulations. Thickness—referring to the thickness of the prepared QDs film as another key factor—will also affect the optical performance of micro-LED.
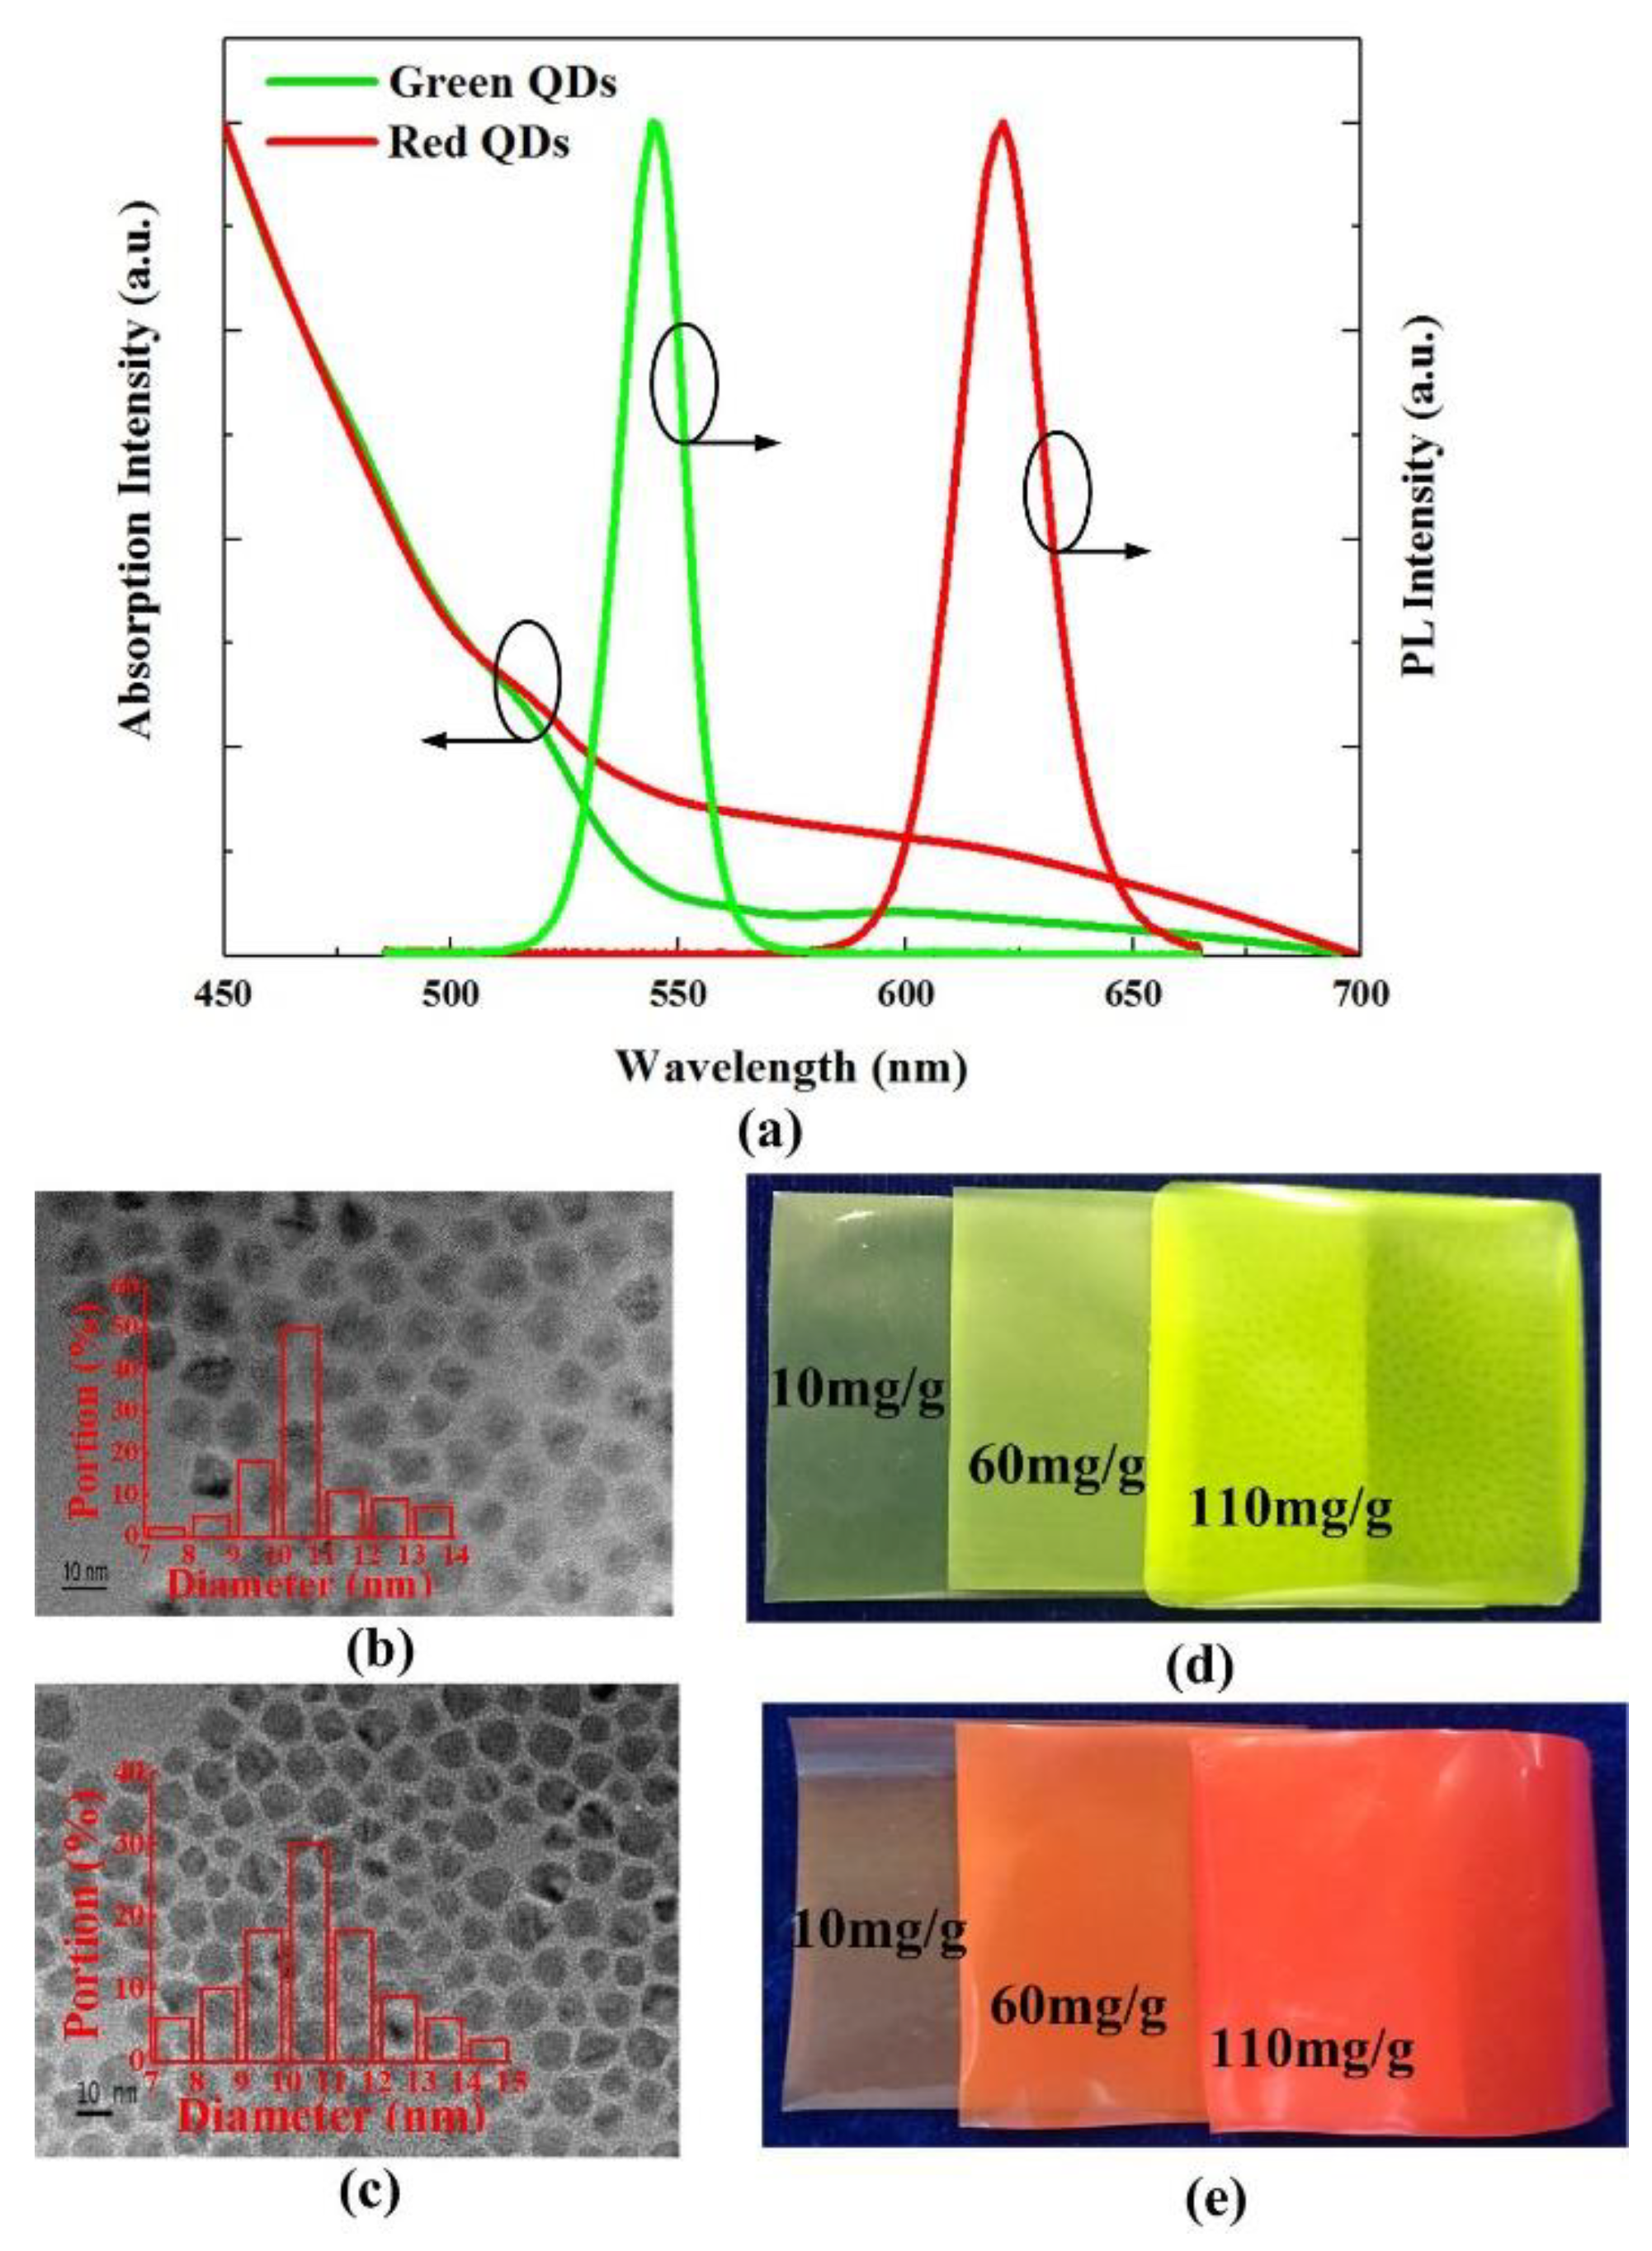
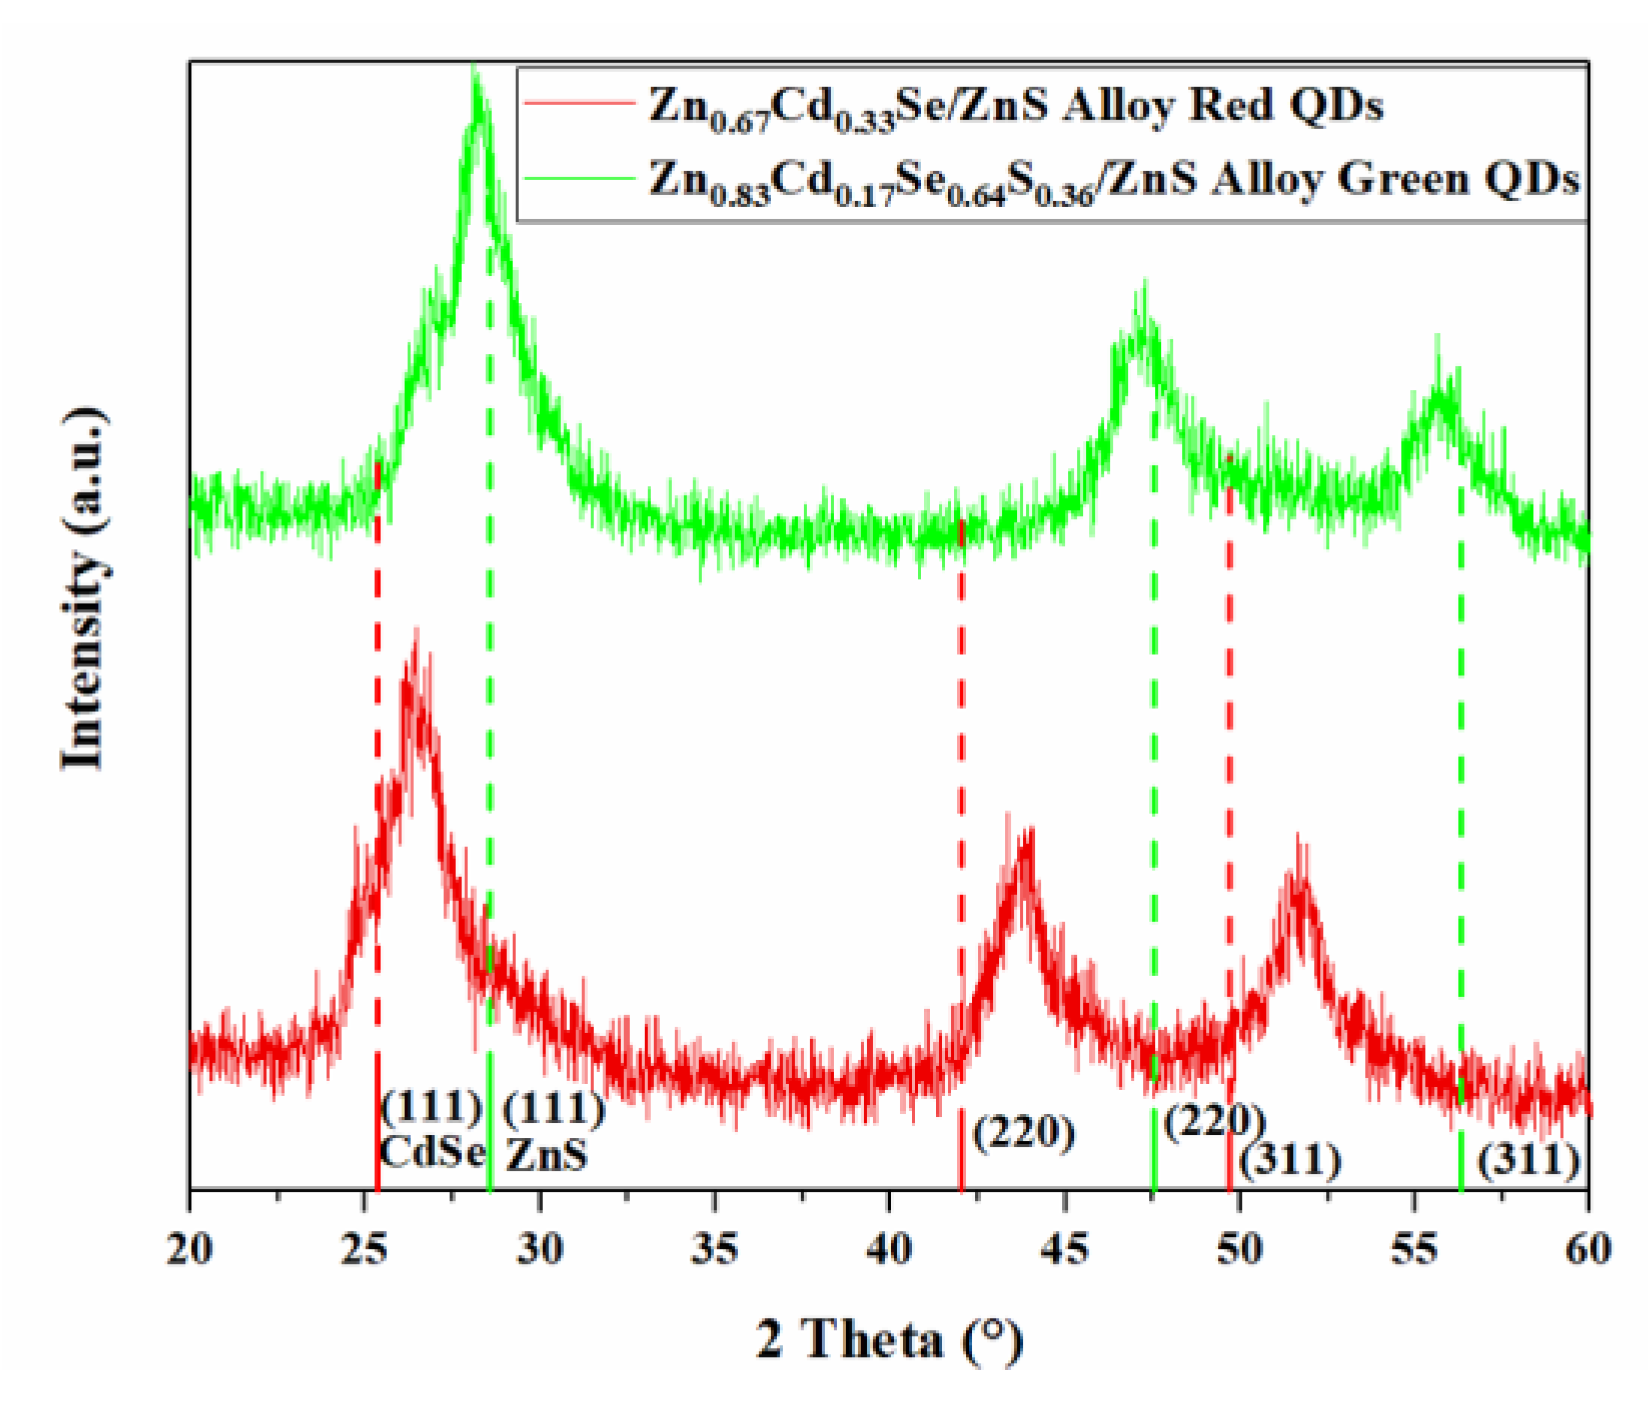
Figure 2a shows the absorption and photoluminescence (PL) spectra of the QDs film. The full width at half maximum (FWHM) of the PL spectra is near 31 nm and 23 nm for red and green QDs, respectively, while the samples’ peak wavelengths are 625 nm and 535 nm, respectively. The absorption and PL spectra overlap at the emission light wavelength band, so a part of self-emission light will be absorbed by QDs. Figure 2b,c show the high-resolution transmission electron microscope (TEM) images of the as-prepared green and red QDs, respectively. Figure 2d,e show the photographs of the green and red QDs-PMMA films with mass ratios of 10mg/g, 60mg/g and 110mg/g, respectively. The thickness of these QDs films is maintained at less than 0.1 mm. As shown in Figure 3, red QDs and green QDs are also characterized by X-ray diffraction (XRD) analysis. The Jade as an XRD analysis software is used for material lattice matching. The XRD spectra and corresponding three strongest diffraction peaks of green and red QDs are both located between wurtzite CdSe (JCPDF No. 19-0191) and wurtzite ZnS (JCPDF No. 05-0566), which demonstrates that the structure of green QDs material is ZnCdSeS/ZnS alloy QDs, and that of red QDs material is ZnCdSe/ZnS alloy QDs. However, the three strongest diffraction peaks of green QDs are closer to wurtzite ZnS (JCPDF No. 05-0566), which suggests that green QDs have more ZnS components. Correspondingly, the three strongest diffraction peaks of red QDs are shifted to wurtzite CdSe (JCPDF No. 19-0191), which indicates that the main components of red QDs are CdSe.
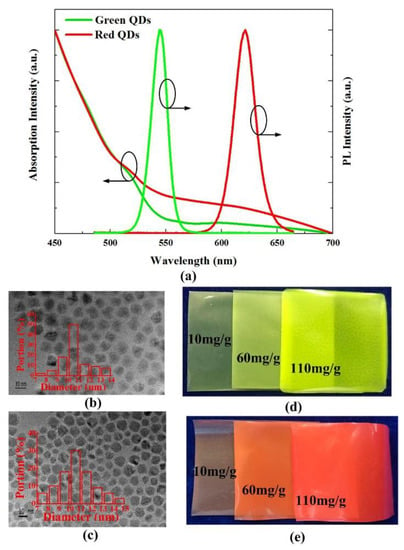
Figure 2.
(a) Absorption and PL spectra of the green/red QDs; (b) and (c) TEM images of the as-prepared green and red QDs, respectively; and (d) and (e) photographs of the green and red QDs-PMMA film, respectively.
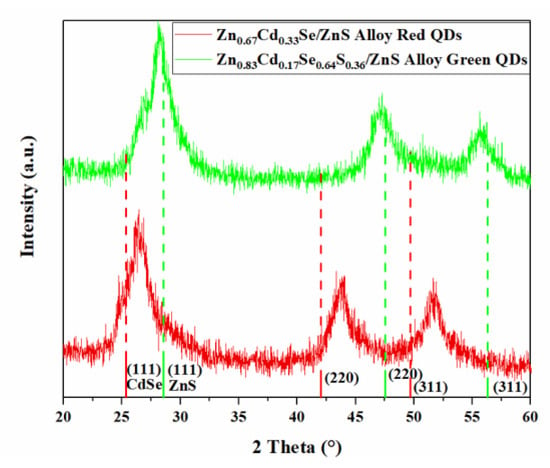
Figure 3.
XRD results of powdered samples of red and green QDs. The XRD PDF standard card of CdSe (red bars, JCPDF of No. 19-0191) and ZnS (green bars, JCPDF of No. 05-0566) are also exhibited under XRD results, respectively, as the references.
After the QDs-PMMA films are fabricated and macroscopic optical parameters are measured, the fundamental optical parameters—including scattering coefficient μs, absorption coefficient μa and anisotropy coefficient g—can be obtained based on the IADA [12]. Scattering coefficient μs, absorption coefficient μa and anisotropy coefficient g are calculated by the following equations:
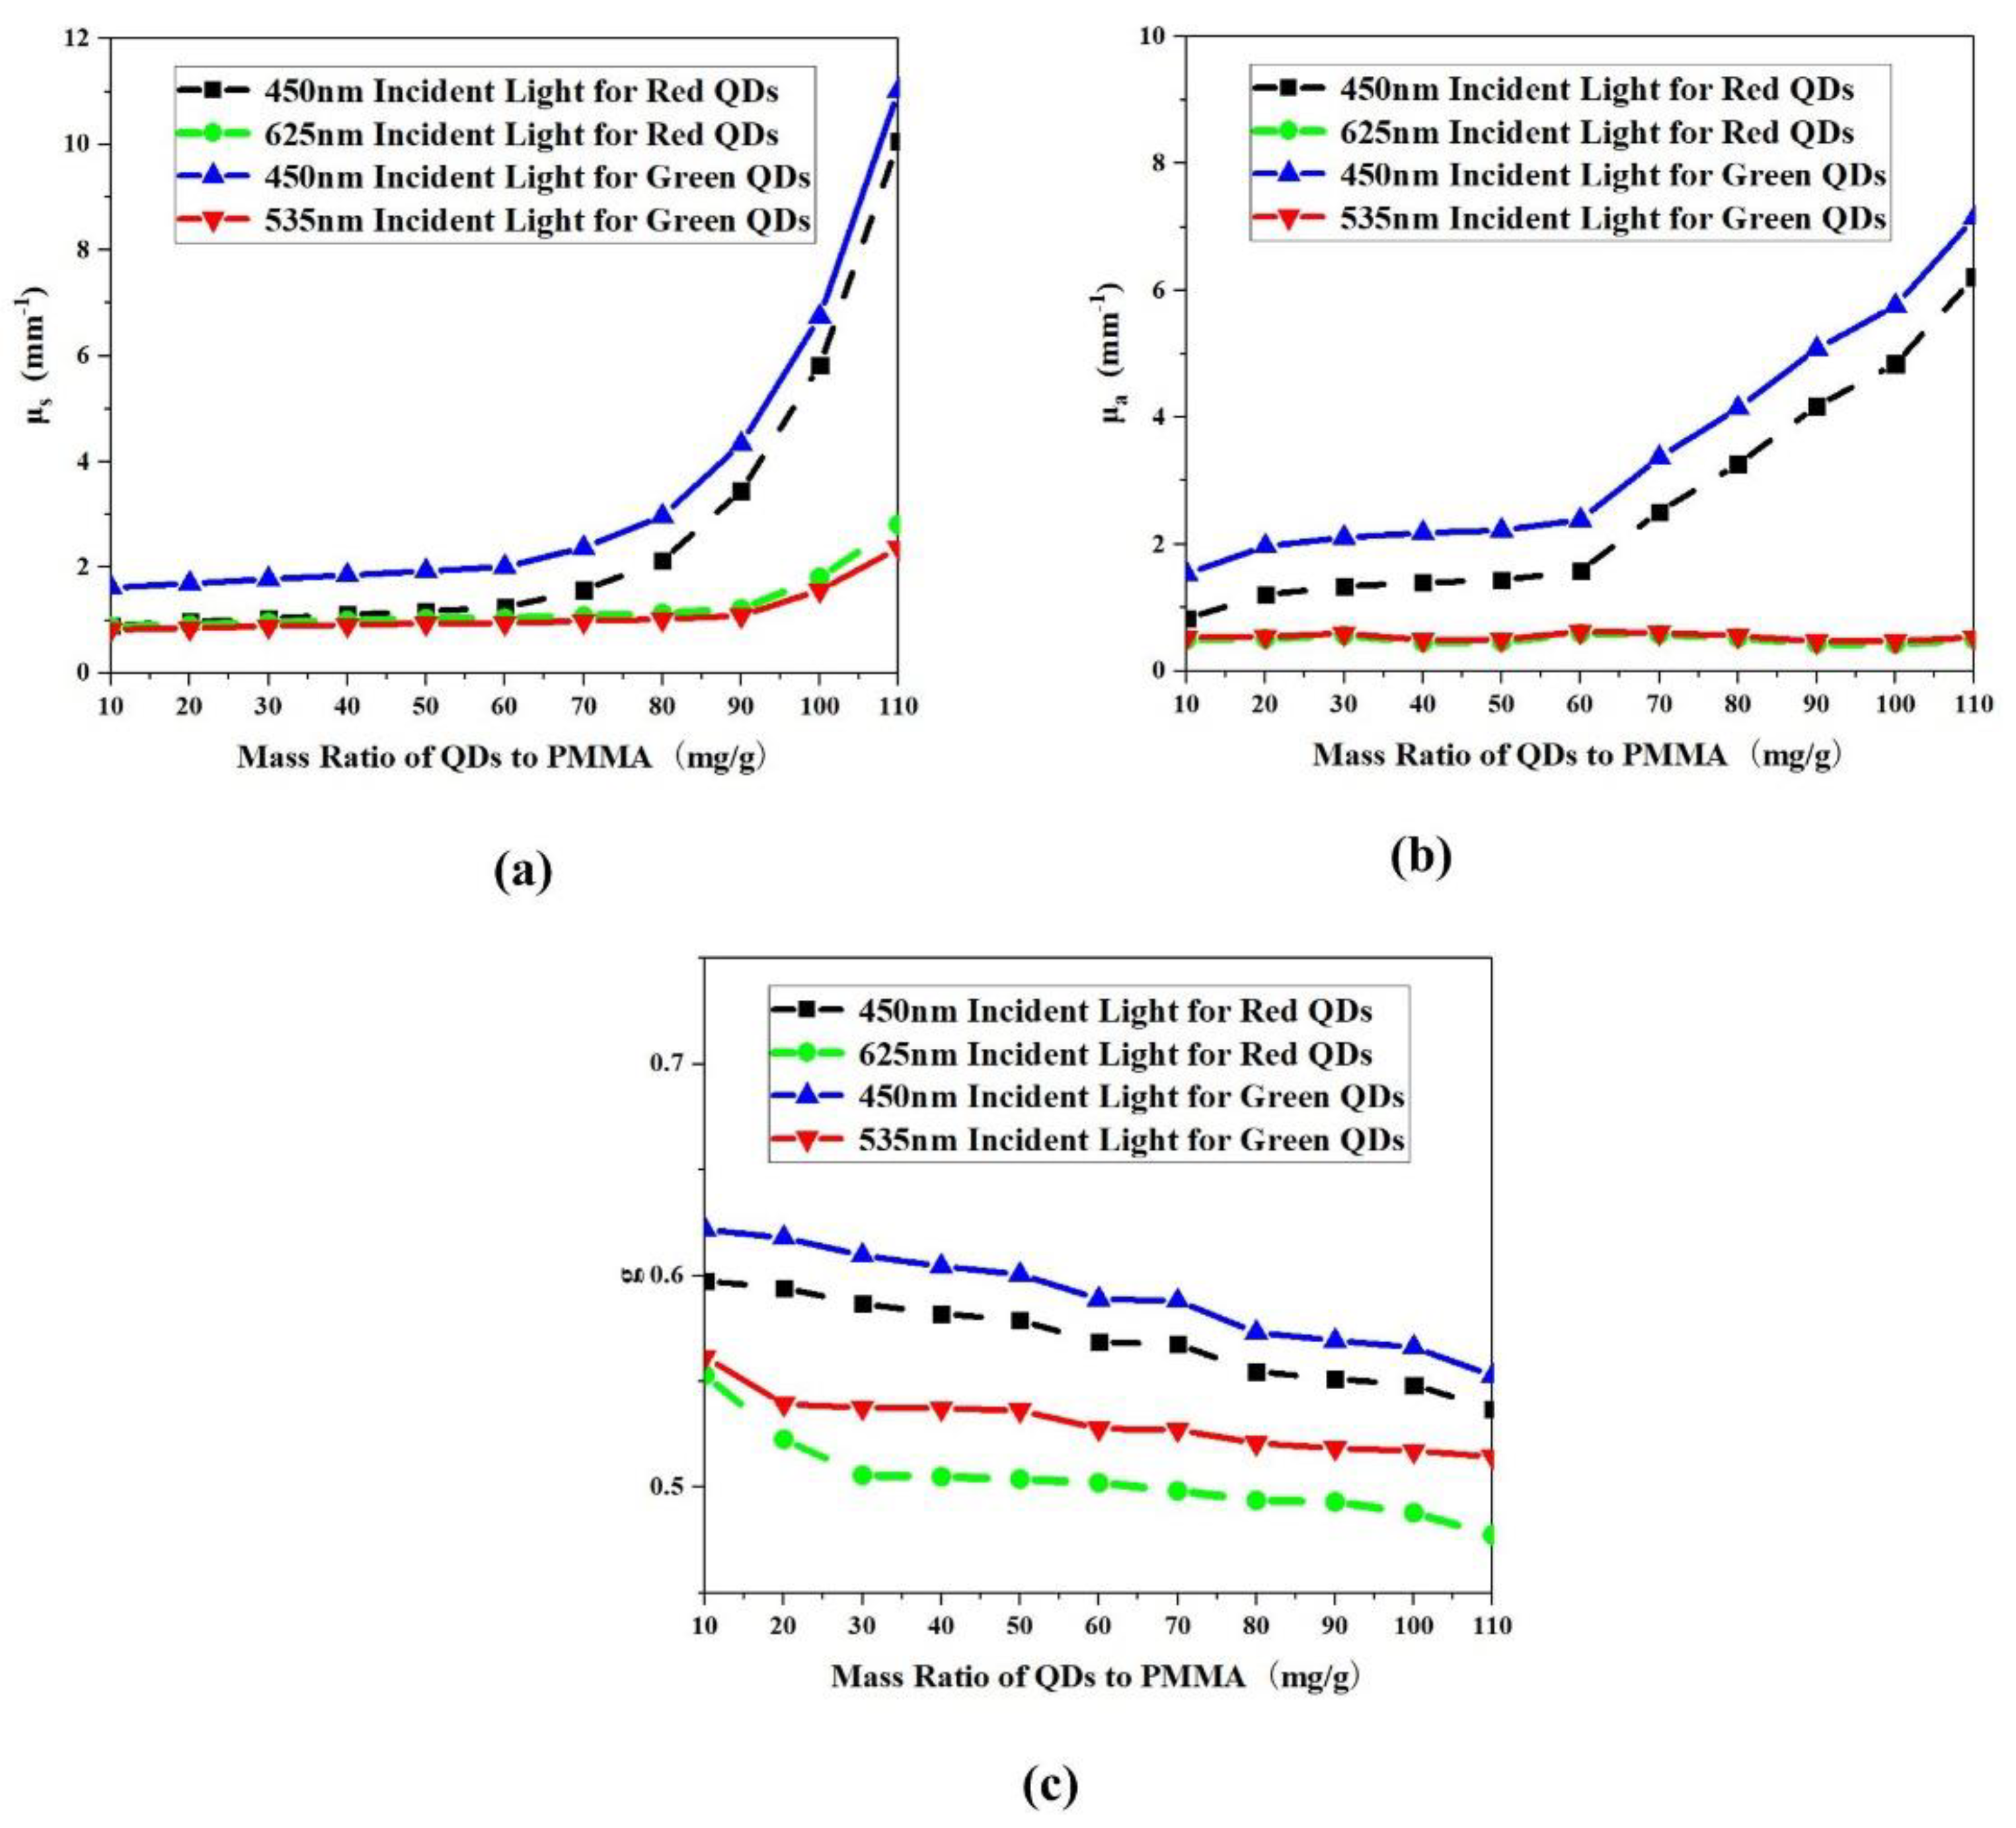
where the scattering coefficient μs and the absorption coefficient μa are defined as the reciprocal of the average free path between two scattering events (Is) or two absorption events (Ia), respectively. The anisotropy coefficient g is the integral of the phase function P(v), where P(v) is the distribution function of light propagation direction. IADA is an effective method for calculating the basic optical characteristic parameters for a QDs sample. The calculation process of the method is to follow the steps below. First, assume a set of randomly generated optical parameters (μs’, μa’, g’). Secondly, according to the radiation transmission equation and assumed parameters (μs’, μa’, g’), the macroscopic optical parameters (Vr’, Vt’, Vc’) of the QDs sample are calculated. Then, the calculated macroscopic optical parameters are compared with the actual measurement values (Vr, Vt, Vc) by the integral sphere. If the deviation of the calculated and the measured values exceeds the set threshold, the primary optical parameters (μs’, μa’, g’) will be reassigned. Finally, after several iterations until the deviation of the calculated and measured values up to the allowable range, basic optical parameters (μs, μa, g) are generated. A series of red and green QDs samples with different mass ratios are fabricated. Based on above mentioned method, the optical properties of QDs samples can be obtained by measurement and calculation, and the results are shown in Figure 4. The scattering effect of red/green QDs is obvious for the excited blue light. Red/green QDs both have strong absorption characteristics for the excited wavelength of 450 nm, but weak absorption for the converted red/green light. With the mass ratio of red and green QDs film increasing, the scattering and absorption coefficients also increase, while the anisotropy coefficient decreases. Under the same mass ratio, the scattering, anisotropy and absorption coefficients of the excited blue light are more significant than the converted red/green light for red/green QDs, while the anisotropy coefficient of the converted light for green QDs is more significant than that of red QDs.
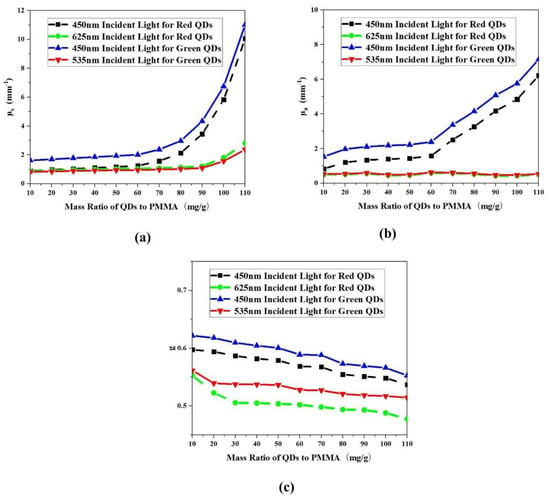
Figure 4.
Calculated optical properties for red/green QDs samples with different mass ratio (a) the scattering coefficient μs; (b) the absorption coefficient μa; and (c) the anisotropy coefficient g.
2.2. Optical Simulation for GaN Based Micro-LED with QDs Film
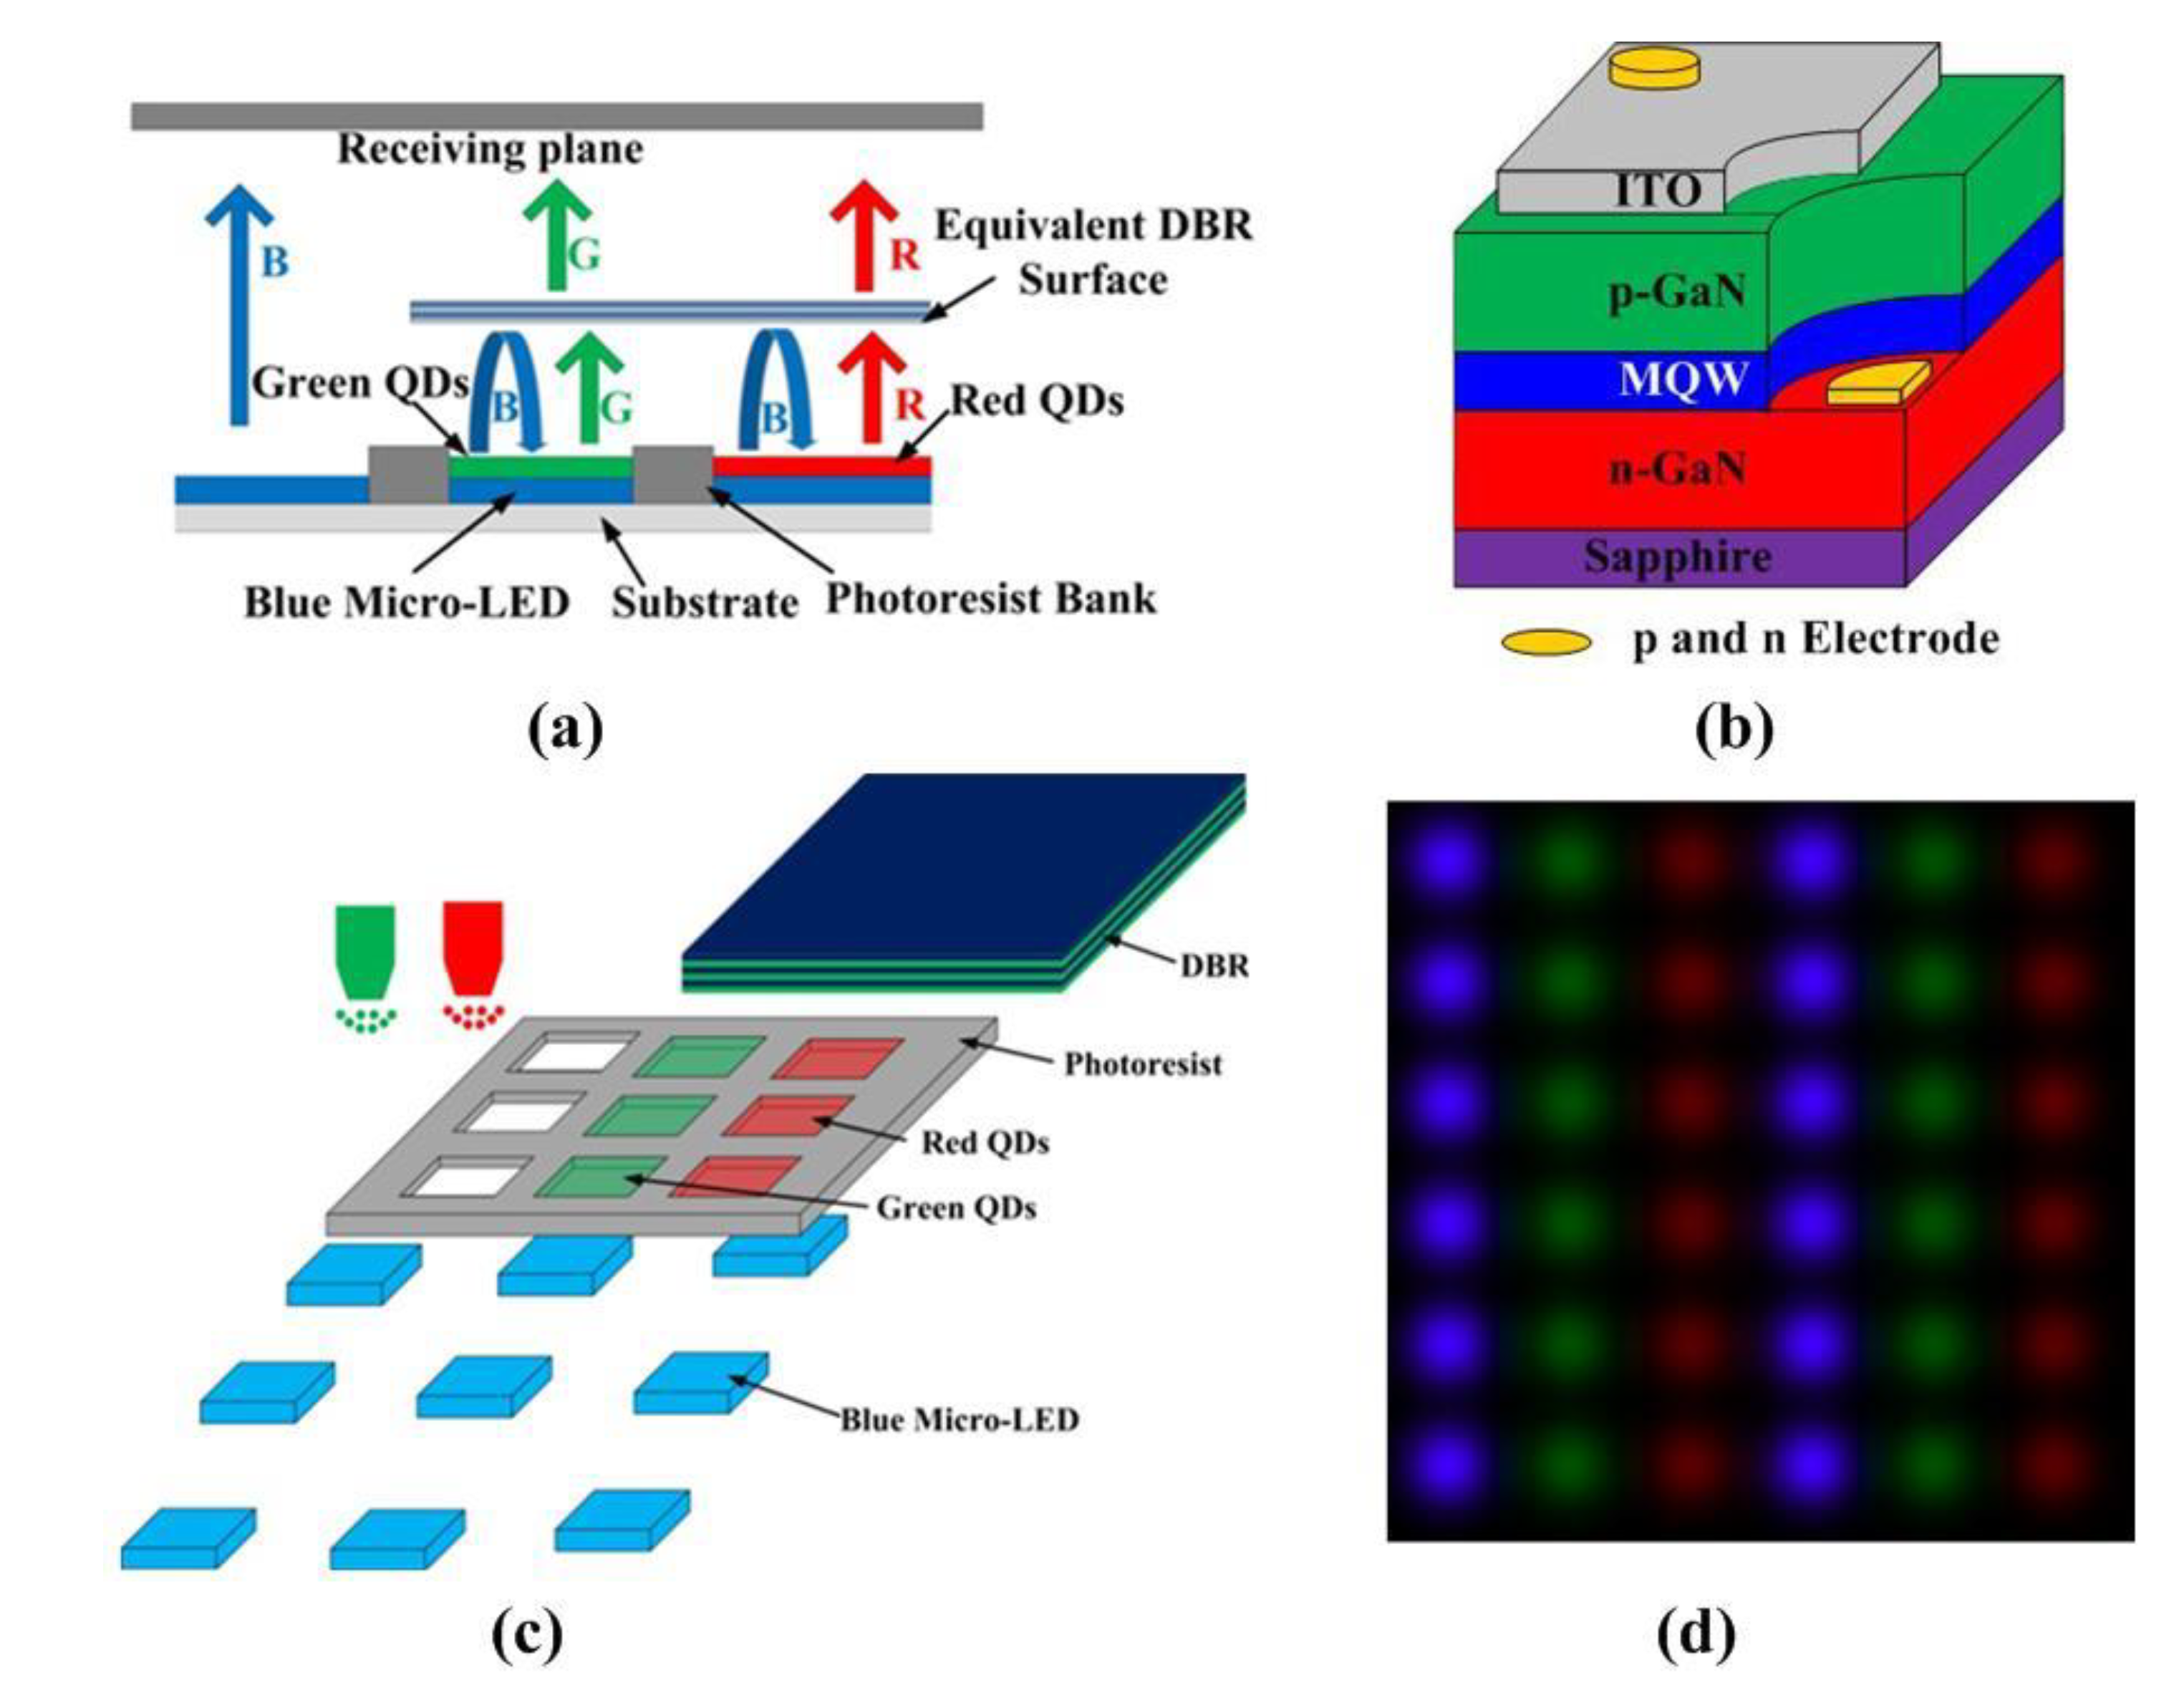
The 2-D and 3-D configuration of GaN-based micro-LEDs with a QDs matrix is shown in Figure 5a,c, which comprise blue GaN-based micro-LED chips, red/green QDs, a photoresist bank and a distributed Bragg reflector (DBR). In this paper, the thickness and mass ratio of PMMA-QDs film are changed to investigate the effects on the optical performance of micro-LEDs, and the properties of the other elements are assumed to be constant. A monochromic blue GaN-based micro-LED chip is used as the excitation source, which can be purchased through Xiamen Changelight Co., Ltd. The structure of the blue GaN-based micro-LED chip is shown in Figure 5b [5]. The wavelength of the blue micro-LED chip is 450 nm, and the size is set as 30 μm × 30 μm × 100 μm. In this model, the optical properties of the red/green QDs matrix are applied with the results obtained in Section 2.1. The QDs first absorb blue light, and then re-emit the red/green light as the excited light. A photoresist bank is used to restrict the light emergent direction emitted from an individual pixel, and then realize the reduction of the crosstalk between adjacent pixels. To improve the light utilization rate, the surface properties of the photoresist bank are set as 90% reflection, 5% scattering and 5% absorption. DBR is capable of high reflectivity for blue light and high transmission effect for other colors, improving the blue light utilization efficiency and color contrast. In the paper, the bottom surface of the object is set as an equivalent DBR, and the surface properties are 100% reflection for blue light and 100% transmission for red/green light, at a 90° angle of incidence. When light strikes obliquely, both DBR’s reflection for blue light and the transmission for red/green light are reduced [11].
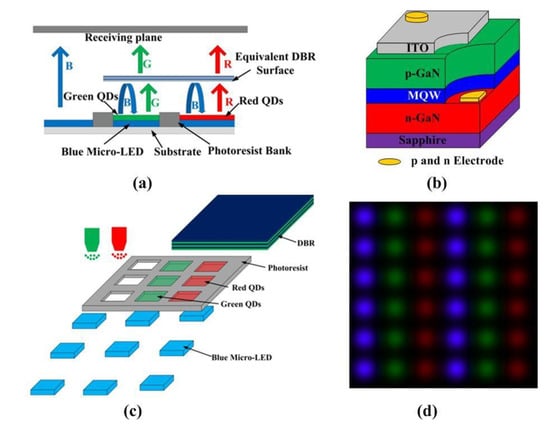
Figure 5.
Schematic configuration of GaN-based micro-LEDs with a QDs matrix (a) 2-dimensional view; (b) the structure of blue micro-LED chip [5]; (c) 3-dimensional view; and (d) illumination distribution on the receiving plane for the red/green/blue pixel.
After the optical model of a Micro-LED with QDs matrix has been established, the optical performance for different mass ratios and thicknesses of a red QDs-PMMA matrix is simulated by the Monte Carlo ray tracing method [18,19]. The illumination distribution on the receiving plane for red/green/blue pixels can be obtained, as shown in Figure 5d. For all cases, when the thickness of the QDs-PMMA matrix is changed, the mass ratio stays the same, and vice versa. Light efficiency as the critical evaluation criteria is introduced first. In the simulation, light efficiency is the ratio of the light power on the receiving plane to the light power from the chip. In order to further discover the mechanism of how the thickness and mass ratio of a QDs-PMMA matrix affect the light efficiency of a micro-LED, the RGB light absorbed by QDs film is also calculated. The light power ratio is defined as the ratio of the light power absorbed by the QDs film to the light power from the chip, which is used to evaluate the absorbed light distribution.
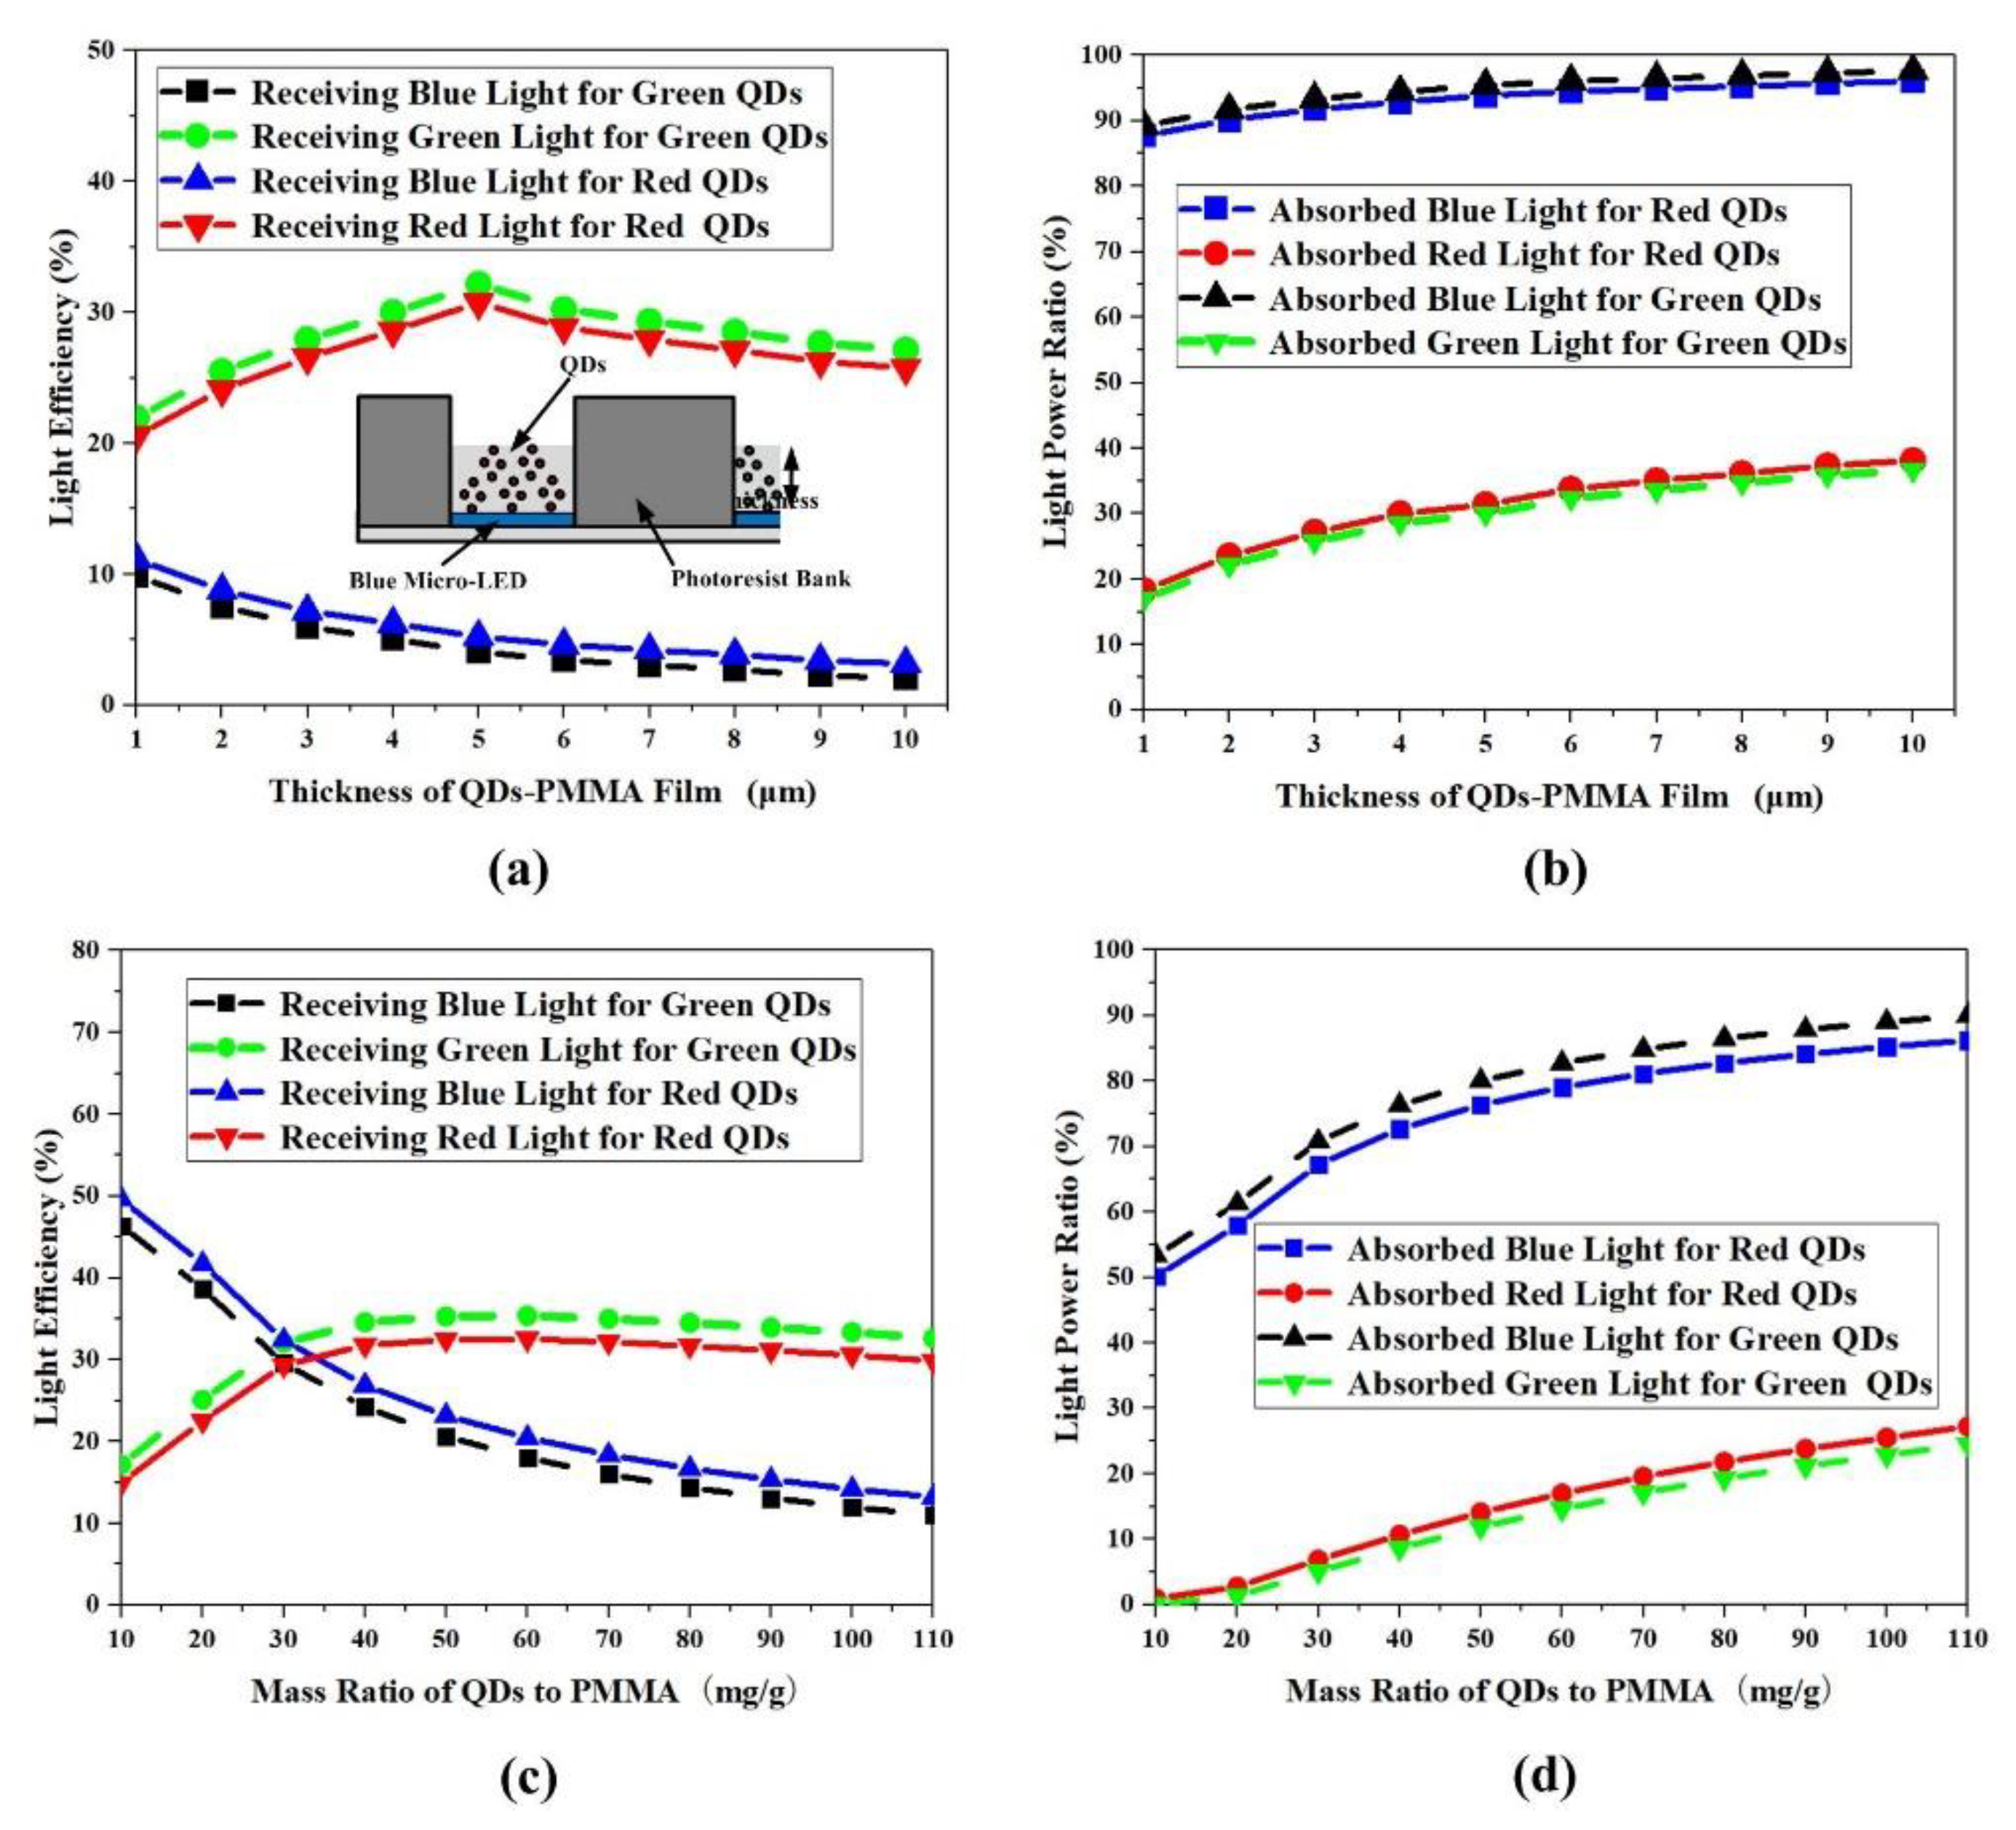
Figure 6 illustrates the light efficiency and light power ratio distribution for different thicknesses and mass ratios of a red/green QDs-PMMA matrix. The range of the thickness of QDs-PMMA matrix is from 1 μm to 10 μm, while the range of the mass ratio of QDs to PMMA is from 10 mg/g to 110 mg/g. Figure 6a reveals that the light efficiency of received blue light is less than 10%, which proves that DBR plays an important role in reflecting blue light. As the thickness of the QDs-PMMA matrix increases, the received blue light is reduced, but the variation trend of the received red/green light is not linear; the received red/green light firstly increases and then decreases. The reason for this phenomenon is that the absorption of QDs for blue light increases alongside the thickness, so the excited red/green also increases. However, when the thickness grows over a certain value (>5 μm), the trend of light conversion from blue light to red/green light will become gradually saturated. Meanwhile, as the thickness of the QDs-PMMA matrix increases, the scattering effect will be more obvious, and the emergence angle distribution of excited red/green light will become more uniform. The increasing thickness will result in the lights obliquely incoming on the DBR increasing, while the DBR only has the feature of high transmittance for collimating light. So, when the lights obliquely incoming on the DBR increase, the transmittance of DBR for red/green light will reduce, and the red/green lights on the receiving plane will descend. Compared with the light efficiency distribution of red and green QDs, more green lights are received, due to green QDs’ stronger absorption for blue light. Besides, the anisotropic coefficients g of red QDs are smaller than those of green QDs. When g = 1, the converted lights transmit forward after lights go through scattering particles, and when g = 0, the converted lights are scattered uniformly. Therefore, a smaller anisotropic coefficient represents a stronger light scattering effect, resulting in a stronger scattering effect and the lower efficiency of red QDs compared with green QDs. Simulation results verify the above explanation in Figure 6b.
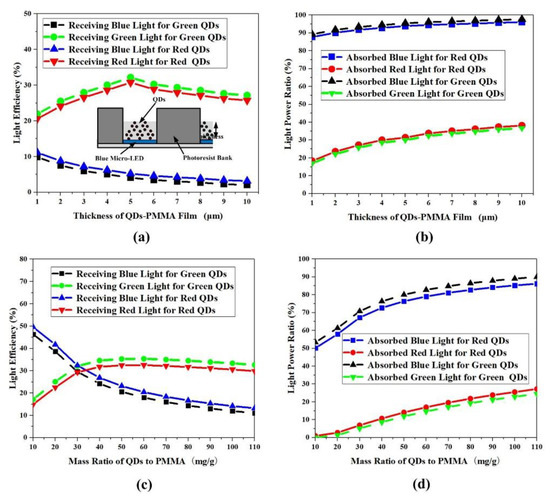
Figure 6.
(a) Light efficiency distribution with different thickness; (b) light power ratio distribution with different thicknesses; (c) light efficiency distribution with different MR; and (d) light power ratio distribution for with different MR.
Moreover, the results show that the mass ratio of QDs to PMMA has a similar influence on the light efficiency distribution in Figure 6c,d. When the mass ratio increases to a certain value (60 mg/g), the light efficiency of micro-LEDs is at the peak of distribution. However, with the increase of the mass ratio of QDs to PMMA, the variation of light efficiency distribution is larger than that of the thickness; this indicates that the mass ratio could change the color distribution more effectively. The reason for this can mainly be attributed to mass ratio variation with greater effects on the scattering and absorption of QDs. Although the thickness of the QDs-PMMA matrix could also greatly affect the light efficiency distribution, the mass ratio could influence the fundamental characteristics of QDs more significantly. When the thickness and mass ratio are changed, the total effects of the absorption and scattering are also changed at the same time. Greater thickness or a higher mass ratio could absorb and scatter more light rays, but this does not necessarily lead to greater light efficiency for micro-LEDs. Based on the above analysis, the optimized thickness and mass ratio are 5 μm and 60 mg/g, with the highest light efficiency.
The color crosstalk is another critical evaluation index for micro-LED displays. In the next section, the effect of the thickness and mass ratio of a QDs-PMMA matrix on the color crosstalk will be discussed. To evaluate the color crosstalk quantitatively, two receivers with different detection areas are placed above our model. The first receiver is only covered for one subpixel area, and the detected light power is Ppixel. The second receiver is able to receive light from the whole panel, and the collected light intensity is Ptotal. The color crosstalk ratio is defined as Rcrosstalk, which can be calculated using the following Equation (7) [20,21].
where Pleakage represents the light leakage from the adjacent pixels when only one subpixel is turned on.
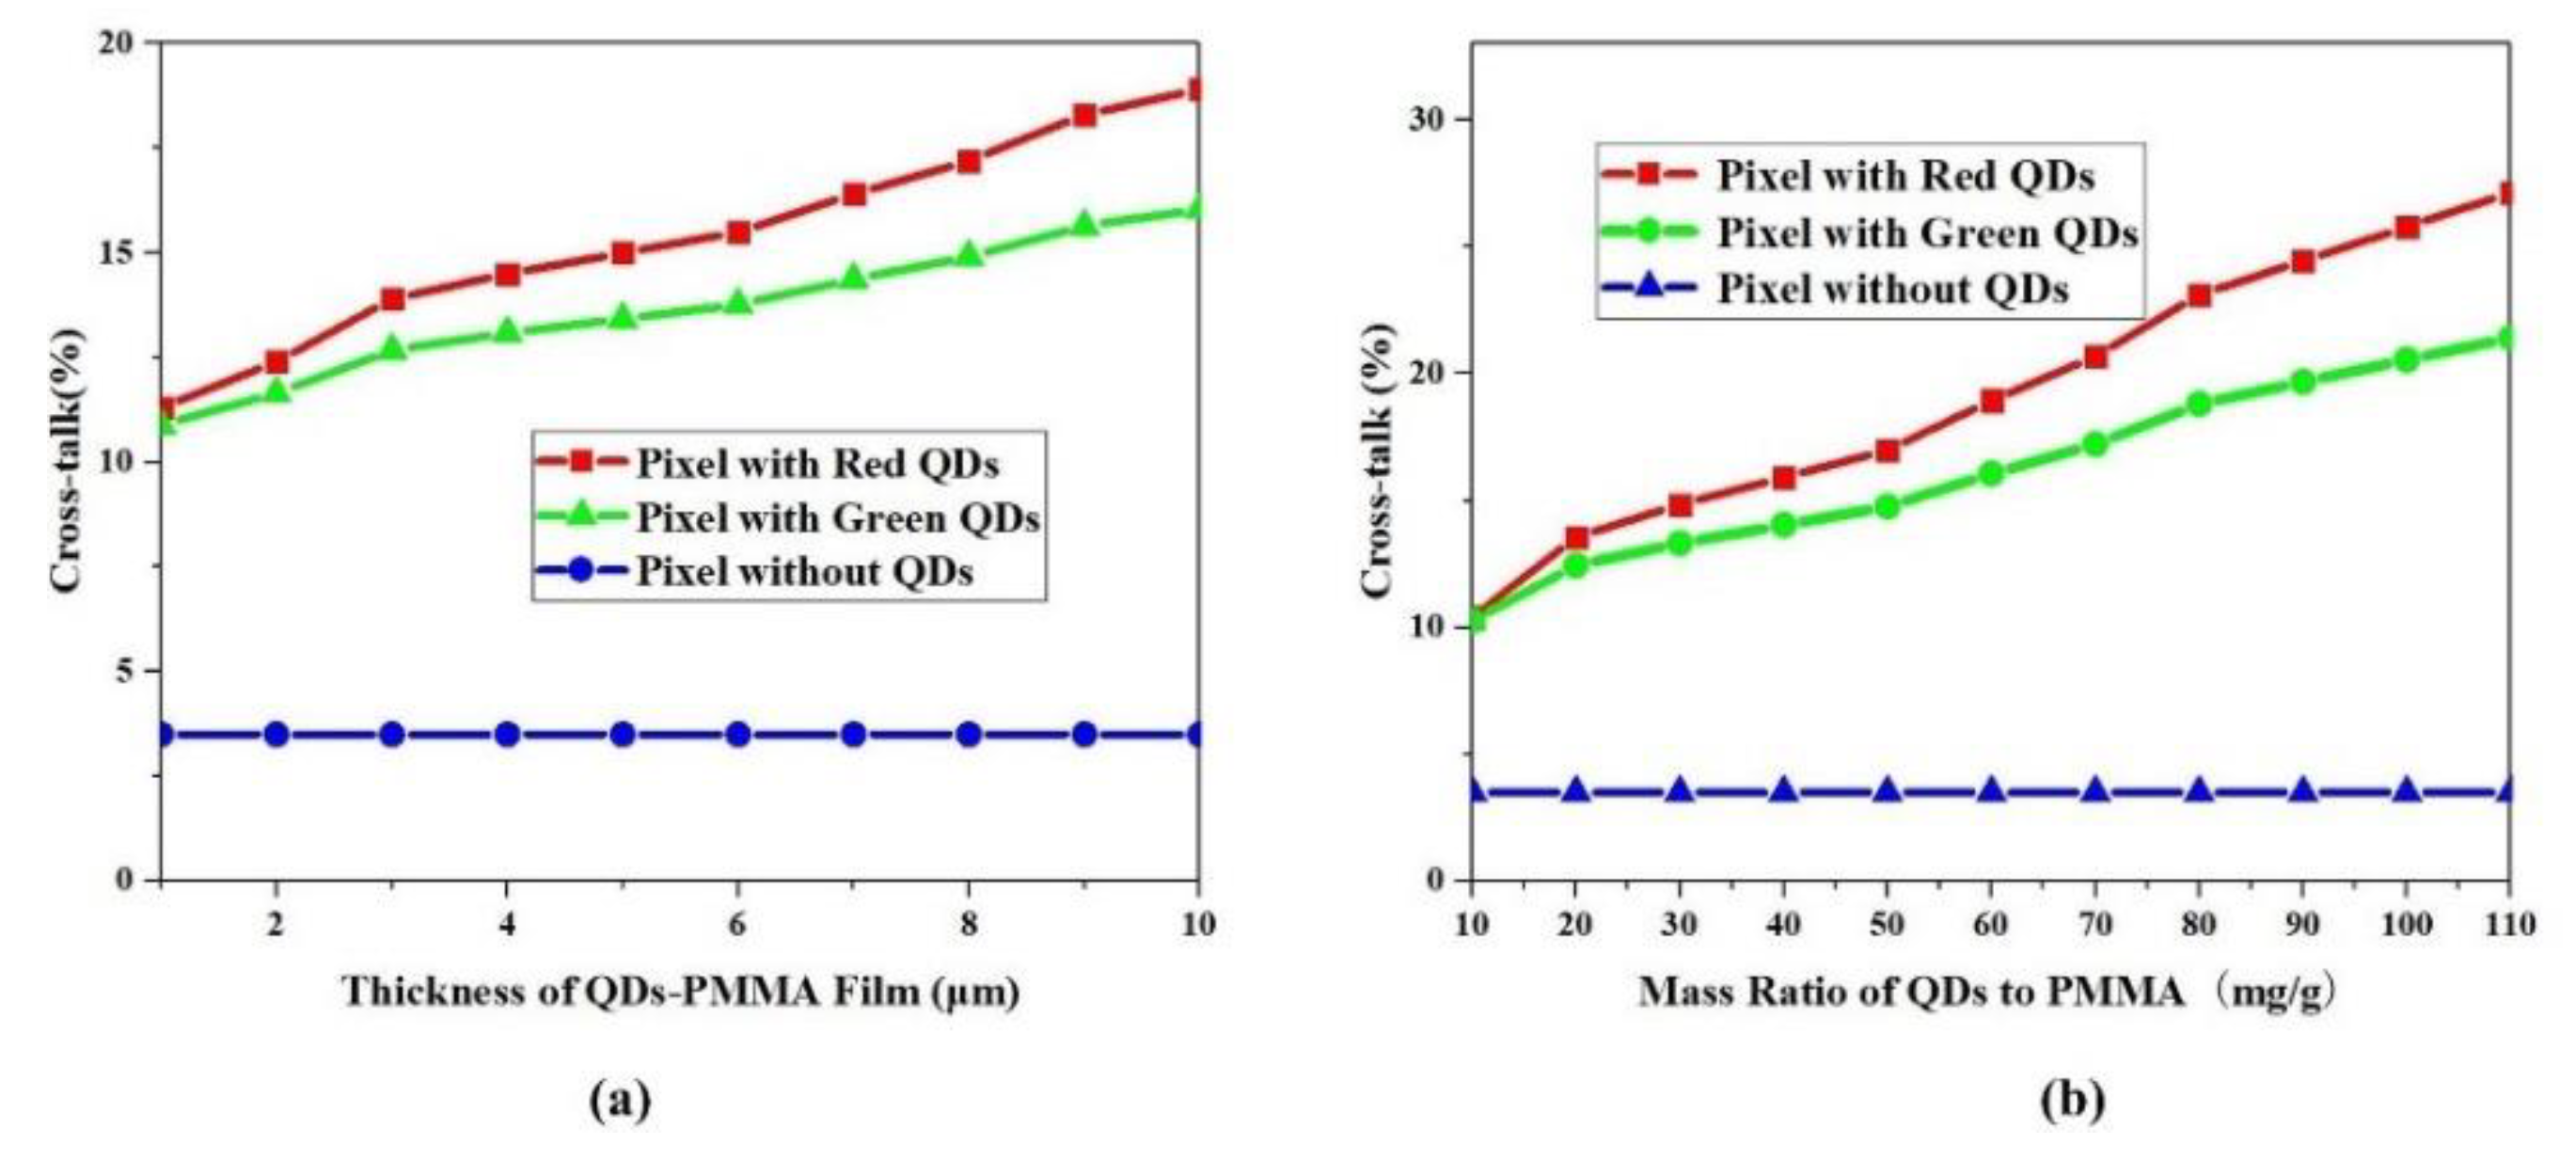
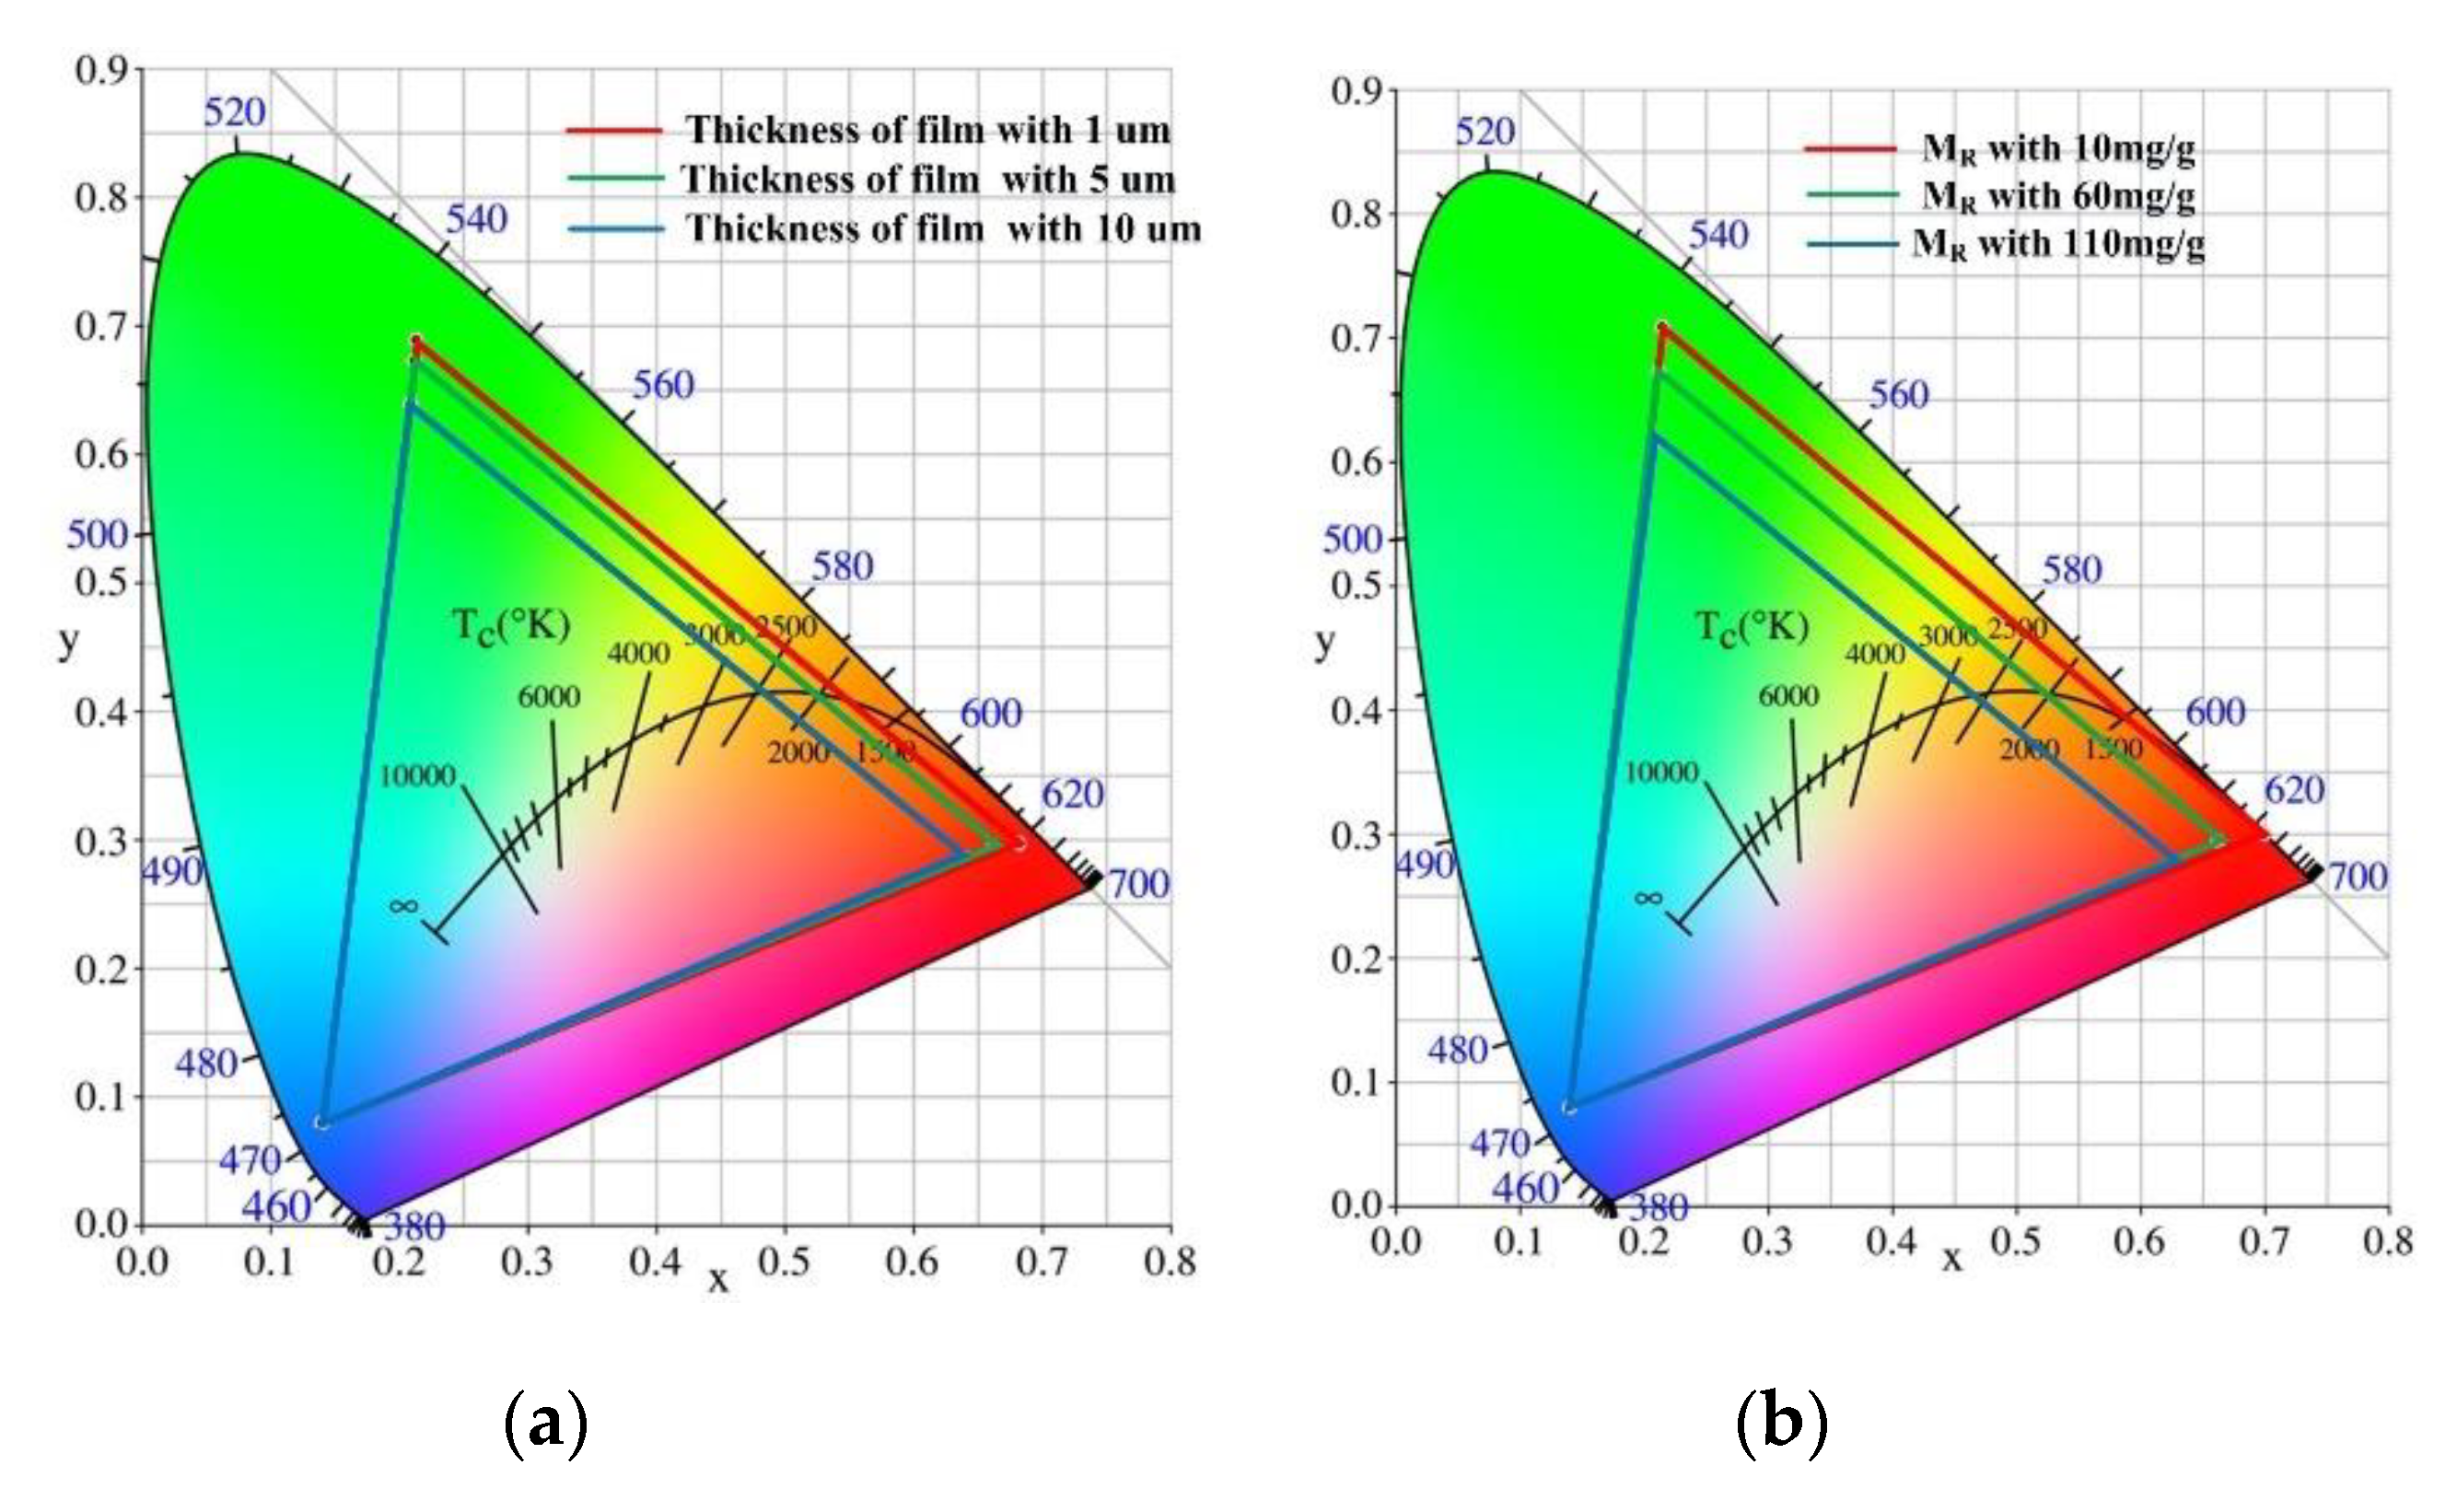
Figure 7 plots the simulated color crosstalk ratio as a function of the QDs-PMMA matrix’s thickness and mass ratio. The blue subpixel without QDs film has low color crosstalk, due to the restriction effect of the photoresist bank. As the thickness or mass ratio increases, the color crosstalk of subpixels with a red/green QDs matrix increased. With the increase of a QDs-PMMA matrix’s thickness or mass ratio, the optical path inside the QDs becomes longer, leading to a more severe light scattering. With light scattering enhancing, more emergent light with a large angle will be generated, so that more light will irradiate outside the first receiver. Compared with the crosstalk ratio distribution of red and green QDs, the crosstalk ratio of red QDs is higher, due to red QDs with a lower anisotropic coefficient and stronger scattering effect. Differently from the light efficiency distribution with a peak, the crosstalk ratio increases as the thickness/mass ratio increases. The reason for this is that the received lights outside the first receiver keep increasing, but the total light power of the whole receiving plane will reduce when the thickness/mass ratio increases to a certain value. In addition, the Commission Internationale de l’Eclairage’s (CIE) color coordinate chart for different thicknesses and mass ratios of a QDs-PMMA matrix is calculated based on the simulation results, as shown in Figure 8. Display systems with a lower thickness and mass ratio of the QDs-PMMA matrix have a wider color gamut; the reason for this is that display systems with a lower thickness/mass ratio of the QDs-PMMA matrix have a lower color crosstalk. The color crosstalk is reduced, so the color purity of each sub-pixel is improved, insofar that the color gamut is also enhanced.
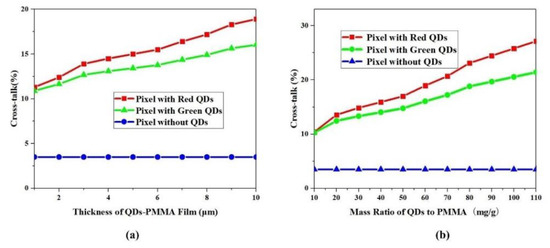
Figure 7.
Simulated color crosstalk ratio as a function of a QDs film’s (a) thickness; and (b) the mass ratio of QDs to PMMA.
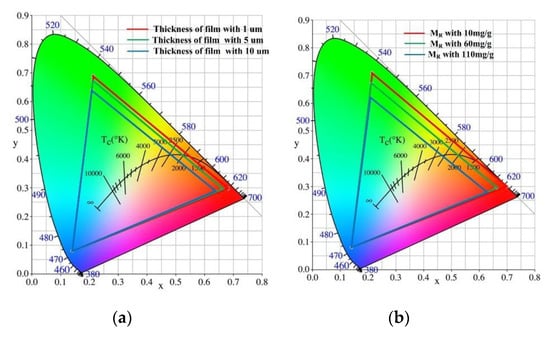
Figure 8.
The CIE 1931 color coordinates chart for (a) different thickness of QDs-PMMA matrix; and (b) the different mass ratio of QDs to PMMA.
Finally, the visual perception of the human eye is also a critical evaluation index when a micro-LED display is applied in bright ambient light. If the ambient light is too strong, the display plane is hardly readable. To evaluate visual perception, the ambient contrast ratio (ACR) is calculated using the following Equation (8) [22,23]:
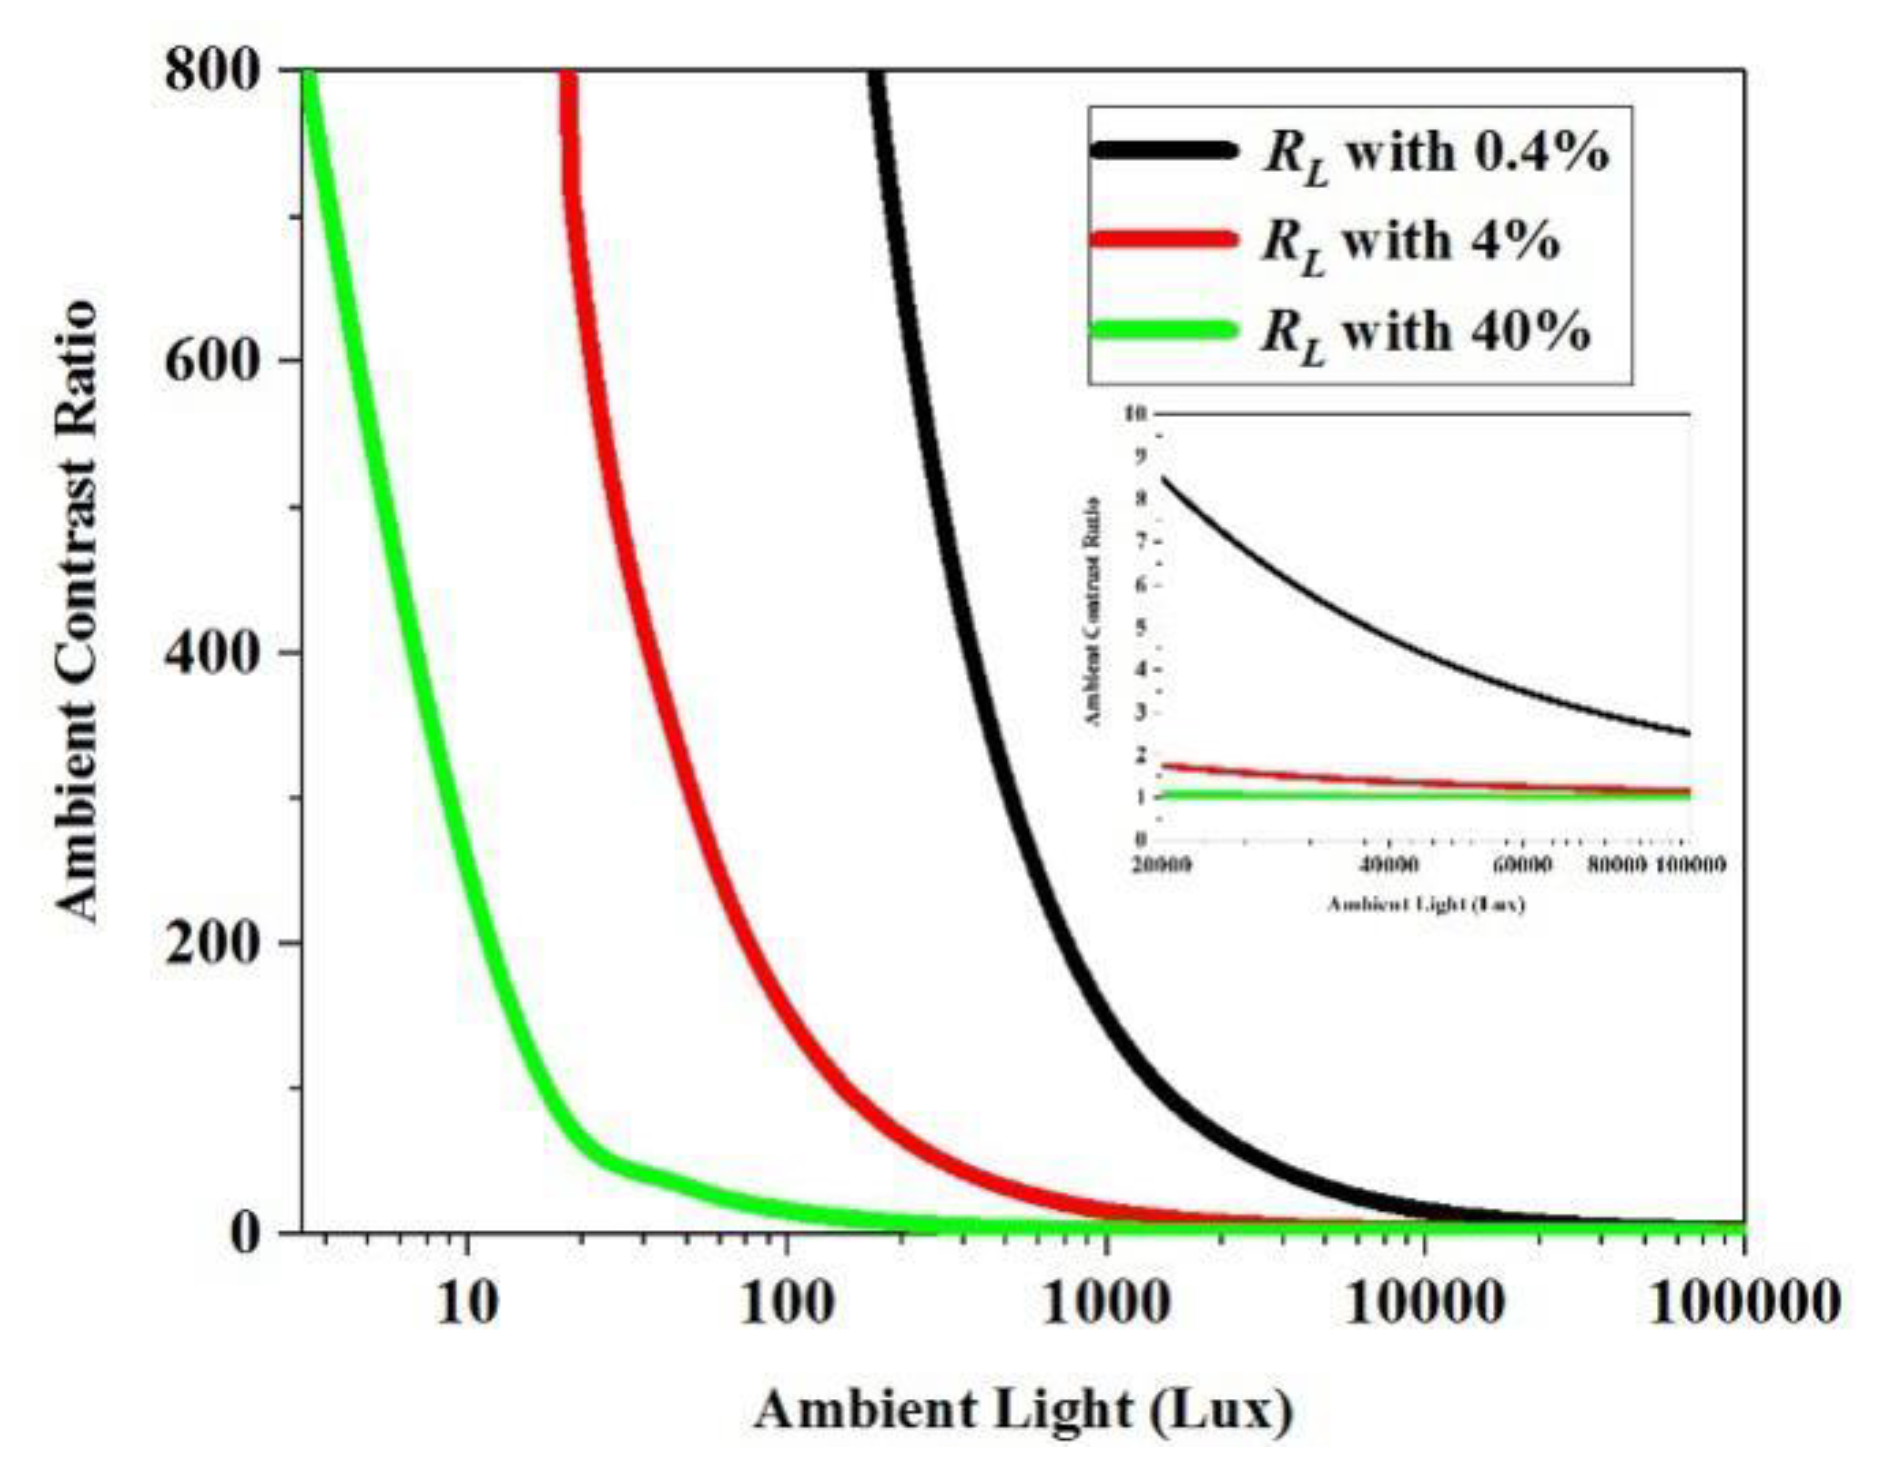
In Equation (2), Lon (Loff) represents the on-state (off-state) luminance value of a display, while Lambient is the ambient luminance and RL is the reflectivity of the display panel. In most cases, the ambient light is perpendicular to the display plane, so we specified the incident angle of ambient light as 90 degrees. Lon is set as constant, Loff is 0, and the surface reflectivity is calculated based on the established model. As the ambient light gets stronger, the ACR first decreases dramatically, and then gradually saturates. The calculated ACR for different Lambient and RL are plotted in Figure 9. The results demonstrate that RL can obviously affect the ACR of the display, and too-strong ambient light (light flux > 20,000 lux) leads to a too-low ACR (<10), as shown in the inset of Figure 9. By analyzing Equation (2), ACR and RL have an inverse relationship when the Lambient and Lon are constant. If the distribution of RL can be calculated, the distribution of ACR can also be obtained.
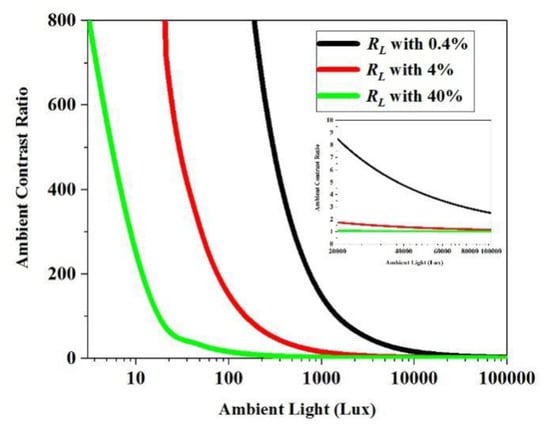
Figure 9.
Simulated ambient contrast ratio with different ambient light and reflectivity.
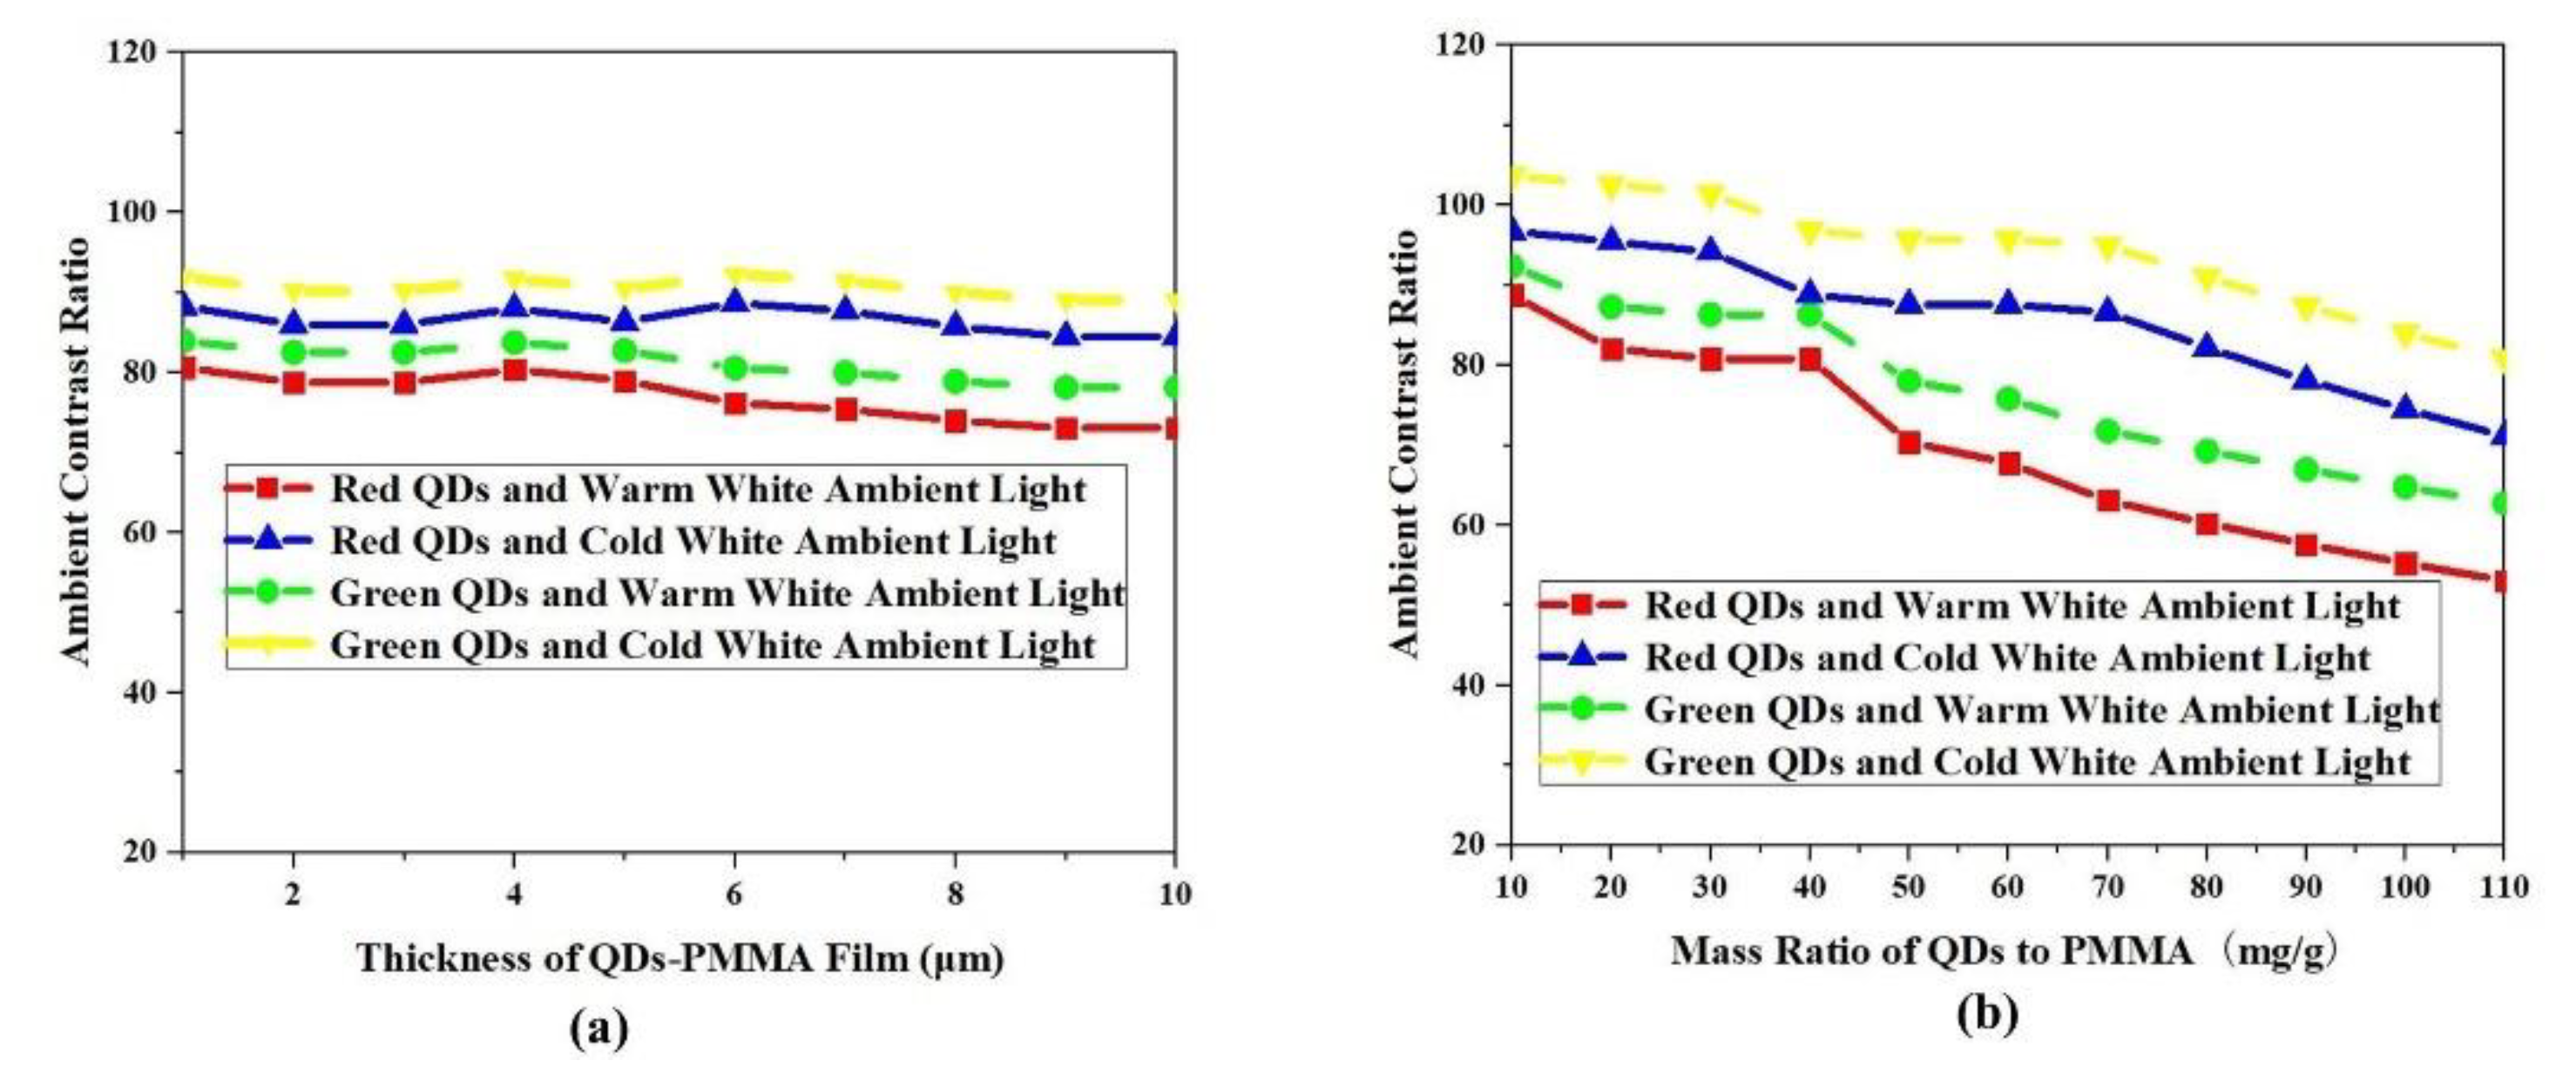
The calculation process of RL is as follows. The measuring light source is set to place above the DBR, and the micro-LED chip is off-state. Other parameters remain unchanged, and the simulation is run. RL is the ratio of the light power on the receiving plane to the light power emitting from the ambient light source. The Lambient and Lon are assumed to be 3000 Lux and 600 Lux, respectively. The result that the thickness and mass ratio of QDs-PMMA matrix affect the ACR is illustrated in Figure 10. Moreover, the effect of different ambient light in terms of warm white light and cold white light is also introduced in the simulation. As the mass ratio increases, ACR decreases; the reason for this is that the enhancement of the mass ratio will improve the scattering effect. More lights are reflected to the receiving plane, in terms that the reflectivity RL increases and ACR decreases. Because red QDs have a stronger scattering efficiency compared with green QDs, the RL of red QDs is higher. In addition, QDs material has high absorption for blue light. More lights are absorbed for cold white ambient light, so lights reflected in the receiving plane decrease. With the effect of QDs film, a micro-LED plane has a lower RL under cold white ambient light. The straightforward method to enhance ACR is to improve the absorption of the micro-LED display plane, but the trade-off is that light efficiency will decrease. Besides, when the thickness of a QDs-PMMA matrix increases, RL and ACR almost remain unchanged. As the mass ratio is kept constant, the scattering effect of film surface is the same for different thicknesses.
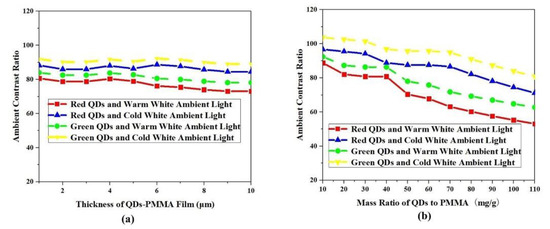
Figure 10.
Simulated ACR for (a) different mass ratio of QDs to PMMA and ambient light; and (b) different thicknesses of QDs-PMMA matrix and ambient light.
3. Conclusions
In this paper, the precise optical model of QDs is established to obtain the optical properties of QDs. The effect of the thickness and mass ratio of a QDs-PMMA film on the optical performances of micro-LEDs is analyzed. Results reveal that the mass ratio of QDs film is the more critical factor affecting the light efficiency of micro-LEDs than thickness, and a too-large mass ratio/thickness of a QDs-PMMA film does not improve light efficiency. Green QDs have a higher light efficiency distribution, due to QDs’ stronger absorption for blue light and lower scattering for converted light, compared with red QDs. The variation of color crosstalk between adjacent pixels is mainly affected by the optical scattering of QDs. A higher thickness/mass ratio will result in more significant color crosstalk. Lower scattering and higher absorption will be a benefit to improve the ambient contrast ratio, but the light efficiency will decrease. Based on the above analysis, the influence of the thickness and mass ratio of a QDs-PMMA film on the optical performance of micro-LEDs is complicated and interactional. Studying of the influencing mechanism of QDs will be significant for guiding the fabrication process.
Author Contributions
Investigation, F.F. and D.W.; Methodology, S.L.; Software, K.Y.; Writing – original draft, Z.Z.; Writing – review & editing, X.W. and K.W. All authors have read and agreed to the published version of the manuscript.
Funding
This research was funded by GDHVPS (2016) and the Basic Research Plan Program of Shenzhen City in 2016 (No. JCYJ20160509100737182 and JCYJ20160301113537474), Innovation and Strong School (2017GKCXTD007), National Key Research and Development Program (No. 2017YFE0120400), Shenzhen Key Laboratory for Advanced Quantum Dot Displays and Lighting (No. ZDSYS201707281632549) and Natural Science Foundation of Guangdong (No. 2017B030306010).
Conflicts of Interest
The authors declare no conflict of interest. The funders had no role in the design of the study; in the collection, analyses, or interpretation of data; in the writing of the manuscript, or in the decision to publish the results.
References
- Liu, S.; Luo, X.B. LED Packaging for Lighting Applications: Design, Manufacturing and Testing; John Wiley and Sons: Hoboken, NJ, USA, 2011. [Google Scholar]
- Schubert, E.F. Light-Emitting Diodes; Cambridge University Press: Cambridge, UK, 2006. [Google Scholar]
- Wang, K.; Liu, S.; Luo, X.B.; Wu, D. Freeform Optics for LED Packages and Applications; John Wiley and Sons: Hoboken, NJ, USA, 2016. [Google Scholar]
- Liu, Z.J.; Chong, W.C.; Wong, K.M.; Lau, K.M. GaN-based LED micro-displays for wearable applications. Microelectron. Eng. 2015, 148, 98–103. [Google Scholar] [CrossRef]
- Demory, B.; Chung, K.; Katcher, A.; Sui, J.Y.; Deng, H.; Ku, P.C. Integrated parabolic nanolenses on MicroLED color pixels. Nanotechnology 2018, 29, 165201. [Google Scholar] [CrossRef] [PubMed]
- Zhu, L.; Lai, P.T.; Choi, H.W. An ultraviolet micro-LED array and its application for microlens fabrication. Phys. Status Solidi (c) 2010, 7, 2174–2176. [Google Scholar] [CrossRef]
- Liu, Z.; Wong, K.; Chong, W.; Lau, K. P-34: Active matrix programmable monolithic light emitting diodes on silicon (LEDoS) displays. SID Symp. Dig. Tech. Pap. 2011, 42, 1215–1218. [Google Scholar] [CrossRef]
- Xie, B.; Hu, R.; Luo, X.B. Quantum dots-converted light-emitting diodes packaging for lighting and display: Status and perspectives. J. Electron. Packag. 2016, 138, 020803. [Google Scholar] [CrossRef]
- Lin, C.-C.; Sher, C.-W.; Chen, C.-H.; Hsieh, D.-H.; Kuo, H.-C.; Chen, H.-M.; Lin, H.-Y.; Lau, K.-M.; Chen, T.-M.; Chen, X.-Y. Optical crosstalk reduction in a quantum-dot-based full-color micro-light-emitting-diode display by a lithographic-fabricated photoresist mold. Photonics Res. 2017, 5, 411–416. [Google Scholar] [CrossRef]
- Han, H.V.; Lin, H.Y.; Lin, C.C.; Chong, W.C.; Li, J.R.; Chen, K.J.; Yu, P.C.; Chen, T.M.; Chen, H.M.; Lau, K.M.; et al. Resonant-enhanced full-color emission of quantum-dot-based micro LED display technology. Opt. Express 2015, 23, 32504–32515. [Google Scholar] [CrossRef] [PubMed]
- Chen, G.-S.; Wei, B.-Y.; Lee, C.-T.; Lee, H.-Y. Monolithic red/green/blue micro-LEDs with HBR and DBR structures. IEEE Photonics Technol. Lett. 2017, 30, 262–265. [Google Scholar] [CrossRef]
- Xie, B.; Cheng, Y.H.; Hao, J.J.; Shu, W.C.; Wang, K.; Luo, X.B. Precise optical modeling of quantum dots for white light-emitting diodes. Sci. Rep. 2017, 7, 16663. [Google Scholar] [CrossRef] [PubMed]
- Liu, Z.Y.; Wang, K.; Luo, X.B.; Liu, S. Precise optical modeling of blue light-emitting diodes by Monte Carlo ray-tracing. Opt. Express 2010, 18, 9398–9412. [Google Scholar] [CrossRef] [PubMed]
- Liu, Z.Y.; Liu, S.; Wang, K.; Luo, X.B. Measurement and numerical studies of optical properties of YAG:Ce phosphor for white light-emitting diode packaging. Appl. Opt. 2010, 49, 247–257. [Google Scholar] [CrossRef] [PubMed]
- Huang, Q.Q.; Chen, J.; Zhao, J.; Pan, J.Y.; Lei, W.; Zhang, Z.C. Enhanced photoluminescence property for quantum dot-gold nanoparticle hybrid. Nanoscale Res. Lett. 2015, 10, 400. [Google Scholar] [CrossRef] [PubMed][Green Version]
- Lee, H.; Yang, H.; Holloway, P.H. Single-step growth of colloidal ternary ZnCdSe nanocrystals. J. Lumin. 2007, 126, 314–318. [Google Scholar] [CrossRef]
- Huang, Q.Q.; Pan, J.Y.; Zhang, Y.N.; Chen, J.; Tao, Z.; He, C.; Zhou, K.F.; Tu, Y.; Lei, W. High-performance quantum dot light-emitting diodes with hybrid hole transport layer via doping engineering. Opt. Express 2016, 24, 25955–25963. [Google Scholar] [CrossRef] [PubMed]
- Li, S.M.; Chen, F.; Wang, K.; Zhao, S.; Zhao, Z.L.; Liu, S. Design of a compact modified total internal reflection lens for high angular color uniformity. Appl. Opt. 2012, 51, 8557–8562. [Google Scholar] [CrossRef] [PubMed]
- Wang, K.; Liu, S.; Chen, F.; Qin, Z.; Liu, Z.Y.; Luo, X.B. Freeform LED lens for rectangularly prescribed illumination. J. Opt. A Pure Appl. Opt. 2009, 11, 105501. [Google Scholar] [CrossRef]
- Gou, F.W.; Hsiang, E.L.; Tan, G.J.; Lan, Y.F.; Tsai, C.Y.; Wu, S.T. Tripling the optical efficiency of color-converted micro-LED displays with funnel-tube array. Crystals 2019, 9, 39. [Google Scholar] [CrossRef]
- Woods, A.J. Crosstalk in stereoscopic displays: A review. J. Electron. Imaging 2012, 21, 040902. [Google Scholar] [CrossRef]
- Singh, R.; Unni, K.N.N.; Solanki, A.; Deepak. Improving the contrast ratio of OLED displays: An analysis of various techniques. Opt. Mater. 2012, 34, 716–723. [Google Scholar] [CrossRef]
- Dobrowolski, J.A.; Sullivan, B.T.; Bajcar, R.C. Optical interference, contrast-enhanced electroluminescent device. Appl. Opt. 1992, 31, 5988–5996. [Google Scholar] [CrossRef] [PubMed]
© 2020 by the authors. Licensee MDPI, Basel, Switzerland. This article is an open access article distributed under the terms and conditions of the Creative Commons Attribution (CC BY) license (http://creativecommons.org/licenses/by/4.0/).

