Abstract
In this work, we aimed to solve the problems that exist in the brittleness evaluation method of high-strength concrete through a triaxial compression test of C60 and C70 high-strength concrete. Then, the relationship between the energy evolution of its elastic energy, dissipative energy, pre-peak total energy and additional energy and its axial strain, confining pressure, and concrete strength grade was analyzed. Taking the accumulation rate of pre-peak elastic strain energy and the dissipation rate of dissipative energy, and the release rate of post-peak elastic energy, as the evaluation indicators to characterize the brittleness of high-strength concrete. A brittleness evaluation method that reflects the whole failure process of high-strength concrete is proposed and verified by experiments. The results show that with the increase of the confining pressure, the proportion of elastic energy in the whole process of high-strength concrete failure gradually decreases. The storage rate of pre-peak elastic energy and the release rate of post-peak elastic energy are gradually reducing, the brittleness index gradually decreases, and the confining pressure inhibits the brittleness of high-strength concrete. Under the same confining pressure, the brittleness index of C70 concrete is greater than that of C60 concrete, which indicates that, with the increase of the strength grade, the brittleness level of concrete gradually increases and the ductility decreases. These findings have a certain theoretical significance for the scientific design of high-strength concrete structures and the improvement of their safety in the future.
1. Introduction
In recent years, high-strength concrete has been widely used in civil engineering, transportation, water conservancy, and municipal engineering. Concrete is a quasi-brittle material, and its failure mode is not only affected by the strength level of concrete, but is also closely related to its stress state [1,2,3,4,5]. Studies have shown that, compared with ordinary concrete, high-strength concrete presents obvious brittle characteristics [6,7,8].
To date, domestic and foreign scholars have carried out a great deal of research on the characterization methods of concrete brittleness. Jenq and Shah [9] proposed a critical material constant that was positively related to the brittleness index based on the fracture toughness and elastic modulus, showing that the larger the value of , the greater the brittleness of the material. Tasdemir et al. [10] used the energy method to evaluate the brittleness of concrete and proposed the ratio of the recoverable elastic deformation energy to unrecoverable plastic deformation energy as the brittleness evaluation index of concrete. Zhang et al. [11] proposed to use the ratio of the pre-peak recoverable elastic energy to the total energy as the brittleness evaluation index of concrete. Yan et al. [12] used mechanical parameters and area methods to evaluate the brittleness of concrete and proposed that the ratio of the fracture energy to nominal stress should be taken as the brittleness index ; furthermore, they established the brittleness evaluation index based on the roughness of the fracture surface [13]. Their results showed that these two brittleness indicators were linearly correlated, and it was considered that the greater the roughness of the fracture surface, the greater the unrecoverable deformation energy consumed by fracture failure and the lower the brittleness of concrete. Yao et al. [14] used the strength method to evaluate the brittleness of concrete and proposed that the tension–compression ratio of concrete specimens should be taken as their brittleness index ; furthermore, they considered that the smaller the tension–compression ratio, the greater the brittleness of concrete. Guo and Huang et al. [15,16,17] considered the size effect of strength and established a brittleness index that was proportional to the size of the plastic zone; furthermore, they considered that the smaller the value of , the greater the brittleness of the material. Han et al. [18] proposed the evaluation of the brittleness of concrete by a morphology method based on the analysis of the insufficient brittleness of the concrete cross-sectional area ratio and established a new brittleness evaluation method of concrete based on the area fraction of section stones. In summary, most of the existing concrete brittleness evaluation indicators are suitable for low-strength concrete, and there are few studies on the brittleness evaluation of high-strength concrete. The physical meaning of some concrete brittleness evaluation indicators is not clear, and the evaluation indicators cannot be obtained through conventional mechanical tests of concrete; thus, their practical application and promotion have certain limitations. Some concrete brittleness evaluation indicators only consider the pre-peak or post-peak stage and cannot fully reflect the brittleness characteristics of the entire failure process of concrete.
Based on the experimental results of C60 and C70 high-strength concrete under different confining pressures, the evolution of elastic strain energy, dissipative energy, and input energy with axial strain during the deformation process is analyzed in this paper. Combined with these three kinds of energy, a brittleness evaluation index which can comprehensively reflect the whole deformation and failure process of high-strength concrete is established. Furthermore, a brittleness evaluation method for high-strength concrete is proposed. This has a certain theoretical significance for the scientific design of high-strength concrete structures and the improvement of their safety in the future.
2. Triaxial Compression Test of C60 and C70 High-Strength Concrete
2.1. Experimental Process
According to the “Specification for Concrete Mix Design” (JGJ55-2011) [19], high-strength concrete with strength grades of C60 and C70 was prepared. Cement used was ordinary Portland cement P II52.5 R, and the coarse aggregate used was basalt gravel. The size of the crushed stone was 5–20 mm and the bulk density was 1455 kg/m3. The fine aggregate adopts medium-coarse sand with a fineness modulus of 2.73 and a mud content of 1.45%. The admixture was an NF–F compound high-efficiency admixture, and the proportions of slag and silica fume in C60 and C70 were the same, 73% and 20%, respectively. The mix proportion of C60 and C70 high-strength concrete was determined by an orthogonal experimental design (see Table 1).

Table 1.
Mixture proportions of C60 and C70 high-strength concrete.
The conventional triaxial loading equipment for high-strength concrete specimens was the ZTCR-2000 low-temperature rock triaxial system (Figure 1). During the test, the concrete specimens were first preloaded to 0.5 MPa, and then confining pressure was applied to the predetermined value at the loading speed of 50 N/s according to the “load” control mode. The test confining pressure was set at 0, 5, 10, 15, and 20 MPa. After the confining pressure reached the predetermined value, the pressure was stabilized for 30 s, and finally, the axial pressure was applied at the loading speed of 0.05 mm/min according to the “displacement” control mode until the concrete specimens was destroyed.
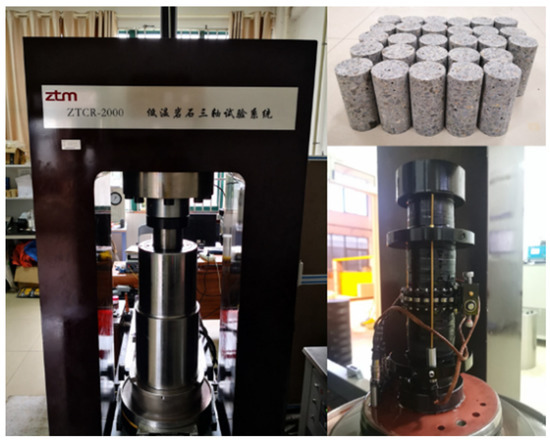
Figure 1.
Rock mechanics test system.
2.2. Analysis of Test Results
Figure 2 shows the stress–strain curves of C60 and C70 high-strength concrete specimens under different confining pressures. It can be seen from Figure 2 that, when the confining pressure is 0 MPa, there is no obvious yield point in the pre-peak curve of high-strength concrete; after reaching the peak strength, the stress drops rapidly, and the post-peak curve is steep, indicating that the brittleness of the concrete is relatively strong at this time and close to an ideal brittle material. With the increase of confining pressure, obvious yield steps appear in the pre-peak curve, and the post-peak curve and the stress drop trends gradually tend to be gentle. The post-peak phase gradually transforms from the strain softening state to the ideal plastic state, and its brittleness level gradually reduces, showing that, with the increase of confining pressure, the brittleness of high-strength concrete develops from high to low. This shows that there are obvious differences in the brittleness characteristics of concrete under different confining pressures.
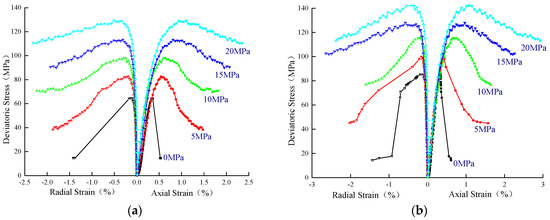
Figure 2.
Full stress–strain curves of high-strength concrete under different confining pressures. (a) C60; (b) C70.
According to the full stress–strain curve of high-strength concrete, the basic mechanical parameters of C60 and C70 high-strength concrete are shown in Table 2.
Table 2.
Mechanical parameters of C60 and C70 high-strength concrete.
Figure 3 shows the variation of the concrete peak strain with confining pressure. It can be seen from Figure 3 that with the increase of confining pressure, the corresponding strain when the concrete stress reaches the peak strength gradually increases, indicating that it is more difficult for the concrete to enter the brittle failure state, and more energy is needed from the outside to assist the cracks inside the concrete to connect and penetrate to form a macroscopic fracture surface. Therefore, the peak strain reflects the difficulty of achieving brittle failure for high-strength concrete. The greater the peak strain, the higher the threshold of concrete brittleness, which indicates that the confining pressure can limit the brittleness of concrete.
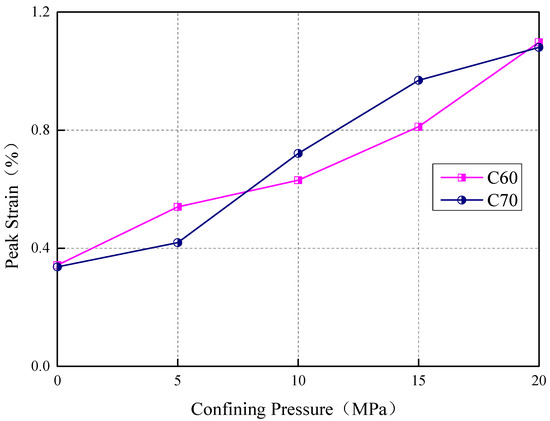
Figure 3.
Variation of peak strain with confining pressure.
3. Energy Evolution Law of High-Strength Concrete during Compression
3.1. Theoretical Analysis
Assuming that there is no heat exchange between the concrete system and the external environment, according to the first law of thermodynamics, the energy input to the system by the external force during the concrete deformation and failure process is equal to the elastic strain energy plus the energy dissipated by the concrete specimen during the test [20,21,22]. The energy input by the external force to the system mainly includes the work done by the axial force when the concrete specimen undergoes axial deformation and the work done by the confining pressure when radial deformation occurs. The dissipative energy is mainly used for the development of internal damage or plastic deformation in the concrete, including the surface energy consumed during the generation, the expansion and penetration of the cracks, the plastic strain energy of the irreversible plastic deformation of concrete specimens, the heat energy generated by friction and slipping between cracks, and various radiation energies, etc. [23]; the magnitude of the dissipative energy is mainly related to the structural properties of the concrete itself and the stress environment. The above-mentioned energy relationship is shown in Equation (1):
The work done by the axial force and confining pressure during the test is [24]:
where are the axial pressure and confining pressure, respectively; are the axial and radial strain, respectively; are the diameter and height of the concrete specimen, respectively; is the volume of the concrete sample; and is the input energy density.
In the same way, the elastic strain energy and dissipative energy are as follows:
where is the elastic strain energy density and is the dissipative energy density.
According to the elastic theory [24], the elastic strain energy density is:
The three-dimensional constitutive relationship of concrete is:
where is the elastic strain in the direction of the main stress, () is the main stress, ; is the Kronecker tensor and is the unloading modulus of elasticity—for convenience of calculation, the initial elastic modulus can be used instead [24]—and is the Poisson’s ratio.
Equations (4) and (5) can be substituted into Equation (3) to obtain the elastic strain energy :
In the conventional triaxial compression test, where , Equation (6) can be simplified to:
Substituting Equation (7) into Equation (1) and combining this with Equation (2) to obtain the dissipative energy results in the following:
The energy conversion diagram of the concrete failure process is shown in Figure 4. When the load reaches the yield stress , the elastic strain energy accumulated inside the concrete is , showing that the concrete is in the linear elastic stage, without damage and energy dissipation; as the load increases, when the peak strength is reached, the total elastic strain energy accumulated in the pre-peak stage is . One part of the work done by the external testing machine is converted into dissipative energy , which is irreversible energy that is consumed in the plastic yield stage of concrete, and the other part is transformed into stored elastic strain energy, which is reversible. The energy relationship in the pre-peak stage is as follows:
where is the area enclosed by the stress–strain curve and the axial strain axis from the initial loading point to the peak strength, is the area enclosed by the peak point unloading curve and the axial strain axis, and is the area between the loading curve and the unloading curve.
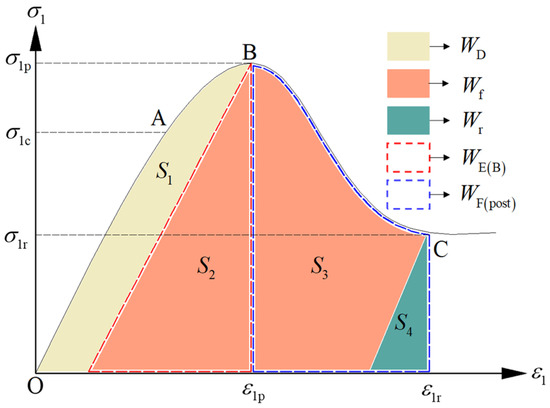
Figure 4.
Schematic diagram of energy conversion during concrete failure.
When the concrete stress reaches the peak strength, the specimen enters the failure state, and its internal storage of elastic strain energy is not sufficient to support its complete failure: therefore, external work is required to provide additional energy . When the concrete stress reaches the residual strength, the internal storage of elastic strain energy and the external additional energy are converted into the energy required for the failure of concrete, and at this time, a part of the elastic strain energy will remain inside the concrete specimen. The energy relationship in the post-peak stage is as follows:
where is the area enclosed by the stress–strain curve between the peak strength and the residual strength and the axial strain axis, is the area enclosed by the unloading curve of the residual strength point and the axial strain axis, and is the area shown by the orange area in the figure.
3.2. Relationship between Energy Evolution and Axial Strain
By substituting the triaxial compression test results into Equations (2), (7), and (8), the evolution curves of the input energy, elastic energy and dissipative energy with the axial strain of high-strength concrete under different confining pressures are obtained, as shown in Figure 5 and Figure 6.
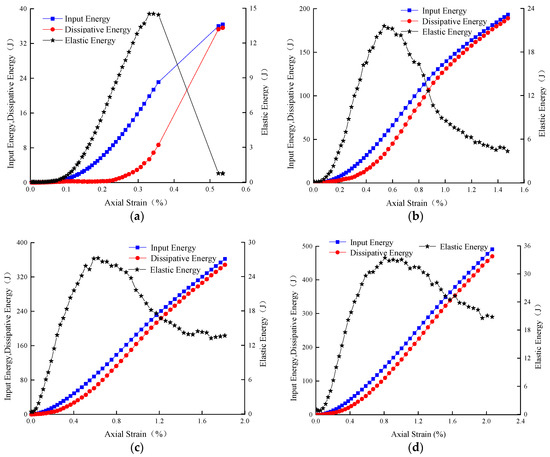
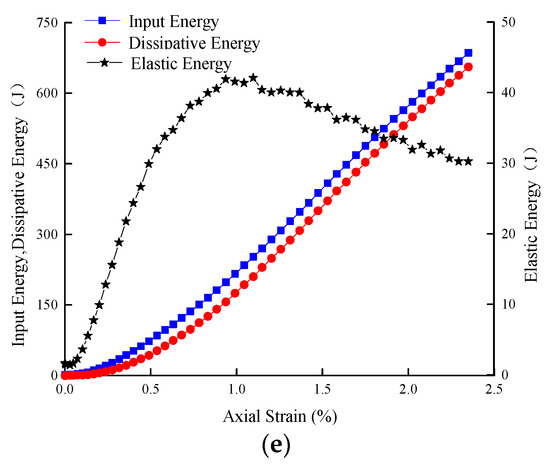
Figure 5.
Energy evolution curves of C60 high-strength concrete under different confining pressures. (a) 0 MPa; (b) 5 MPa; (c) 10 MPa; (d) 15 MPa; (e) 20 MPa.
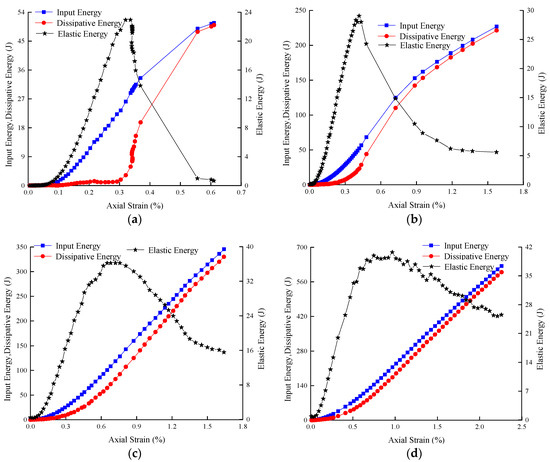
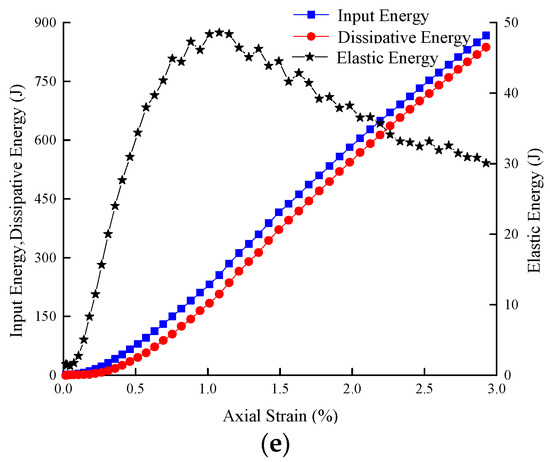
Figure 6.
Energy evolution curves of C70 high-strength concrete under different confining pressures. (a) 0 MPa; (b) 5 MPa; (c) 10 MPa; (d) 15 MPa; (e) 20 MPa.
It can be seen from Figure 5 and Figure 6 that under different confining pressures, both the input energy and the dissipative energy increase with the increase of the axial strain, and the elastic strain energy first increases and then decreases. In the initial stage of loading, the initial pores inside the concrete gradually close under the action of external load, and most of the work done by external load is converted into elastic energy, which is stored inside the specimen. The elastic strain energy gradually increases with the axial strain, the dissipative energy is very low at this stage and the evolution curves of input energy, elastic energy and dissipative energy all show an upward concave trend. As the external load increases, the concrete specimen enters the linear elastic deformation stage, and the external work is basically transformed into elastic strain energy; furthermore, the slopes of the three energy evolution curves reach the maximum value. This stage is the main stage of energy storage in the whole process of concrete failure. When the external load reaches the yield limit of concrete, new cracks will appear inside the specimen, and the initiation and diffusion of cracks need to dissipate part of energy; thus, the slope of the elastic strain energy curve gradually decreases at this stage. When the external load reaches the peak strength, the elastic strain energy reaches the maximum value, and then the concrete specimen is destroyed and the stored elastic strain energy in the pre-peak stage is released rapidly; thus, the post-peak elastic strain energy gradually decreases with the axial strain, and most of the external input energy is dissipated by the cracks intersecting each other to form a macroscopic fracture surface. When the specimen reaches the peak strength, the elastic strain energy and dissipative energy gradually decrease and increase, respectively, until the specimen failure reaches the maximum value and minimum value.
3.3. Relationship between Energy Evolution and Confining Pressure
Based on the triaxial compression test data of high-strength concrete under different confining pressures, the characteristic energy of high-strength concrete is calculated by substituting Equations (9)–(16), and the results are shown in Table 3. It can be seen from Table 3 that when the confining pressure is 0 MPa, the additional energy provided from the outside for the post-peak fracture of C60 and C70 concrete specimens is 14.65 J and 21.83 J, respectively, accounting for 52% and 49% of the fracture energy, respectively, which indicates that the elastic energy stored before the peak is the source power of the specimen failure. When the confining pressure is 20 MPa, the additional energy required for the post-peak fracture of C60 and C70 concrete specimens is 400.11 J and 593.85 J, respectively, accounting for 97% of the fracture energy, indicating that the energy required for the failure of C60 and C70 concrete specimens at this time is mainly provided by external work, that the self-sustaining fracture ability of the specimens is poor and that the brittleness level is low.
Table 3.
Calculation results of the characteristic energy of C60 and C70 high-strength concrete.
The evolution laws of elastic energy, dissipative energy, pre-peak total energy, additional energy, fracture energy, and residual elastic strain energy with confining pressure are shown in Figure 7. It can be seen from Figure 7 that, with the increase of confining pressure, the six kinds of energy increase at different rates, and the storage rate of elastic energy gradually increases, which indicates that the confining pressure has a more obvious limiting effect on crack propagation, thus keeping the concrete from reaching the failure state and finally reducing the brittleness of concrete. When the confining pressure is 0 MPa, the elastic strain energy stored inside the specimen is released suddenly at the peak value, which can make the specimen fully fracture, and the additional energy consumed is very small; at this time, the self-sustaining fracture ability of concrete is stronger and the brittleness is higher. When the confining pressure is 20 MPa, the additional energy consumed by the specimen failure is much greater than the releasable elastic energy stored before the peak, and the further failure after the peak of the specimen will require more energy than the elastic deformation energy accumulated inside; this means that the concrete specimen will not only have no sudden release of energy, but will also require more external work to further destroy it, and the specimen will show obvious ductility characteristics.
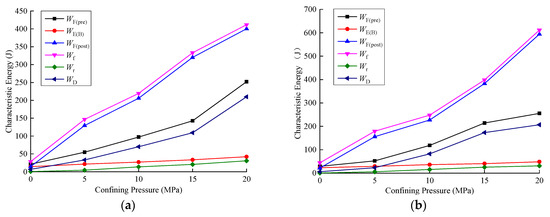
Figure 7.
The characteristic energy of high-strength concrete under different confining pressures. (a) C60; (b) C70.
3.4. Relationship between Energy Evolution and Concrete Strength Grade
Compared with Figure 5 and Figure 6, it can be seen that under the same confining pressure, the slope of the elastic strain energy evolution curve of C70 concrete is greater than that of C60 concrete, indicating that the energy storage rate of C70 concrete in the pre-peak stage and the energy release rate in the post-peak stage are both higher than that of C60 concrete. Figure 8 shows the characteristic energy evolution trend of high-strength concrete with different strength grades. It can be seen from Figure 8 that, with the increase of concrete strength grade, the elastic strain energy, the pre-peak total energy and the fracture energy all increase, while the residual elastic strain energy shows little difference. When the confining pressure is 10 MPa, the elastic strain energy stored before the peak of C60 and C70 concrete is 27.22 J and 36.21 J, respectively, and the proportion of energy in the total energy before the peak is 28% and 31%, respectively. This shows that with the increase of the strength grade, the storage capacity of the pre-peak elastic energy of the concrete specimen has increased. After reaching the peak strength, the residual elastic strain energy of the C60 and C70 concrete specimens is 13.86 J and 15.56 J, respectively, and the elastic strain energy release rate is 49% and 57%, respectively, indicating that the elastic strain energy accumulated in C70 concrete is released more completely. The releasable elastic energy of C60 and C70 concrete is 13.36 J and 20.65 J, respectively, which accounts for 6% and 8%, respectively, of the fracture energy. This shows that the C70 concrete specimen has a greater ability to maintain self-fracturing and its brittleness is higher. Since the energy evolution characteristics under the five confining pressures are the same, this section only takes a confining pressure of 10 MPa as an example, and other confining pressure levels will not be repeated.
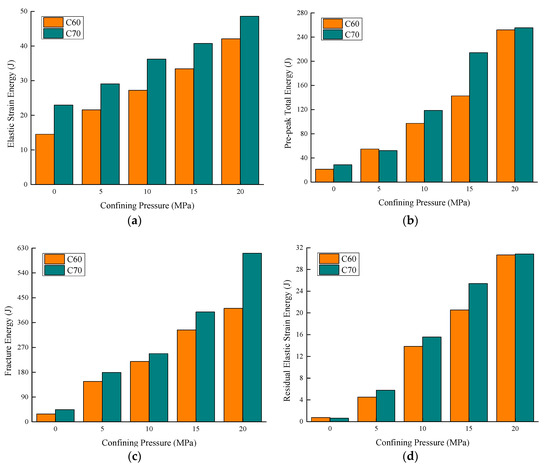
Figure 8.
The characteristic energy of high-strength concrete with different strength grades. (a) Elastic strain energy; (b) pre-peak total energy; (c) fracture energy; (d) residual elastic strain energy.
4. Evaluation Method of Concrete Brittleness
4.1. Brittleness Evaluation Index
The performance of a material’s brittleness is affected by its own properties as well as the specimen shape, size effect, and loading conditions. In the evaluation of material brittleness, attention should be paid to its ability to resist plastic deformation before the peak, the slope of the post-peak stress–strain curve and residual strength, and other characteristic factors, and the two stages before and after the peak need to be considered comprehensively when characterizing the brittleness of materials. Therefore, an approach based on the full stress–strain characteristics of high-strength concrete is an effective brittleness evaluation method to characterize the difficulty of brittle failure and the degree of brittleness of high-strength concrete in the form of energy parameters.
In the energy evolution process of concrete, the more strain energy is absorbed before the peak, the faster the stress–strain curve will drop after the peak, and the less additional energy will be provided by the external work required for concrete fracture after the peak; the energy required to cause concrete fracture mainly comes from the elastic strain energy absorbed before the peak, while the dissipative energy before the peak and the magnitude of the external work after the peak directly affect the fracture degree of the concrete after the peak. Based on this, it is proposed that the pre-peak elastic strain energy accumulation rate and the pre-peak dissipative energy dissipation rate should be used to define the pre-peak brittleness of concrete based on the whole process of concrete failure. The pre-peak brittleness index can be expressed as:
where is the elastic strain energy at the peak point and is the dissipative energy before the peak.
represents the ability to store elastic strain energy before the peak, and the value range is (0,1). When the concrete is in the ideal elastic state, , whereas when the concrete is in the fully plastic state, . Therefore, the larger the value of , the higher the brittleness level of concrete.
Regarding the energy required for concrete failure, the less additional energy is provided from the outside after the peak, the higher the proportion of elastic strain energy that is stored before the peak and the more energy is provided for the self-fracture of concrete after the peak, which indicates that the brittleness of concrete is increased. Therefore, the release rate of post-peak elastic energy is used to define the post-peak brittleness of concrete, and the post-peak brittleness evaluation index can be expressed as
where is the additional energy provided by the external testing machine, is the residual elastic strain energy, and is the fracture energy.
characterizes the ability of concrete to maintain self-fracture and crack propagation at the post-peak stage, and the value range is (0, 1). When concrete is in an ideal plastic state, ; when concrete is in an ideal brittle state, . Therefore, the larger the value of , the more obvious the brittleness of concrete.
4.2. Brittleness Evaluation Method
Since both and are positively correlated with the brittleness of concrete, a multi-index multiplicative synthesis method is used to establish parameters that can comprehensively characterize the pre-peak and post-peak brittleness index. The evaluation results of this method are continuous and monotonous, i.e., the product of and is used to characterize the brittleness index of the whole stress–strain process as follows:
The value range of the brittleness index is (0, 1). For the ideal brittle state of concrete, ; for the ideal plastic state of concrete, , so when the brittleness index increases from 0 to 1, the failure behavior of concrete changes from plastic to brittle. The method of comprehensively characterizing the brittleness evaluation index combines the pre-peak and post-peak brittleness evaluation indexes to establish a brittleness evaluation method that reflects the whole process of concrete failure.
4.3. Verification and Analysis
4.3.1. Experimental Verification
According to the calculation method of the brittleness evaluation index , the triaxial compression test data of C60 and C70 concrete under different confining pressures are analyzed. The calculation results are shown in Table 4. When the confining pressure is 0 MPa, the brittleness evaluation indexes () of C60 and C70 concrete are 0.329 and 0.402, respectively; since the brittleness evaluation index is positively correlated with the brittleness level, the brittleness of the concrete is also increased at this time. When the confining pressure is 20 MPa, the brittleness evaluation indexes () of C60 and C70 concrete are 0.005 and 0.006, respectively, indicating that the brittleness of concrete is low at this time. Under the same confining pressure, the brittleness evaluation index of C70 concrete is greater than that of C60, indicating that the strength of concrete is positively correlated with its brittleness index. The higher the concrete strength, the higher the brittleness level. Figure 9 shows the variation of brittleness index with confining pressure; the brittleness indexes , and of C60 and C70 concrete decrease with the increase of confining pressure. When the confining pressure increases from 0 MPa to 20 MPa, the brittleness index of C60 and C70 concrete decreases by 98% and 99%, respectively, indicating that the confining pressure inhibits the development of the brittleness level of concrete, and the brittleness evaluation index of C70 concrete is more sensitive to the inhibition of the confining pressure. By fitting the calculated value of the brittleness evaluation index , the relationship between the brittleness index and the confining pressure of C60 and C70 high-strength concrete is obtained, respectively, as shown below. Equations (20) and (21) reflect the brittleness characteristics of high-strength concrete under different confining pressures to a certain extent.
Table 4.
Calculation results of different brittleness evaluation indexes.
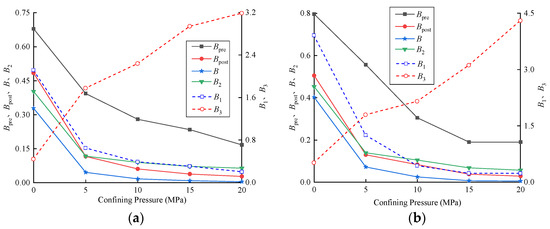
Figure 9.
Relationship between brittleness evaluation index and confining pressure of high-strength concrete. (a) C60; (b) C70.
Comparing the brittleness evaluation indexes calculated by different evaluation methods in Figure 9, we can see that the brittleness index in this paper has a high consistency with the trend of and , and the values of , , and gradually decrease as the confining pressure increases, indicating that the brittleness of the concrete specimen gradually decreases, which is basically consistent with the experimental trend, indicating that the three brittleness indicators are negatively correlated with the confining pressure. However, and only consider the impact of recoverable elastic energy on the brittleness of concrete at the pre-peak stage, ignoring the effect of the additional energy provided by external work at the post-peak stage on the brittleness level of concrete; thus, they cannot well reflect the brittle behavior of the whole process of concrete failure, which indicates that these two brittleness characterization methods and have certain limitations. The brittleness level reflected by is contrary to reality; the value of gradually increases with the increase of confining pressure, indicating that is positively correlated with the confining pressure, and the value range of is larger, which is not conducive to measuring the brittleness level of the material, as the numerator (fracture energy) and denominator (nominal stress) in the expression do not belong to the same order of magnitude, so the physical meaning of is not sufficiently clear. The brittleness evaluation index proposed in this paper is established based on the whole process of concrete energy evolution with a clear physical meaning: the value range is (0, 1), and the value of is continuous and monotonous, so it has good adaptability. In summary, the brittleness level represented by the brittleness index is more consistent with the physical test results, and it has a better evaluation effect on the brittleness of high-strength concrete materials under different confining pressures.
4.3.2. Analysis of Influencing Factors
The relationship between the characteristic strength of concrete under triaxial compression and the brittleness evaluation index is shown in Figure 10. The figure shows that the brittleness evaluation index is negatively correlated with the peak strength and residual strength, showing an exponential function relationship. With the increase of the peak strength and residual strength, the brittleness evaluation index gradually decreased, and the brittleness level of concrete gradually decreased, indicating that the confining pressure can inhibit the initiation and propagation of micro-cracks in concrete and increase the threshold stress for micro-crack initiation and propagation in concrete, thereby improving the load-bearing capacity of concrete and reducing its brittleness level.
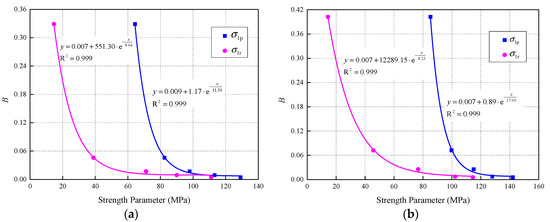
Figure 10.
Relationship between brittleness evaluation index and strength parameters. (a) C60; (b) C70.
The relationship between the brittleness index and the elastic energy stored before the peak, the total energy before the peak, the additional energy and the fracture energy is shown in Figure 11. It can be seen from Figure 11 that the brittleness evaluation has an exponential function and negative correlation with the elastic energy stored before the peak, the total energy before the peak, the additional energy, and the fracture energy. In the pre-peak stage, with the increase of confining pressure, the load-bearing capacity of the concrete increases. At this time, the propagation and penetration of the micro-cracks inside the specimen needs to dissipate more energy, so gradually increases with the increase of confining pressure. The ratio of to increases gradually, while that of to decreases gradually and the storage capacity of elastic energy decreases gradually, resulting in the gradual weakening of the brittleness level of concrete. In the post-peak stage, as the confining pressure increases, and gradually increases and the ratio of to gradually increases. This is because the confining pressure increases the threshold stress for crack initiation and improves the residual strength of the concrete specimen at the post-peak stage; furthermore, the self-sustaining fracture ability of the specimen weakens at the post-peak stage, thus weakening its brittleness.
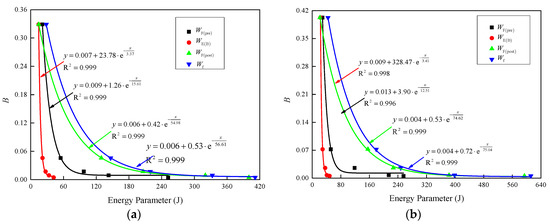
Figure 11.
Relationship between brittleness evaluation index and energy parameters. (a) C60; (b) C70.
5. Conclusions
- Under different confining pressures, the input energy and dissipative energy of C60 and C70 high-strength concrete specimens increase with the increase of axial strain, and the elastic strain energy shows a trend of first increasing and then decreasing. After the specimen reaches the peak strength, the elastic strain energy decreases gradually, and the dissipative energy increases gradually, reaching maximum and minimum values until the failure of the specimen. When the high-strength concrete specimen is damaged, the ratio of the additional energy provided by the outside world to the fracture energy is proportional to the confining pressure.
- Based on the energy evolution law in the full stress–strain process of high-strength concrete, the pre-peak and post-peak brittleness indexes and are defined; then, according to the positive correlation between , and the brittleness of the concrete, a method to characterize the brittleness index of the whole stress–strain process by the product of , is proposed.
- The brittleness evaluation index is negatively correlated with the peak strength and residual strength, showing an exponential function relationship, and it has an exponential function and negative correlation with the elastic energy stored before the peak, the total energy before the peak, additional energy, and fracture energy. The comparative analysis of different brittleness evaluation methods shows that the brittleness evaluation index method proposed in this paper presents a continuous and monotonous brittleness index and can better characterize the brittleness level of high-strength concrete under different stress conditions.
Author Contributions
The author contributions of the paper are as follows: R.Z., H.C., and M.L. proposed the conceptualization and methodology; R.Z. and R.H. conducted the tests; L.Z. and M.L. analyzed the data; R.Z. wrote the paper; H.C. reviewed and edited the paper. All authors have read and agreed to the published version of the manuscript.
Funding
This research was supported by the National Natural Science Foundation of China (NO.51474004; NO.51874005).
Conflicts of Interest
The authors declare no conflict of interest.
References
- Morley, A. Strength of Materials; Longmans Green and Company: London, UK, 1944; pp. 71–72. [Google Scholar]
- Hetenyi, M. Handbook of Experimental Stress Analysis; John Wiley: New York, NY, USA, 1966; pp. 23–25. [Google Scholar]
- Ramsay, J.G. Folding and Fracturing of Rocks; McGraw-Hill: London, UK, 1967; pp. 44–47. [Google Scholar]
- Lawn, B.R.; Marshall, D.B. Hardness, toughness, and brittleness: An indentation analysis. J. Am. Ceram. Soc. 1979, 62, 347–350. [Google Scholar] [CrossRef]
- Quinn, J.B.; Quinn, G.D. Indentation brittleness of ceramics: A fresh approach. J. Mater. Sci. 1997, 32, 4331–4346. [Google Scholar] [CrossRef]
- Li, X.; Xue, W.; Fu, C. Mechanical properties of high-performance steel-fibre-reinforced concrete and its application in underground mine engineering. Materials 2019, 12, 2470. [Google Scholar] [CrossRef] [PubMed]
- Chen, Z.; Tang, J.; Zhou, X.; Zhou, J.; Chen, J. Interfacial bond behavior of high strength concrete filled steel tube after exposure to elevated temperatures and cooled by fire hydrant. Materials 2019, 13, 150. [Google Scholar] [CrossRef] [PubMed]
- Eid, R.; Muravin, B.; Kovler, K. Acoustic emission monitoring of high-strength concrete columns subjected to compressive axial loading. Materials 2020, 13, 3114. [Google Scholar] [CrossRef] [PubMed]
- Jenq, Y.; Shah, S.P. Two parameter fracture model for concrete. J. Eng. Mech. 1985, 111, 1227–1241. [Google Scholar] [CrossRef]
- Tasdemir, C.; Tasdemir, M.A. Effects of silica fume and aggregate size on the brittleness of concrete. Cem. Concr. Res. 1996, 26, 63–68. [Google Scholar] [CrossRef]
- Zhang, B.; Bicanic, N.; Pearce, C.J. Relationship between brittleness and moisture loss of concrete exposed to high temperatures. Cem. Concr. Res. 2002, 32, 363–371. [Google Scholar] [CrossRef]
- Yan, A.; Wu, K.; Zhang, D.; Yao, W. The relationship between the brittleness and fracture surface characteristics of high-strength concrete. J. Tongji Univ. 2002, 30, 66–70. (In Chinese) [Google Scholar]
- Lange, D.A.; Hamlin, M.; Surendra, P.S. Relationship between fracture surface roughness and fracture behavior of cement paste and mortar. J. Am. Ceram. Soc. 1993, 76, 589–597. [Google Scholar] [CrossRef]
- Yao, M.; Zhan, B.; Huang, X. Experimental study on the effect of curing on the brittleness of high performance concrete. J. Hefei Univ. Technol. 2004, 11, 1438–1442. (In Chinese) [Google Scholar]
- Guo, X. Study on the Brittleness Evaluation Method and Toughening Measures of High-Strength Concrete. Ph.D. Thesis, Wuhan University, Wuhan, China, 2005. (In Chinese). [Google Scholar]
- Huang, Y.; Qian, J. Brittleness and strength size effect of high-strength and ultra-high-strength concrete. Ind. Constr. 2005, 35, 15–17. (In Chinese) [Google Scholar]
- Huang, Y.; Qian, J.; Zhou, X. Study on the brittleness index of quasi-brittle materials based on the strength size effect. Eng. Mech. 2006, 23, 38–42. (In Chinese) [Google Scholar]
- Han, J.; Yan, P. A new method of concrete brittleness evaluation-fractured stone area fraction method. Concrete 2011, 2, 1–3. (In Chinese) [Google Scholar]
- Ministry of Housing and Urban-Rural Development of China. Specification for Design of Concrete Mixture Ratio; JGJ55-2011; China Construction Industry Press: Beijing, China, 2011. (In Chinese) [Google Scholar]
- Xie, H.P.; Ju, Y.; Li, L.Y.; Peng, R.D. Energy mechanism of deformation and failure of rock masses. Chin. J. Rock Mech. Eng. 2008, 27, 1729–1740. (In Chinese) [Google Scholar]
- Zhang, L.; Gao, S.; Wang, Z.; Cong, Y. Analysis of marble failure energy evolution under loading and unloading conditions. Chin. J. Rock Mech. Eng. 2013, 32, 1572–1578. (In Chinese) [Google Scholar]
- Tian, Y.; Yu, R. Energy analysis of limestone during triaxial compression under different confining pressures. Rock Soil Mech. 2014, 35, 118–122. (In Chinese) [Google Scholar]
- Xie, H.P.; Li, L.Y.; Ju, Y.; Peng, R.D.; Yang, Y.M. Energy analysis for damage and catastrophic failure of rocks. Sci. China Technol. Sci. 2011, 54, 199–209. [Google Scholar] [CrossRef]
- Wu, J. Elasticity; Higher Education Press: Beijing, China, 2011. (In Chinese) [Google Scholar]
Publisher’s Note: MDPI stays neutral with regard to jurisdictional claims in published maps and institutional affiliations. |
© 2020 by the authors. Licensee MDPI, Basel, Switzerland. This article is an open access article distributed under the terms and conditions of the Creative Commons Attribution (CC BY) license (http://creativecommons.org/licenses/by/4.0/).