Abstract
We investigated two detector modules, each consisting of a 8 × 8 matrix of GaGG:Ce crystals with a crystal size of 3 × 3 × 20 mm and a 3.2 mm pitch. The light is collected by a 8 × 8 silicon photomultiplier array, with one silicon photomultiplier matching one crystal. The signals are read out and processed using the TOFPET2 ASIC. Performed laboratory tests of the detectors were performed using a Na source, where energy and coincidence time resolution with different optical coupling were examined between the crystals and silicon photomultipliers, as well as under various operating voltages. The mean energy resolution of at 511 keV was observed and it was shown that the coincidence time resolution of ps could be achieved. The results reassure that the GaGG scintillator is a very promising candidate for the development of imaging systems, in particular, ones utilizing Compton scattering where the energy resolution plays a critical role and a moderate timing performance is acceptable.
1. Introduction
Detectors applied in many modalities of medical imaging, such as Positron Emission Tomography (PET), are based on scintillation materials, most commonly inorganic crystals. The desirable properties of the crystals are a high light yield resulting in good energy resolution, high stopping power, and a fast decay time needed to achieve a good coincidence time resolution in Time-of-Flight PET (ToF-PET) systems [1]. One of the most commonly used materials in PET systems is Cerium doped Lutetium Yttrium Oxyorthosilicate, :Ce (LYSO:Ce) [2], satisfying those prerequisites. Scintillation crystals that supersede LYSO in the light output, such as [3] or [4], offer better energy resolutions compared to LYSO [5], but their extremely high higroscopicity and frailness make them difficult to handle since they often need expensive encapsulations.
Gadolinium Aluminum Gallium Garnet doped with Cerium (GaGG:Ce), :Ce, is a relatively new material that first appeared less than 10 years ago, offering significantly higher light output than LYSO [6,7]. It has been investigated in various form-factors and readout configurations and the results also demonstrated an improved energy resolution [8,9,10,11,12]. It is also advantageous by not having intrinsic radioactivity, which makes it a good candidate for single arm (i.e., non-coincidence) applications. On the other hand, its scintillation has a longer decay time, resulting in a lower coincidence time resolution (CTR) compared to LYSO [13,14,15]. The properties of GaGG crystals of various form factors and from various producers, coupled to different light collection devices, are being actively investigated, since this scintillator might prove advantageous for imaging devices where a high energy resolution is needed, such as medical imaging devices in PET. GaGG may be especially interesting for improving the detection capabilities of Compton imaging systems, which use Compton scattering kinematics to determine the direction of incoming gamma radiation [16,17,18].
Compton scattering may also be used to measure polarization correlations of 511 keV annihilation quanta and exploit them to improve signal to noise ratio and consequently the image contrast in PET [19,20,21]. A great way to measure the Compton scattering is to apply segmented scintillator detectors coupled to Silicon photomultipliers (SiPMs). Commonly, systems with two readout layers are used to detect the recoil electron and scattered photon, respectively. It has been demonstrated that single layer readout detectors may reconstruct the Compton scattering [22] and conceptual studies have been performed to evaluate their performance as Compton cameras [23]. Moreover it a prototype system has shown that using two modules of segmented Lutetium Fine Silicate (LFS) crystals read out by SiPMs, make it possible to observe azimuthal modulation related to polarization correlations of annihilation quanta [24] and the results suggested that a further improvement in the precision identification of polarization correlations would be desirable. One way to achieve this is to improve the energy resolution of the system, hence the GaGG:Ce scintillator might prove an interesting solution.
The goal of this investigation is to examine the energy resolution and coincidence time resolution of GaGG:Ce in a specific matrix configuration of 8 × 8 crystals of 3 × 3 × 20 , coupled to the matching SiPM arrays and read out by fast digital electronics optimized for PET systems.
2. Materials and Methods
2.1. Experimental Setup
The experimental setup consisted of two detector modules with GaGG:Ce scintillating pixels and Silicon Photomultiplier (SiPM) arrays which were read out by fast data acquisition and processing system, the details of which are given below.
2.2. GaGG:Ce Detector Modules
We investigated the properties of two detector modules, each consisting of a 8 × 8 matrix of GaGG:Ce scintillator crystals and a SiPM array. We obtained the GaGG:Ce matrices from Hilger Crystals Ltd (Margate, UK). Each contained 64 crystals with a size of 3 mm × 3 mm × 20 mm. All crystal sides were polished and assembled with a 0.2 mm reflector material, resulting in a matrix pitch of 3.2 mm. The reflector was an epoxy resin loaded with a specific TiO-based pigment (details proprietary to Hilger Crystals), with the reflectivity of >98% at 520 nm. The matrix is shown in the Figure 1. The main properties of the material are listed in Table 1 along with the properties of the LYSO scintillator for comparison.
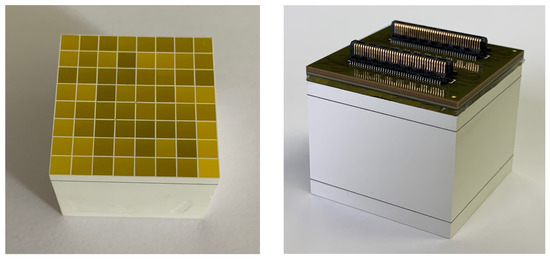
Figure 1.
GaGG:Ce matrix containing 64 crystals with a size of 3 mm × 3 mm × 20 mm in 8 × 8 configuration. All crystal sides were polished and casted in 0.2 mm of white epoxy (left). GaGG:Ce matrix along with the SiPM array optically coupled with a silicon optical interface (right).

Table 1.
The properties of GaGG(Ce) [26] and LYSO [2] according to the manufacturers. * We note that the upper limit of the emission spectral range of GaGG:Ce quoted in the literature is mostly between 650–750 nm [8,11,13].
The scintillator matrices were coupled to SiPM arrays with matching pixel dimensions of 3 mm × 3 mm and the same pitch of 3.2 mm (Hamamatsu Photonics, Hamamatsu, Japan, model S13361-0808AE). The SiPMs have a breakdown voltage at 51.4 V and they were operated at an overvoltage 2–5 V to explore the impact on energy and timing resolution. Another thing we wanted to explore was the influence of optical coupling to the detector performance. Previously we reported that using optical grease may not be optimal with crystal matrices, since it tends to infiltrate between the crystals, changing the optical properties [25]. Therefore other optical coupling materials were used: The Module I was optically coupled using 1 mm of thick silicon pad (Eljen Technology, Sweetwater, TX, USA, EJ-560) and the Module II was optically coupled using optical cement (Eljen Technology, Sweetwater, TX, USA, EJ-500). The former optical material had a refraction index, n = 1.43 while the latter had n = 1.57 according to the manufacturer. A lightproof housing for the modules was 3D printed using 2 mm of thick black ABS material.
2.3. SiPM Control and Data Acquisition System
The data acquisition (DAQ) and processing system TOFPET2 produced by PETsys Electronics—Medical PET Detectors, S.A. (Oeiras, Portugal), was used [27,28]. The system consists of a central DAQ module, which can accompany up to 8 front-end boards (FEB), where two detector modules fit on one board. Each FEB contains two powerful ASICs enabling full control, readout, and data processing from the SiPMs. In the basic setup this system can read up to 1024 channels, 64 per module. The system comes with an evaluation kit, containing two 3 × 3 × 3 mm LYSO crystals coupled to SiPMs with an appropriate adapter board compatible with the FEB socket. A Peltier-cooled black box is also a part of the evaluation kit, and it was used for the test measurements reported in this paper. The on-board firmware enables bias voltage selection individually for each module, as well as temperature monitoring. The TOFPET2 can be programmed to trigger on single events or coincidences and in the latter case it acquires events in which two signals occur in detector modules belonging to different trigger regions. For the measurements reported here, we used the default settings of the TOFPET2 system, enabling a recording of all signals and selection of coincidences by offline filtering.
2.4. Energy Calibration and Non-Linearity Correction
The SiPMs have a limited number of cells that can fire within one event. In this case, each SiPM channel in the array had 3600 microcells. This leads to a known effect of signal saturation at higher energies and it is especially pronounced with bright scintillators such as GaGG:Ce. The effect of signal saturation is clearly visible in Figure 2 (left), where the ratio of the peak positions of 1275 keV gamma and 511 keV gamma is smaller than 2.5.
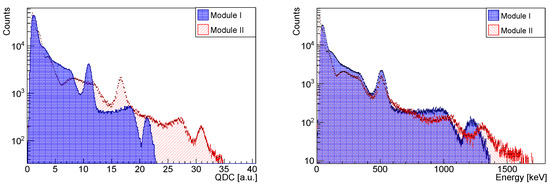
Figure 2.
The Na spectra before non-linearity correction and calibation measured by a crystal from Module I and Module II at = 3 V, respectively (left). The energy spectra of Na after applying the non-linearity correction and calibration of the 511 keV peak (right).
The analog-to-digital converter on the ASIC also exhibits a small non-linearity according to manufacturer PETSys. In order to perform the non-linearity correction and energy calibration one may use several gamma sources with different energies. However the DAQ system producer recommended applying a specific correction function which linearizes the charge Q, measured by the charge-to-digital converter (QDC):
with , , , and [29]. This approach was tested to correct the non-linearity and calibrated the resulting spectrum using only the 511 keV peak. In Figure 2 (right) are the energy spectra from Module I and II after the non-linearity correction and calibration. The Ne(1275 keV) gamma peaks can have a deviation of up to from linearity, however the deviation from linearity within the 511 keV peak, under study in this work, is negligible. The width of the 1275 keV peak measured by Module II in Figure 2 (right) is (FWHM), compared to at 511 keV, showing that the scaling of the energy resolution with ∼1/ is preserved.
2.5. Reference Measurements
To test the performance of the SiPM control and DAQ system, two LYSO pixel detectors of 3 × 3 × 3 mm (produced by Epic-Crystal, Kunshan, China) were used, coupled to SiPM (KETEK GmbH, München, Germany, model PM3325-WB-D0), that had been provided as a part of the evaluation kit for reference measurements.
The energy spectrum of coincident events originating from source was formed by plotting only the energies of the events where both opposing crystals fired. An example is shown in Figure 3 (left). At the recommended overvoltage value V, the energy resolution at 511 keV was obtained.
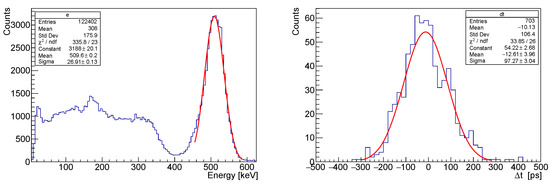
Figure 3.
The 511 keV gamma spectrum obtained by 3 × 3 × 3 mm LYSO crystal with KETEK SiPM at 4 V overvoltage (left). Coincidence time spectrum of annihilation gammas from Na, detected by two 3 × 3 × 3 mm LYSO crystals with KETEK SiPM at 4V overvoltage (right). Events with energy within 511 keV ± 1 were selected.
The coincidence time spectrum was constructed by the difference of the two detector trigger times, taking into account only the signals within the energy range 511 keV ± 1 , where is the standard deviation of the Gaussian fit to the photo-peak (Figure 3). At V, we obtained the coincidence time resolution of ps. Since the system consists of two same detectors, one may consider that the contribution of each detector to the time resolution is CTR, hence:
3. Results
The gamma source throughout the measurements was a point-like Na. All measurements were carried out in controlled temperature conditions in the temperature range of C. The breakdown voltages of both SiPM arrays were V and measurements were performed at voltages = 2–5 V above the breakdown value. The TOFPET2 ASIC was used with the default (factory) settings and events where two detectors fired in coincidence were filtered out.
3.1. Energy Resolution
Examples of the measured spectra of 511 keV gamma are shown in Figure 4, where the one on the left corresponds to a crystal in Module I and the one on the right to a crystal in Module II. To determine the energy resolution , the Gaussian function was fitted with the linear background:
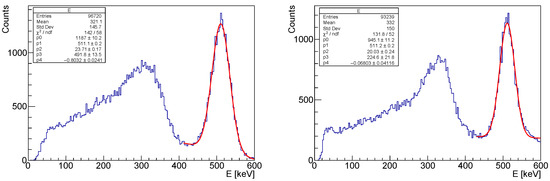
Figure 4.
The spectra of 511 keV gammas from measured by a crystal from Module I at V (left) and from Module II at V (right). The fit function is the one given in Equation (3). The spectra with the best obtained energy resolutions are shown: for the Module I and for the Module II.
The mean energy resolutions are obtained from the measured resolutions of the fired crystals in a module. They are summarized in Table 2. The uncertainties are the standard deviations of the measured values in each configuration and reflect the (in)homogeneity within a module. The best energy resolution of a single crystal was for a pixel in Module II at = 3 V, shown in Figure 4 (right).
Table 2.
The measured energy resolution at 511 keV. The quoted value are mean resolutions of fired pixels in the module. The uncertainties are the standard deviations of the measured values in each configuration.
The results clearly indicate that better resolution is achieved with the Module II at all bias voltages. Before gluing it with the optical cement, we tested the GaGG matrix and the SiPM of the Module II using silicon optical pad. The mean energy resolution of the fired pixels was at = 3 V and it was at = 4 V. Within the uncertainties, these results are consistent with the ones of the Module I quoted in Table 2 for the respective bias voltages, suggesting that the difference in the performance between the modules is driven by the optical coupling.
3.2. Coincidence Time Resolution
Coincidence time resolution was measured for the coincident detection of the 511 keV annihilation quanta. First, we selected the events where both oppositely facing pixels had fired. Then, the coincidence time spectrum was constructed by taking the trigger time difference, , of the two signals which are both within the energy range of 511 keV ± 1 in their respective energy spectra.
We carried out three sets of measurements. In the first set, the system consisted of a single LYSO pixel detector coupled to SiPM PM3325-WB-D0 (KETEK GmbH, München, Germany) and the GaGG Module I, which used 1 mm of thick silicon pad (Eljen Technology, Sweetwater, TX, USA, EJ-560) for optical coupling between the crystal matrices and the SiPM array. In the second set of measurements, it was replaced by Module II, where optical cement (Eljen Technology, Sweetwater, TX, USA, EJ-500) was used for optical coupling. In the third set of measurement, Module I and Module II were tested in coincidence. In measurements with the LYSO crystal, the detector was always kept at the same bias voltage of V. Examples of obtained coincidence time spectra are shown in Figure 5, Figure 6 and Figure 7, respectively for the three sets of measurements. The results are summarized in Table 3.
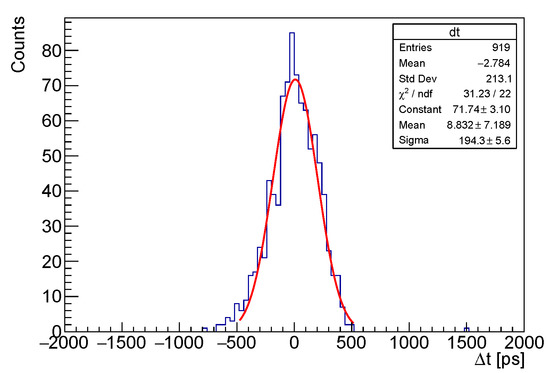
Figure 5.
Coincidence time spectrum of annihilation gammas from Na, detected by a 3 × 3 × 3 mm LYSO crystal and a crystal from GaGG Module I operating at V.
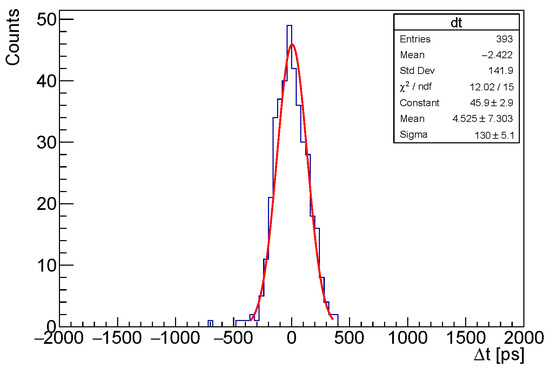
Figure 6.
Coincidence time spectrum of annihilation gammas from Na, detected by a 3 × 3 × 3 mm LYSO crystal and a crystal from GaGG Module II operating at V.
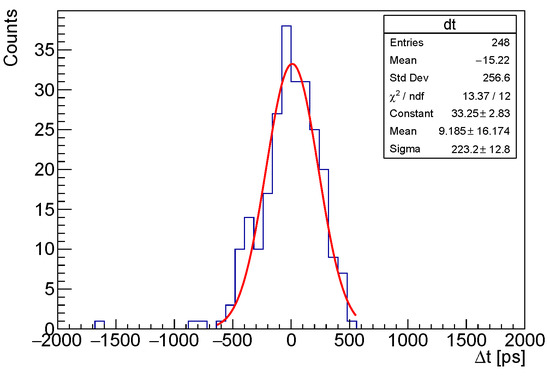
Figure 7.
Coincidence time spectrum of annihilation gammas from Na, detected by crystals from GaGG Modules I and II, both at V.
Table 3.
The measured coincidence time resolution: Each value is the mean coincidence time resolution (CTR) of multiple pixel pairs in that configuration and the uncertainty is the standard deviation of the measured values.
From the measured in Sets 1 and 2, and the extracted contribution of the LYSO detector (Equation (2)), we can derive the contribution of the GaGG detector as:
For Module I at V, this yields ps and for Module II at V, it is ps. Hence one can deduce the system’s of consisting of a pair of GaGG crystals from modules I and II:
According to the above equation, a system consisting of Module I and Module II would have the ps, which is consistent with the measured value ps at V (Table 3, Set 3). Hence, we can use the measured data to deduce the of a system consisting of two GaGG modules coupled by optical cement according to:
The resulting coincidence time resolution at V is ps.
4. Discussion
The energy resolution results presented here are consistent with the measurement carried out using similar setups [10,12]. The observed dependence of the energy resolution on over-voltage, shows that dark counts and cross talk effects in the SiPM start playing a role, which negatively influences the resolution at high overvoltages. The observed energy and timing resolutions both suggest that coupling by optical cement results in a superior performance than the silicon interface. In fact the deduced coincidence time resolution of GaGG, ps, is according to our knowledge, one of the best yet observed for this crystal. The difference in the performance with the two optical coupling materials could have several reasons. First, we note that the optical cement has an index of refraction closer to the one of GaGG:Ce, which may result in a higher light transfer efficiency, as observed in [15]. Second, the optical cement coupling is much thinner (∼100 m) compared to the silicon’s 1 mm, where photons incoming at large angles may be directed outside of the matching SiPM’s active area, hence reducing the signal. Finally, the manufacturer quotes a ∼94 transmitivity (for 2 mm thick silicon), while they quote >99% for the cement [30]. It remains a question for further investigations whether these factors can fully absorb the observed difference in the performance.
We can also compare the obtained results with a previously performed investigation of single 3 × 3 × 3 mm GaGG:Ce crystals with a DRS4-based setup [31]. The setup consisted of two detectors, each containing of a single 3 × 3 × 3 mm GaGG:Ce crystal (by Hilger Crystals) coupled to a SiPM produced by Hamamatsu Photonics (S13360-3050CS). Each crystal was wrapped in 0.2 mm of thick Teflon and coupled to the SiPM using optical grease. Signals were sampled at 1 GS/s by DRS4 evaluation board and stored for offline analysis. Temperature during measurement was C. At an operating voltage V, we obtained the energy resolution of and a coincidence time resolution, ps [32]. Although comparing two different readout systems and different crystal geometries may be hard to interpret, we may conclude that the TOFPET2-based setup with optical cement coupling yielded comparable or better results, in spite of having longer crystals (and matrices), which tend to worsen the time resolution [14].
5. Conclusions
This research showed that good energy resolution and an acceptable coincidence time resolution could be achieved using GaGG:Ce scintillators. The coincidence time resolution that could be achieved with the setup was ps, which is comparable to resolutions of the most commercial PET systems.
The best mean energy resolution of the crystals in a module was at 511 keV, while the best observed resolution of a single crystal in the matrix was . One has to bear in mind that the GaGG emission spectrum peaks at 520 nm, which is ∼70 nm above the SiPM quantum efficiency maximum. Hence an optimal SiPM, in terms of crystal emission/SiPM efficiency spectra matching, might bring even higher energy resolutions.
Given the obtained results, we believe GaGG:Ce crystal is a great candidate for further developments of imaging systems, in particular ones based on Compton imaging, where the performance critically depends on the energy resolution.
Author Contributions
Conceptualization, M.M. and D.B.; Data curation, M.M. and L.P.; Formal analysis, M.M.; Funding acquisition, D.B. and M.M.; Investigation, M.M. and A.M.K.; Methodology, M.M.; Project administration, M.M. and D.B.; Resources, M.M.; Software, M.M.; Supervision, M.M.; Visualization, M.M.; Writing—original draft, M.M. All authors have read and agreed to the published version of the manuscript.
Funding
This work was supported in part by the “Research Cooperability” Program of the Croatian Science Foundation funded by the European Union from the European Social Fund under the Operational Programme Efficient Human Resources 2014–2020, Grant number PZS-2019-02-5829, in part by EU STRONG-2020 project Grant Agreement 824093 and in part by International Atomic Energy Agency under the project CRP F22069.
Conflicts of Interest
The authors declare no conflict of interest.
References
- Lecoq, P.; Gektin, A.; Korzhik, M. Inorganic Scintillators for Detector Systems: Physical Principles and Crystal Engineering; Springer: Berlin/Heidelberg, Germany, 2006. [Google Scholar]
- Prelude 420 LYSO. Available online: https://www.crystals.saint-gobain.com/products/prelude-420-LYSO (accessed on 7 November 2020).
- Scintillation and Detection Characteristics of High-Sensitivity CeBr3 Gamma-Ray Spectrometers. Available online: https://www.gammadata.se/assets/Uploads/CeBr3-WhitePaper.pdf (accessed on 7 November 2020).
- Standard and Enhanced Lanthanum Bromide. Available online: https://www.crystals.saint-gobain.com/products/standard-and-enhanced-lanthanum-bromide (accessed on 7 November 2020).
- Guss, P.; Reed, M.; Yuan, D.; Cutler, M.; Contreras, C.; Beller, D. Comparison of CeBr3 with LaBr3:Ce, LaCl3:Ce, and NaI:Tl detectors. In Hard X-Ray, Gamma-Ray, and Neutron Detector Physics XII; Burger, A., Franks, L.A., James, R.B., Eds.; SPIE, The International Society for Optics and Photonics: Bellingham, WA, USA, 2010; Volume 7805, pp. 93–108. [Google Scholar] [CrossRef]
- Kamada, K.; Yanagida, T.; Endo, T.; Tsutumi, K.; Usuki, Y.; Nikl, M.; Fujimoto, Y.; Fukabori, A.; Yoshikawa, A. 2inch diameter single crystal growth and scintillation properties of Ce:Gd3Al2Ga3O12. J. Cryst. Growth 2012, 352, 88–90. [Google Scholar] [CrossRef]
- Kamada, K.; Yanagida, T.; Pejchal, J.; Nikl, M.; Endo, T.; Tsutsumi, K.; Fujimoto, Y.; Fukabori, A.; Yoshikawa, A. Crystal Growth and Scintillation Properties of Ce Doped Gd3(Ga,Al)5O12 Single Crystals. IEEE Trans. Nucl. Sci. 2012, 59, 2112–2115. [Google Scholar] [CrossRef]
- Iwanowska, J.; Swiderski, L.; Szczesniak, T.; Sibczynski, P.; Moszynski, M.; Grodzicka, M.; Kamada, K.; Tsutsumi, K.; Usuki, Y.; Yanagida, T.; et al. Performance of cerium-doped Gd3Al2Ga3O12 (GAGG:Ce) scintillator in gamma-ray spectrometry. Nucl. Instrum. Methods Phys. Res. Sect. Accel. Spectrometers Detect. Assoc. Equip. 2013, 712, 34–40. [Google Scholar] [CrossRef]
- Kim, H.L.; Kim, H.J.; Jang, E.J.; Lee, W.G.; Ki, M.K.; Kim, H.D.; Jun, G.S.; Kochurikhin, V. Scintillation properties of the GD3Al2Ga3O12:Ce crystal. J. Ceram. Process. Res. 2015, 16, 124–128. [Google Scholar]
- Stewart, A.G.; Seitz, B.; O’Neill, K.; Wall, L.; Jackson, J.C. Energy Resolution of Ce:GAGG and Pr:LuAG Scintillators Coupled to 3 mm × 3 mm Silicon Photomultipliers. IEEE Trans. Nucl. Sci. 2016, 63, 2496–2501. [Google Scholar] [CrossRef]
- Mori, M.; Xu, J.; Okada, G.; Yanagida, T.; Ueda, J.; Tanabe, S. Comparative study of optical and scintillation properties of Ce:YAGG, Ce:GAGG and Ce:LuAGG transparent ceramics. J. Ceram. Soc. Jpn. 2016, 124, 569–573. [Google Scholar] [CrossRef]
- Seitz, B.; Rivera, N.C.; Stewart, A.G. Energy Resolution and Temperature Dependence of Ce:GAGG Coupled to 3 mm × 3 mm Silicon Photomultipliers. IEEE Trans. Nucl. Sci. 2016, 63, 503–508. [Google Scholar] [CrossRef]
- Lucchini, M.; Babin, V.; Bohacek, P.; Gundacker, S.; Kamada, K.; Nikl, M.; Petrosyan, A.; Yoshikawa, A.; Auffray, E. Effect of Mg2+ ions co-doping on timing performance and radiation tolerance of Cerium doped Gd3Al2Ga3O12 crystals. Nucl. Instrum. Methods Phys. Res. Sect. Accel. Spectrometers Detect. Assoc. Equip. 2016, 816, 176–183. [Google Scholar] [CrossRef]
- Gundacker, S.; Acerbi, F.; Auffray, E.; Ferri, A.; Gola, A.; Nemallapudi, M.; Paternoster, G.; Piemonte, C.; Lecoq, P. State of the art timing in TOF-PET detectors with LuAG, GAGG and L(Y)SO scintillators of various sizes coupled to FBK-SiPMs. J. Instrum. 2016, 11, P08008. [Google Scholar] [CrossRef]
- Gundacker, S.; Turtos, R.M.; Kratochwil, N.; Pots, R.H.; Paganoni, M.; Lecoq, P.; Auffray, E. Experimental time resolution limits of modern SiPMs and TOF-PET detectors exploring different scintillators and Cherenkov emission. Phys. Med. Biol. 2020, 65, 025001. [Google Scholar] [CrossRef]
- Schneider, F.R.; Shimazoe, K.; Somlai-Schweiger, I.; Ziegler, S.I. A PET detector prototype based on digital SiPMs and GAGG scintillators. Phys. Med. Biol. 2015, 60, 1667–1679. [Google Scholar] [CrossRef] [PubMed]
- Uenomachi, M.; Mizumachi, Y.; Yoshihara, Y.; Takahashi, T.; Shimazoe, K.; Yabu, G.; Yoneda, H.; Watanabe, S.; Takeda, S.; Orita, T.; et al. Double photon emission coincidence imaging with GAGG-SiPM Compton camera. Nucl. Instrum. Methods Phys. Res. Sect. Accel. Spectrometers Detect. Assoc. Equip. 2018. [Google Scholar] [CrossRef]
- Shimazoe, K.; Yoshino, M.; Ohshima, Y.; Uenomachi, M.; Oogane, K.; Orita, T.; Takahashi, H.; Kamada, K.; Yoshikawa, A.; Takahashi, M. Development of simultaneous PET and Compton imaging using GAGG-SiPM based pixel detectors. Nucl. Instrum. Methods Phys. Res. Sect. Accel. Spectrometers Detect. Assoc. Equip. 2018, 954. [Google Scholar] [CrossRef]
- Kuncic, Z.; McNamara, A.; Wu, K.; Boardman, D. Polarization enhanced X-ray imaging for biomedicine. Nucl. Instrum. Methods Phys. Res. Sect. Accel. Spectrometers Detect. Assoc. Equip. 2011, 648, S208–S210. [Google Scholar] [CrossRef]
- McNamara, A.; Toghyani, M.; Gillam, J.; Wu, K.; Kuncic, Z. Towards optimal imaging with PET: An in silico feasibility study. Phys. Med. Biol. 2014, 59, 7587–7600. [Google Scholar] [CrossRef]
- Toghyani, M.; Gillam, J.; McNamara, A.; Kuncic, Z. Polarisation-based coincidence event discrimination: An in silico study towards a feasible scheme for Compton-PET. Phys. Med. Biol. 2016, 61, 5803–5817. [Google Scholar] [CrossRef]
- Makek, M.; Bosnar, D.; Pavelić, L. Scintillator Pixel Detectors for Measurement of Compton Scattering. Condens. Matter 2019, 4, 24. [Google Scholar] [CrossRef]
- Pausch, G.; Golnik, C.; Schulz, A.; Enghardt, W. A novel scheme of compton imaging for nuclear medicine. In Proceedings of the 2016 IEEE Nuclear Science Symposium, Medical Imaging Conference and Room-Temperature Semiconductor Detector Workshop (NSS/MIC/RTSD), Strasbourg, France, 29 October–6 November 2016; pp. 1–5. [Google Scholar] [CrossRef]
- Makek, M.; Bosnar, D.; Pavelić, L.; Šenjug, P.; Žugec, P. Single-layer Compton detectors for measurement of polarization correlations of annihilation quanta. Nucl. Instrum. Methods Phys. Res. Sect. Accel. Spectrometers Detect. Assoc. Equip. 2020, 958, 4. [Google Scholar] [CrossRef]
- Makek, M.; Bosnar, D.; Gačić, V.; Pavelić, L.; Šenjug, P.; Žugec, P. Performance of scintillation pixel detectors with MPPC read-out and digital signal processing. Acta Phys. Pol. B 2017, 48, 1721–1726. [Google Scholar] [CrossRef]
- Lythe, L.; (Hilger Crystals Ltd, Margate, UK). Personal communication, 2019.
- Francesco, A.D.; Bugalho, R.; Oliveira, L.; Pacher, L.; Rolo, M.; Silva, J.; Silva, R.; Varela, J. TOFPET2: A high-performance ASIC for time and amplitude measurements of SiPM signals in time-of-flight applications. J. Instrum. 2016, 11, C03042. [Google Scholar] [CrossRef]
- Bugalho, R.; Francesco, A.D.; Ferramacho, L.; Leong, C.; Niknejad, T.; Oliveira, L.; Rolo, M.; Silva, J.; Silva, R.; Silveira, M.; et al. Experimental characterization of the TOFPET2 ASIC. J. Instrum. 2019, 14, P03029. [Google Scholar] [CrossRef]
- Tavernier, S.; (PETsys Electronics-Medical PET Detectors, S.A., Oeiras, Portugal). Personal communication, 2019.
- Eljen Technology Accessory Products. Available online: https://eljentechnology.com/products/accessories (accessed on 7 November 2020).
- Ritt, S. Design and performance of the 6 GHz waveform digitizing chip DRS4. In Proceedings of the 2008 IEEE Nuclear Science Symposium Conference Record, Dresden, Germany, 19–25 October 2008; pp. 1512–1515. [Google Scholar]
- Kožuljević, A.M. Position Sensitive Gamma Ray Detectors. Master’s Thesis, Faculty of Science, University of Zagreb, Zagreb, Croatia, 2019. [Google Scholar]
Publisher’s Note: MDPI stays neutral with regard to jurisdictional claims in published maps and institutional affiliations. |
© 2020 by the authors. Licensee MDPI, Basel, Switzerland. This article is an open access article distributed under the terms and conditions of the Creative Commons Attribution (CC BY) license (http://creativecommons.org/licenses/by/4.0/).