Article

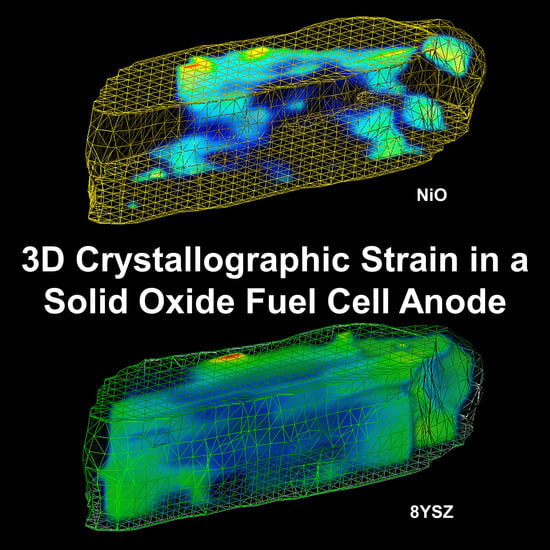
The Detection of Monoclinic Zirconia and Non-Uniform 3D Crystallographic Strain in a Re-Oxidized Ni-YSZ Solid Oxide Fuel Cell Anode

1
The Electrochemical Innovation Lab, Department of Chemical Engineering, UCL, London WC1E 7JE, UK
2
The Faraday Institution, Quad One, Harwell Science and Innovation Campus, Didcot OX11 0RA, UK
3
Finden Limited, Merchant House, 5 East St Helens Street, Abingdon OX14 5EG, UK
4
Department of Chemistry, University College London, 20 Gordon Street, London WC1H 0AJ, UK
5
National Renewable Energy Laboratory, 15013 Denver W Parkway, Golden, CO 80401, USA
6
Research Complex at Harwell, Rutherford Appleton Laboratory, Harwell Science and Innovation Campus, Didcot OX11 0FA, UK
7
ESRF–The European Synchrotron, 71 Avenue des Martyrs, 38000 Grenoble, France
*
Authors to whom correspondence should be addressed.
Crystals 2020, 10(10), 941; https://doi.org/10.3390/cryst10100941
Submission received: 28 September 2020 / Revised: 9 October 2020 / Accepted: 13 October 2020 / Published: 16 October 2020

Abstract

:
The solid oxide fuel cell (SOFC) anode is often composed of nickel (Ni) and yttria-stabilized zirconia (YSZ). The yttria is added in small quantities (e.g., 8 mol %) to maintain the crystallographic structure throughout the operating temperatures (e.g., room-temperature to >800 °C). The YSZ skeleton provides a constraining structural support that inhibits degradation mechanisms such as Ni agglomeration and thermal expansion miss-match between the anode and electrolyte layers. Within this structure, the Ni is deposited in the oxide form and then reduced during start-up; however, exposure to oxygen (e.g., during gasket failure) readily re-oxidizes the Ni back to NiO, impeding electrochemical performance and introducing complex structural stresses. In this work, we correlate lab-based X-ray computed tomography using zone plate focusing optics, with X-ray synchrotron diffraction computed tomography to explore the crystal structure of a partially re-oxidized Ni/NiO-YSZ electrode. These state-of-the-art techniques expose several novel findings: non-isotropic YSZ lattice distributions; the presence of monoclinic zirconia around the oxidation boundary; and metallic strain complications in the presence of variable yttria content. This work provides evidence that the reduction–oxidation processes may destabilize the YSZ structure, producing monoclinic zirconia and microscopic YSZ strain, which has implications upon the electrode’s mechanical integrity and thus lifetime of the SOFC.

Graphical Abstract

1. Introduction

Solid oxide fuel cells (SOFCs) present a viable alternative as a transitional technology away from the conventional carbon-intensive electrical power sources. There are several manufacturing and operational choices for SOFCs including geometry, material, and fuel [1]. However, the electrolyte is generally constructed of either yttria-stabilized zirconia (YSZ) or gadolinium-doped ceria (GDC), and the electrodes are fabricated as porous composites. The anode is often Ni-based (e.g., Ni-YSZ) and the cathode La-Sr-based in the form of lanthanum strontium manganite (e.g., LSM-YSZ) or lanthanum strontium cobalt ferrite (e.g., LSCF-GDC). The anode is of particular interest for research due to its susceptibility to severe degradation that has ramifications up to the cell and stack level [2].
The addition of yttria to the zirconia structure optimizes crystallographic stability while maintaining sufficient ionic conductivity [1] and consequently, the phase dynamics of YSZ have produced significant research interest due to their implications on electrochemical performance [3,4,5]. At the microstructural level, the ceramic plays a vital role in delaying the onset of degradation by providing a constraining mechanical support throughout which the Ni is dispersed. This ceramic “skeleton” impedes Ni agglomeration [6] as well as reducing the thermal expansion miss-match between the anode and electrolyte layers [7]. The Ni metal within the anode is generally deposited as NiO and then reduced during the first operational start-up. However, the reduction process is complex [8] and there have been several reports of structural issues from the stack [9] to the particle level [10]. Once reduced to Ni, the boundary between the Ni, ceramic, and void-space form the triple-phase boundary (or TPB) which is the location of the reaction site. The addition of ceramic material to the anode extends the reaction sites into the anode bulk; the reactions are therefore no longer limited to the anode/electrolyte interface. TPBs where the void space, metal, and ceramic have fully connected pathways for their respective transport processes, i.e., to the gas inlet/outlet, current collectors/bi-polar plates, and cathode, respectively, are termed “active” and therefore contribute to the local current density during operation. Maximizing the volumetric density of these active TPBs improves the electrochemical performance and consequently, degradation mechanisms which reduce the active TPB density, e.g., ceramic–metal particle delamination, metal coarsening, and reaction site isolation/deactivation, are of substantial interest.
Although the addition of ceramic to the electrode has many benefits, the mechanical interactions between the metal and ceramic are multifaceted and localized stress is thought to cause microscopic delamination and has been previously assessed using 3D characterization methods [11,12]. Particularly, X-ray methods have proven highly valuable in the exploration of various materials in 3D [13]. Generally, X-ray computed tomography (CT) methods involve the acquisition of data at many angular increments (while the sample is rotated) that are then reconstructed into a 3D volume using data processing algorithms, e.g., filtered back-protection (FBP). X-ray absorption-contrast computed tomography (CT) employing full-field illumination is the common choice for lab-based characterization [14], however, high-brilliance synchrotron sources permit the analysis of other X-ray interactions, such as diffraction, with higher temporal resolution [15,16]. More recently, the development of advanced acquisition methodologies and apparatus has led to the ability to resolve the SOFC crystallography in 3D and even higher dimensions (e.g., 4D where there are three spatial dimensions plus a fourth dimension of time, or even 5D with the fifth dimension being the chemical information) [17,18].
In this work, we combine the latest state-of-the-art X-ray characterization methods from both lab and synchrotron sources to inspect the partial re-oxidation of a Ni/NiO-YSZ anode. Through refinement of the absorption and diffraction data, we present a new insight into the crystal structure developments as a result of this prominent SOFC degradation process. Re-oxidation of the anode can cause substantial performance implications for SOFCs and insight such as this improves our understanding of the complex mechanisms responsible.

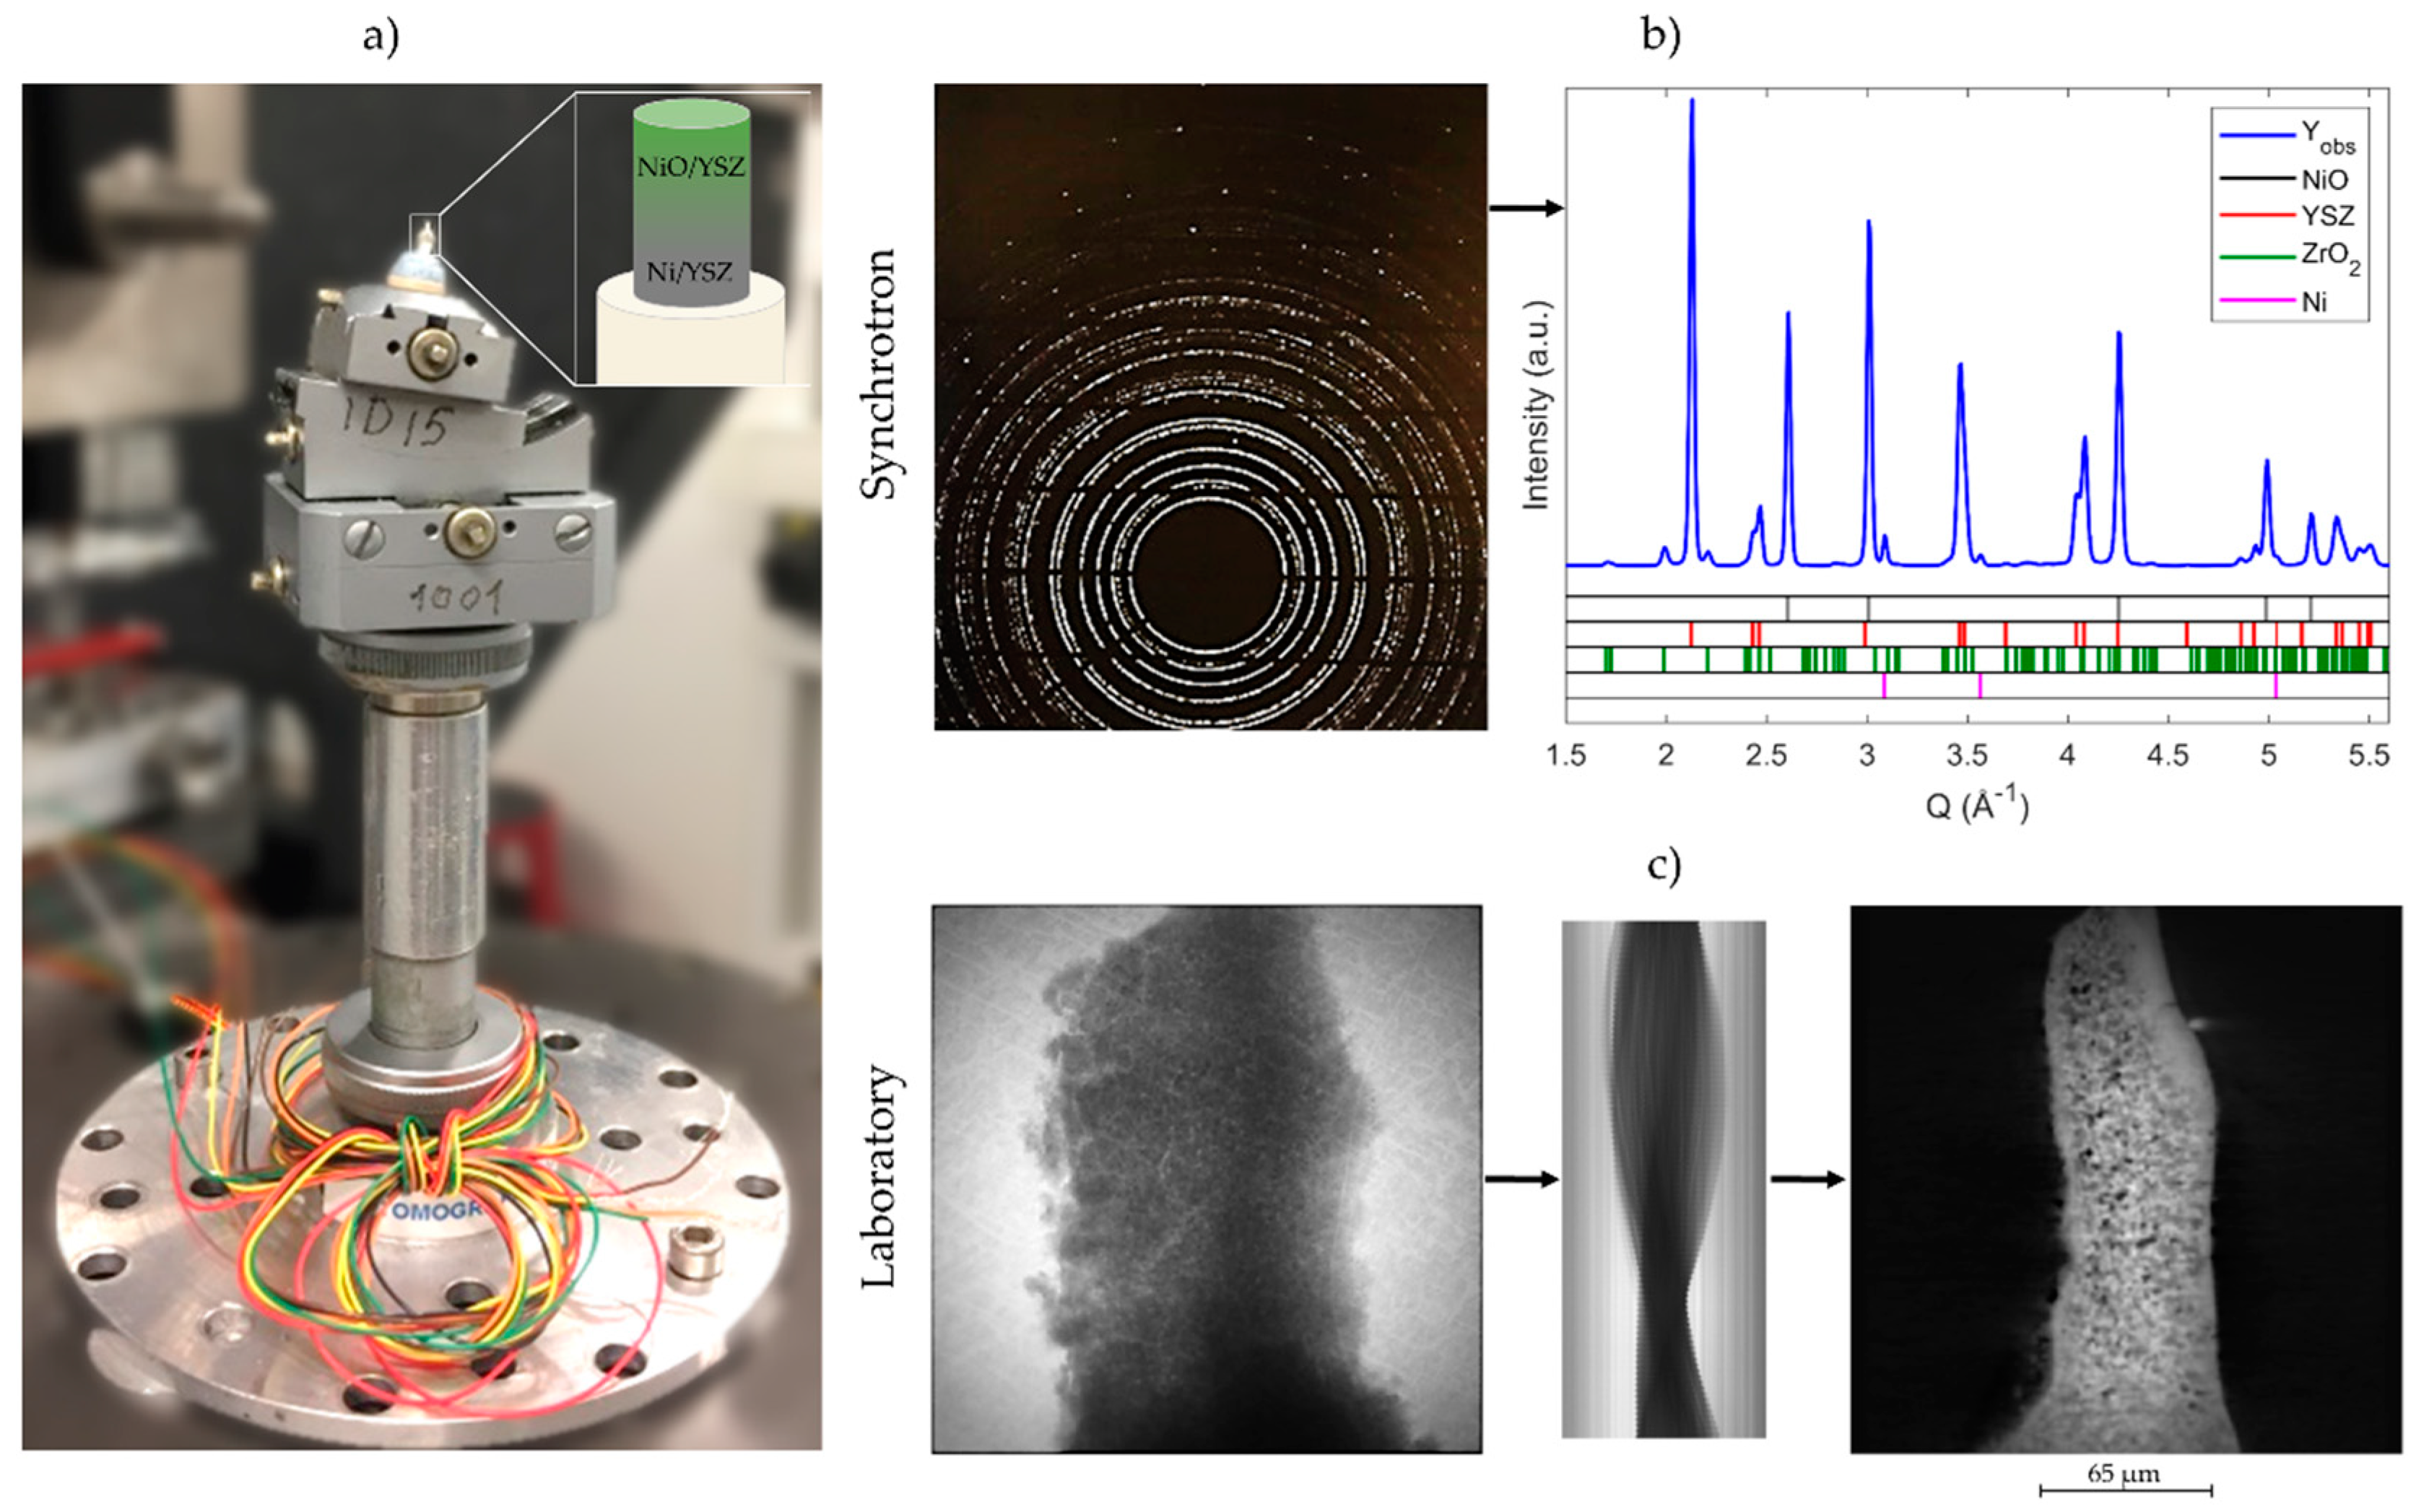
2. Materials and Methods

The NiO-YSZ (i.e., NiO-(Y2O3)0.08(ZrO2)0.92) anode was purchased from a commercial supplier (Fuel Cell Materials, OH, U.S.A.) as an anode-supported half-cell with a thin YSZ electrolyte layer. A small sample was extracted using an A Series/Compact Class 4 Laser Micromachining System (Oxford Lasers, Oxford, UK). The sample was mounted for high-temperature treatments specifically for nano-CT investigations. Details of the sample preparation method can be found in previous work [19]. To emulate real-world application, the SOFC sample was reduced, firstly by being ramped to 600 °C at 5 °C min−1 in N2; then isothermally reduced for 30 min in forming gas (4% H2 in N2); and finally cooled via natural convection under forming gas. The sample then underwent one thermal cycle to mimic an operational start-up: ramp to 750 °C at 20 °C min−1 then cooled via natural convection, all under forming gas. Then, to re-oxidize part of the sample, it was ramped to 350 °C at 10 °C min−1 then cooled via natural convection, all in air.
Lab-based full-field X-ray illumination of the SOFC sample was achieved using a quasi-monochromatic X-ray beam with a characteristic peak of 5.4 keV (Cr-Kα) and focused onto the sample using zone plate optics (Zeiss Xradia 810 Ultra, Carl Zeiss, CA, USA). Acquiring 1101 projections via this transmission X-ray microscopy computed tomography (TXM-CT) through 180° of rotation, each with an exposure time of 60 s, allowed a tomogram to be produced via filtered back-projection (FBP) algorithms, resulting in a 3D volume constructed of isotropic voxels of length 126 nm (“Reconstructor Scout-and-Scan”, Carl Zeiss, CA, USA).
The synchrotron characterization was performed at the ESRF—The European Synchrotron (Grenoble, France)—at the ID15A beamline [20]. XRD measurements were performed using a monochromatic 50 keV (0.2480 Å) X-ray beam, focused to 1 μm using a Kirkpatrick–Baez mirror system. A high-energy photon counting Pilatus3 X CdTe 2 M detector was used to record the diffraction patterns. A 3D-XRD-CT scan was collected containing 10 XRD-CT datasets. Each XRD-CT scan was performed with 75 translation steps covering a 0–180° angular range, in steps of 2.4° (i.e., 75 line scans). The detector calibration was performed using a CeO2 NIST standard. Every 2D diffraction image was converted to a 1D powder diffraction pattern after applying a 10% trimmed mean filter to remove outliers with the nDTomo and pyFAI software packages using a fast GPU processor [21,22,23,24]. The final XRD-CT images (i.e., reconstructed data volume) were reconstructed using the FBP algorithm. XRD line scans were also collected using a 500 nm step size rastered through the thickness of the sample (ca. 350 μm). Detailed information regarding the full profile analysis of the diffraction patterns can be found within the Supplementary Material (Figures S1–S3).
Quantitative full-profile analysis using the Rietveld method was performed for the reconstructed diffraction patterns using the TOPAS software [25], on a voxel by voxel basis. Rietveld analysis was performed using the summed diffraction pattern of each XRD-CT dataset prior to the Rietveld analysis of the XRD-CT data in order to have a good starting model before performing the batch Rietveld analysis (Figures S1–S3). The following structure models were used in the refinements: NiO (ICSD: 9866), Ni (ICSD: 43397), YSZ (ICSD: 90889), and ZrO2 (ICSD: 18190). Apart from the background and the scale factors for all phases, the other parameters refined during the full-profile analysis of the diffraction data were the lattice parameters for all except monoclinic ZrO2 (i.e., for stability as it was a minor phase). The crystallite size and strain were refined once for every phase using the mean pattern from the 3D-XRD-CT dataset in order to yield a more accurate peak shape and then kept constant during the spatially resolved analysis (i.e., for stability issues when analyzing the local diffraction patterns present in the XRD-CT data).
All 3D visualizations were achieved using Avizo Fire software (Avizo, Thermo Fisher Scientific, Waltham, MA, USA). The solid phase (i.e., Ni, NiO and YSZ) was segmented as one from the void phase (i.e., into a binary dataset) via a standard greyscale segmentation of the TXM tomogram. From this, a 3D surface was generated and used as the spatial reference for the corroboration of the XRD-CT reconstruction. See Figure 1 for a visual representation of the sample set-up, acquisition, and X-ray characterization methods and Figure S4 for the corroboration of the lab and synchrotron CT data.

3. Results

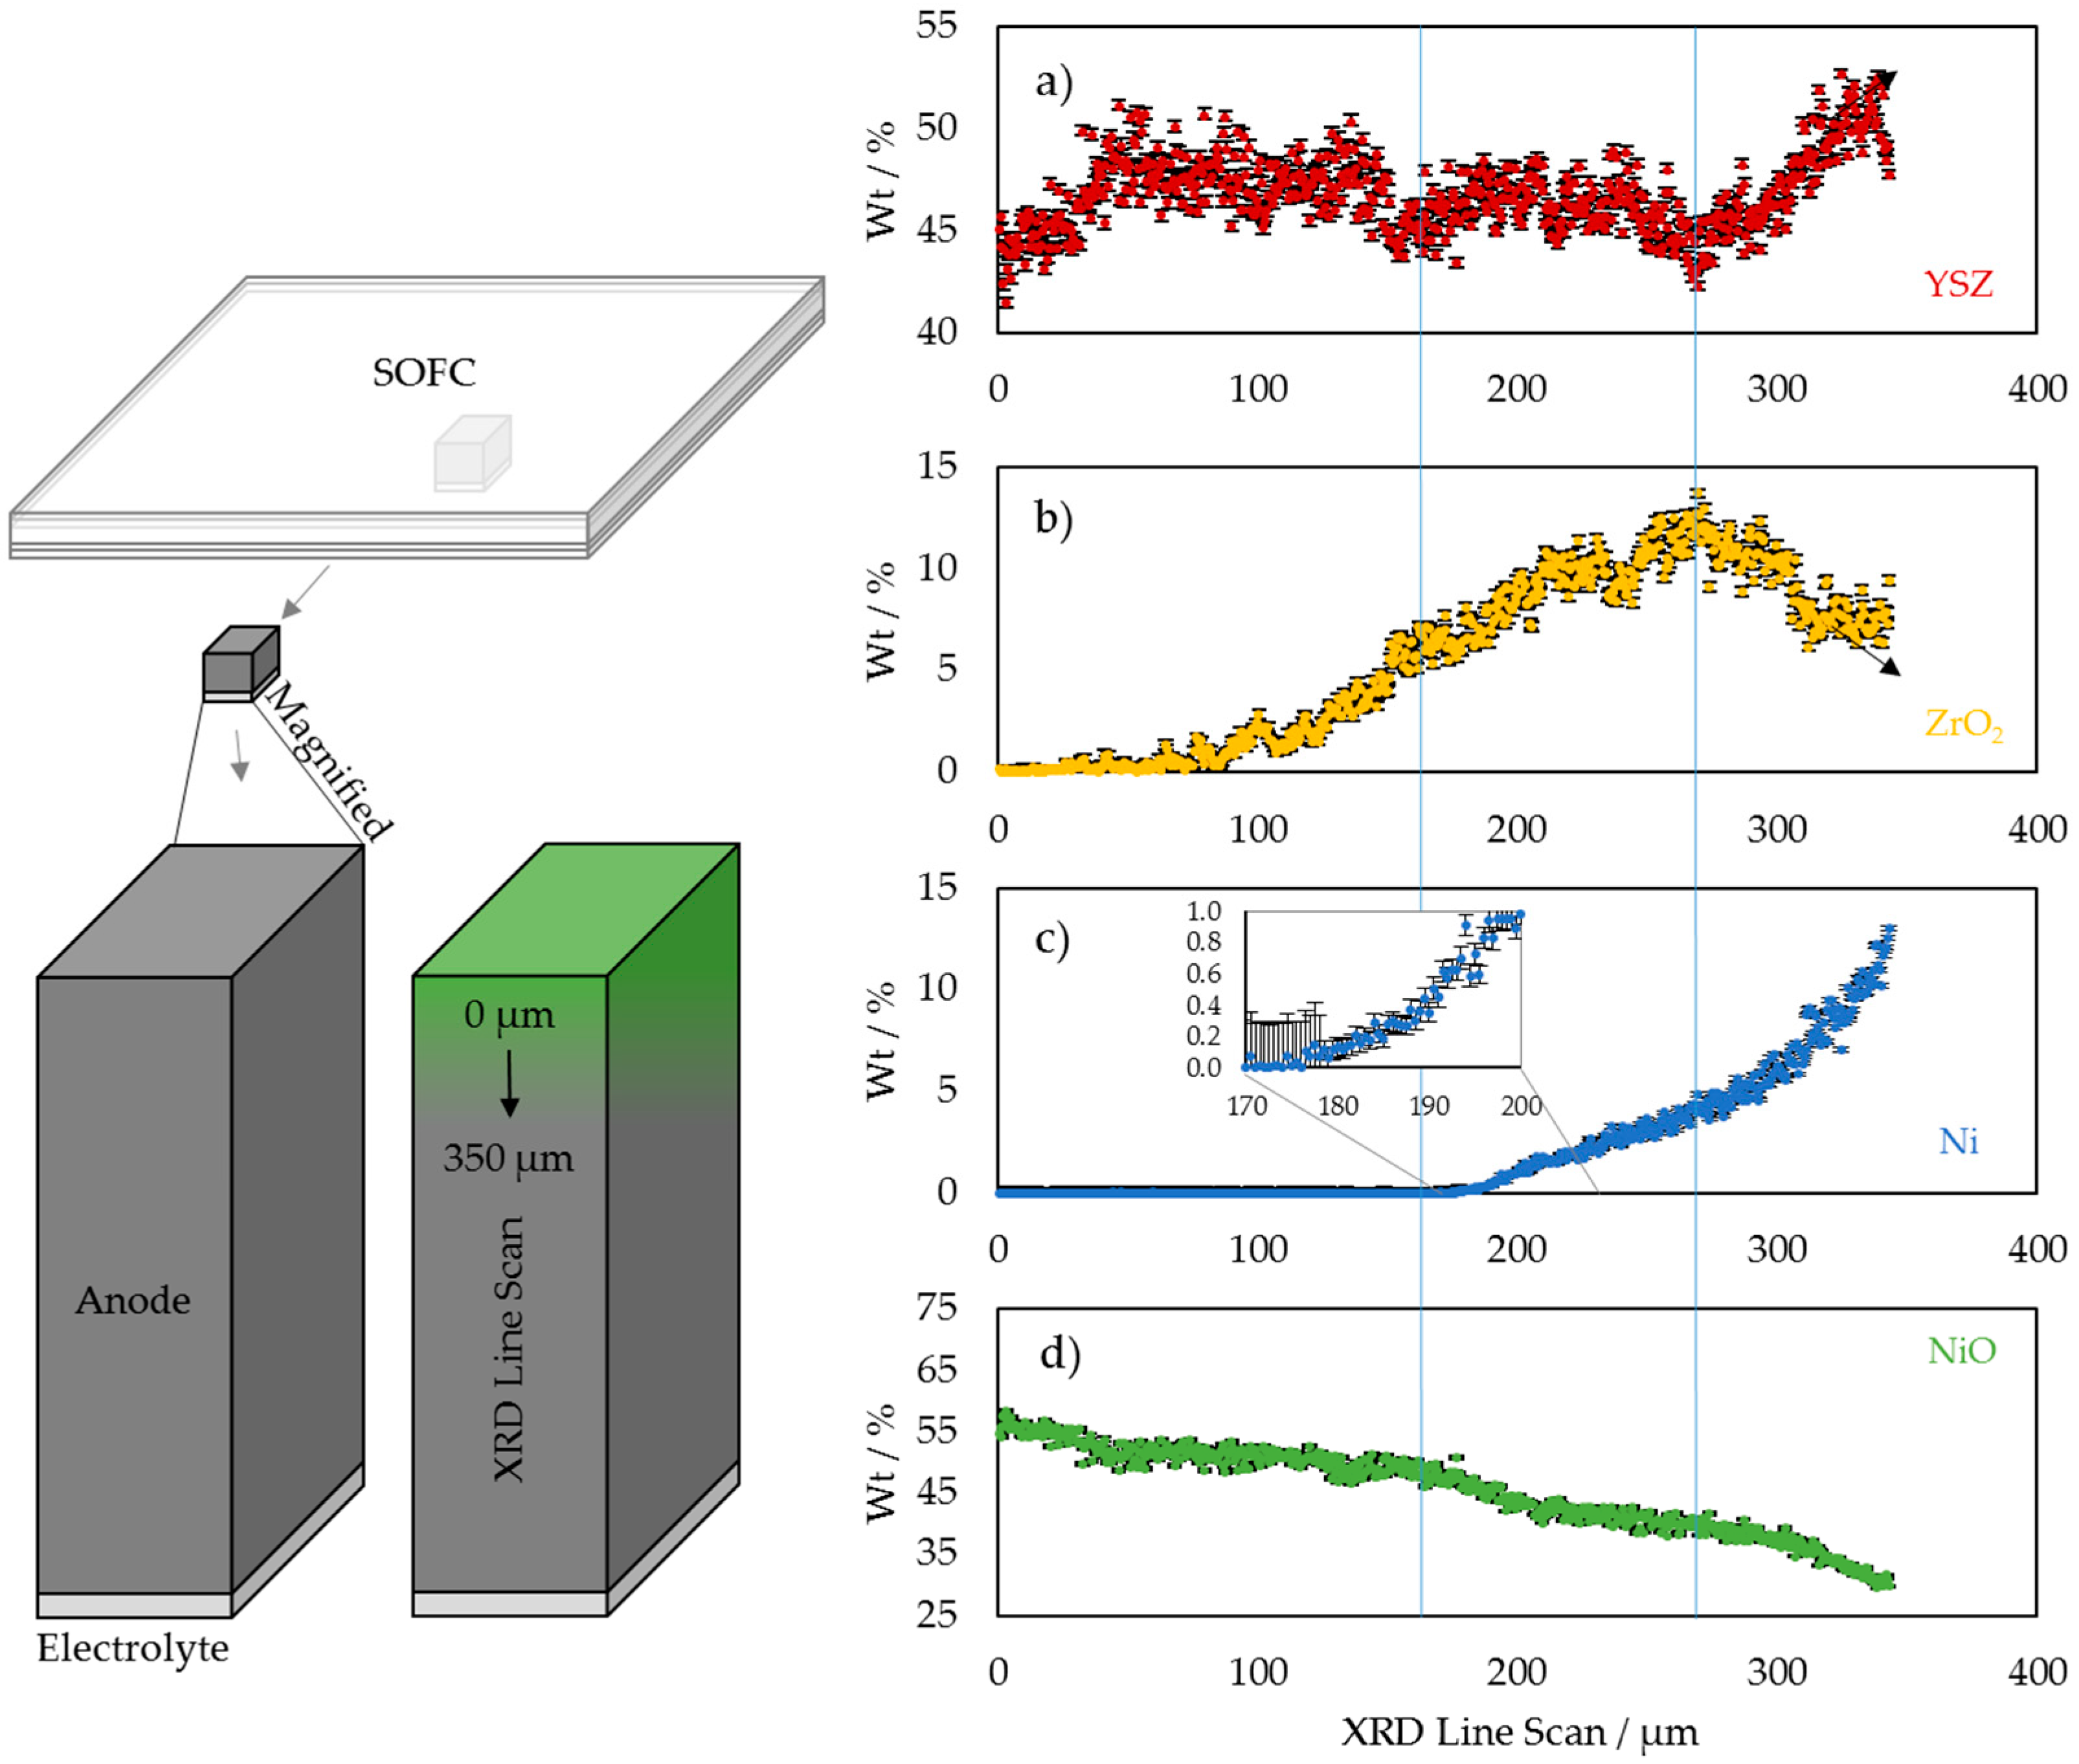
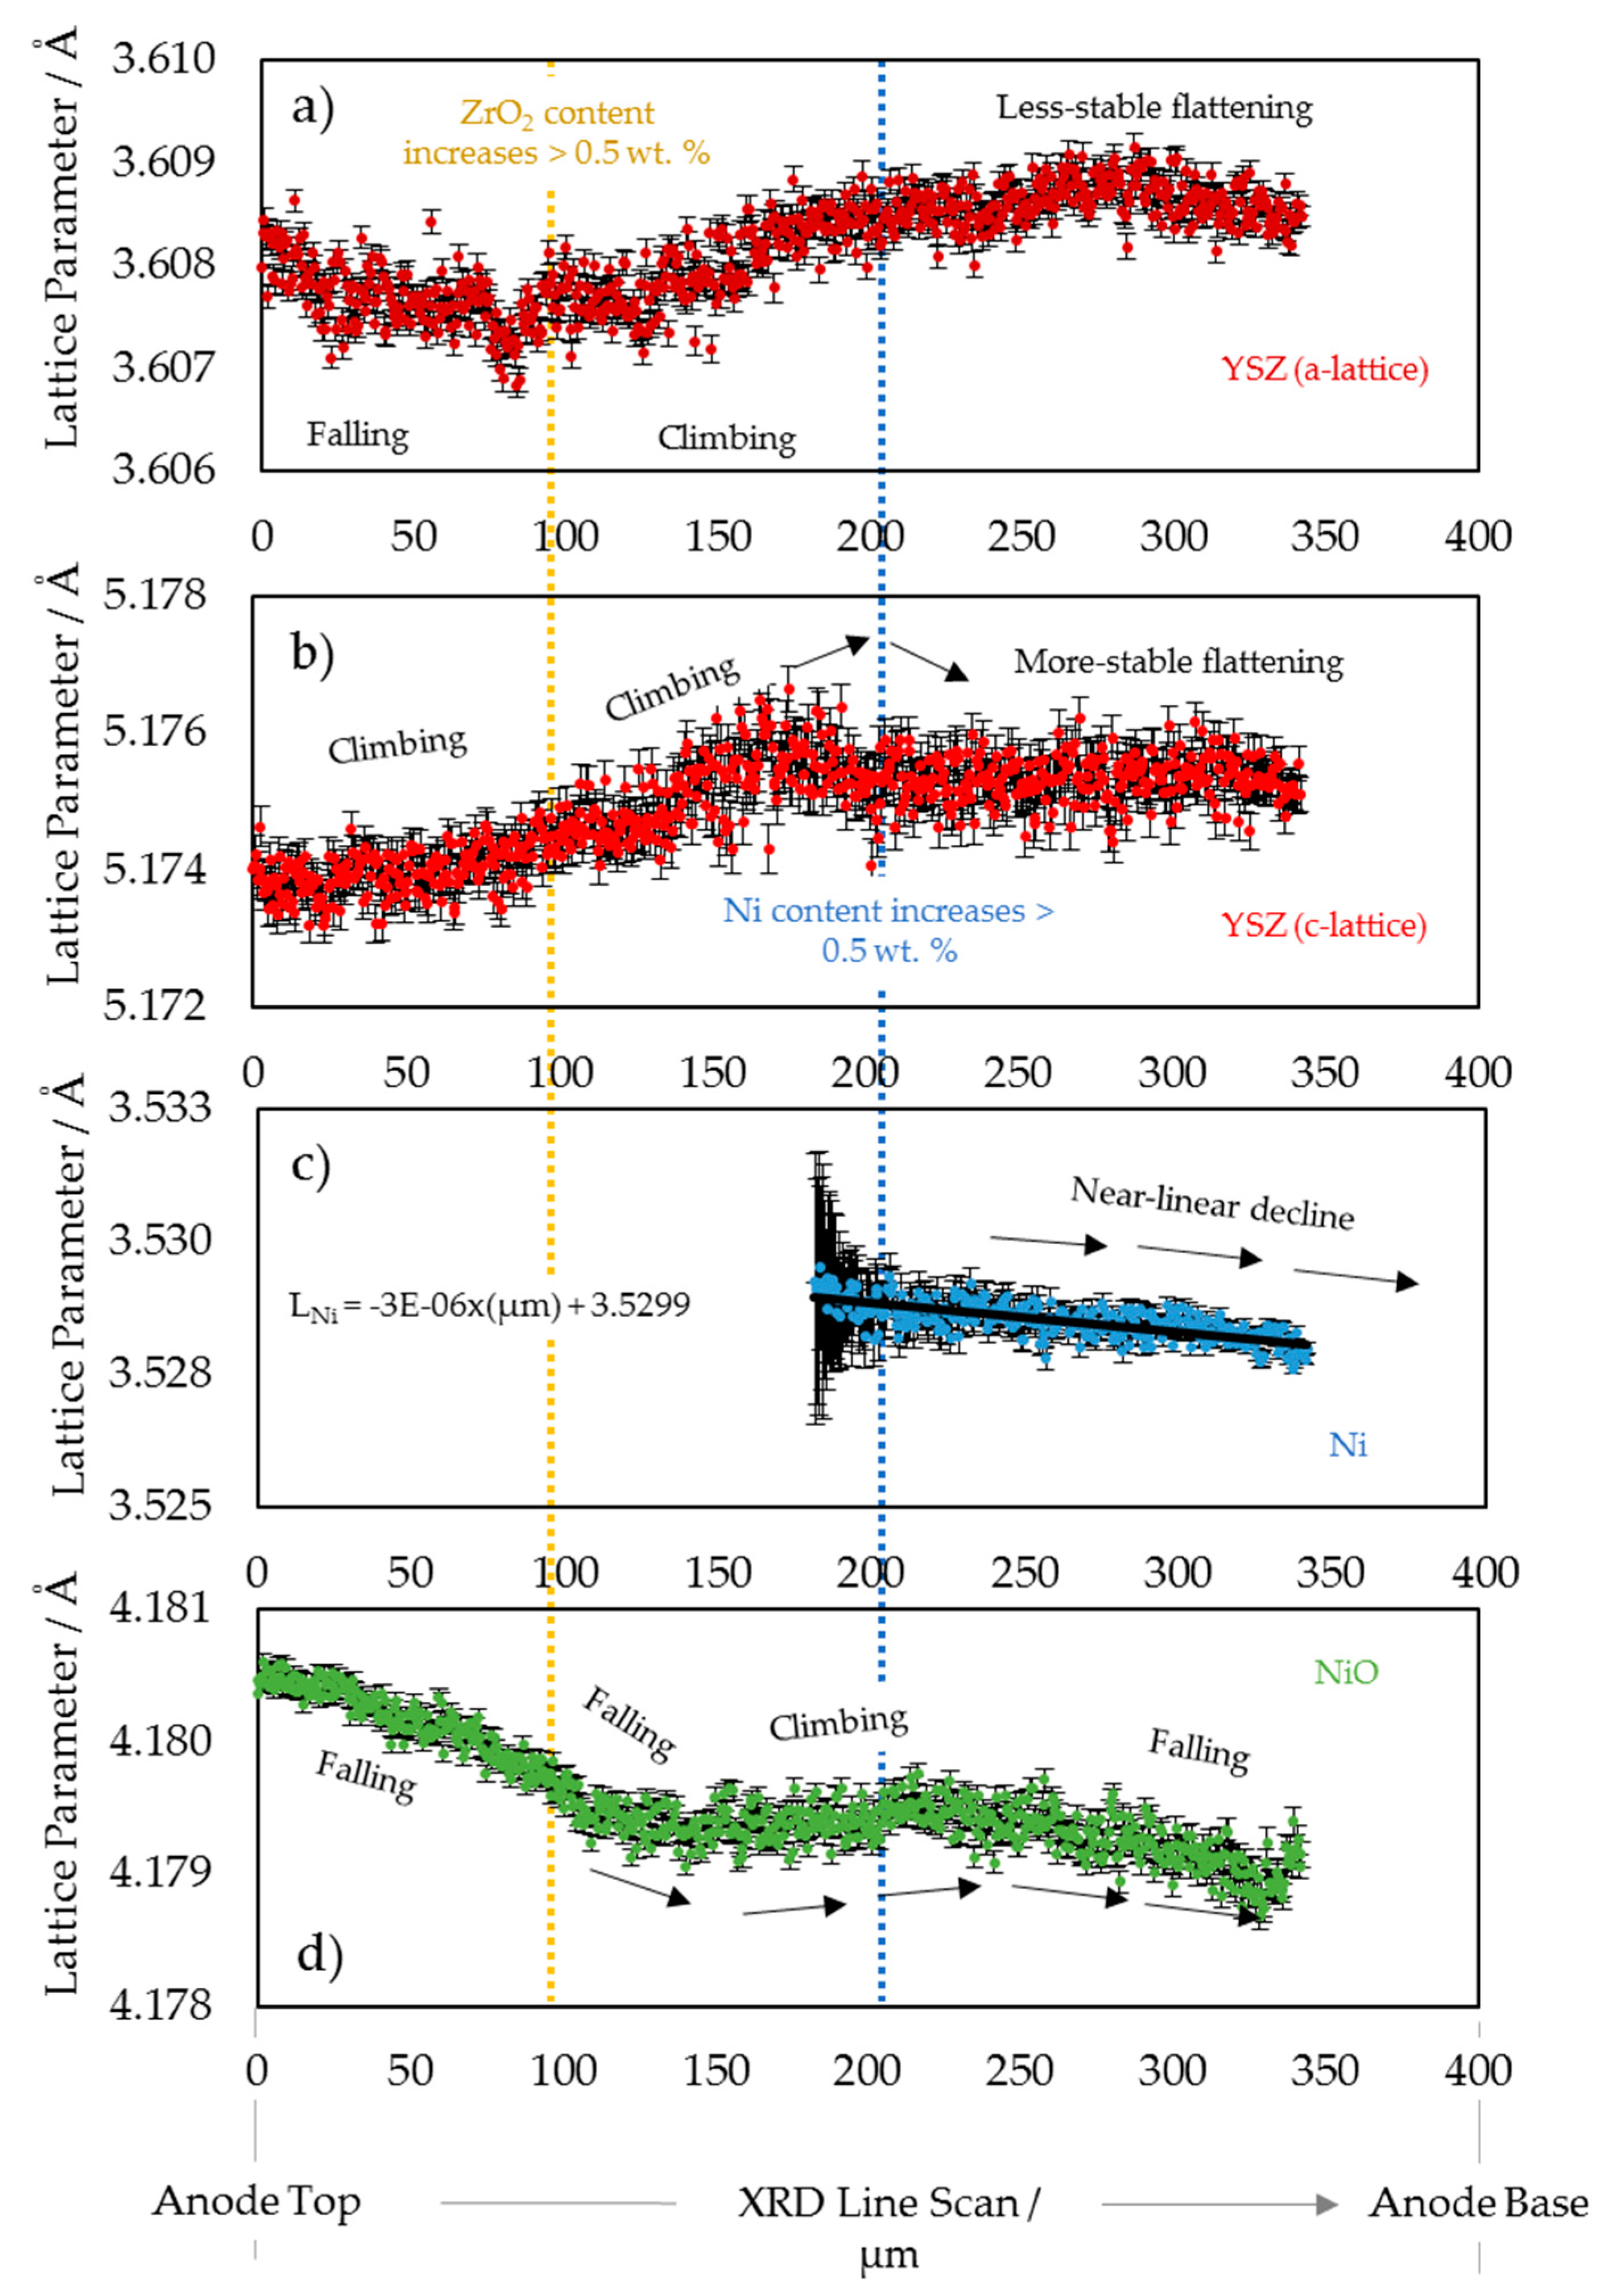
3.1. 2D Crystallography

Figure 2 outlines the XRD line scan analysis. Within the figure, the YSZ (red), ZrO2 (yellow), Ni (blue), and NiO (green) are each presented in terms of composition, calculated from the diffraction data. Particularly interesting variations are observed within the YSZ phase; notable undulations in the YSZ content are observed at the point that Ni is first detectable and also at the peak of the ZrO2 content. The maximum local ZrO2 detected was ca. 12% by weight. This is not an insignificant amount and could contribute to considerable impedance of the ionic conductivity. The presence of zirconia could be a result of manufacturing impurities, however, because the zirconia content correlates with the re-oxidation boundary, it was concluded that the zirconia is present due to degradation rather than manufacturing. Ni was only observed after 160–180 μm, however, the NiO content declines relatively linearly away from the electrode surface, and it is therefore assumed that there may also be very low trace amounts of Ni present closer to the electrode surface.
Figure 3 describes the lattice parameters for the YSZ (red), Ni (blue), and NiO (green). Overlaid upon this figure are two significant points: where the content of ZrO2 (yellow) and Ni (blue) exceed trace levels (i.e., 0.5 wt. %). The introduction of significant ZrO2 amounts triggers a change in the YSZ a-lattice parameter, which was falling until ZrO2 was present and then began to climb. This indicates that the production of monoclinic ZrO2 is not only an issue for ionic conductivity but may also induce localized compression–tension strain within the neighboring YSZ, with potential implications to the mechanical integrity of the ceramic phase as a whole. Moreover, this impact is non-isotropic; the a- and c-lattice parameters for the YSZ phase are not impacted the same in the presence of the ZrO2. Both appear to stabilize after the Ni content rises above trace amounts, further indicating that the non-isotropic compression–tension strain occurs as a result of the metal re-oxidation.

3.2. 3D Crystallography

An XRD-CT scan was conducted on the top of the sample (near the anode surface, see dashed red region in the sample diagram within Figure 4a), and to corroborate the reconstruction, a TXM-CT of the exact same region of interest (RoI) was also acquired (See Figure S4). Within Figure 4, the YSZ and the NiO lattice parameters are presented in 3D from the XRD-CT. Accompanying the 3D images are the lattice parameter histograms. The YSZ lattice parameters present a non-isotropic strain and a heterogeneous distribution. The NiO lattice is less dispersed, which is similar to the 2D line data within Figure 3, whereby the local variations in the NiO lattice parameter were relatively minor.
To explore the heterogeneities further, the YSZ and NiO strain distributions are presented within Figure 5. Raw powders have previously been explored via a similar methodology [26]. The 3D images reveal that the NiO strain is experienced very locally, unlike the YSZ which displays a degree of strain throughout the entire RoI volume. However, the YSZ strain was approximately double on average; similar to the 2D line scans, the strain within the YSZ appears to be far more severe than within the NiO. The implications for the YSZ strain (being the structural support) is that the mechanical integrity of the electrode may be compromised, which could promote a reduction in the active TPB density through particle–particle delamination; this is in addition to the fact that the ionic conductivity may be impeded by the reduction in the yttria content. Crystallographic strain could become the precursor for macroscale degradation in the form of cracking or delamination [27,28,29].

4. Conclusions

It is well known that the re-oxidation of the anode within an SOFC can have significant performance implications due to the lack of electrical conductivity and potentially irreversible structural changes associated with the Ni metal; however, the implications for the ceramic YSZ are often not considered. In this work, we explore the crystallography of a partially re-oxidized SOFC anode that emulates the implications of a failed gasket or gas cross-over event.
The 1D line scans present evidence of monoclinic ZrO2 near the oxidation boundary in non-insignificant amounts (12 wt. %). Moreover, the lattice parameters in this region indicate that the YSZ phase is non-isotropic and possesses heterogeneously distributed strain as a result of the ZrO2 content and the NiO/Ni boundary. The 3D-XRD-CT imaging corroborates these findings by quantitatively describing the distribution of the phases near the electrode surface. Here, the YSZ experiences strain throughout the sample volume that is considerably more severe than within the NiO (approximately double).
To the author’s knowledge, this is the first report of TXM- and XRD-CT to corroborate the crystallography in 3D at such resolutions for an SOFC anode. These findings suggest that the zirconia-based ceramic may undergo substantial degradation during the re-oxidation process, potentially losing the stabilizing yttria and becoming monoclinic. It is a possibility that there is zirconia present within the pristine material as a result of fabrication impurities, however, the zirconia content correlates with the oxidation boundary and thus is expected to be caused by the re-oxidation degradation. This would mean that the ionic conductivity may be impeded and the crystal structure would no longer be stable through the operating temperate range. Moreover, the YSZ that did not lose the yttria demonstrated significant strain that could have implications for the mechanical integrity of the electrode as a whole, potentially promoting the opportunity for macroscopic degradation such as delamination or cracking.
Although time-resolved studies are possible for lower resolutions, spatially resolved information that is obtained at high resolutions (such as within this work) can provide insight that may be lost at larger imaging scales. However, as imaging facilities are developed, e.g., the advent of fourth generation synchrotrons, acquisition times will reduce, improving temporal resolutions and potentially permitting high-resolution in situ and operando experiments. This would also present the opportunity to monitor the dynamics of individual particles, allowing us to confirm at what exact point strain is formed and whether pre-existing stress influences operational structural changes.
The use of state-of-the-art techniques as well as the new insight gained from them within this work will prove valuable in the understanding of SOFC degradation. Ultimately improving our knowledge of which aspects of the materials degrade during specific processes such as gasket failure will aid us in developing mitigation and prevention strategies that will extend SOFC lifetimes and improve their competitiveness within the mass market.

Supplementary Materials

The following are available online at https://www.mdpi.com/2073-4352/10/10/941/s1, Figure S1: Full profile analysis using the Rietveld method for the mean diffraction pattern extracted from the 3D-XRD-CT dataset, Figure S2: Simulated diffraction patterns for NiO, YSZ, ZrO2 and Ni, Figure S3: Composition by weight calculated from XRD, Figure S4: Correlation of transmission X-ray microscopy (TXM) and diffraction computed tomography (XRD-CT).

Author Contributions

Conceptualization, T.M.M.H., A.V.; methodology, all authors; software, A.V.; validation, all authors; formal analysis, T.M.M.H., A.V.; investigation, T.M.M.H., D.P.F., C.T., S.R.D., A.V.; resources, M.D.M., P.R.S.; data curation, T.M.M.H., A.V.; writing—original draft preparation, T.M.M.H., A.V.; writing—review and editing, all authors; visualization, T.M.M.H.; supervision, T.M.M.H., A.V.; project administration, T.M.M.H., A.V.; funding acquisition, P.R.S., D.J.L.B., A.M.B., S.D.M.J. All authors have read and agreed to the published version of the manuscript.

Funding

This work was carried as part of the Faraday Institution (faraday.ac.uk; EP/S003053/1), grant number FIRG001; and Royal Academy for Engineering CiET1718\59 and UK Catalysis Hub EP/R026939/1. Access to the lab-based X-ray instrument was supported through EP/K005030/1.

Acknowledgments

The authors would like to thank the ESRF for their support of the ID15A beamtime.

Conflicts of Interest

The authors declare no conflict of interest.

References

  1. Singhal, S.C.; Kendall, K. (Eds.) High-Temperature Solid Oxide Fuel Cells: Fundamentals, Design and Applications; Elsevier: Oxford, UK, 2003. [Google Scholar]
  2. Khan, M.S.; Lee, S.-B.; Song, R.-H.; Lee, J.-W.; Lim, T.-H.; Park, S.-J. Fundamental mechanisms involved in the degradation of nickel–yttria stabilized zirconia (Ni–YSZ) anode during solid oxide fuel cells operation: A review. Ceram. Int. 2016, 42, 35–48. [Google Scholar] [CrossRef]
  3. Witz, G.; Shklover, V.; Steurer, W.; Bachegowda, S.; Bossmann, H.-P. Phase Evolution in Yttria-Stabilized Zirconia Thermal Barrier Coatings Studied by Rietveld Refinement of X-ray Powder Diffraction Patterns. J. Am. Ceram. Soc. 2007, 90, 2935–2940. [Google Scholar] [CrossRef]
  4. Asadikiya, M.; Sabarou, H.; Chen, M.; Zhong, Y. Phase diagram for a nano-yttria-stabilized zirconia system. RSC Adv. 2016, 6, 17438–17445. [Google Scholar] [CrossRef] [Green Version]
  5. Kondo, H.; Sekino, T.; Kusunose, T.; Nakayama, T.; Yamamoto, Y.; Niihara, K. Phase stability and electrical property of NiO-doped yttria-stabilized zirconia. Mater. Lett. 2003, 57, 1624–1628. [Google Scholar] [CrossRef]
  6. Kishimoto, H.; Suzuki, A.; Shimonosono, T.; Brito, M.E.; Yamaji, K.; Horita, T.; Munakata, F.; Yokokawa, H. Agglomeration behavior of nickel particles on YSZ electrolyte. Solid State Ion. 2012, 225, 65–68. [Google Scholar] [CrossRef]
  7. Heenan, T.M.M.; Lu, X.; Robinson, J.B.; Iacoviello, F.; Brett, D.J.L.; Shearing, P.R. Thermally Driven SOFC Degradation in 4D: Part II. Macroscale. J. Electrochem. Soc. 2018, 165, F932–F941. [Google Scholar] [CrossRef] [Green Version]
  8. Sarantaridis, D.; Atkinson, A. Redox Cycling of Ni-Based Solid Oxide Fuel Cell Anodes: A Review. Fuel Cells 2007, 7, 246–258. [Google Scholar] [CrossRef]
  9. Heenan, T.M.M.; Nabavi, S.A.; Erans, M.; Robinson, J.B.; Kok, M.D.R.; Maier, M.; Brett, D.J.L.; Shearing, P.R.; Manovic, V. The Role of Bi-Polar Plate Design and the Start-up Protocol in the Spatiotemporal Dynamics during Solid Oxide Fuel Cell Anode Reduction. Energies 2020, 13, 3552. [Google Scholar] [CrossRef]
  10. Shearing, P.R.; Bradley, R.; Gelb, J.; Tariq, F.; Withers, P.J.; Brandon, N.J. Exploring microstructural changes associated with oxidation in Ni–YSZ SOFC electrodes using high resolution X-ray computed tomography. Solid State Ion. 2012, 216, 69–72. [Google Scholar] [CrossRef]
  11. Clague, R.; Shearing, P.R.; Lee, P.; Zhang, Z.; Brett, D.J.L.; Marquis, A.; Brandon, N. Stress analysis of solid oxide fuel cell anode microstructure reconstructed from focused ion beam tomography. J. Power Sources 2011, 196, 9018–9021. [Google Scholar] [CrossRef]
  12. Heenan, T.M.M.; Lu, X.; Iacoviello, F.; Robinson, J.B.; Brett, D.J.L.; Shearing, P.R. Thermally Driven SOFC Degradation in 4D: Part I. Microscale. J. Electrochem. Soc. 2018, 165, F921–F931. [Google Scholar] [CrossRef] [Green Version]
  13. Stock, S. X-ray microtomography of materials. Int. Mater. Rev. 1999, 44, 141–164. [Google Scholar] [CrossRef]
  14. Maire, É.; Withers, P.J. Quantitative X-ray tomography. Int. Mater. Rev. 2013, 59, 1–43. [Google Scholar] [CrossRef] [Green Version]
  15. Villanova, J.; Sicardy, O.; Fortunier, R.; Micha, J.S.; Bleuet, P. X-ray Diffraction Determination of Macro and Micro Stresses in SOFC Electrolyte and Evolution with Redox Cycling of the Anode. Mater. Sci. Forum 2011, 681, 25–30. [Google Scholar] [CrossRef]
  16. Sanchez, D.F.; Villanova, J.; Laurencin, J.; Micha, J.-S.; Montani, A.; Gergaud, P.; Bleuet, P. X-ray micro Laue diffraction tomography analysis of a solid oxide fuel cell. J. Appl. Crystallogr. 2015, 48, 357–364. [Google Scholar] [CrossRef] [Green Version]
  17. Li, T.; Heenan, T.M.M.; Rabuni, M.F.; Wang, B.; Farandos, N.M.; Kelsall, G.H.; Matras, D.; Tan, C.; Lu, X.; Jacques, S.D.M.; et al. Design of next-generation ceramic fuel cells and real-time characterization with synchrotron X-ray diffraction computed tomography. Nat. Commun. 2019, 10, 1497. [Google Scholar] [CrossRef]
  18. Vamvakeros, A.; Jacques, S.D.M.; Di Michiel, M.; Matras, D.; Middelkoop, V.; Ismagilov, I.Z.; Matus, E.V.; Kuznetsov, V.V.; Drnec, J.; Senecal, P.; et al. 5D operando tomographic diffraction imaging of a catalyst bed. Nat. Commun. 2018, 9, 4751. [Google Scholar] [CrossRef] [Green Version]
  19. Heenan, T.M.M.; Finegan, D.P.; Tjaden, B.; Lu, X.; Iacoviello, F.; Millichamp, J.; Brett, D.; Shearing, P.R. 4D nano-tomography of electrochemical energy devices using lab-based X-ray imaging. Nano Energy 2018, 47, 556–565. [Google Scholar] [CrossRef]
  20. Vaughan, G.; Baker, R.; Barret, R.; Bonnefoy, J.; Buslaps, T.; Checchia, S.; Duran, D.; Fihman, F.; Got, P.; Kieffer, J.; et al. ID15A at the ESRF—A beamline for high speed operando X-ray diffraction, diffraction tomography and total scattering. J. Synchrotron Radiat. 2020, 27, 515–528. [Google Scholar] [CrossRef]
  21. Ashiotis, G.; Deschildre, A.; Nawaz, Z.; Wright, J.P.; Karkoulis, D.; Picca, F.E.; Kieffer, J. The fast azimuthal integration Python library:pyFAI. J. Appl. Crystallogr. 2015, 48, 510–519. [Google Scholar] [CrossRef]
  22. Vamvakeros, A.; Jacques, S.D.; Di Michiel, M.; Middelkoop, V.; Egan, C.K.; Cernik, R.; Beale, A.M. Removing multiple outliers and single-crystal artefacts from X-ray diffraction computed tomography data. J. Appl. Crystallogr. 2015, 48, 1943–1955. [Google Scholar] [CrossRef]
  23. Kieffer, J.; Petitdemange, S.; Vincent, T. Real-time diffraction computed tomography data reduction. J. Synchrotron Radiat. 2018, 25, 612–617. [Google Scholar] [CrossRef] [PubMed]
  24. Vamvakeros, A. nDTomo Software Suite; Github: San Francisco, CA, USA, 2018. [Google Scholar]
  25. Coelho, A.A. TOPASandTOPAS-Academic: An optimization program integrating computer algebra and crystallographic objects written in C++. J. Appl. Crystallogr. 2018, 51, 210–218. [Google Scholar] [CrossRef] [Green Version]
  26. Heenan, T.M.M.; Robinson, J.B.; Lu, X.; Tjaden, B.; Cervellino, A.; Bailey, J.J.; Brett, D.J.L.; Shearing, P.R. Understanding the thermo-mechanical behaviour of solid oxide fuel cell anodes using synchrotron X-ray diffraction. Solid State Ion. 2018, 314, 156–164. [Google Scholar] [CrossRef] [Green Version]
  27. Malzbender, J.; Steinbrech, R. Advanced measurement techniques to characterize thermo-mechanical aspects of solid oxide fuel cells. J. Power Sources 2007, 173, 60–67. [Google Scholar] [CrossRef]
  28. Sarantaridis, D.; Rudkin, R.A.; Atkinson, A. On the Redox Cycling of Anode-Supported SOFCs: Mechanical Properties and Damage Mechanisms. ECS Trans. 2019, 7, 1491–1499. [Google Scholar] [CrossRef]
  29. Hatae, T.; Matsuzaki, Y.; Yamashita, S.; Yamazaki, Y. Destruction Modes of Anode-Supported SOFC Caused by Degrees of Electrochemical Oxidation in Redox Cycle. J. Electrochem. Soc. 2010, 157, B650–B654. [Google Scholar] [CrossRef]
Figure 1. X-ray analysis of the partially oxidized solid oxide fuel cell (SOFC) anode sample. (a) The SOFC sample; (b) synchrotron method XRD and XRD-CT, from diffraction ring to integrated pattern; (c) laboratory method nano-CT, from radiograph to reconstructed ortho-slice.
Crystals 10 00941 g001
Figure 2. Crystallographic analysis via synchrotron XRD line scans. (a) YSZ (red), (b) ZrO2 (yellow), (c) Ni (blue), and (d) NiO (green).
Crystals 10 00941 g002
Figure 3. Lattice parameters for the (a) YSZ a-lattice (dark red), (b) YSZ c-lattice (light red), (c) Ni lattice (blue), and (d) NiO lattice (green). The data are reported with error bars (black). The introduction of notable amounts (i.e., >0.5 wt. %) of ZrO2 (yellow) and Ni (blue) is indicated with dashed vertical lines.
Crystals 10 00941 g003
Figure 4. Data on the lattice parameters for (a) YSZ a-lattice, (b) YSZ c-lattice, and (c) NiO lattice. The 3D lattice parameter maps are enclosed by an exoskeleton (yellow mesh) that was generated using correlative lab-based TXM data. The 3D volumes are accompanied by lattice parameter histograms. The dashed red line within the diagram of the SOFC sample indicates the region that was imaged.
Crystals 10 00941 g004
Figure 5. Crystallographic strain mapped in 3D using synchrotron XRD-CT. (a) YSZ and (b) NiO strain presented as a strain histogram and an accompanying 3D distribution.
Crystals 10 00941 g005
Publisher’s Note: MDPI stays neutral with regard to jurisdictional claims in published maps and institutional affiliations.

