Article

Calcium Phosphate Nanoparticle Precipitation by a Continuous Flow Process: A Design of Experiment Approach

1
Institute of Science and Technology for Ceramics (ISTEC), National Research Council (CNR), Via Granarolo 64, 48018 Faenza, Italy
2
Fin-Ceramica Faenza SPA, Via Granarolo 177/3, 48018 Faenza, Italy
3
Food and Drug Department, University of Parma, Parco Area delle Scienze 27/A, 43124 Parma, Italy
4
Plumestars srl, Strada Inzani 1, 43125 Parma, Italy
5
Humanitas Clinical and Research Center, IRCCS, 20089 Rozzano, Italy
6
Institute of Genetic and Biomedical Research (IRGB)-UOS, National Research Council (CNR), 20090 Milan, Italy
*
Authors to whom correspondence should be addressed.
These authors contributed equally to this work.
Crystals 2020, 10(10), 953; https://doi.org/10.3390/cryst10100953
Submission received: 21 September 2020 / Revised: 15 October 2020 / Accepted: 16 October 2020 / Published: 19 October 2020

Abstract

:
Calcium phosphate nanoparticles (CaP NPs) are an efficient class of nanomaterials mainly used for biomedical applications but also very promising in other sectors such as cosmetics, catalysis, water remediation, and agriculture. Unfortunately, as in the case of other nanomaterials, their wide application is hindered by the difficulty to control size, morphology, purity and degree of particle aggregation in the translation from laboratory to industrial scale production that is usually carried out in batch or semi-batch systems. In this regard, the use of continuous flow synthesis can help to solve this problem, providing more homogenous reaction conditions and highly reproducible synthesis. In this paper, we have studied with a design of experiment approach the precipitation of citrate functionalized CaP NPs aided by sonication using a continuous flow wet chemical precipitation, and the effect of some of the most relevant process factors (i.e., reactant flow rate, sonication amplitude, and maturation time) on the physico-chemical properties of the NPs were evaluated. From the statistical data analysis, we have found that CaP NP dimensions are influenced by the reactor flow rate, while the crystalline domain dimensions and product purity are influenced by the maturation process. This work provides a deeper understanding of the relationships between reaction process factors and CaP NP properties, and is a relevant contribution for the scale-up production of CaP NPs for nanomedical or other applications.

Graphical Abstract

1. Introduction

Many domains of applied science and technology, especially health, energy, and environment, are facing an ever-growing demand for highly efficient materials. In this context, nanomaterials have emerged as a very attractive solution, because of their unique features and properties related to their small dimension, not shared by their bulk counterparts [1]. Indeed, nanomaterials are strongly impacting very different sectors and have been recently used for varies applications, such as diagnostic and therapeutic tools, smart fertilizers, energy storage units, or anti-pollution devices [2,3,4,5].
Calcium phosphate nanoparticles (CaP NPs) are one of the most investigated ceramic nanomaterials. Being chemically similar to the mineral phase of bone and teeth, CaP NPs have been mainly considered for biomedical use because of their excellent biological properties [6,7,8,9]. One of their main applications has been in hard tissues substitution and regeneration, but nowadays, they are also studied for drug and gene delivery, vaccination, imaging, and for the treatment of tumors, autoimmune and even cardiovascular diseases [10,11,12,13,14,15,16]. In addition, CaP NPs were recently advocated as promising nanomaterials for cosmetics, catalysis, water remediation, and agriculture [17,18,19,20].
Nevertheless, like many other nanomaterials, the wide application of CaP NPs is hindered by the low replicability and technical problems of their production process. The main challenge lies in the translation from laboratory to industrial scale production, well exemplified by the difficulties to control size, morphology, purity and degree of particle aggregation in order to achieve products with consistent specifications. When it comes to the large-scale synthesis of NPs with high-quality criteria for biomedical purposes, this challenge is even more critical as even small differences in stoichiometry, morphology or size can dramatically affect NP biological behavior.
Many methods have been studied to date for the large-scale production of CaP NPs, such as mechanochemical [21], sol–gel [22], chemical precipitation [23], sonochemical [24], and hydrothermal [25]. Wet chemical precipitation is one of the most widely applied methods for CaP NP synthesis due to the use of low-cost equipment and its ease of implementation [26]. However, chemical precipitation is usually carried out in batch or semi-batch systems, which provide limited amounts of material and require long reaction times. Moreover, batch precipitation reactions could yield NPs with a broad size distribution [27]. This is due to the rapid nucleation and growth of particles during precipitation generated by high levels of supersaturation combined with the low mixing efficiency of batch reactors. Indeed, insufficient mixing leads to a non-uniform distribution of supersaturation that produces nuclei with different size and tendency to aggregate, thus affecting particle size distribution [28].
A possible solution to these problems is the synthesis of CaP NPs by the constant composition method or the continuous flow precipitation. The constant composition method, developed by Nancollas et al., has the advantage of precisely regulate the conditions of supersaturation, thus allowing one to control the nature of precipitating solid during the whole process [29]. However, this method has the great disadvantage of not being suitable for industrial production because it requires a very low level of supersaturation that leads to limited product yield [30]. On the other hand, the continuous flow precipitation, where reactants are continuously mixed together and the precipitated NPs are quickly collected and removed from the reactor, can provide short reactants residence time, homogenous reaction conditions and thereby a more reproducible synthesis; moreover, differently from the constant composition method, it is suitable for scale up production of CaP NPs [31,32]. Furthermore, the use of continuous flow reactors enables an optimal use of reactants, solvents, energy, and space, allowing the optimization of the synthesis yield while minimizing waste [31]. On the other hand, the setup of chemical precipitation by continuous flow synthesis is more complicated than in batch, since all the process parameters usually are interconnected. This is probably the reason why, to date, only few papers on the continuous flow production of CaP NPs are reported in the literature. These works were collected and analyzed in detail by Latocha et al., [31] who concluded that, although these processes are complex and require thorough optimization, they are very promising for the industrial production of CaP NPs for biomedical application.
All the production processes, especially the continuous flow ones, are influenced by many parameters having a complex impact on the process output. Therefore, it is important to identify how a single factor or a combination of factors influences the process and the chemico-physical properties of the final material. This can be investigated from a statistical point of view thanks to the Design of Experiment (DoE) approach, where the influence of multiple parameters can be tested simultaneously [33].
Therefore, the main aim of this work is the study of a novel, simple and scalable synthesis of CaP NPs by wet chemical precipitation through a continuous flow process. In particular, we focused our efforts on the synthesis of citrate-functionalized CaP NPs, whose efficacy to deliver therapeutic molecules to the hearth was already demonstrated in other works [10,11]. A tubular flow-through reactor is immersed in an ultrasonic bath was set, where calcium and phosphate precursors are continuously mixed for CaP NPs precipitation. The formation of NPs was aided by sonication because it could improve the homogenization of reagents, reduce particle size and polydispersity, and avoid reactor tube clogging [34,35]. A DoE strategy was carried out to rationalize the study and optimize the number of experimental variables. The physical–chemical properties (size, surface charge, crystallinity, and composition) of the obtained CaP NPs have been thoroughly characterized, and the DoE was used to investigate the effect of the most relevant factors of the continuous flow process (i.e., reactants flow rate, sonication amplitude, and maturation time) on them. In addition, the physical–chemical properties of CaP NPs prepared by continuous flow precipitation were compared to the properties of CaP NPs prepared by batch precipitation with the same precursor reagents.

2. Materials and Methods

2.1. Materials

Sodium citrate tribasic dihydrate (Na3(C6H5O7)∙2H2O, ≥99.0% pure, hereafter named Na3(Cit)), sodium phosphate dibasic dihydrate (Na2HPO4∙2H2O, ≥99.0% pure), sodium hydroxide (NaOH, ≥98.0% pure), and calcium chloride dihydrate (CaCl2∙2H2O, ≥99.0% pure) were supplied by Sigma Aldrich (St. Luis, MO, USA). All the solutions were prepared with ultrapure water (18.2 MΩ × cm, 25 °C, Barnstead Nanopure™, Thermo Scientific, Waltham, MA, USA).

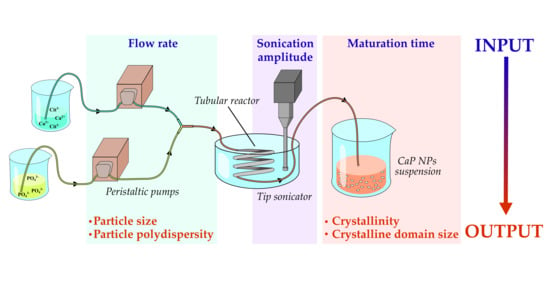
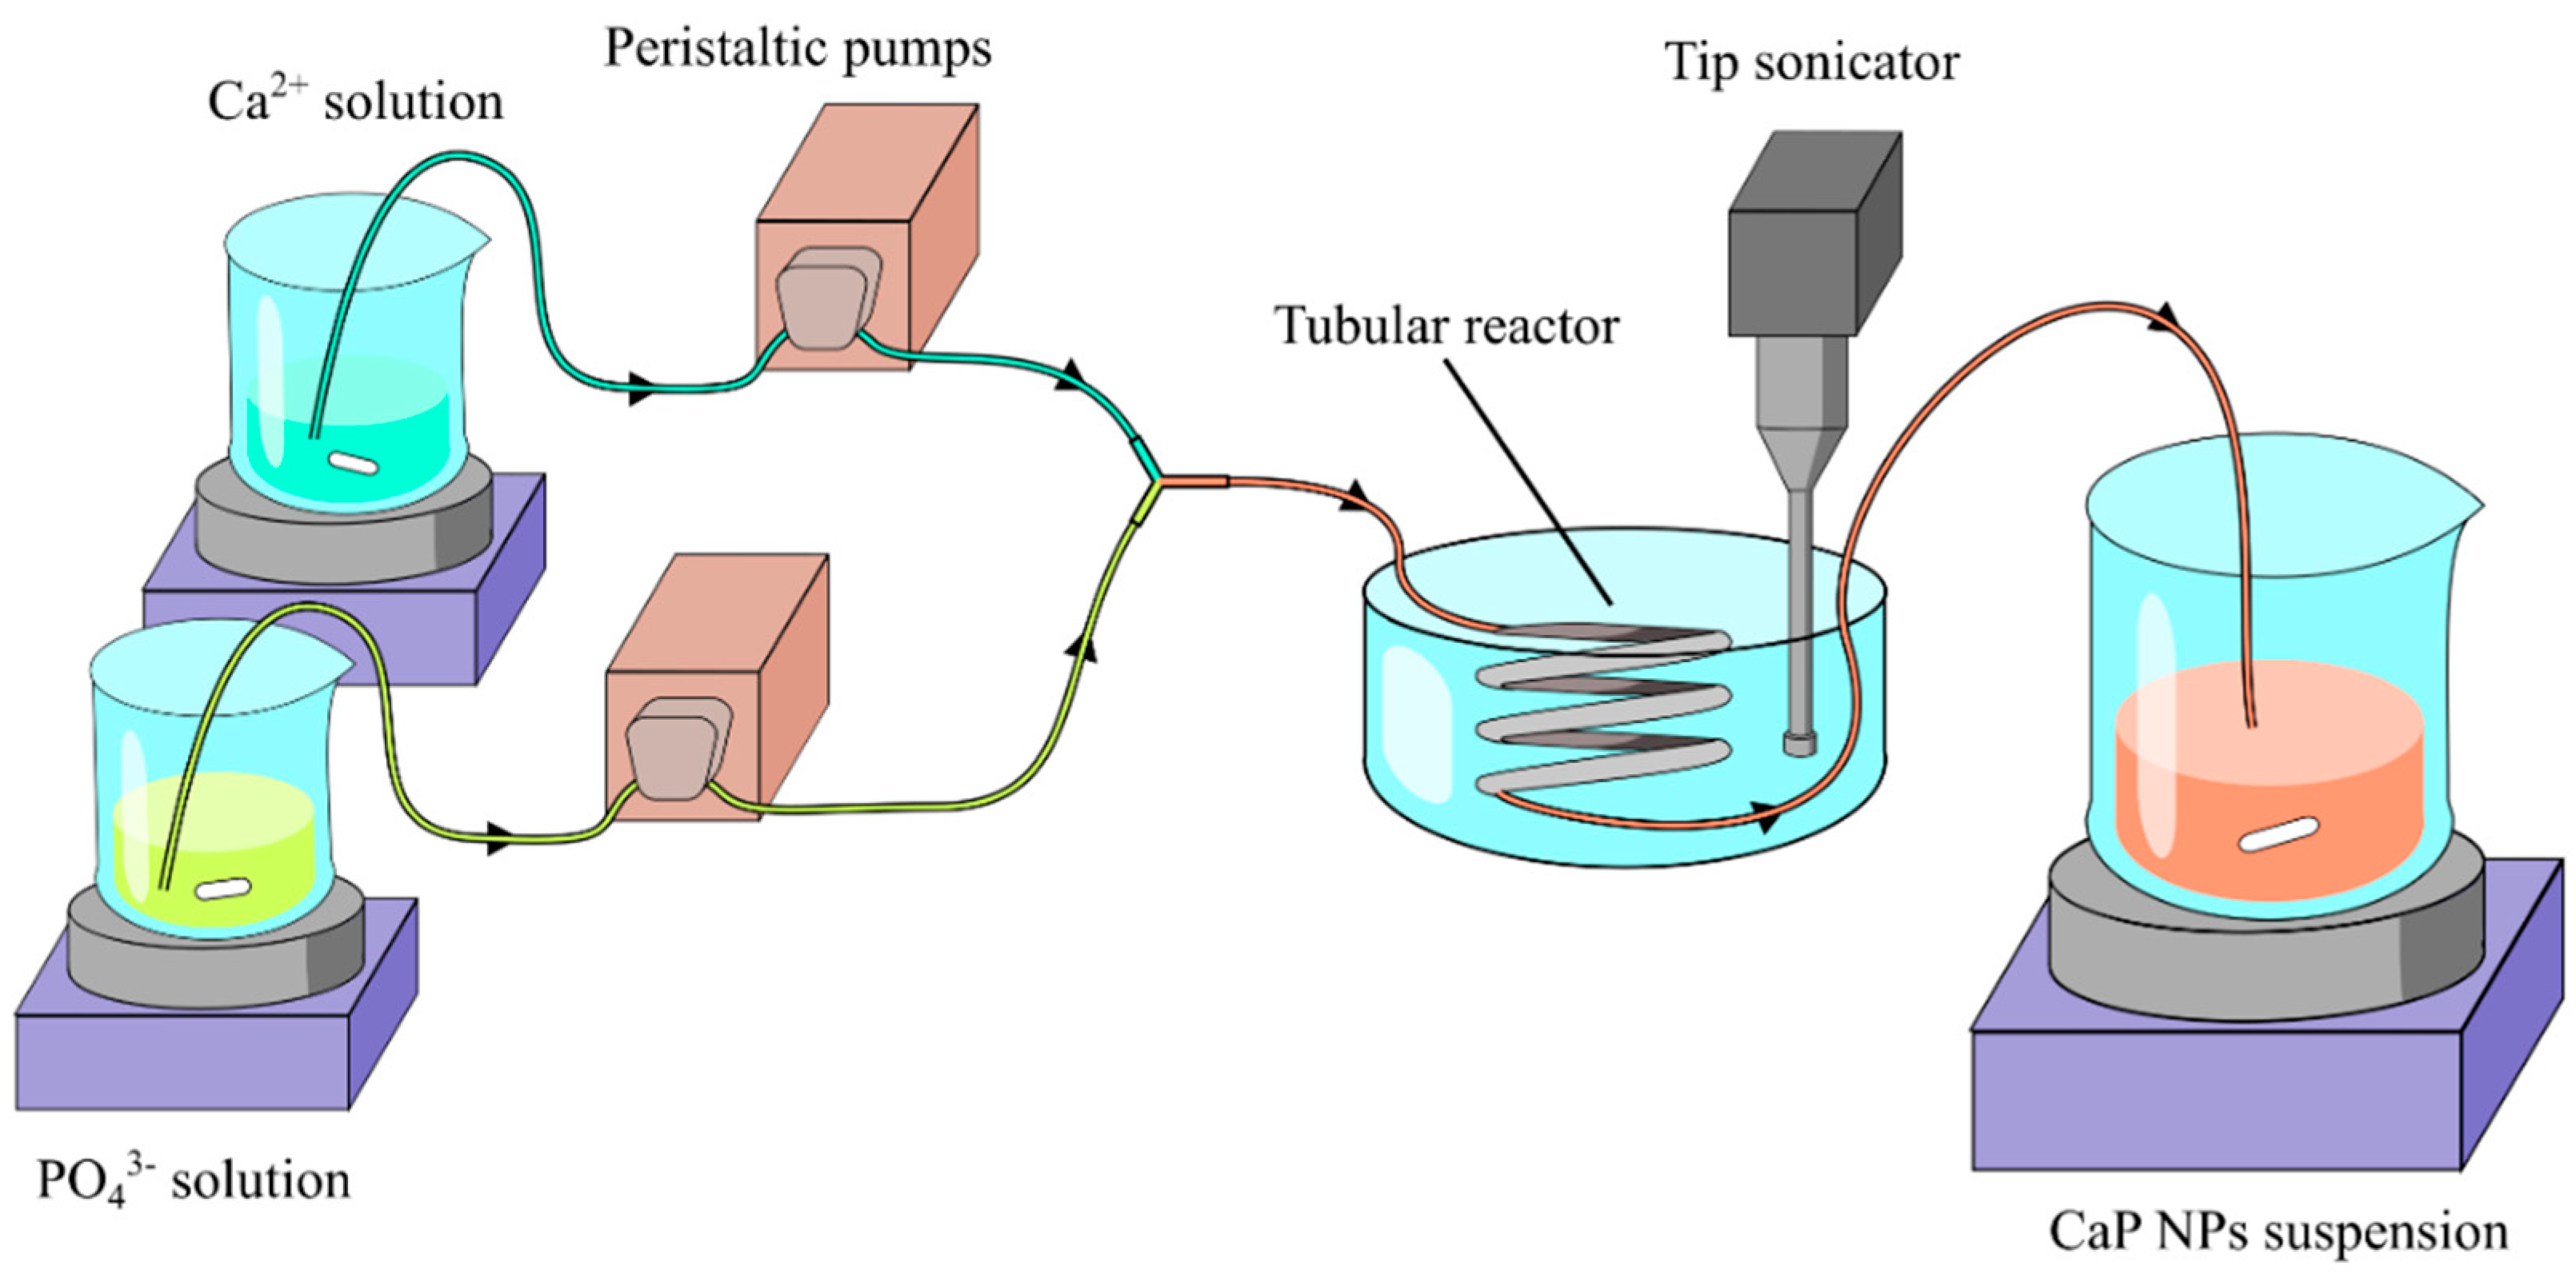
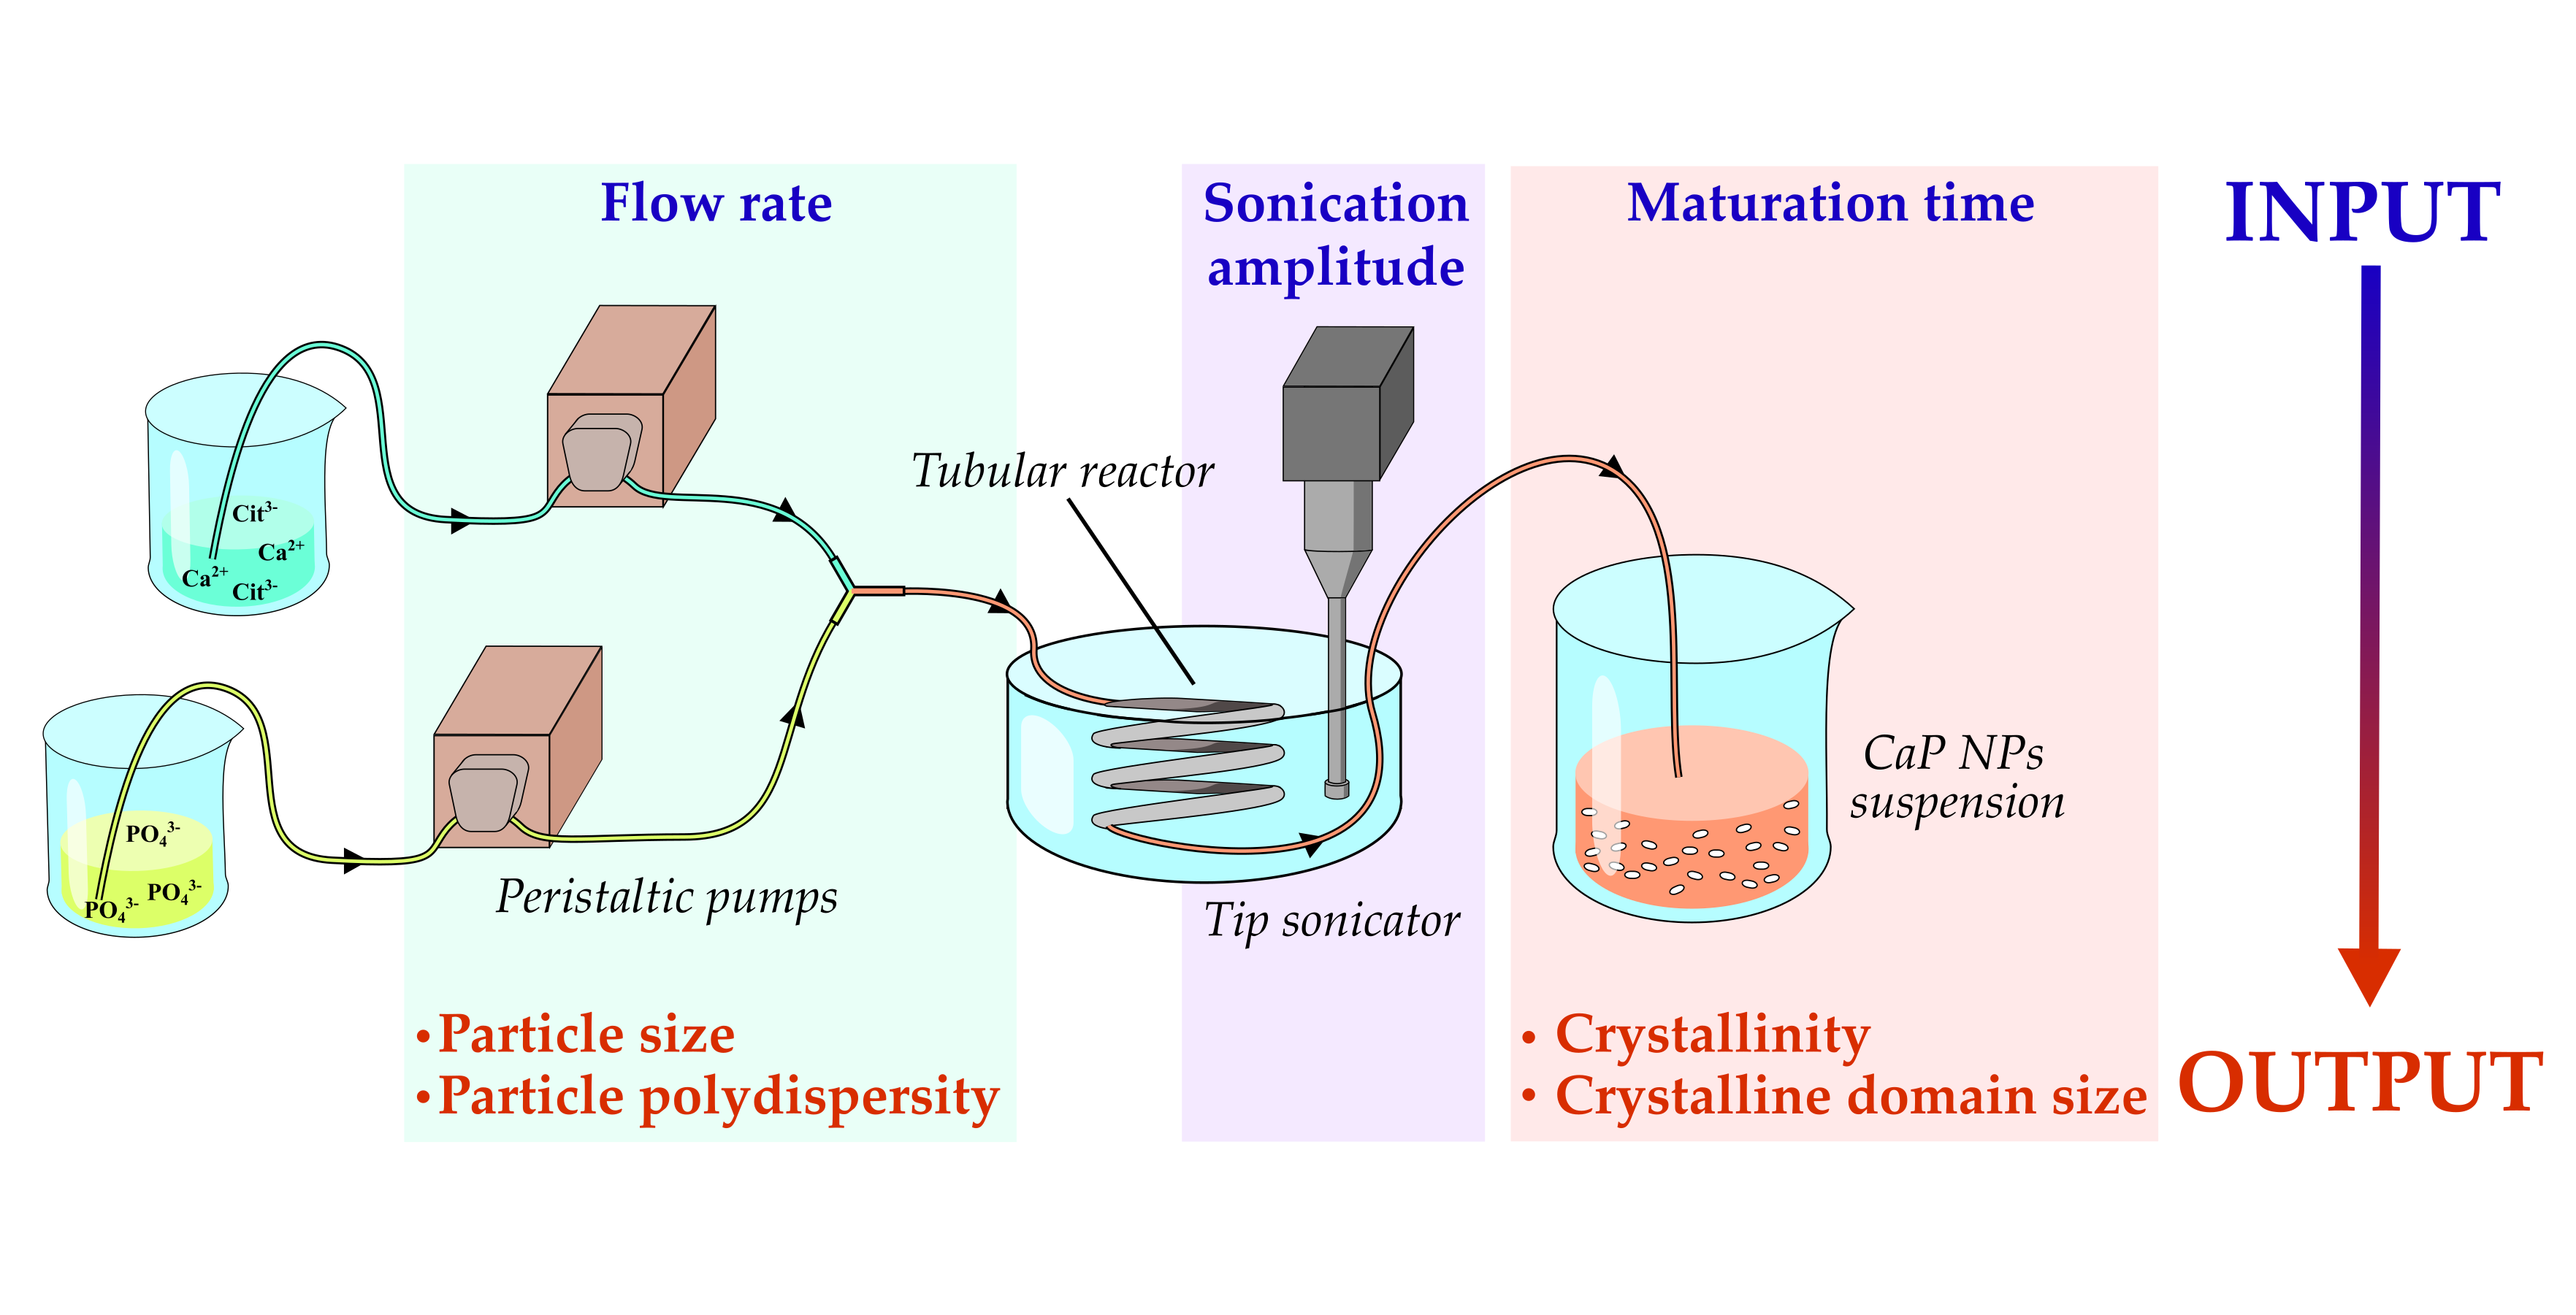
2.2. Description of the Continuous Flow Tube Type Reactor

CaP NPs were precipitated in a continuous flow tube type reactor which was immersed in a water bath together with a sonicator probe. A scheme of the reactor is reported in Figure 1. In detail, the reactor was composed of three main parts: (i) two stirred reservoirs containing calcium or phosphate precursor solutions connected to two independent peristaltic pumps, and (ii) a Y-shaped connector placed before (iii) a tubular reactor (Static mixer, Koflo Corporation) consisting of a spiral tube (316 stainless steel) with 4.8 mm in inner diameter and 230 mm in length immersed in a water bath with a sonicator probe (UP400ST, Hielscher, 400 W, with amplitude ratio 1:2.55 and diameter of 14 mm). The first two components of the reactor mix thoroughly the reactants and pump them in the second part of the reactor, where the precipitation aided by sonication occurs. At the outlet of the reactor, the product is collected in a reservoir which is maintained under magnetic stirring for a defined time window.

2.3. Calcium Phosphate Nanoparticles Preparation

The synthesis of citrate functionalized CaP NPs was carried out similarly to the biomineralization-inspired strategy employed as discontinuous batch precipitation by Miragoli et al. and Di Mauro et al. [10,11]. Namely, it consists in the continuous mixing (1:1) at room temperature in the tubular reactor of two aqueous solutions (2 L each) of (i) CaCl2 (100 mM) + Na3Cit (400 mM) and (ii) Na2HPO4 (120 mM). The pH was adjusted to alkaline conditions by adding 320 mL of NaOH 0.1 M in both precursor solutions in order to reach a final volume of 2.32 L for each solution. After precipitation, the suspension was kept under stirring at room temperature for further maturation (see below). Finally, the obtained CaP NPs suspension was pelleted by centrifugation at 4500 RPM for 10 min (ROTOSILENTA 630 RS, Hettich GMBH, Tuttlingen, Germany). The collected solid fraction was washed one time with an equal volume of ultrapure water by centrifugation and redispersed again in water to the original volume. This suspension was then sonicated for 4 min (UP400ST, Hielscher, 400W) and stored at 4 °C. For the physico-chemical characterization of CaP NPs, an aliquot of the suspension was dried in ventilated oven at 70 °C for 72 h, then grinded and sieved with a 50 μm sieve in order to achieve a uniform granulometry. A control experiment was performed as discontinuous batch precipitation. In this case, the precursor solutions described above were mixed in a tank with the aid of magnetic stirring. After mixing, the suspension was kept under stirring at room temperature for 24 h. Finally, the obtained CaP NPs suspension was washed by centrifugation and stored as described above.

2.4. Design of Experiment

In the present study, the DoE approach was used to optimize the production and to study the influence of selected process factors on CaP NPs’ physico-chemical properties. The DoE was conducted through a 23 full factorial design (3 factors with 2 levels each) that leads to eight different test runs, which were analyzed in triplicate. The selected process factors and levels were (i) the pump speed, hence the solution flow rate (FR) and thus the permanence time in the tubular reactor (FR, 0.7 and 2.8 mL s−1); (ii) the power output of the probe sonicator, expressed as sonication amplitude (SA, 20 and 100%); and (iii) the maturation time (MT) of CaP NPs after synthesis (MT, 0 and 24 h). The levels of each factor and the description of each run of the DoE study are reported in Table 1. The CaP NPs’ physico-chemical properties that were studied were the hydrodynamic diameter, size polydispersity, surface charge, crystallinity, crystalline domain size, Ca/P ratio, and yield of the CaP NPs. The values of each physico-chemical property (dependent variables) were analyzed using regression analysis in order to evaluate the influence of the process factors (independent variables). After a first regression analysis, the contribution of each process factor on the physico-chemical properties was calculated, and these results are reported in the Supplementary Materials. In the case that a two-factors combination had a very low incidence (<5%), it was excluded, and a new regression analysis on the remaining factors was performed. The effect of each factor was tested at the confidence limit of 95% (that corresponds to a p-value of 0.05). The factors having p < 0.05 were considered as “statistically significant”. The standardized effect (which is the estimated effect divided by the standard error) of each factor for each dependent variable was reported as a Pareto chart graph. In all the Pareto charts reported below, the length of bars is proportional to the standardized effect of a factor, and a factor was considered as “statistically significant” if its bar exceeded the threshold of p = 0.05, indicated by a horizontal line. In addition, the plot of marginal means was also reported in order to graphically show the relationships between dependent and independent variables.

2.5. Chemical, Morphological and Structural Characterization of the Samples

Powder X-ray diffraction (PXRD) patterns were recorded in the 2θ range from 10 to 80° with a step size (2θ) of 0.02 and a counting time of 1s with a D8 Advance diffractometer (Bruker, Karlsruhe, Germany) equipped with a Lynx-eye position sensitive detector using Cu Kα radiation (λ = 1.54178 Å) generated at 40 kV and 40 mA.
PXRD analysis was performed with the software TOPAS5 [36]. In the case of the samples obtained through runs 1, 3, 5, and 7, a multiphase Rietveld refinement of the PXRD patterns was performed. The relative contents of hydroxyapatite, sodium citrate tribasic dihydrate, and halite were refined considering a three-phase system and using tabulated atomic coordinates [37,38,39]. For all the Rietveld refinements, anisotropic peak-broadening effects due to the anisotropic crystal shape were modeled using symmetrized spherical harmonics, while the pattern’s background was modeled as 11th order Chebychev function.
The average sizes of crystalline domains along the hydroxyapatite axis directions D(002) and D(310) were calculated with the software TOPAS5 as full-profile peak broadening evaluation, using the peak function of fundamental parameters. The instrumental contribution to peak broadening was evaluated by collecting the PXRD pattern of a LaB6 standard sample.
Ca and P content was quantified by inductively coupled plasma optical emission spectrometer (ICP-OES) (ICAP 7400 DUO, Thermo Fisher Scientific Inc., Waltham, MA, USA). Atomic emission was measured at the following wavelengths: 422.673 nm for Ca, and 213.618 nm for P. Samples were prepared by dissolving an aliquot of powder in a 1 wt. % HNO3 solution.
Fourier transform infrared (FT-IR) spectroscopy analyses were carried out on a Nicolet iN10 microscope with Nicolet iZ™10 FT-IR module (Thermo Fisher Scientific Inc., Waltham, MA, USA) with a resolution of 0.482 cm−1 by accumulation of 64 scans, using the KBr pellet method.
Dynamic light scattering (DLS) was used to determine hydrodynamic diameter and polydispersity index of the samples. NP size was measured with a Zetasizer Nano ZSP analyzer (Malvern, UK). DLS measurements were performed with backscatter detection (λ = 630 nm; θ = 173°) using as working parameters hydroxyapatite refractive index (1.63) for the CaP NPs, and water refractive index (1.33) and viscosity (0.887 cP) for the solvent. Measurements were performed at sample concentration of 0.5 mg/mL at unadjusted pH. Results were reported as Z-average and relative polydispersity indexes of three measurements of at least 10 runs for 10 s at 25 °C.
Electrophoretic mobility measurement (ζ-potential) was used to evaluate the surface charge of the CaP NPs at unadjusted pH using disposable folded capillary cells (DTS1061; Malvern, UK) at 25 °C. Three measurements (maximum of 100 runs each) were collected for each sample.
Transmission electron microscopy (TEM) was used to observe CaP NPs morphology. Micrographs were acquired with a Tecnai F20 microscope (Fei Corp., Hillsboro, OR, USA) operating at 120 kV. The powder samples were dispersed in ultrapure water by sonication, and then a few droplets of the slurry were deposited and dried on 200 mesh copper TEM grids were covered with thin amorphous carbon films. CaP NPs morphology analysis was performed with software ImageJ [40]. All the characterizations were performed in triplicate, and data were expressed as mean values ± standard deviation (SD) of independent analyses (n = 3).

3. Results and Discussions

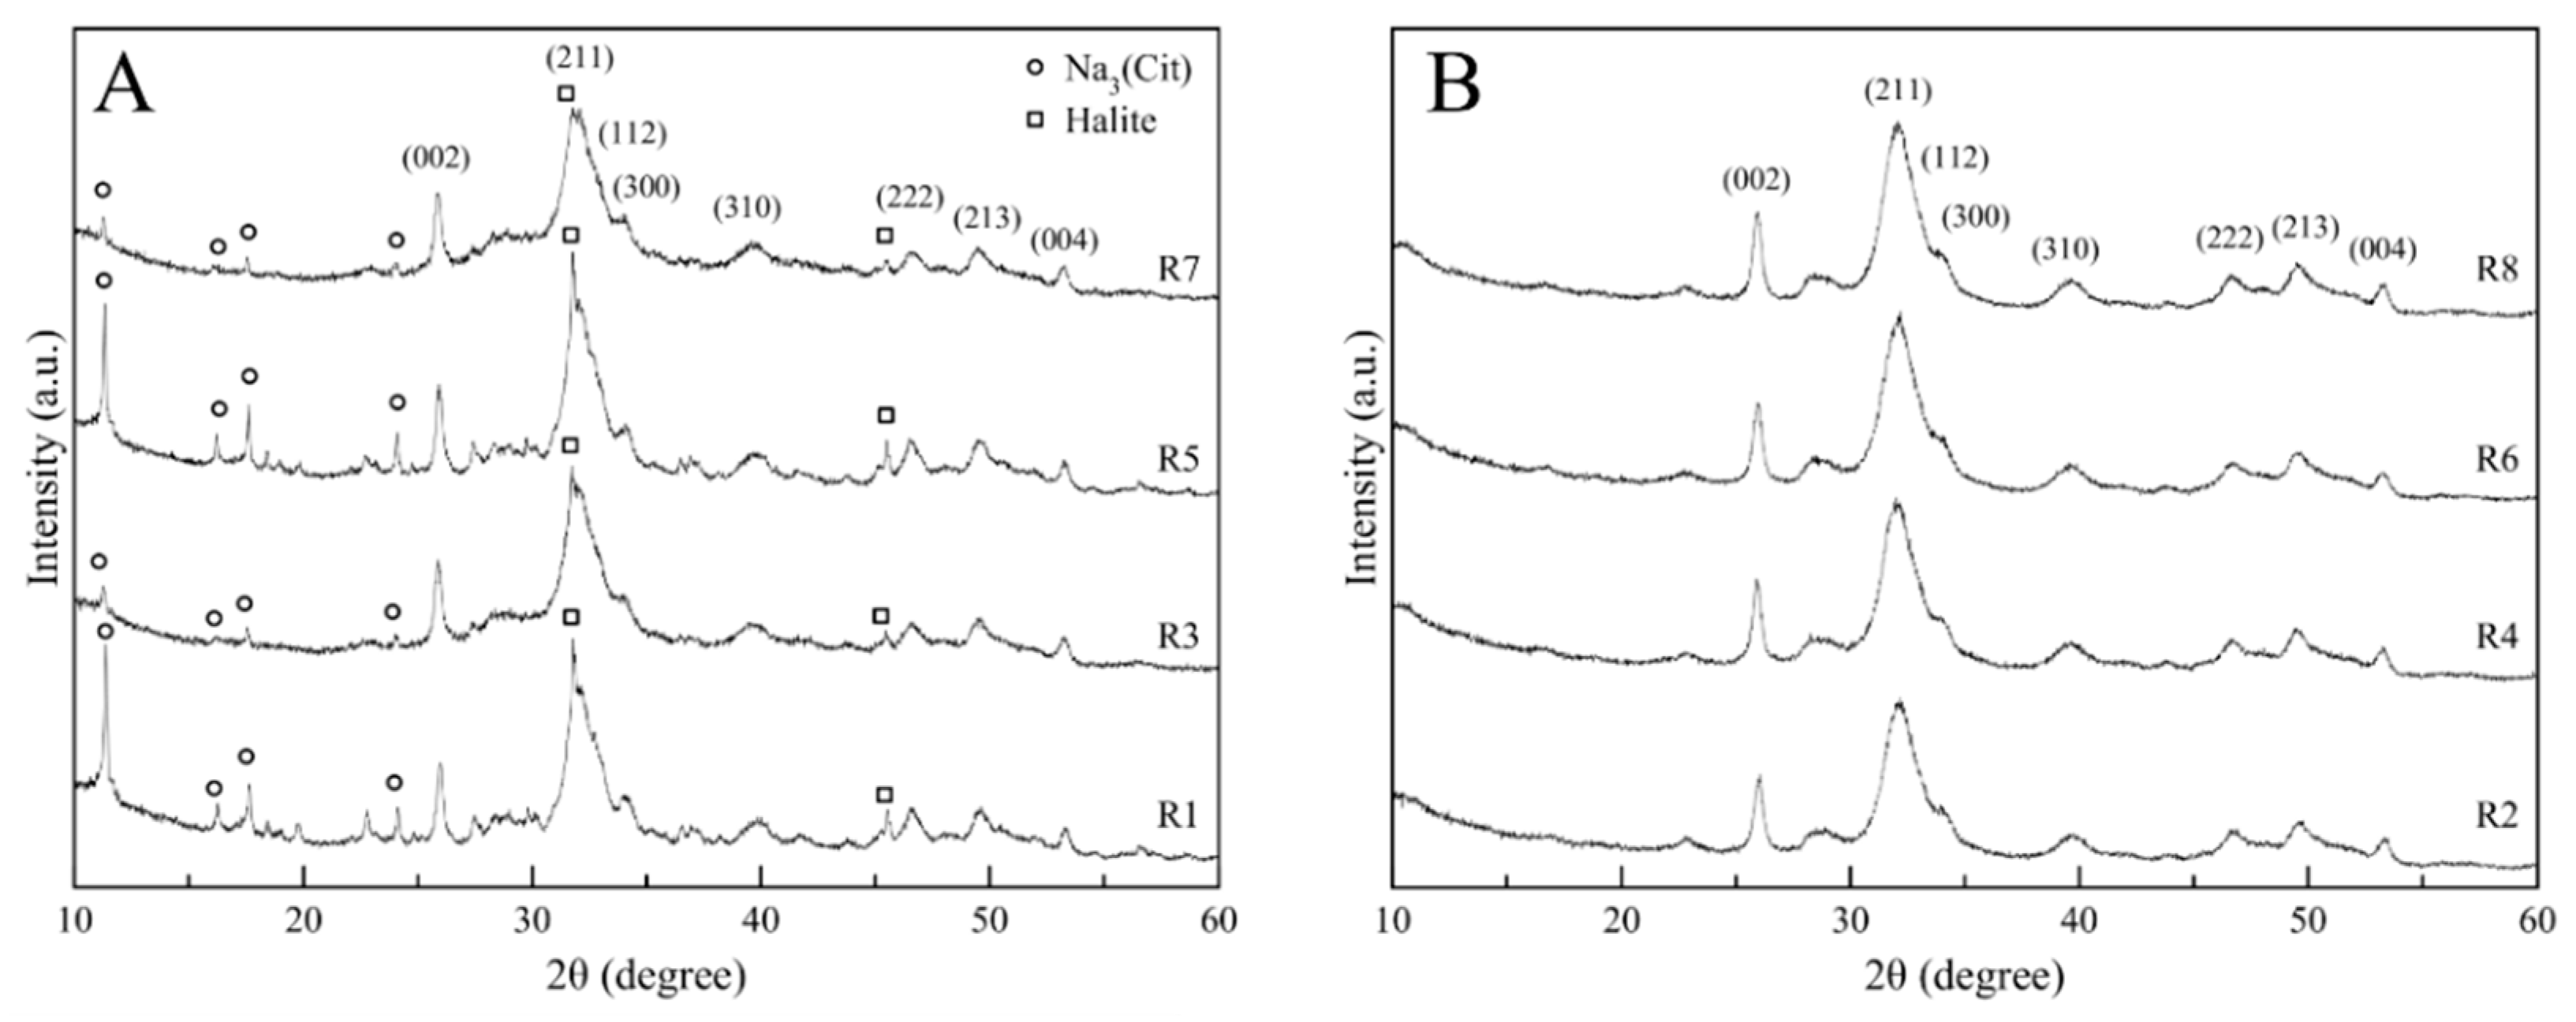
3.1. Crystallographic Features and Product Purity

PXRD patterns of the obtained powders are reported in Figure 2. All samples show the typical diffraction pattern of hydroxyapatite (HA, Ca5(PO4)3OH, PDF card file 00-009-0432) as the main crystalline phase [41]. For all the runs, the diffraction peaks are broad and poorly defined, suggesting that CaP NPs are composed of HA crystals with reduced crystalline order and nano-sized crystalline domains [42]. The PXRD patterns of odd-numbered runs (Figure 2A) present additional peaks that were ascribed to the presence of minor crystalline phases that conversely are not present in even-numbered runs (Figure 2B). These secondary phases were indexed as sodium citrate tribasic dihydrate (Na3(C6H5O7)∙2H2O, abbreviated as Na3(Cit), PDF card file 00-016-1170, marked with circles in Figure 2A) and halite (NaCl, PDF card file 00-005-0628, marked with squares in Figure 2A). Phase quantification was performed by multiphase Rietveld refinement (Table 2). Odd- and even- numbered runs differ for the MT factor, where the formers are (+1) MT level and the latter are (−1), respectively. The presence of secondary crystalline phases in the runs with (+1) MT level is probably due to a ripening effect in the final suspension, consisting of the dissolution and re-precipitation of CaP NPs together with halite and Na3(Cit) during maturation. Interestingly, the highest content of impurities seems to be associated to high-level of FR. The presence of Na3(Cit) and its increase with lower residence time were previously reported by Torrent-Burgués et al. for HA synthesized with similar precursors concentration and with a continuous process [43]. It is likely that the amount of water used in the washing step, that was minimized in order to avoid product losses, was not sufficient to remove these secondary products. As shown below, a high FR reduces particle size and increases particle number, thus, it is likely that in high FR runs, there is a higher number of particles where secondary phases can nucleate.
The dimensions of HA crystalline domains were estimated along the [00l] and [hk0] directions by evaluation of the broadening of the non-overlapped (002) and (310) PXRD peaks, and are reported in Table 2 together with the aspect ratio of the crystalline domains, estimated as the D(002)/D(310) ratio. For all the samples, the D(002) values (ranging from 23 to 39 nm) are higher than the corresponding D(310) values (ranging from 5 to 7.2 nm), indicating that all the crystalline domains are elongated along the c-axis, as also shown by the high aspect ratios. The presence of elongated crystalline domains was already reported in literature for HA synthesized in the presence of citrate in discontinuous batch conditions [42].
The ranking of all standardized effects of process factors and the possible cross effects for all responses on the crystallographic parameters are shown on the Pareto charts together with their cumulative relative incidence in Figure S1. According to the relative Pareto chart (Figure S1A), the combination of factors SA–MT has a very low incidence (<5%) on the crystallographic parameter D(002), and therefore was excluded from the regression analysis. A new regression analysis was applied without the SA–MT combination, and the ranking of standardized effects of the relevant factors on D(002) is shown on the Pareto charts in Figure 3A. The bars above the horizontal line indicate that the corresponding effects are statistically significant at p = 0.05. MT was found to be the only factor to be statistically significant on D(002) (p-value = 0.013). The plot of marginal means for D(002) (Figure 3B) shows that an increase in MT corresponds to an increase in the crystalline domain along the c-axis. On the other hand, the Pareto charts on the crystallographic parameter D(310) (Figure S1B and Figure 3C) showed that all the factors were statistically unrelated to it (all p-values > 0.05), even if none of them could be excluded from the regression analysis. This finding suggests that the crystalline domains of HA nanoparticles increase significantly with MT along the c-axis but not along the a- and b-axes. This is also evident from the regression analysis applied to the aspect ratio D(002)/D(310), where, according to the Pareto chart of all standardized effects of factors (Figure S1C), the combination of FR–MT factors has not been considered due to its low incidence (<5%). The regression analysis applied without the FR–MT combination (Figure 3E) shows that only MT is statistically significant (p-value = 0.011). Furthermore, in this case, the plot of marginal means for D(002)/D(310) (Figure 3F) shows that an increase in MT induces an expansion of the crystalline domain aspect ratio. Overall, these data indicate that CaP NPs crystalline domain dimensions are regulated by MT, and, particularly, an increase in MT leads to an increase in the crystalline domain length and aspect ratio.
These results were compared to the crystallographic features of CaP NPs prepared by discontinuous batch precipitation (Figure S2 and Table 2). It can be observed that batch CaP NPs do not present secondary crystalline phases. The size of crystalline domains of batch CaP NPs are similar to the samples prepared with the continuous flow precipitation at lower maturation time (even-numbered runs). This indicates that the continuous flow process shortens the growth time of crystals, since with ca. 40 min of continuous flow precipitation, the crystalline domain sizes were comparable to those obtained after 24 h of maturation in batch.

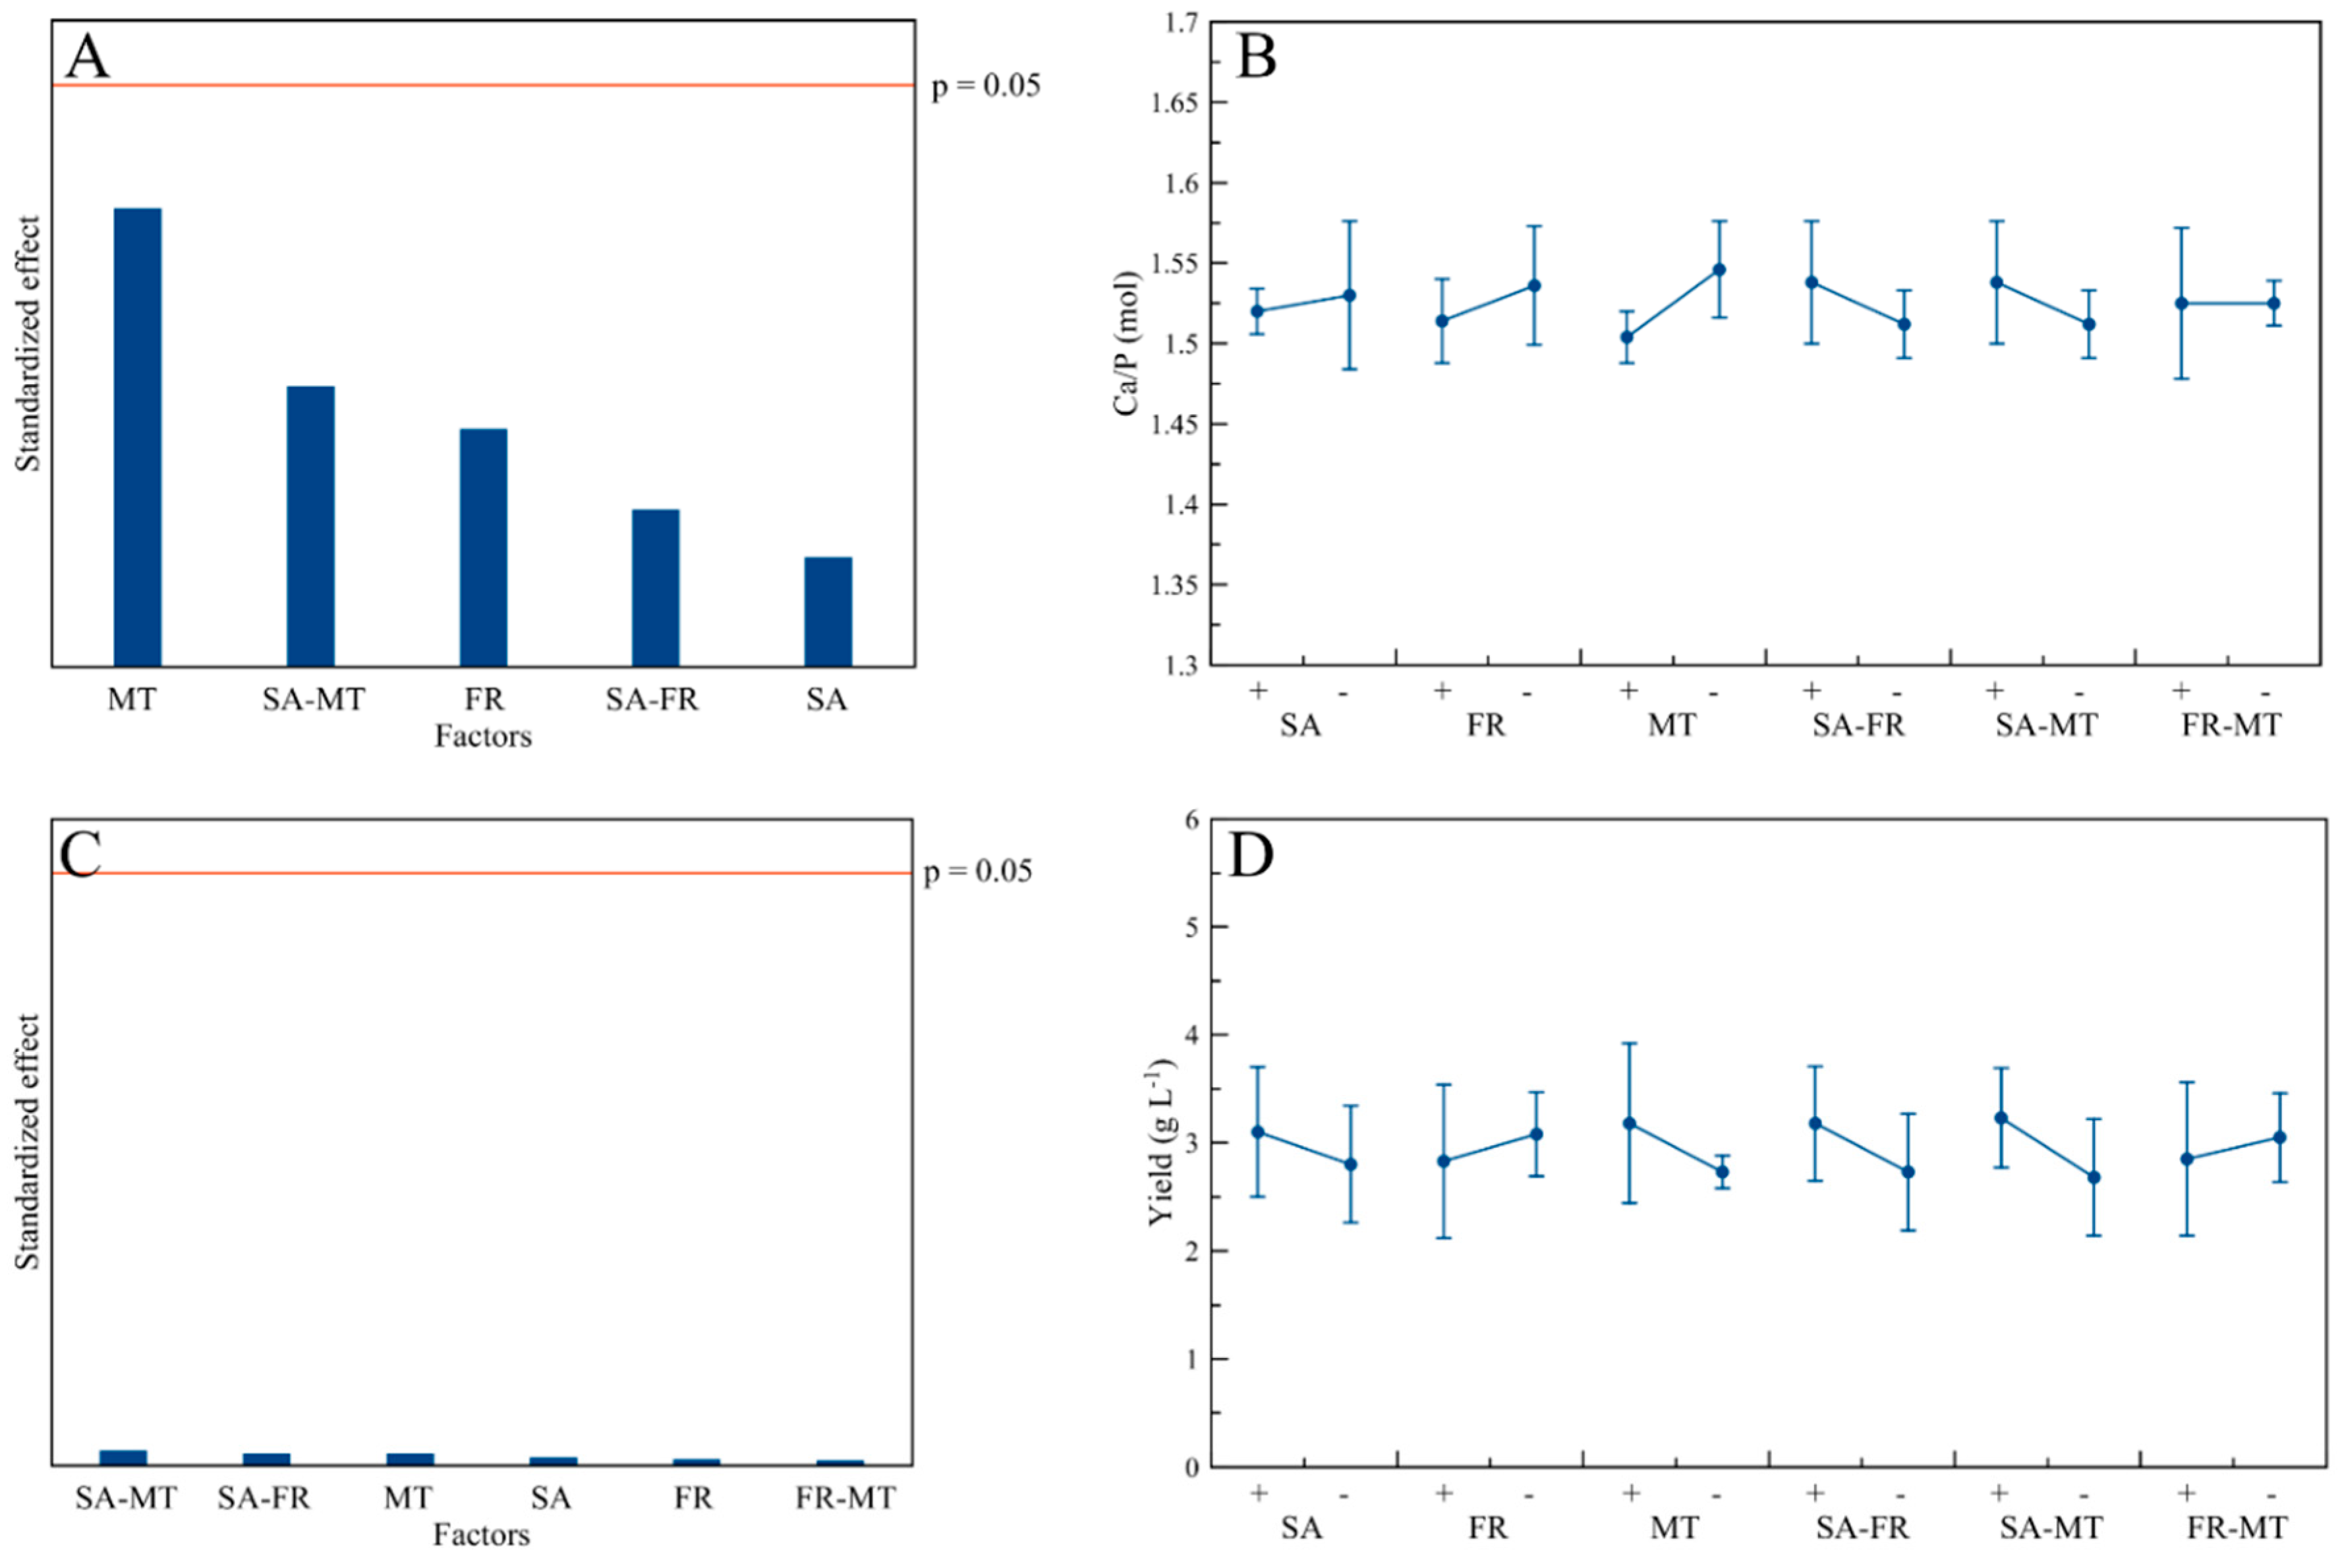
3.2. Ca/P Ratio and Yield

The Ca/P molar ratio is a feature for CaP-based materials that is commonly used to evaluate composition and stoichiometry of the product [44,45]. Ca/P molar ratios of the eight runs are reported in Table 3 and are comprised between 1.48 and 1.59. The Ca/P values are lower than the stoichiometric value of HA (i.e., 1.67), indicating that all the samples are Ca-deficient, having Ca/P molar ratios close to biogenic apatite (1.5), which could enhance their biomimetic character [46]. A Ca/P value close to 1.5 is common for CaP NPs precipitated in presence of citrate [42], and similar values were observed for NPs both precipitated in discontinuous batch conditions and with continuous processes [43].
Figure 4A,B shows the Pareto charts and plots of marginal means for the Ca/P ratios resulting from the statistical analysis. According to the Pareto chart of all standardized effects (Figure S3A), the combination of factors FR-MT has not been considered due to its low incidence. The regression analysis without FR-MT combination (Figure 4A) indicates that no factor has a significant effect on the Ca/P ratio, as also shown by the plot of marginal means (Figure 4B). In addition, also the CaP NPs prepared by discontinuous batch precipitation have a similar Ca/P ratio to those prepared by continuous flow precipitation. It is likely that the Ca/P ratio is dependent only to the stoichiometric ratios and concentration of the precursor reagents, as was reported in other works [47,48].
Of fundamental importance for the industrial development of CaP NPs is the process yield. Commonly, CaP NPs precipitation process is far from being a quantitative reaction, and in the presence of growth inhibitors like citrate, the yield is even lower due to the effect of calcium chelation. For this reason, it is essential to find the best compromise between the NPs properties and process yield. The production yields for the eight runs are reported in Table 3, and are comprised between 2.6 and 3.8 g L−1. Taking into account that odd-numbered runs contains impurities, the yields were corrected on the basis of HA content estimated from the phase quantification by PXRD Rietveld refinement. Indeed, a main result of the flow-process is the ca. two-fold increase in yield in comparison to discontinuous batch precipitation process (1.6 g L−1). The increase in yield is due to the highly efficient mixing of precursors in the continuous flow process that improves the consumption of reactants and precipitation of particles [49,50]. However, according to the Pareto charts, reported in Figure 4C and Figure S3B, none of the factors has a statistically significant influence on the syntheses yield. In addition, from the plot of marginal means that no clear trend was observed between corrected yield and all the factors.

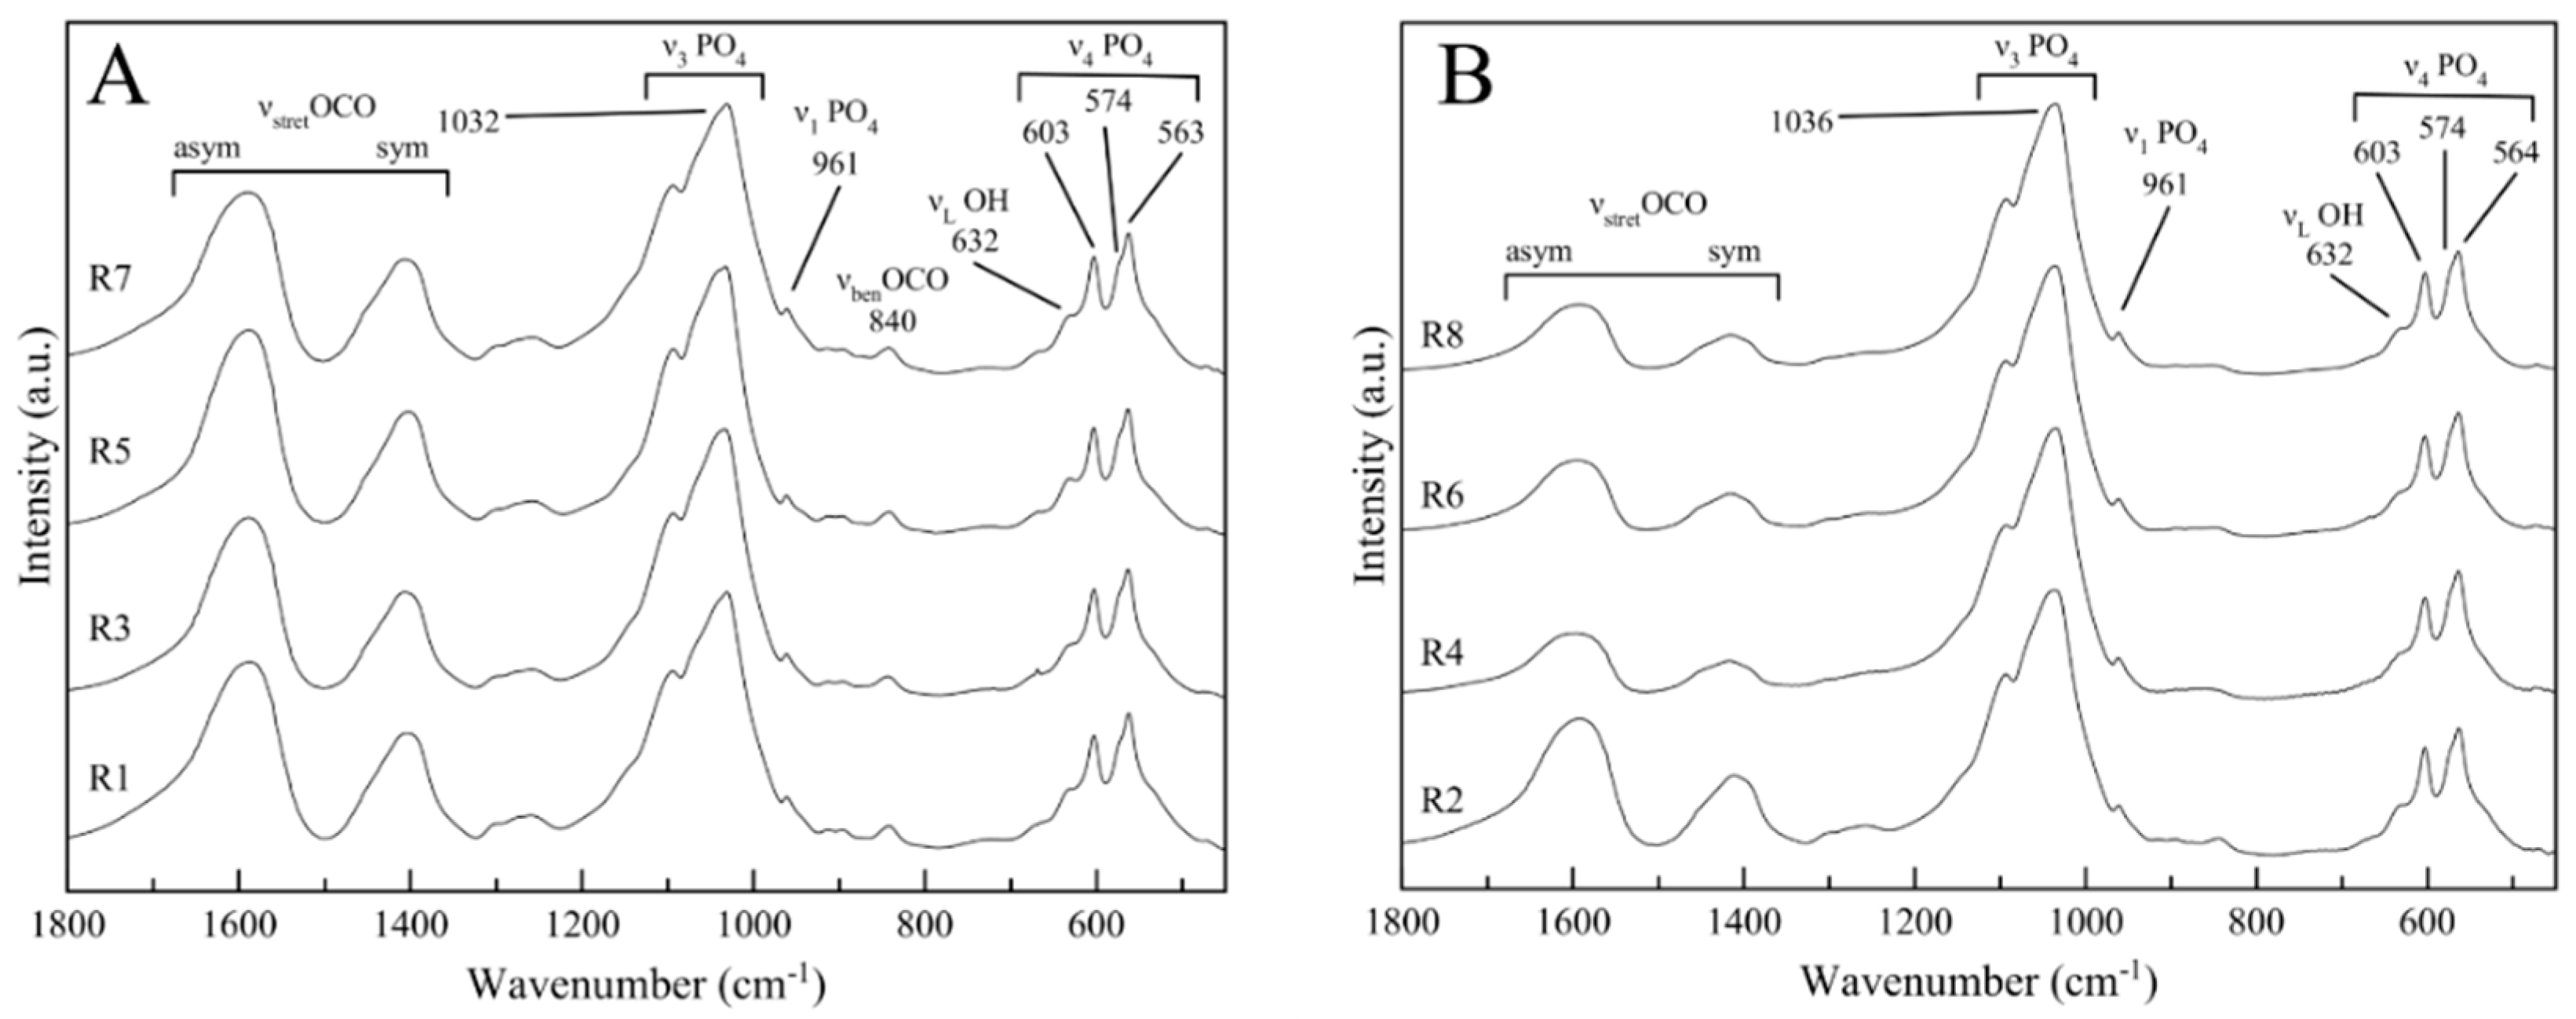
3.3. Structural Characterization

The FT-IR spectra of the samples are reported in Figure 5 and Figure S4; all samples display the same bands. The main band is a broad band at ca. 1030 cm−1 with shoulders at ca. 1046 and ca. 1075 cm−1, and it corresponds to ν3PO4 vibration, which is the triply degenerated antisymmetric stretching mode of the apatitic phosphate groups. The other main bands are also due to the vibration of apatitic phosphate groups, which are at ca. 961 cm−11PO4, symmetric stretching) and at 603, 574 (as a shoulder) and 564 cm−14PO4, triply degenerated bending). All the runs present the bands associated to the librational and stretching mode of hydroxyl ions at 632 and 3570 cm−1, respectively [51], confirming the presence of OH- groups in the crystal lattice and thus the HA phase assignment. In the 1650–1350 cm−1 range, the signals of antisymmetric and symmetric stretching modes of carboxylate group (asym and sym νstret OCO, respectively) are present, together with a band due to adsorbed water (ca. 1640 cm−1). The νstret OCO bands were assigned to the presence of citrate ions, since carbonate ions were not detected in the samples, as evinced by the absence of νCO3 carbonate band at ca. 870 cm−1. The relative intensity of citrate bands is higher in odd-numbered runs (Figure 5A) than in even-numbered ones (Figure 5B), suggesting a higher citrate content due to the presence of Na3(Cit), as shown by PXRD. This is also confirmed by the presence of a small band at 840 cm−1 only in odd-numbered runs that was attributed to the signal of bending modes of carboxylate group (νben OCO) typical of Na3(Cit) crystals [52]. Apart from the differences in relative intensity of citrate bands, all samples have similar band positions and intensities. A FT-IR spectrum similar to the ones of odd-numbered runs was obtained for the discontinuous batch precipitation sample (Figure S2).
The FT-IR spectra were used to quantitatively evaluate the crystallinity of the products by means of the splitting factor (SF) (Table 2), a well-reported index for the evaluation of crystallinity degree of CaP-based materials [53]. All the samples have a SF between 4.2 and 4.6, suggesting that the crystallinity is comparable among the tested conditions. The SFs of the samples prepared by continuous flow precipitation are higher than that of CaP NPs synthesized through discontinuous batch precipitation (3.5), indicating that the flow-through precipitation aided by sonication improved particle crystallinity. From the Pareto charts on SF, reported in Figure S5, it is evident that the SA–MT combination can be excluded due to low incidence. The regression analysis without the SA–MT combination (Figure 6A) shows that no factor has a statistically significant influence on the SF. The plot of marginal means (Figure 6B) shows that a slightly higher SF value can be achieved with a lower SA.

3.4. Hydrodynamic Diameter, PdI, and ζ-Potential

CaP NPs dimensions, polydispersity, and surface charge are properties that are closely related to the biological behavior of the samples, and affect essential processes such as cell and tissue penetration, translocation, cell compatibility, and protein binding. The hydrodynamic diameter (expressed as Z-average), the maximal particle size (expressed as Dv(90), which is the diameter which encompasses the 90% in volume of the particles), the polydispersity index (PdI) and the ζ-potential of the samples are reported in Table 4. The obtained NPs have hydrodynamic diameters ranging from 60 to 140 nm (corresponding to a Dv(90) ranging from 60 to 400 nm) with a relatively low PdI (from 0.25 to 0.5), and have a strongly negative surface charge in the range between −23 and −34 mV. Figure 7 and Figure S6 shows the Pareto charts and plots of marginal means for size and surface charge values resulting from the statistical analysis. According to the Pareto chart of all the standardized effects on Z-average (Figure S6A), the SA–MT combination factor has a low incidence and was excluded. The regression analysis without the SA–MT combination (Figure 7A) shows that NPs’ hydrodynamic diameter is significantly dependent on FR (p = 0.003). Plots of marginal means (Figure 7B) show that size is notably lower with higher FR. The results suggest that a high FR, and thus the increase in pressure, led to the formation of a turbulent flow in the reactor, improving reactant mixing and nucleation and reducing particle aggregation. Dv(90), being another expression of particle size, has the same Pareto charts and plots of marginal means of Z-average, and for sake of simplicity, was omitted. Even the PdI is significantly influenced only by FR (p = 0.011); according to the relative Pareto chart (Figure 7C), the two are inversely proportional (high FRs correspond to lower PdI) as shown by the plot of marginal means (Figure 7D). For PdI, the FR–MT combination factor was excluded before regression analysis due to its low incidence (Figure S6B). The results indicate that both NPs dimension and polydispersity are inversely proportional to flow rate through the reactor. The particle size reduction and homogenization by higher flow rates were previously reported in other works on HA NPs produced by continuous flow processes. In these works, it was found that high flow rates and low residence times (i) improved the mixing of precursor solutions, (ii) increased nucleation and decreased particle size, and (iii) decreased particle aggregation after nucleation [31,32,54]. Indeed, the Z-average and PdI values of run 1 and run 5 samples (i.e., prepared at higher FR with 24h of MT) are lower than those of CaP NPs prepared in batch conditions (24h of maturation). From Pareto charts on ζ-potential values, reported in Figure S6C, both SA–MT and FR–MT combination factors can be excluded due to low incidence. The regression analysis without these factors (Figure 7E) shows that no factor has a statistically significant influence on the surface charge. In our previous works, we have demonstrated that the negative surface charge of NPs is due to the presence of citrate ions on their surface [10,11]. CaP NPs prepared by discontinuous batch precipitation have a slightly lower ζ-potential value (−19 mV) than those prepared by continuous flow.

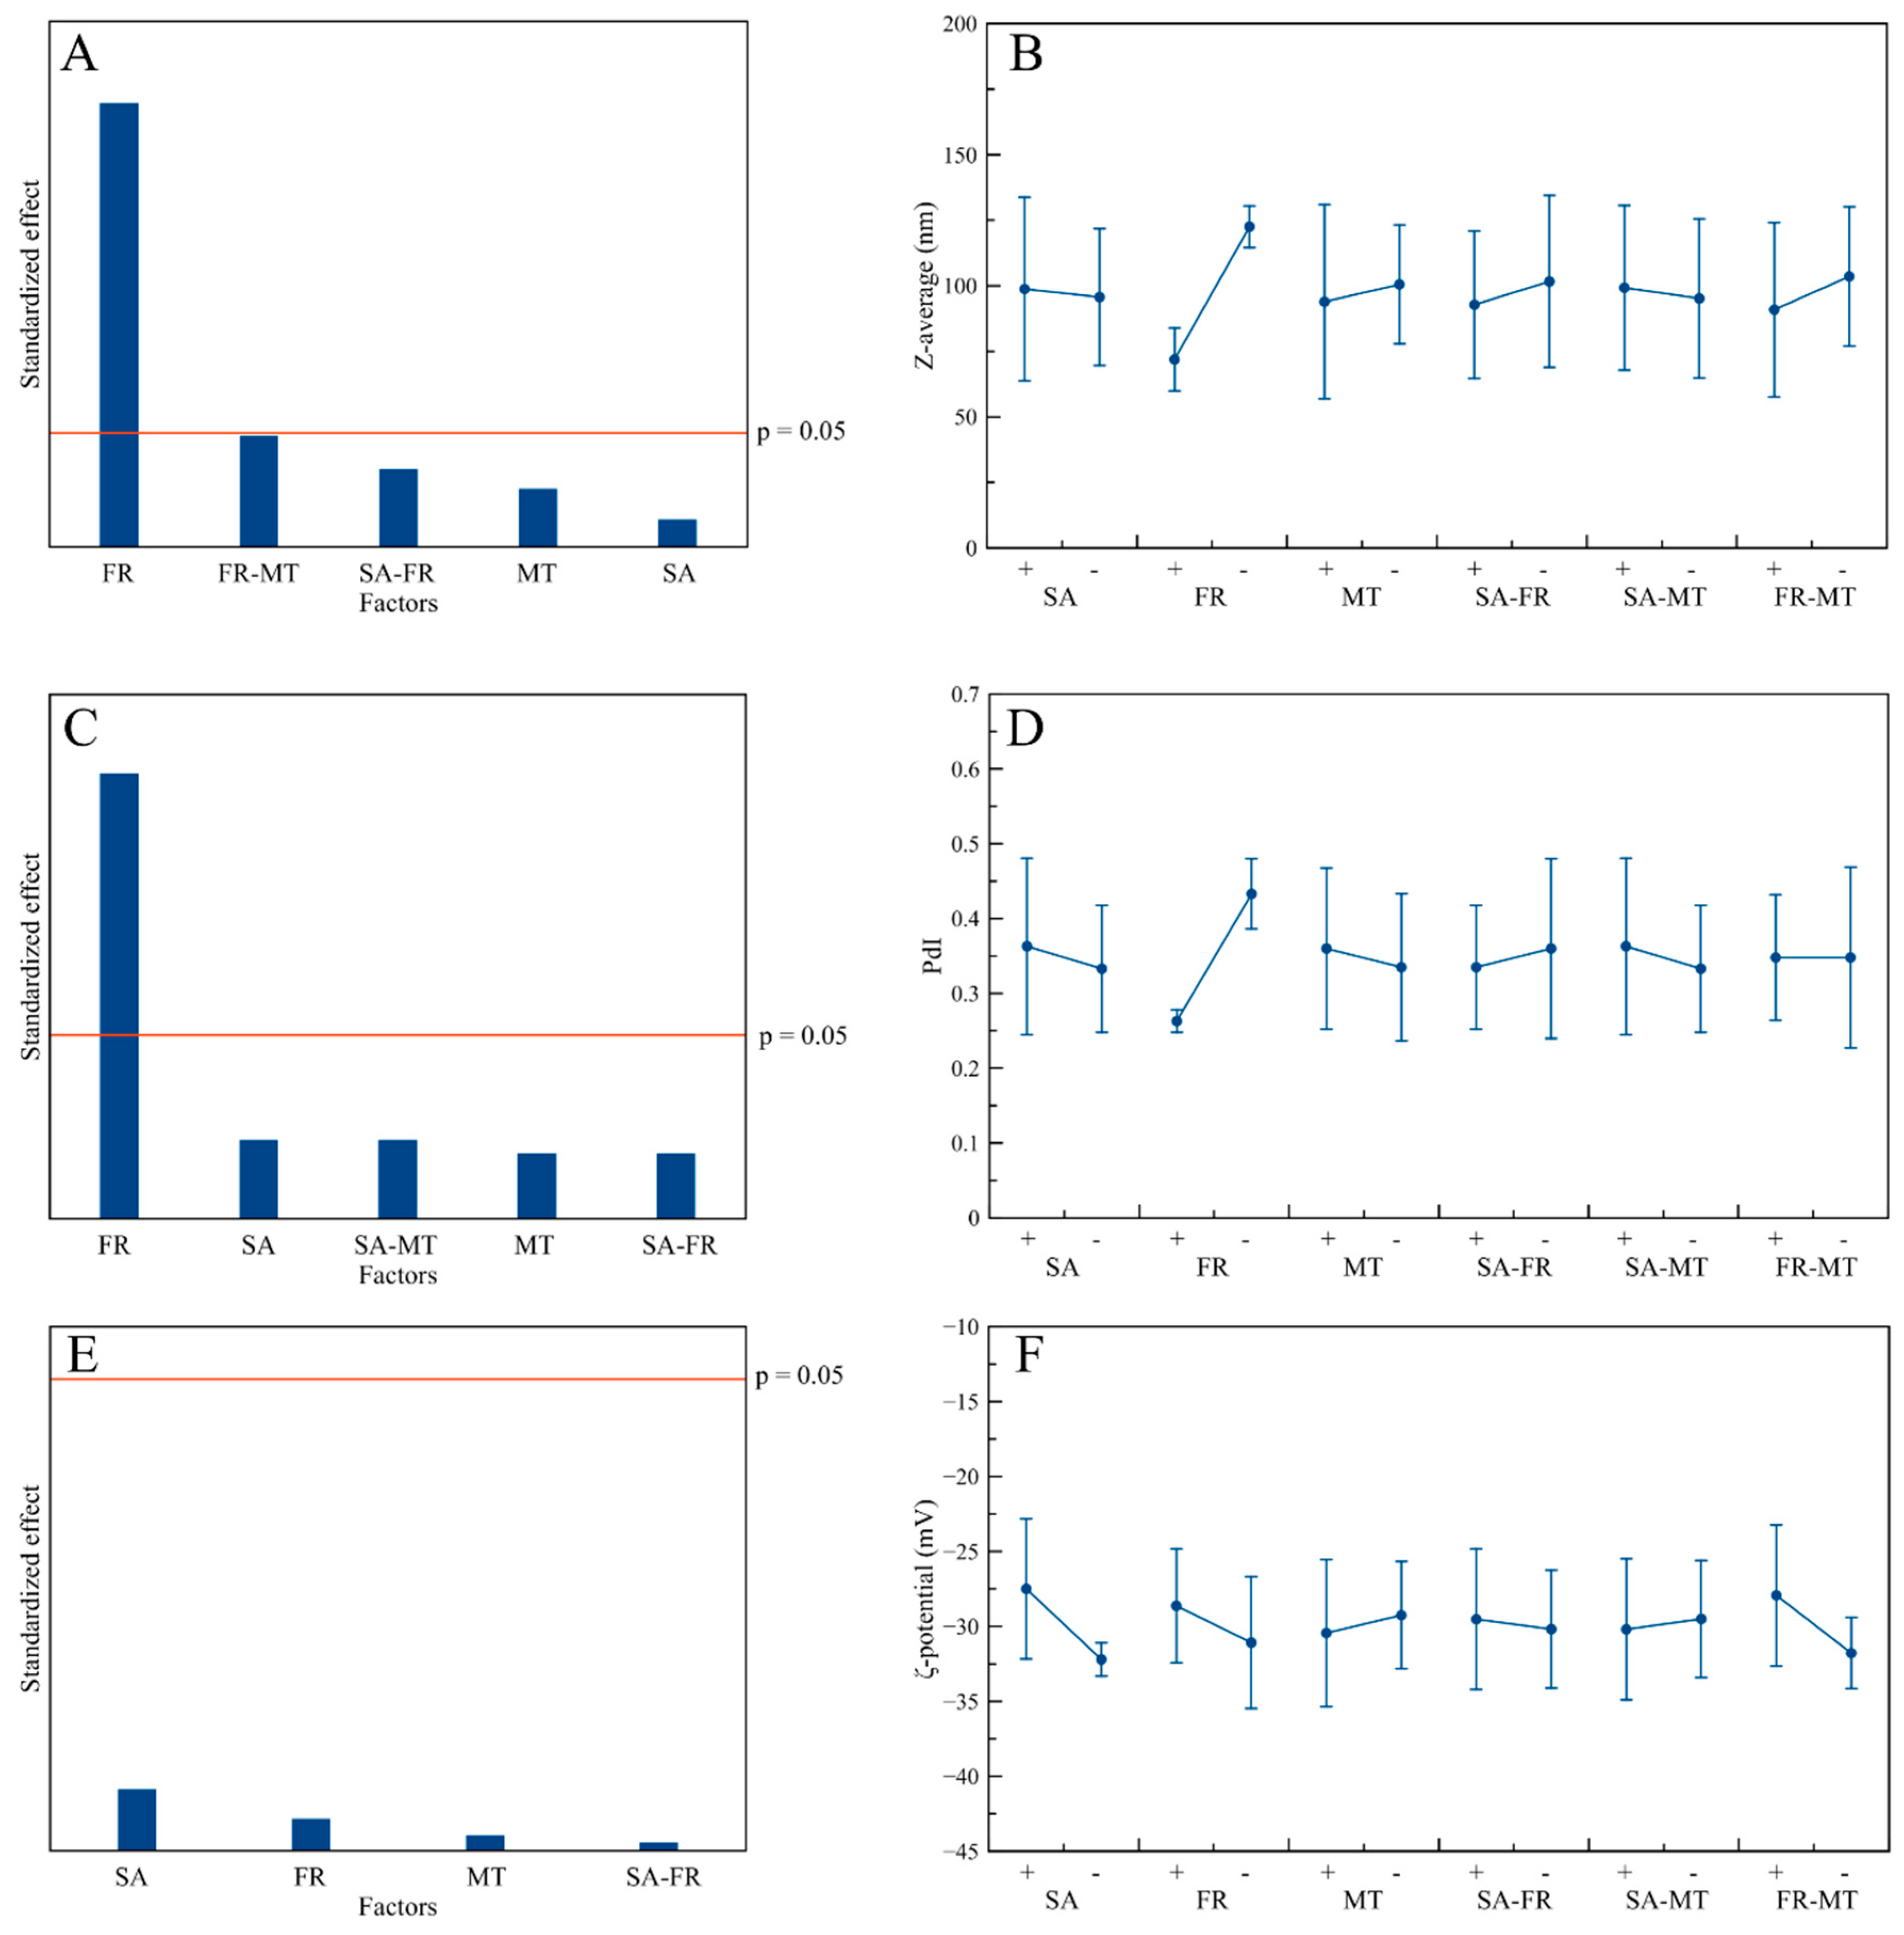
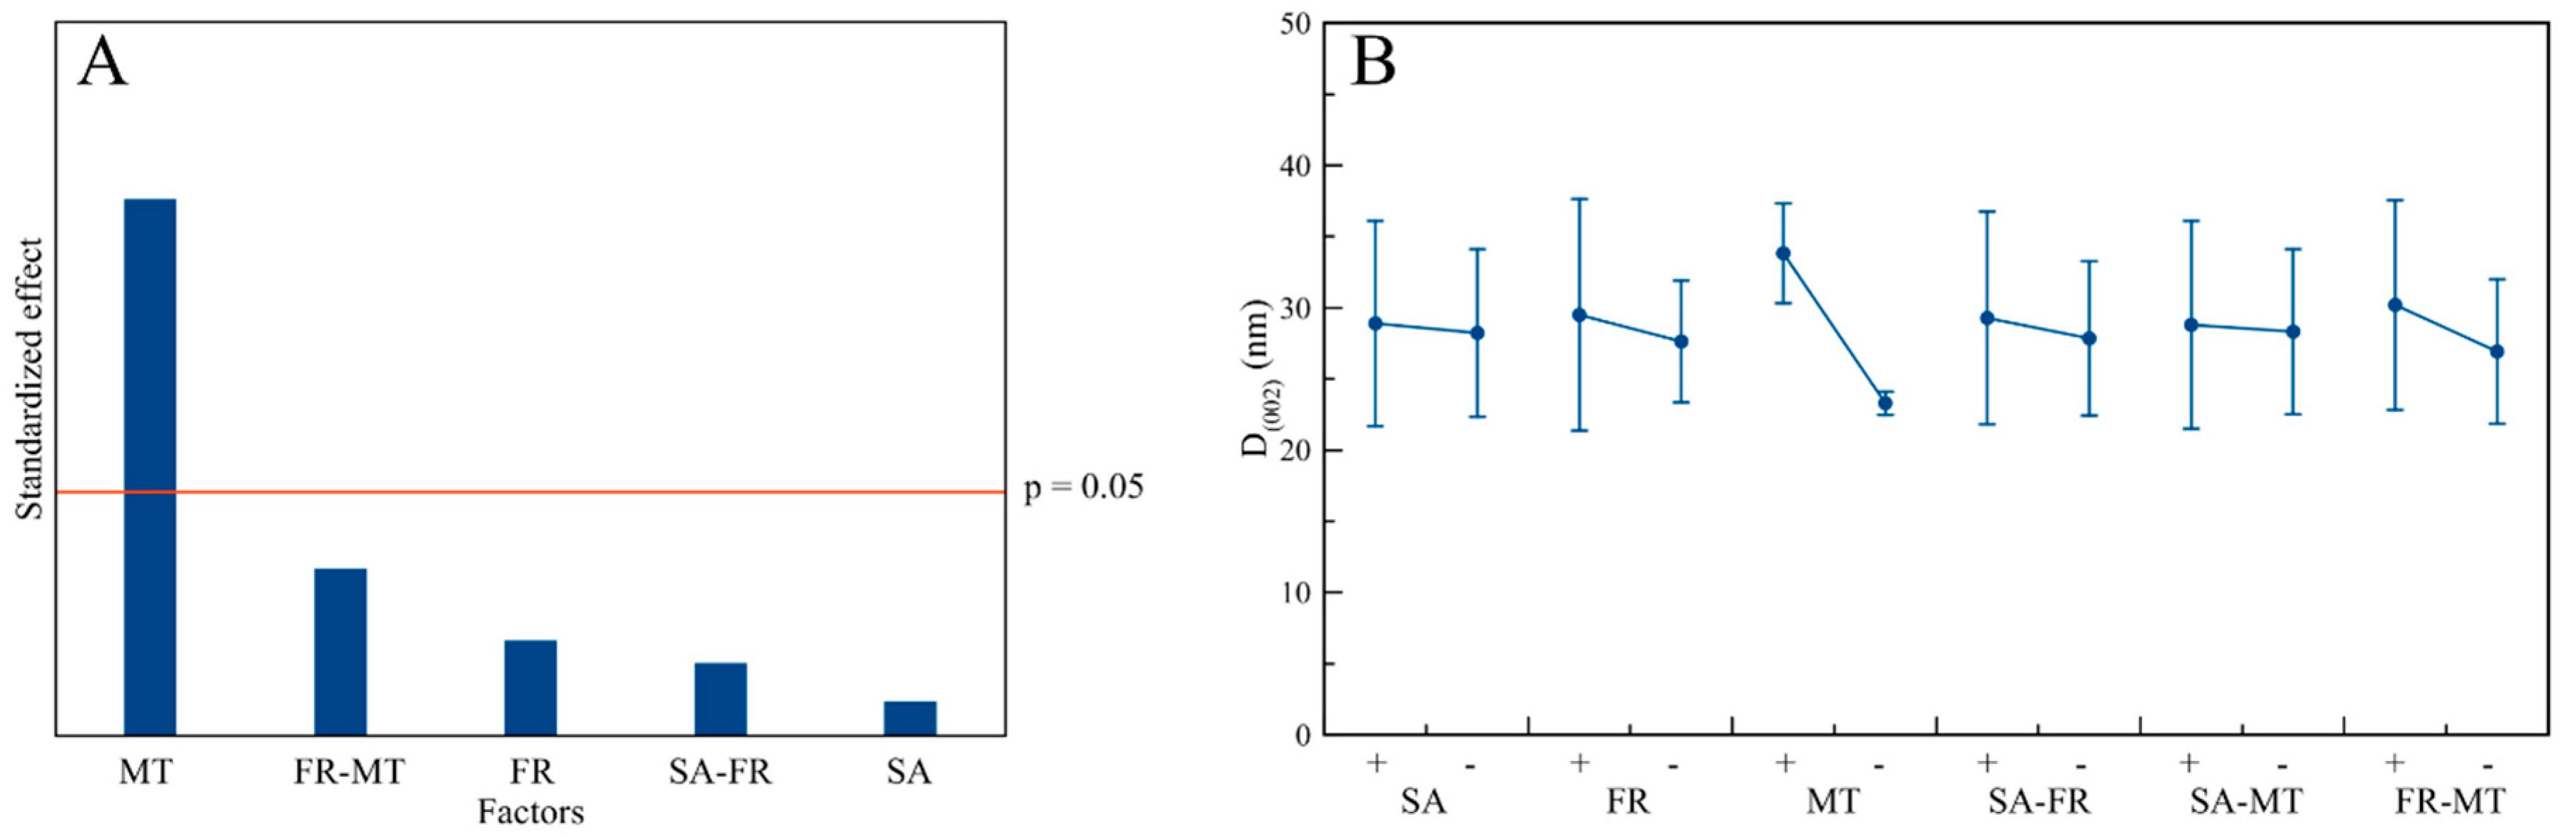
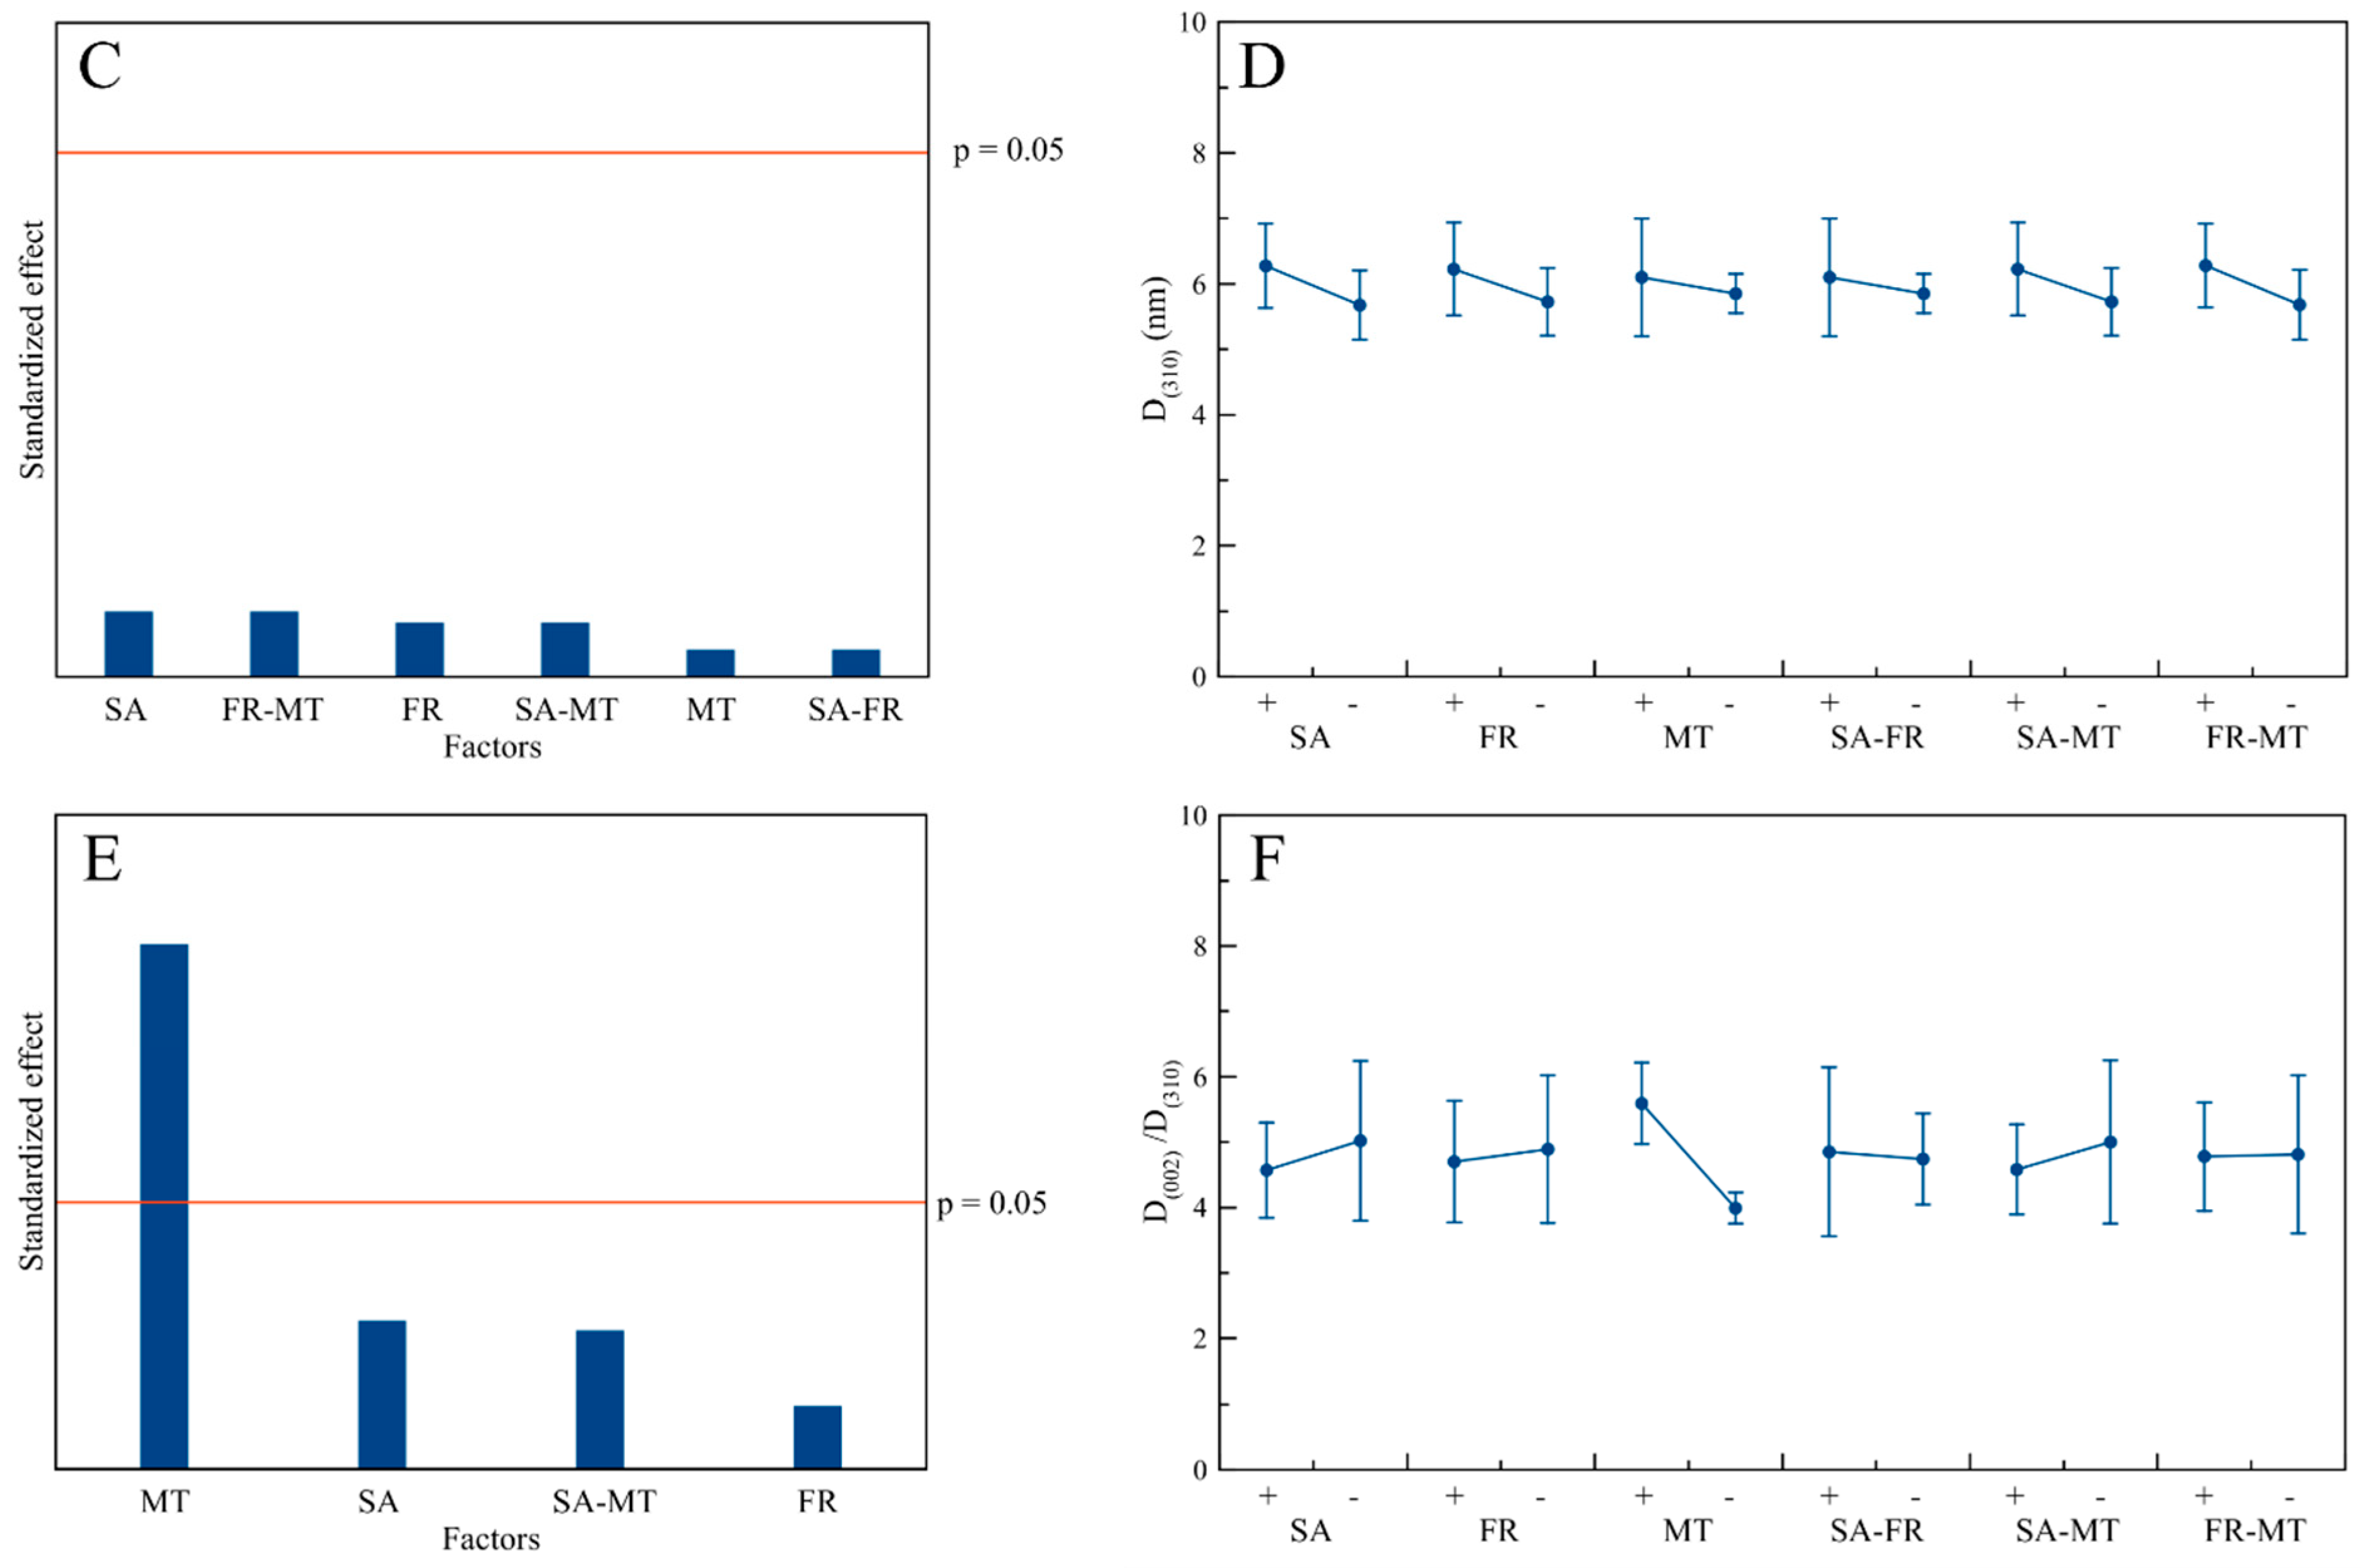
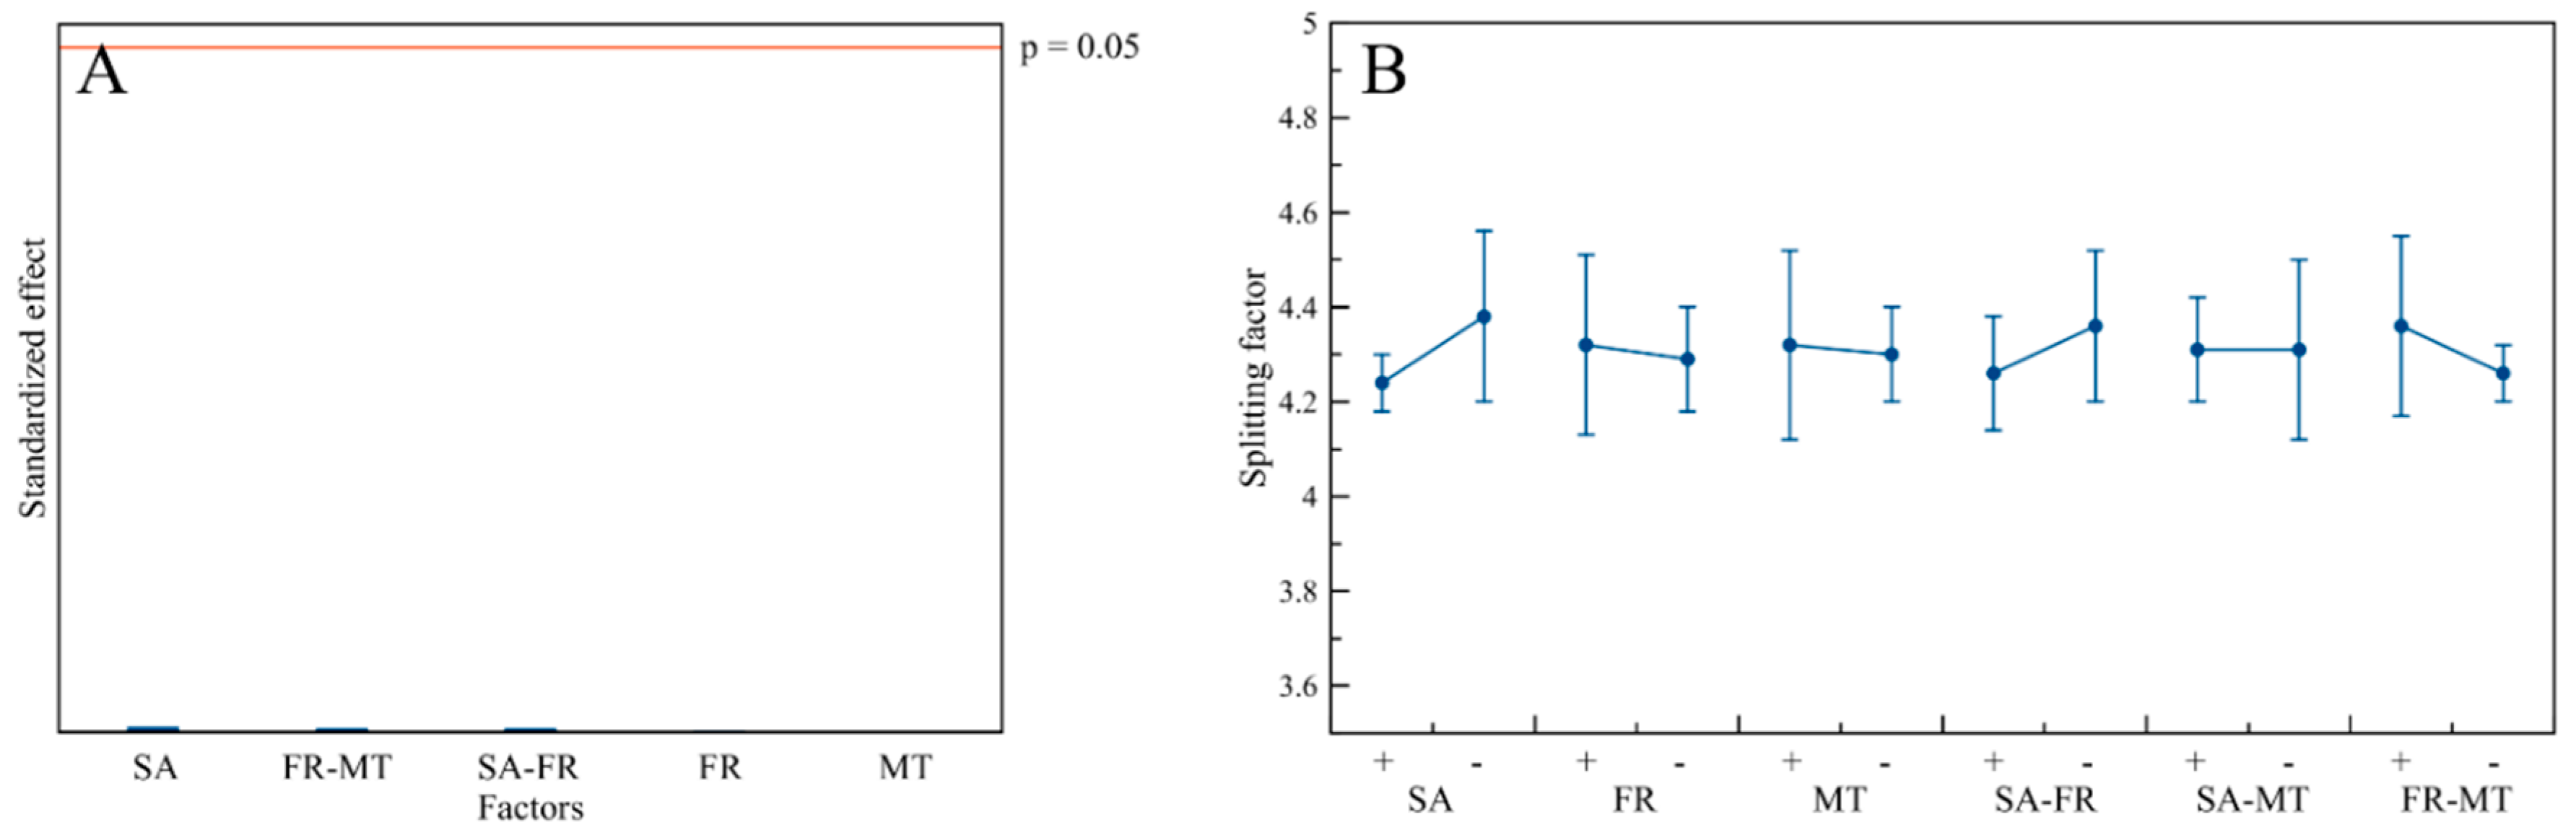
3.5. Influence of the Process Factors on CaP NPs’ Physico-Chemical Properties

On the basis of the statistical data analysis, the significance of the factors on the CaP NPs’ physico-chemical properties is reported in Table 5. Overall, the crystalline domain size and the crystalline domain aspect ratio are dependent on the MT factor. In particular, the higher maturation time induces the growth of the crystalline domains along the crystallographic c-axis, thus increasing the crystalline domain aspect ratio. Moreover, the same leads to the formation of Na3(Cit) and halite secondary phases in the solid samples. It is important to remark that Na3(Cit) and halite are water soluble phases that can be easily removed from the solid product, improving the washing steps.
On the other hand, all particle size parameters (Z-average, Dv(90), and PdI) are controlled by FR, where higher flow rates—hence, higher pressure and more efficient mixing—lead to NPs with significantly smaller size due to higher nucleation, limited particle growth and lower aggregation. Finally, some CaP NPs properties (D(310), SF, Ca/P molar ratio, yield, ζ-potential) were not related to the herein studied process parameters. Additional DoE investigations will be carried out in the future to study the influence of reagents concentration and other synthesis parameters on the production of CaP NPs.

3.6. Morphological Investigation

In order to select the most suitable samples for a potential scale-up production, the following selection criteria were used, in decreasing order of relevance: (i) smallest hydrodynamic diameter, (ii) lowest PdI, (iii) highest ζ-potential, (iv) lowest content of impurities, (v) highest yield. According to these criteria, samples from run 2 and run 5 were selected as the most interesting of the even- and odd-numbered runs, respectively, thus, they were analyzed by TEM. TEM micrographs (Figure 8) show that the two samples have similar morphology and are constituted by thin, needle-like nanoparticles. This morphology was previously observed for HA nanoparticles grown in the presence of citrate [42,55], where it was proved that HA nanocrystals have an anisotropic growth along the crystallographic c-axis and form platy, needle-like particles. Both run 5 and run 2 samples are constituted by NPs ca. 50 nm long and ca. 10 nm wide. No significant differences were observed between the two samples, meaning that MT has not influenced the morphology of the nanoparticles, as was indicated by DoE statistical data analysis.

4. Conclusions

The present work is among the first reports on the systematic evaluation by DoE of some of the most relevant process factors, i.e., maturation time, flow rate and sonication amplitude, on the production of CaP NPs obtained by continuous flow wet chemical precipitation aided by sonication. CaP NPs obtained by each of the tested runs were proven to be composed of poorly crystalline HA nanoparticles with small size and a high negative surface charge, associated, in some cases, with halite and Na3(Cit) impurities. Through the statistical DoE data analysis, it was found that CaP NPs’ dimensions are influenced mainly by reactor flow-through rate, while crystalline domain dimensions and crystalline domain anisotropy are influenced by the post-synthesis maturation process. It was also found that sonication amplitude does not have a statistically significant influence on any physico-chemical property in the tested conditions, and the NPs’ stoichiometry, crystallinity, yield, and surface charge are not influenced by the analyzed process factors. In addition, it was shown that the continuous flow process in comparison to batch precipitation allows one to achieve generally higher yields and shorter production times, and, in some cases, smaller and more homogenous CaP NPs.
The study here reported gives a proof of concept for the production of CaP NPs with suitable characteristics for nanomedical applications by a continuous precipitation process with larger yields in comparison to discontinuous batch reactions. The best conditions for achieving low CaP NPs size and polydispersity, and at the same time high purity, yield and surface charge, have been individuated and will be used as basis for further DoE experiments. The present work provides a deeper understanding of the relationships between reaction process factors and CaP NPs properties, and at the same time is a relevant contribution to the development of a cost-effective scalable process for the continuous production of CaP NPs for nanomedical or even other applications.

Supplementary Materials

The following are available online at https://www.mdpi.com/2073-4352/10/10/953/s1, Figure S1: Pareto chart of all standardized effects and their cumulative relative incidence for (A) the D(002) crystalline domain, (B) the D(310) crystalline domain, and (C) the D(002)/D(310) ratio. Figure S2. (A) PXRD pattern and (B) FT-IR spectrum in the 4000–400 cm−1 region of the batch CaP NPs. Figure S3: Pareto chart of all standardized effects and their cumulative relative incidence for (A) the Ca/P ratio and (B) yield. Figure S4. FT-IR spectra of the samples in the 4000–400 cm−1 region. (A) Odd-numbered runs and (B) even-numbered runs. Figure S5: Pareto chart of all standardized effects and their cumulative relative incidence for the splitting factor. Figure S6: Pareto chart of all standardized effects and their cumulative relative incidence for (A) Z-average, (B) PdI, and (C) ζ-potential.

Author Contributions

Conceptualization, M.I. and C.D.L.; investigation, L.D.E., A.D., C.F. and A.A.; data analysis and interpretation, L.D.E., C.F., E.Q. and A.D.; writing—original draft preparation, L.D.E. and M.I.; writing—review and editing, all authors; supervision, M.I., C.D.L., P.C. and D.C.; funding acquisition, D.C. All authors have read and agreed to the published version of the manuscript.

Funding

This research was funded in part by the European Union’s Horizon 2020 research and innovation program under project CUPIDO, grant agreement [No 720834].

Conflicts of Interest

The authors declare no conflict of interest.

References

  1. Wagner, V.; Dullaart, A.; Bock, A.-K.; Zweck, A. The emerging nanomedicine landscape. Nat. Biotechnol. 2006, 24, 1211–1217. [Google Scholar] [CrossRef] [PubMed]
  2. Arico, A.S.; Bruce, P.; Scrosati, B.; Tarascon, J.-M.; Van Schalkwijk, W. Nanostructured materials for advanced energy conversion and storage devices. In Materials for Sustainable Energy: A Collection of Peer-Reviewed Research and Review Articles from Nature Publishing Group; World Scientific: Singapore, 2011; pp. 148–159. [Google Scholar]
  3. Sattler, K.D. Handbook of Nanophysics: Nanoelectronics and Nanophotonics; CRC Press: Boca Raton, FL, USA, 2010. [Google Scholar]
  4. Wang, P.; Lombi, E.; Zhao, F.-J.; Kopittke, P.M. Nanotechnology: A new opportunity in plant sciences. Trends Plant Sci. 2016, 21, 699–712. [Google Scholar] [CrossRef]
  5. Agarwal, A.; Joshi, H. Application of nanotechnology in the remediation of contaminated groundwater: A short review. Recent Res. Sci. Technol. 2010, 2, 51–57. [Google Scholar]
  6. Dorozhkin, S.V. Bioceramics of calcium orthophosphates. Biomaterials 2010, 31, 1465–1485. [Google Scholar] [CrossRef] [PubMed]
  7. Dorozhkin, S.V.; Epple, M. Biological and Medical Significance of Calcium Phosphates. Angew. Chem. Int. Ed. 2002, 41, 3130–3146. [Google Scholar] [CrossRef]
  8. Uskoković, V.; Wu, V.M. Calcium phosphate as a key material for socially responsible tissue engineering. Materials 2016, 9, 434. [Google Scholar] [CrossRef]
  9. Uskoković, V. Ion-doped hydroxyapatite: An impasse or the road to follow? Ceram. Int. 2020, 46, 11443–11465. [Google Scholar] [CrossRef]
  10. Miragoli, M.; Ceriotti, P.; Iafisco, M.; Vacchiano, M.; Salvarani, N.; Alogna, A.; Carullo, P.; Ramirez-Rodríguez, G.B.; Patrício, T.; Degli Esposti, L.; et al. Inhalation of peptide-loaded nanoparticles improves heart failure. Sci. Transl. Med. 2018, 10, eaan6205. [Google Scholar] [CrossRef] [Green Version]
  11. Di Mauro, V.; Iafisco, M.; Salvarani, N.; Vacchiano, M.; Carullo, P.; Ramírez-Rodríguez, G.B.; Patrício, T.; Tampieri, A.; Miragoli, M.; Catalucci, D. Bioinspired negatively charged calcium phosphate nanocarriers for cardiac delivery of MicroRNAs. Nanomedicine 2016, 11, 891–906. [Google Scholar] [CrossRef] [Green Version]
  12. Victor, S.P.; Kumar, T.S.S. Tailoring calcium-deficient hydroxyapatite nanocarriers for enhanced release of antibiotics. J. Biomed. Nanotechnol. 2008, 4, 203–209. [Google Scholar] [CrossRef]
  13. Victor, S.P.; Paul, W.; Jayabalan, M.; Sharma, C.P. Supramolecular hydroxyapatite complexes as theranostic near-infrared luminescent drug carriers. CrystEngComm 2014, 16, 9033–9042. [Google Scholar] [CrossRef]
  14. Iafisco, M.; Drouet, C.; Adamiano, A.; Pascaud, P.; Montesi, M.; Panseri, S.; Sarda, S.; Tampieri, A. Superparamagnetic iron-doped nanocrystalline apatite as a delivery system for doxorubicin. J. Mater. Chem. B 2016, 4, 57–70. [Google Scholar] [CrossRef] [PubMed] [Green Version]
  15. Mostaghaci, B.; Loretz, B.; Lehr, C.M. Calcium Phosphate System for Gene Delivery: Historical Background and Emerging Opportunities. Curr. Pharm. Des. 2016, 22, 1529–1533. [Google Scholar] [CrossRef] [PubMed]
  16. He, Q.; Mitchell, A.; Morcol, T.; Bell, S.J. Calcium phosphate nanoparticles induce mucosal immunity and protection against herpes simplex virus type 2. Clin. Diagn. Lab. Immunol. 2002, 9, 1021–1024. [Google Scholar] [CrossRef] [Green Version]
  17. Ali, I. New generation adsorbents for water treatment. Chem. Rev. 2012, 112, 5073–5091. [Google Scholar] [CrossRef]
  18. Mori, K.; Yamaguchi, K.; Hara, T.; Mizugaki, T.; Ebitani, K.; Kaneda, K. Controlled synthesis of hydroxyapatite-supported palladium complexes as highly efficient heterogeneous catalysts. J. Am. Chem. Soc. 2002, 124, 11572–11573. [Google Scholar] [CrossRef]
  19. Yoon, H.Y.; Lee, J.G.; Esposti, L.D.; Iafisco, M.; Kim, P.J.; Shin, S.G.; Jeon, J.-R.; Adamiano, A. Synergistic Release of Crop Nutrients and Stimulants from Hydroxyapatite Nanoparticles Functionalized with Humic Substances: Toward a Multifunctional Nanofertilizer. ACS Omega 2020, 5, 6598–6610. [Google Scholar] [CrossRef] [PubMed] [Green Version]
  20. Ramírez-Rodríguez, G.B.; Dal Sasso, G.; Carmona, F.J.; Miguel-Rojas, C.; Pérez-de-Luque, A.; Masciocchi, N.; Guagliardi, A.; Delgado-López, J.M. Engineering Biomimetic Calcium Phosphate Nanoparticles: A Green Synthesis of Slow-Release Multinutrient (NPK) Nanofertilizers. ACS Appl. Bio Mater. 2020, 3, 1344–1353. [Google Scholar] [CrossRef]
  21. Rhee, S.-H. Synthesis of hydroxyapatite via mechanochemical treatment. Biomaterials 2002, 23, 1147–1152. [Google Scholar] [CrossRef]
  22. Kim, I.-S.; Kumta, P.N. Sol-gel synthesis and characterization of nanostructured hydroxyapatite powder. Mater. Sci. Eng. B 2004, 111, 232–236. [Google Scholar] [CrossRef]
  23. Drouet, C.; Bosc, F.; Banu, M.; Largeot, C.; Combes, C.; Dechambre, G.; Estournès, C.; Raimbeaux, G.; Rey, C. Nanocrystalline apatites: From powders to biomaterials. Powder Technol. 2009, 190, 118–122. [Google Scholar] [CrossRef] [Green Version]
  24. Jevtic, M.; Mitric, M.; Skapin, S.; Jancar, B.; Ignjatovic, N.; Uskokovic, D. Crystal structure of hydroxyapatite nanorods synthesized by sonochemical homogeneous precipitation. Cryst. Growth Des. 2008, 8, 2217–2222. [Google Scholar] [CrossRef]
  25. Di Chen, J.; Wang, Y.J.; Wei, K.; Zhang, S.H.; Shi, X.T. Self-organization of hydroxyapatite nanorods through oriented attachment. Biomaterials 2007, 28, 2275–2280. [Google Scholar] [CrossRef] [PubMed]
  26. Afshar, A.; Ghorbani, M.; Ehsani, N.; Saeri, M.; Sorrell, C. Some important factors in the wet precipitation process of hydroxyapatite. Mater. Des. 2003, 24, 197–202. [Google Scholar] [CrossRef]
  27. Kim, D.W.; Cho, I.-S.; Kim, J.Y.; Jang, H.L.; Han, G.S.; Ryu, H.-S.; Shin, H.; Jung, H.S.; Kim, H.; Hong, K.S. Simple large-scale synthesis of hydroxyapatite nanoparticles: In Situ observation of crystallization process. Langmuir 2010, 26, 384–388. [Google Scholar] [CrossRef]
  28. Chen, J.; Zheng, C.; Chen, G.A. Interaction of macro-and micromixing on particle size distribution in reactive precipitation. Chem. Eng. Sci. 1996, 51, 1957–1966. [Google Scholar] [CrossRef]
  29. Kazmierczak, T.; Schuttringer, E.; Tomažić, B.; Nancollas, G. Controlled composition studies of calcium carbonate and sulfate crystal growth. Croat. Chem. Acta 1981, 54, 277–287. [Google Scholar]
  30. Uskokovic, V. Challenges for the modern science in its descend towards nano scale. Curr. Nanosci. 2009, 5, 372–389. [Google Scholar] [CrossRef] [Green Version]
  31. Latocha, J.; Wojasiński, M.; Sobieszuk, P.; Ciach, T. Synthesis of hydroxyapatite in a continuous reactor: A review. Chem. Process Eng. 2018, 39, 281–293. [Google Scholar]
  32. Castro, F.; Ferreira, A.; Rocha, F.; Vicente, A.; Teixeira, J.A. Continuous-flow precipitation of hydroxyapatite at 37 C in a meso oscillatory flow reactor. Ind. Eng. Chem. Res. 2013, 52, 9816–9821. [Google Scholar] [CrossRef] [Green Version]
  33. Massart, D.L.; Vandeginste, B.G.; Buydens, L.; Lewi, P.; Smeyers-Verbeke, J.; Jong, S.D. Handbook of Chemometrics and Qualimetrics; Elsevier Science Inc.: Amsterdam, The Netherlands, 1998. [Google Scholar]
  34. Giardina, M.A.; Fanovich, M.A. Synthesis of nanocrystalline hydroxyapatite from Ca(OH)2 and H3PO4 assisted by ultrasonic irradiation. Ceram. Int. 2010, 36, 1961–1969. [Google Scholar] [CrossRef]
  35. Deng, S.; Lin, Z.T.; Tang, H.X.; Ullah, S.; Bi, Y.G. Rapid synthesis of hydroxyapatite nanoparticles via a novel approach in the dual-frequency ultrasonic system for specific biomedical application. J. Mater. Res. 2019, 34, 2796–2806. [Google Scholar] [CrossRef]
  36. Coelho, A. Topas Academic V5; Coelho Software: Brisbane, Australia, 2012. [Google Scholar]
  37. Hughes, J.M.; Cameron, M.; Crowley, K.D. Structural variations in natural F, OH, and Cl apatites. Am. Mineral. 1989, 74, 870–876. [Google Scholar]
  38. Walker, D.; Verma, P.K.; Cranswick, L.M.; Jones, R.L.; Clark, S.M.; Buhre, S. Halite-sylvite thermoelasticity. Am. Mineral. 2004, 89, 204–210. [Google Scholar] [CrossRef]
  39. Fischer, A.; Palladino, G. Trisodium citrate dihydrate. Acta Crystallogr. Sect. E Struct. Rep. Online 2003, 59, m1080–m1082. [Google Scholar] [CrossRef]
  40. Abràmoff, M.D.; Magalhães, P.J.; Ram, S.J. Image processing with ImageJ. Biophotonics Int. 2004, 11, 36–42. [Google Scholar]
  41. Martínez-Casado, F.J.; Iafisco, M.; Delgado-López, J.M.; Martínez-Benito, C.; Ruiz-Pérez, C.; Colangelo, D.; Oltolina, F.; Prat, M.; Gómez-Morales, J. Bioinspired Citrate–Apatite Nanocrystals Doped with Divalent Transition Metal Ions. Cryst. Growth Des. 2015, 16, 145–153. [Google Scholar] [CrossRef]
  42. Delgado-López, J.M.; Iafisco, M.; Rodríguez, I.; Tampieri, A.; Prat, M.; Gómez-Morales, J. Crystallization of bioinspired citrate-functionalized nanoapatite with tailored carbonate content. Acta Biomater. 2012, 8, 3491–3499. [Google Scholar] [CrossRef]
  43. Torrent-Burgués, J.; Gómez-Morales, J.; López-Macipe, A.; Rodríguez-Clemente, R. Continuous precipitation of hydroxyapatite from Ca/citrate/phosphate solutions using microwave heating. Cryst. Res. Technol. J. Exp. Ind. Crystallogr. 1999, 34, 757–762. [Google Scholar] [CrossRef]
  44. Dorozhkin, S.V. Calcium orthophosphates. J. Mater. Sci. 2007, 42, 1061–1095. [Google Scholar] [CrossRef]
  45. Iafisco, M.; Palazzo, B.; Martra, G.; Margiotta, N.; Piccinonna, S.; Natile, G.; Gandin, V.; Marzano, C.; Roveri, N. Nanocrystalline carbonate-apatites: Role of Ca/P ratio on the upload and release of anticancer platinum bisphosphonates. Nanoscale 2012, 4, 206–217. [Google Scholar] [CrossRef] [PubMed]
  46. Gómez-Morales, J.; Iafisco, M.; Delgado-López, J.M.; Sarda, S.; Drouet, C. Progress on the preparation of nanocrystalline apatites and surface characterization: Overview of fundamental and applied aspects. Prog. Cryst. Growth Charact. Mater. 2013, 59, 1–46. [Google Scholar] [CrossRef] [Green Version]
  47. Kawase, M.; Suzuki, T.; Miura, K. Growth mechanism of lanthanum phosphate particles by continuous precipitation. Chem. Eng. Sci. 2007, 62, 4875–4879. [Google Scholar] [CrossRef]
  48. Pieper, M.; Aman, S.; Hintz, W.; Tomas, J. Optimization of a continuous precipitation process to produce nanoscale BaSO4. Chem. Eng. Technol. 2011, 34, 1567–1574. [Google Scholar] [CrossRef]
  49. Gecim, G.; Donmez, S.; Erkoc, E. Calcium deficient hydroxyapatite by precipitation: Continuous process by vortex reactor and semi-batch synthesis. Ceram. Int. 2020. [Google Scholar] [CrossRef]
  50. Calabrese, G.S.; Pissavini, S. From batch to continuous flow processing in chemicals manufacturing. AIChE J. 2011, 57, 828–834. [Google Scholar] [CrossRef]
  51. Koutsopoulos, S. Synthesis and characterization of hydroxyapatite crystals: A review study on the analytical methods. J. Biomed. Mater. Res. 2002, 62, 600–612. [Google Scholar] [CrossRef] [PubMed]
  52. Lakhmanan, B. Infrared Absorption spectrum of sodium citrate. J. Indian Inst. Sci. 2013, 39, 27. [Google Scholar]
  53. Termine, J.D.; Posner, A.S. Infra-red determination of the percentage of crystallinity in apatitic calcium phosphates. Nature 1966, 211, 268–270. [Google Scholar] [CrossRef]
  54. Kandori, K.; Kuroda, T.; Togashi, S.; Katayama, E. Preparation of calcium hydroxyapatite nanoparticles using microreactor and their characteristics of protein adsorption. J. Phys. Chem. B 2011, 115, 653–659. [Google Scholar] [CrossRef]
  55. Ivanchenko, P.; Delgado-López, J.M.; Iafisco, M.; Gómez-Morales, J.; Tampieri, A.; Martra, G.; Sakhno, Y. On the surface effects of citrates on nano-apatites: Evidence of a decreased hydrophilicity. Sci. Rep. 2017, 7, 8901. [Google Scholar] [CrossRef] [PubMed] [Green Version]
Figure 1. Schematic representation of the experimental apparatus.
Crystals 10 00953 g001
Figure 2. Powder X-ray diffraction (PXRD) patterns of the CaP NPs samples. (A) Odd-numbered runs and (B) even-numbered runs.
Crystals 10 00953 g002
Figure 3. (A,C,E) Pareto chart of relevant standardized effects at the confidence limit of 95% and (B,D,F) plot of marginal means for (A,B) the D(002) crystalline domain, (C,D) the D(310) crystalline domain, and the (E,F) D(002)/D(310) ratio.
Crystals 10 00953 g003aCrystals 10 00953 g003b
Figure 4. (A,C) Pareto chart of relevant standardized effects at the confidence limit of 95% and (B,D) plot of marginal means for (A,B) Ca/P ratio and (C,D) yield.
Crystals 10 00953 g004
Figure 5. FT-IR spectra of the samples in the 1800–400 cm−1 region. (A) Odd-numbered runs and (B) even-numbered runs.
Crystals 10 00953 g005
Figure 6. (A) Pareto chart of relevant standardized effects at the confidence limit of 95% and (B) plot of marginal means for the splitting factor.
Crystals 10 00953 g006
Figure 7. (A,C,E) Pareto chart of relevant standardized effects at the confidence limit of 95% and (B,D,F) plot of marginal means for (A,B) Z-average, (C,D) PdI, and (E,F) ζ-potential.
Crystals 10 00953 g007
Figure 8. TEM micrograph of (A) run 5 and (B) run 2 samples.
Crystals 10 00953 g008
Table 1. Levels of factors and 23 experimental design matrix applied for the synthesis of calcium phosphate nanoparticles (CaP NPs).
LevelSonication Amplitude (SA, %)Flow Rate (FR, mL s−1)Maturation Time (MT, h)
Level −1200.70
Level +11002.824
Sample CodeDesign
Run 1+1+1+1
Run 2+1+1−1
Run 3+1−1+1
Run 4+1−1−1
Run 5−1+1+1
Run 6−1+1−1
Run 7−1−1+1
Run 8−1−1−1
Table 2. Composition and crystallographic parameters of CaP NPs samples.
Sample CodeComposition (wt. %)D(002) (nm)D(310) (nm)D(002)/D(310)Splitting Factor a
Hydroxyapatite (HA)Na3(Cit)Halite
Run 164.8 ± 0.534.3 ± 0.50.9 ± 0.138.5 ± 1.97.2 ± 0.95.3 ± 0.44.2 ± 0.1
Run 2100 ± 0.1--22.6 ± 1.16.1 ± 0.73.7 ± 0.54.2 ± 0.1
Run 387.6 ± 0.711.9 ± 0.70.5 ± 0.130.3 ± 1.56.1 ± 0.85.0 ± 0.64.3 ± 0.1
Run 4100 ± 0.1--24.2 ± 1.25.7 ± 0.74.2 ± 0.44.2 ± 0.1
Run 569.9 ± 0.429.3 ± 0.40.9 ± 0.134.3 ± 1.76.1 ± 0.65.6 ± 0.64.6 ± 0.1
Run 6100 ± 0.1--22.6 ± 1.25.5 ± 0.54.1 ± 0.34.3 ± 0.1
Run 790.2 ± 0.79.5 ± 0.70.4 ± 0.132.2 ± 1.65.0 ± 0.66.4 ± 0.54.2 ± 0.1
Run 8100 ± 0.1--23.8 ± 1.26.1 ± 0.73.9 ± 0.34.4 ± 0.1
Batch100 ± 0.1--24.0 ± 1.17.1 ± 0.53.4 ± 0.43.5 ± 0.1
a Calculated from FT-IR spectra: the measure consists on sum of the heights of the stretching of phosphates peaks at 603 and 560 cm−1 and divided by the height of the valley between them at ca. 588 cm−1; all heights were measured above a baseline drawn from approximately 780–495 cm−1 [11].
Table 3. Ca/P molar ratio of CaP NPs samples.
Sample Code Ca/PYield (g L−1)Corrected Yield (g L−1)
Run 11.50 ± 0.013.8 ± 0.42.5 ± 0.3
Run 21.53 ± 0.012.6 ± 0.32.6 ± 0.3
Run 31.52 ± 0.013.4 ± 0.43.0 ± 0.3
Run 41.52 ± 0.012.6 ± 0.32.6 ± 0.3
Run 51.49 ± 0.013.5 ± 0.22.5 ± 0.2
Run 61.54 ± 0.012.8 ± 0.32.8 ± 0.3
Run 71.51 ± 0.013.4 ± 0.33.1 ± 0.3
Run 81.59 ± 0.012.9 ± 0.32.9 ± 0.3
Batch1.50 ± 0.011.6 ± 0.21.6 ± 0.2
Table 4. Dynamic light scattering (DLS) and electrophoretic mobility analysis of CaP NPs samples.
Sample CodeZ-Average (nm)Dv(90) (nm)PdIζ-Potential
Run 162 ± 261 ± 30.28 ± 0.04−23.3 ± 4.6
Run 274 ± 470 ± 80.25 ± 0.01−28.6 ± 0.7
Run 3140 ± 12398 ± 1300.50 ± 0.02−33.6 ± 2.3
Run 4126 ± 5336 ± 1510.42 ± 0.01−24.5 ± 1.3
Run 561 ± 462 ± 40.27 ± 0.05−31.3 ± 4.7
Run 691 ± 897 ± 270.25 ± 0.01−31.3 ± 2.7
Run 7124 ± 12175 ± 780.39 ± 0.02−33.6 ± 0.5
Run 8135 ± 36151 ± 680.42 ± 0.01−32.6 ± 1.4
Batch87 ± 190 ± 90.41 ± 0.01−19.1 ± 2.1
Table 5. Summary of process factors and their significance on CaP NPs’ physico-chemical properties. The arrows indicate whether an increase in the factor leads to an increase (↑) or a decrease (↓) in the physico-chemical properties.
Factors Response Parameter
D(002)D(310)D(002)/D(310)Ca/PYieldSplitting FactorZ-AveragePdIζ-Potential
SA---------
FR------(↓)(↓)-
MT(↑)-(↑)------
SA-FR---------
SA-MT---------
FR-MT---------
Publisher’s Note: MDPI stays neutral with regard to jurisdictional claims in published maps and institutional affiliations.

