Abstract
In this study, we investigated the electrochemical reduction of carbon dioxide (CO2) using a phosphorus-doped polycrystalline diamond (PDD) electrode and compared it with a conventional boron-doped diamond (BDD) electrode. In the reduction reaction of CO2 in a 0.5 M KCl aqueous solution, the PDD electrode showed high selectivity for formic acid production over a wide potential range. This tendency was particularly evident at potentials below −1.8 V (vs. RHE). Moreover, at more negative potentials of −2.4 V and −2.6 V, formic acid remained the dominant product, while hydrogen evolution was the main reaction on the BDD electrode at the negative potentials. Similarly, in electrochemical reduction using an 0.1 M KClO4 aqueous solution, carbon monoxide was confirmed to be a major product, and hydrogen generation was effectively suppressed in a more negative potential range. In other words, PDD is a promising electrode material that can efficiently convert CO2 into valuable chemicals while suppressing hydrogen evolution, even in negative potential regions.
1. Introduction
Currently, research is being conducted on the conversion of CO2 into valuable resources. The methods for converting CO2 into value-added products include photochemical reactions [1], organic synthesis [2], and electrochemical reduction [3]. In particular, electrochemical reduction has attracted attention as a method for converting CO2 at normal temperature and pressure. Electrochemical reduction can convert CO2 dissolved in an electrolyte into valuable substances, such as formic acid and CO. However, because the redox reaction of CO2 proceeds at a more negative potential, hydrogen is generated as a competitive reaction at the metal electrode, which reduces the efficiency of conversion into valuable products. Boron-doped diamond (BDD) electrodes have been demonstrated to be effective for suppressing hydrogen evolution [4,5].
Compared with metal electrodes, BDD electrodes have a wide potential window, which allows the CO2 reduction reaction to proceed while suppressing hydrogen evolution. We achieved a high faradaic efficiency of over 90% for formic acid production through the electrochemical reduction of CO2 using a BDD electrode [6].
Research into the electrochemical reduction of CO2 using BDD electrodes has progressed from fundamental research to industrial applications. This includes the optimization of flow systems that circulate the electrolyte during electrolysis [7] and the control of ion transport to enable stable long-term operation [8]. However, BDD electrodes are required to achieve high product yields for practical industrial applications. Thus, the efficient production of formic acid at high current densities is necessary.
In general, as the current density increases during CO2 reduction, the applied potential becomes more negative, leading to hydrogen evolution as a competing reaction. Despite the wide potential window of BDD electrodes, hydrogen evolution must be suppressed under highly negative potentials to preferentially promote CO2 reduction. In other words, the competing hydrogen evolution reaction (HER) must be suppressed in order to achieve high efficiency.
As a solution to this problem, we focused on phosphorus-doped polycrystalline diamond (PDD) electrodes. However, only a few electrochemical studies have applied dopants other than boron for diamond electrodes [9,10,11]. To date, nitrogen and phosphorus have been applied as alternative dopants. Nitrogen, with a covalent radius (0.77 Å) closest to that of carbon, has been considered to be a promising dopant. However, owing to its deep donor level (1.7 eV) [12], it does not contribute to the electrical conductivity at room temperature.
Phosphorus is a promising dopant owing to its relatively shallow donor level (0.6 eV) [13]. Several doping experiments have been conducted to incorporate phosphorus into diamond [14,15]. However, phosphorus doping has proven to be extremely challenging. A growing number of reports have demonstrated phosphorus doping concentrations of up to 1020 cm−3 [16,17]. However, the electrode size remains limited owing to the use of single-crystal growth. Few studies, including our previous work, have investigated polycrystalline growth for electrochemical applications [18].
As phosphorus dopants occupy high energy levels, the Fermi level is elevated. Therefore, diamond electrodes with high phosphorus doping concentrations, which exhibit enhanced electrical conductivity, are expected to facilitate electrochemical reduction reactions by utilizing high-energy conduction band electrons and thus should be effective for CO2 reduction [19,20]. Previous studies [19] reported that CO2 reduction currents were observed on PDD electrodes by linear sweep voltammetry, and that formic acid was identified as the product by constant-potential electrolysis. However, quantitative evaluation of product formation, such as Faradaic efficiency, as well as potential-dependent product distribution and competition with hydrogen evolution, has not been investigated. In this study, CO2 electroreduction on PDD electrodes was systematically analyzed with a focus on the competition with hydrogen evolution, revealing the potential-dependent behavior of product formation and its correlation with charge-transfer resistance under highly cathodic conditions.
These results, in comparison with conventional BDD electrodes, demonstrate the impact of dopant species on CO2 reduction efficiency and suppression of hydrogen evolution, providing design guidelines for diamond-based electrodes for efficient CO2 electroreduction.
2. Results and Discussion
2.1. Characterization of the PDD Electrode
The surface analysis results of the fabricated PDD film are shown in Figure 1a. The grown surfaces were confirmed to be polycrystalline. The grain size was ~1 µm, and the dominant facet was (111). The Raman spectra are shown in Figure 1b. The peak at ~1332 cm−1 is derived from the first-order diamond phonon, and the peak at ~1540 cm−1 is derived from sp2 carbon.

Figure 1.
Characterization of the PDD electrode: (a) SEM image, (b) Raman spectrum, and (c) SIMS depth profiles of P, H, and B atoms in phosphorus-doped diamond grown on a Si substrate.
To perform peak analysis of the Raman spectra, baseline correction was first applied to the spectra, followed by peak fitting using a mixed Gaussian–Lorentzian function. The fitting parameters included the peak position, peak intensity, and the full width at half maximum (FWHM). Undoped diamond peak is located at 1332 cm−1, and phosphorus doped diamond synthesized exhibits a shifted peak at 1331.6 cm−1. The peak shift in diamond was caused by lattice distortion and changes in phonon vibrations resulting from phosphorus doping [17].
This behavior is consistent with that of conventionally synthesized electrodes [18], indicating a tendency related to phosphorus doping.
On the other hand, the broad peak at ~1580 cm−1 originates from non-diamond components (sp2 bonds). This is presumed to result from the detection of components located at the grain boundaries owing to the small diamond grain size, or from the formation of crystal defects induced by phosphorus doping.
Furthermore, the phosphorus concentration in the diamond film, measured using SIMS, was 7.8 × 10¹⁹ atoms/cm3 (Figure 1c). Boron signal observed in the SIMS analysis corresponds to the background level of the instrument.
2.2. Electrochemical Properties
Figure S1 shows the CV profiles for the PDD electrode and a 0.1% BDD reference electrode. To compare the potential windows, CV measurements were performed in 0.1 M HClO4 aqueous solution over the potential range of −2.7 to 3.3 V (vs. RHE) at a scan rate of 0.1 V s−1 (Figure S1a). The potential window was defined as the potential difference at which the current density reached 250 μA cm−2 in the anodic and cathodic directions, respectively. As a result, the potential window of the PDD electrode was 4.8 V, whereas that of the BDD electrode was 3.4 V, indicating that the PDD electrode exhibits a wider potential window. To evaluate the electron transfer reactivity at the electrode surface, CV measurements were performed in an aqueous solution of 1 mM [Ru(NH3)6]Cl3 over a potential range from −0.4 to 1.4 V (vs. RHE) (Figure S1b). The reactivity of the redox couple [Ru(NH3)6]3+/2+ was assessed using the peak-to-peak separation (ΔEp) as an indicator. The ΔEp value for the PDD electrode was 0.53 V, whereas that for the BDD electrode was 0.11 V, indicating that the BDD electrode possessed superior electron-transfer characteristics.
The semiconductor properties of each electrode were evaluated from the Mott–Schottky plots obtained using EIS (Figure S2).
Phosphorus-doped diamonds behave as n-type semiconductors [9]. In the case of the PDD electrode, the Mott–Schottky plot exhibits a positive slope, which is consistent with n-type semiconducting behavior. By contrast, the BDD electrode exhibits a negative slope, indicating p-type semiconducting behavior. These results clearly reflect the semiconducting properties of the respective dopants. The relationship between the capacitance (C) at the electrode–electrolyte interface and the applied potential (E) is expressed by the following equation:
where Efb is the flat-band potential, E is the electrode potential, e is the electronic charge, ε0 is the permittivity of free space, εsc is the permittivity of diamond, and ND is the carrier density. The intercept at the potential axis can be approximated as the flat-band potential Efb because kT/e is almost zero at room temperature (298 K). Equation (2) was used to calculate the carrier density from the slope of the Mott–Schottky plots. The calculated carrier densities were 1.9 × 1018 cm−3 for the PDD electrode and 5.3 × 1019 cm−3 for the BDD electrode.
The flat-band potentials were estimated to be approximately −2.9 V (vs. RHE) for the PDD electrode and 1.7 V (vs. RHE) for the BDD electrode. Based on these values, schematic energy band diagrams were constructed to provide a qualitative comparison of their electronic structures. The estimated positions of the valence and conduction bands were found to be broadly comparable for the two electrodes, suggesting that their bulk electronic energy levels are similar.
It should be noted that these band diagrams represent idealized bulk semiconductor properties derived from Mott–Schottky analysis. Under actual electrochemical reaction conditions, interfacial charge transfer can be further influenced by surface states, non-ideal band alignment, and reaction-specific kinetics. Nevertheless, the energy band diagram estimated for the PDD electrode is in good agreement with those reported in previous studies [10], supporting the validity of the present analysis.
2.3. LSV Measurements Before and After CO2 Bubbling
To evaluate the CO2 reduction characteristics, linear sweep voltammetry (LSV) was performed using a solution purged with N2 and a solution saturated with CO2. The catholyte and anolyte were 0.5 M KCl and 0.5 M KOH aqueous solutions, respectively. Measurements were conducted over the potential range from 0 to –2.6 V (vs. RHE) at a scan rate of 0.1 V s−1, as shown in Figure 2.
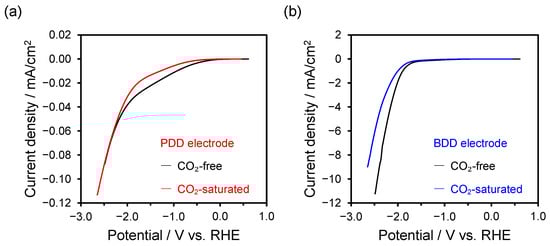
Figure 2.
LSV curves after CO2 bubbling (red or blue line) and N2 bubbling (black line) in aqueous solutions of 0.5 M KCl as catholyte and 0.5 M KOH as anolyte at a scan rate of 0.1 V s−1: (a) PDD electrode and (b) BDD electrode.
As shown in Figure 2a, the LSV curve of the PDD electrode exhibited a decrease in current density around −0.5 V after CO2 bubbling, compared with after N2 bubbling. The current density significantly increased at potentials more negative than −2.0 V. By contrast, as shown in Figure 2b, the current density of the BDD electrode increased between −1.5 V and −2.2 V, followed by a decrease at potentials more negative than −2.2 V.
These results indicate that for the PDD electrode in the CO2-saturated solution, the current density increased when the potential was more negative than −2.0 V. This indicates that the potential region conducive to the reaction with CO2 is relatively higher than that of the PDD electrode.
2.4. Electrochemical Reduction of CO2 Using PDD Electrode
The electrochemical reduction of CO2 was conducted in a two-compartment cell with 0.5 M KCl aqueous solution as the catholyte and 0.5 M KOH aqueous solution as the anolyte. To maintain a constant CO2 concentration during the reaction, CO2 gas was continuously purged at a flow rate of 13 mL min–1. The applied potential was varied from −1.4 to −2.6 V (vs. RHE), and the faradaic efficiency of each product was evaluated at each potential (Figure 3a,b). For the PDD electrode, the faradaic efficiencies were calculated from the average of three independent measurements. The list of FE(%) for each potential is shown in Table S1.
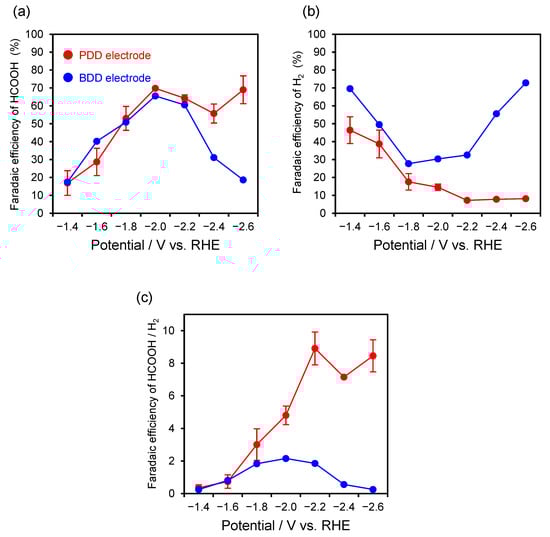
Figure 3.
Dependency of the applied potential on the faradaic efficiencies of formic acid (a) and hydrogen (b) production via electroreduction of CO2 using PDD (red line) and BDD (blue line) electrodes in 0.5 mol L−1 KCl aqueous solution; (c) ratio of the faradaic efficiencies of formic acid to hydrogen (HCOOH/H2).
Formic acid was obtained as the main product in the investigated potential range. The faradaic efficiency of formic acid production increased as the applied potential shifted from −1.4 V toward more negative values, and a maximum efficiency of 70% was obtained at −2.0 V. Formic acid has been reported to be the main reaction product in the electrochemical reduction of CO2 using a BDD electrode in KCl aqueous solution [6], and a similar reaction trend was observed for the fabricated PDD electrode.
For comparison, the results for CO2 electrochemical reduction using the 0.1% BDD electrode are shown in Figure 3 (blue line). The faradaic efficiency of formic acid production showed a potential dependence similar to that of the PDD electrode. A maximum efficiency of 66% was obtained at −2.0 V. However, for the BDD electrode, hydrogen evolution was more prominent than for the PDD electrode at each applied potential, clearly evidencing the competing reaction.
To compare the selectivity toward formic acid production, the ratio of the faradaic efficiencies of formic acid to hydrogen (HCOOH/H2) was calculated (Figure 3c). The PDD electrode showed no significant difference in the formic acid ratio compared with the BDD electrode at −1.4 and −1.6 V. However, the selectivity for formic acid production was high at potentials more negative than −1.8 V. Notably, the ratio reached ~8.9 at −2.2 V; this high selectivity was maintained at even more negative potentials (−2.4 and −2.6 V). These results indicate that the fabricated PDD electrode exhibits high selectivity for CO2 reduction into formic acid over a wide potential range, with effective suppression of the HER, particularly at higher potentials.
In CO2 electrochemical reduction using BDD electrodes, the presence of sp2 carbon has been reported to significantly influence the HER [21]. The sp2 carbon promotes the HER during CO2 reduction, thereby decreasing formic acid production. The Raman spectrum of the PDD electrode confirmed the presence of sp2 carbons (Figure 1b).
To compare the sp2 carbon content in the diamond films, the intensity ratio of the sp2 peak intensity to the sp3 peak intensity in the Raman spectra was calculated. The peak intensity ratio for the PDD electrode was calculated to be 0.45, whereas that for the BDD electrode was 0 owing to the barely observable sp2 carbon peak. In general, electrodes with higher sp2 carbon contents are expected to preferentially promote the HER. However, in this study, the PDD electrode was found to be more effective at suppressing the HER than the BDD electrode. This apparent contradiction suggests that, for PDD electrodes, the influence of phosphorus doping and semiconductor-related charge-transfer behavior can outweigh the conventional role of sp2 carbon in governing HER activity.
Furthermore, CO2 electrochemical reduction was performed using a 0.1 M KClO4 aqueous solution as the electrolyte (Figure S3). The PDD electrode produced CO as the main product, and hydrogen evolution was significantly suppressed, even at more negative potentials. However, the BDD electrode became dominant in the HER, and CO production was significantly reduced.
These results demonstrate that in the electrochemical reduction of CO2 using the PDD electrode, the high selectivity for the main product was maintained over a wide potential range, independent of the electrolyte type. The products of the electrochemical reduction of CO2 using the PDD electrode were similar to those obtained using the BDD electrode; however, the PDD electrode notably suppressed the competing HER at a more negative potential.
This indicates that phosphorus doping affects the catalytic CO2 reduction reaction. As a catalyst, phosphorus reportedly promotes CO2 adsorption [22] and lowers the free-energy barrier for the conversion of the *CO2 intermediate to *COOH [23]. Therefore, the surface of the PDD electrode provides a more favorable environment for CO2 reaction pathways.
The factors responsible for the higher formic acid selectivity of the PDD electrode for CO2 electrochemical reduction were analyzed using Tafel plots.
The Tafel plots calculated from the faradaic efficiencies obtained in the CO2 reduction reaction are shown in Figure 4, and the Tafel slopes, exchange current densities (j0), and charge transfer coefficients (α) calculated from the Tafel plots are shown (Table 1).
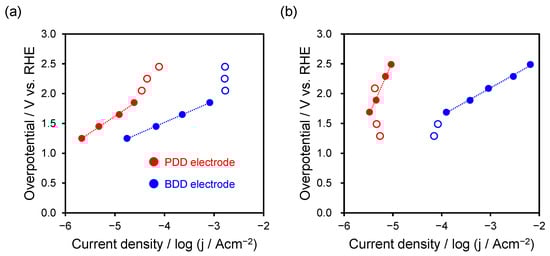
Figure 4.
Tafel plot calculated using faradaic efficiencies of (a) formic acid and (b) hydrogen production. The red and blue lines correspond to the PDD and BDD electrodes, respectively. And, Red/blue hollow circles are excluded from the Tafel fitting.

Table 1.
Tafel analysis results for formic acid production and hydrogen evolution on PDD and BDD electrodes (slopes, exchange current densities, and charge transfer coefficients).
Figure 4a shows the results of formic acid production. To calculate the overpotential, the solution resistance was measured, and iR correction was applied.
The equilibrium potential for the formic acid production reaction (CO2 + 2H+ + 2e− → HCOOH) was determined to be Eeq = −0.199 V (vs. RHE) under conditions of 25 °C and pH 4.3. In the Tafel plots, the curves bend in the potential range of –1.2 to −1.8 V. This potential region is considered to be under mixed control owing to factors such as mass-transport limitations, local pH effects, and gas-bubble adhesion. Therefore, this region was excluded from the analysis. The Tafel slopes obtained for the PDD and BDD electrodes were 556 and 361 mV/dec, respectively, indicating faster kinetics of formic acid production on the BDD electrode.
Figure 4b shows the results for the competing HER (2H+ + 2e− → H2). This equilibrium potential was set to Eeq = 0 V (vs. RHE) at 25 °C and pH 7. The curves bend in the potential range of 1.3−1.5 V, so this region was excluded from the analysis. The Tafel slopes were 1850 and 461 mV/dec for the PDD and BDD electrodes, respectively, indicating faster reaction kinetics for the BDD electrode.
Furthermore, the exchange current density was calculated from the Tafel slope b and intercept a using the relation j0 = 10−a/b.
The apparent kinetic parameters derived from the Tafel analysis are listed in Table 1. For formic acid production, the PDD and BDD electrodes exhibited comparable exchange current densities (1.2 × 10⁻⁸ and 6.3 × 10⁻⁹ A cm−2, respectively), indicating similar intrinsic activity toward CO2 reduction. This is consistent with the experimental observation that both electrodes produced formic acid as the main product, with a slightly higher selectivity for the PDD electrode over a wide potential range.
By contrast, for the competing HER, the apparent exchange current density of the PDD electrode (4.2 × 10⁻⁷ A cm−2) was higher than that of the BDD electrode (2.8 × 10⁻⁸ A cm−2). However, this value should not be interpreted as indicating faster intrinsic kinetics. The seemingly large j0 value reflects the influence of the semiconductor/electrolyte interface, where charge transfer across the space–charge region dominates under cathodic polarization. As a result, the PDD electrode exhibits a higher apparent j0 value but overall lower hydrogen-evolution activity, consistent with the experimentally observed faradaic efficiencies.
The charge-transfer coefficients (α) calculated from the Tafel slopes further support this interpretation. For formic acid production, α = 0.053 on the PDD electrode and 0.082 on the BDD electrode, indicating a slightly higher electron-transfer barrier on the PDD surface. By contrast, for hydrogen evolution, the PDD electrode exhibited α = 0.016. Such a low value cannot be explained solely by the reaction kinetics; it indicates that band bending and charge depletion within the n-type diamond limit the effective surface electron density available for proton reduction. This phenomenon is characteristic of wide-bandgap semiconductors, in which charge transport through the space–charge region, rather than through the interfacial reaction step, governs the apparent kinetics.
The remarkably large Tafel slope for hydrogen evolution on the PDD electrode (1850 mV dec−1) compared with that on the BDD electrode (461 mV dec−1) also confirms the strong influence of interfacial charge-transport limitation. These results suggest that the suppressed HER activity on the PDD electrode cannot be explained solely by intrinsic reaction kinetics. Rather, the semiconducting nature of PDD, together with surface electronic states and reaction-specific charge-transfer characteristics, likely contributes to limiting proton-coupled electron transfer under highly cathodic conditions. Consequently, electrons are preferentially utilized for CO2 reduction, leading to enhanced selectivity for formic acid over a wide potential range. These findings highlight that the apparent kinetic parameters of diamond electrodes cannot be interpreted solely in terms of classical metallic Tafel behavior, but must be analyzed considering semiconductor band structures and interfacial phenomena.
Furthermore, Electrochemical impedance spectroscopy (EIS) measurements were performed to evaluate the interfacial charge transfer behavior of PDD and BDD electrodes in 0.5 M KCl electrolyte under CO2-saturated and CO2-free conditions. The Nyquist plots were analyzed using an equivalent circuit consisting of a solution resistance (Rs) and a parallel combination of charge transfer resistance (Rct) and a constant phase element (CPE), which represents a non-ideal interfacial capacitance. Based on this analysis, the interfacial electron transfer characteristics were compared as a function of the applied potential. The measurement results are shown in Figure 5.
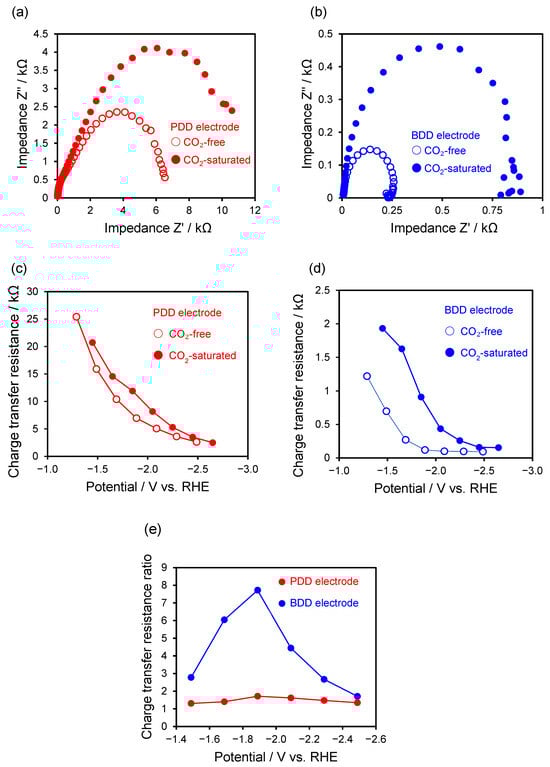
Figure 5.
Nyquist plots measured at −1.9 V for (a) the PDD electrode and (b) the BDD electrode under CO2-saturated and CO2-free conditions. Potential-dependent charge transfer resistance for (c) the PDD electrode and (d) the BDD electrode under CO2-saturated and CO2-free conditions. (e) Ratio of charge transfer resistance obtained under CO2-saturated and CO2-free conditions (Rct, CO2/Rct, free) for the PDD and BDD electrodes. The Rct ratio exhibits a maximum around −1.9 V, which corresponds to the potential region where the Faradaic efficiency for formate production is maximized.
For the PDD electrode, the absolute values of the charge transfer resistance remained relatively large over the entire investigated potential range, while the differences between CO2-saturated and CO2-free conditions were modest and remained within the same order of magnitude. This observation indicates that the introduction of CO2 does not drastically alter the overall interfacial electron transfer properties of the PDD electrode. However, when the ratio of Rct measured under CO2-saturated to CO2-free conditions was considered, a clear potential-dependent behavior was observed, showing a pronounced maximum around −1.9 V. This potential region coincides with that where the Faradaic efficiency for formate production reaches its maximum.
These results suggest that, although the absolute difference in Rct at a given potential is relatively small, the presence of CO2 selectively influences the interfacial electron transfer processes associated with CO2 reduction in specific potential regions. In particular, the relatively large Rct observed for the PDD electrode reflects a suppression of proton-coupled electron transfer corresponding to the Volmer step of the hydrogen evolution reaction (HER), rather than a deterioration of intrinsic electrode activity. As a consequence, the competitive HER is relatively suppressed, leading to a preferential promotion of CO2 reduction, especially formate formation.
In contrast, the BDD electrode exhibited more pronounced differences in Rct depending on the presence of CO2, with significant variations observed over the entire potential range. This behavior indicates that HER proceeds more readily on the BDD electrode than on the PDD electrode and that the interfacial electron transfer processes on BDD are strongly influenced by the electrolyte conditions. Thus, the competition between HER and CO2 reduction is more pronounced on the BDD electrode, making the control of reaction selectivity more challenging.
Overall, these results demonstrate that, for the PDD electrode, the maintenance of a suppressed interfacial electron transfer state effectively inhibits HER. Through the strong correspondence between the potential dependence of the Rct ratio and the Faradaic efficiency for formate production, this interfacial charge transfer behavior is shown to play a key role in enhancing the selectivity toward CO2 reduction.
3. Materials and Methods
3.1. Preparation of PDD Electrode
The PDD electrode was deposited onto a Si substrate (size: Φ20 mm) using a microwave plasma-assisted chemical vapor deposition method. A schematic of the equipment used is shown in Figure S4. Diamond growth was conducted using CH4–H2-based reaction gases. Phosphorus doping was achieved by sublimating red phosphorus through heating at 390 °C using a ceramic heater. The Si substrate was placed on a Mo holder at the center of the reactor, where the plasma ball was generated. The substrate was polished by diamond powder (0.2 µm) and subsequently cleaned via ultrasonication in methanol. The synthesis conditions for depositing the PDD films were as follows.
- (1)
- Plasma stabilization and nucleationCH4:H2 = 0.5:200 sccm; gas pressure: 50 torr; microwave power: 0.6 kW; substrate temperature: 700 °C; synthesis time: 30 min
- (2)
- Deposition of PDDCH4:H2 = 0.5:500 sccm; gas pressure: 75 torr; microwave power: 1.0 kW; substrate temperature: 930 °C; synthesis time: 8 h; heating temperature of red phosphorus: 390 °C
Information on the BDD electrode used as the reference electrode is shown in Figure S5.
3.2. Electrochemical Properties of PDD Electrode
The morphological and compositional characteristics of the diamond films were examined by a combination of surface and spectroscopic analyses. Surface morphologies were observed using scanning electron microscopy (SEM; Hitachi, SU-70, Tokyo, Japan), while the structural quality of the films was assessed by Raman spectroscopy (Raman; Renishaw, in Via Raman Microscope, London, UK.). The phosphorus concentration incorporated in the diamond films was quantified by secondary ion mass spectrometry (SIMS; CAMECA IMS-7f, Gennevilliers, France).
Electrochemical properties of the phosphorus-doped diamond (PDD) electrodes were investigated using a conventional three-electrode configuration. The PDD films served as the working electrode, with a platinum electrode as the counter electrode and an Ag/AgCl (saturated KCl) electrode as the reference. Cyclic voltammetry (CV) measurements were first carried out in a 0.1 M HClO4 aqueous solution at a scan rate of 0.1 V s−1 to determine the potential window of the PDD electrodes. The potential window was defined as the potential range between the anodic and cathodic limits corresponding to a current density of ±250 μA cm−2.To evaluate the intrinsic electrochemical behavior of the PDD electrodes, CV measurements were subsequently performed in an aqueous solution containing 1 mM [Ru(NH3)6]Cl3 and 0.1 M KCl at the same scan rate. In addition, electrochemical impedance spectroscopy (EIS) was employed to estimate the depletion-layer capacitance, which was used to analyze the carrier concentration and energy band structure of the electrodes. Mott–Schottky plots were constructed from the capacitance data obtained at a fixed frequency of 500 Hz. The applied potential was scanned from 0.26 to −0.74 V (vs. RHE) with an AC amplitude of 10 mV in a 0.1 M HClO4 aqueous solution. Because the electrochemical response of diamond electrodes is strongly influenced by surface termination, all electrochemical measurements were conducted using oxygen-terminated diamond surfaces. Hydrogen-terminated surfaces were avoided due to their high surface conductivity. The oxygen-terminated surfaces were prepared by irradiation with a low-pressure mercury lamp (Sen Lights Corp., UVB40, Osaka, Japan.) at 254 nm for 60 min. Oxidation of the electrode surface was confirmed using X-ray photoelectron spectroscopy (Figure S6).
The CO2 reduction reaction was performed in a batch-type cell divided into two compartments by a Nafion membrane (NRE-212) (Figure S7). The PDD electrode was used as the working electrode. A Pt wire and Ag/AgCl (in saturated KCl) were used as the counter and reference electrodes, respectively. A 0.1% BDD electrode was used for comparison with the PDD electrode. The catholyte and anolyte were aqueous solutions of 0.5 M KCl and 0.5 M KOH, respectively. N2 gas was bubbled into the catholyte for 15 min at a gas flow rate of 200 mL min−1 to remove the dissolved oxygen, then CO2 gas was bubbled for 15 min at a gas flow rate of 250 mL min−1 to saturate it with CO2. During electrolysis, CO2 was bubbled into the solution at a flow rate of less than 13 mL min–1.
To investigate the relationship between applied potential and reduction product, electrochemical reduction experiments were conducted by varying the potential from –1.4 to −2.6 V (vs. RHE) to determine the optimal potential.
After electrolysis, the liquid-phase products were quantified using high-performance liquid chromatography (CDD-10A, Shimadzu Corp., Kyoto, Japan.). The gaseous products were collected in an aluminum gas bag (GL Sciences Corp., Tokyo, Japan.) and analyzed using gas chromatography (GC-2014, Shimadzu Corp.).
3.3. Materials and Reagents
KClO4, KCl, HClO4, KOH, [Ru(NH3)6]Cl3 were purchased from FUJIFILM Wako Pure Chemical Corporation. Formic acid (FUJIFILM Wako Pure Chemical Corp., Osaka, Japan.), formaldehyde solution (37 wt % in H2O, contains 10−15% methanol; Sigma-Aldrich, St. Louis, MA, USA), methanol (Tokyo Chemical Industry Co., Ltd., Tokyo, Japan.), and ethanol (Kanto Chemical Co., Inc., Tokyo, Japan.) were used to make standard solutions for quantitative analysis. All the chemicals were used without any purification. All the aqueous solutions were prepared from ultrapure water with a resistivity of 18.2 MΩcm at 25 °C obtained from a DIRECT-Q UV3 system (Millipore Corp., Burlington, MA, USA.).
4. Conclusions
The electrochemical reduction of CO2 was performed using PDD electrodes. Formic acid was the main product in KCl aqueous solution, whereas CO was predominantly produced in KClO4 aqueous solution. Furthermore, owing to the suppression of hydrogen evolution, the production rates of the main products at more negative potentials were higher than those observed using the BDD electrodes.
Supplementary Materials
The following supporting information can be downloaded at https://www.mdpi.com/article/10.3390/catal16010054/s1. Figure S1: Cyclic voltammograms in 0.1 M HClO4 aqueous solution (a) and 1 mM [Ru(NH3)6]Cl3 aqueous solution (b) for the PDD electrode (red line) and BDD electrode (blue line). Figure S2: Mott–Schottky plots of the PDD electrode (a) and BDD electrode (b) in 0.1 M HClO4 aqueous solution. Table S1: The faradaic efficiencies of products obtained by electrochemical reduction of CO2 in various potential using PDD and BDD electrodes. Figure S3: Dependency of the applied potential on the faradaic efficiencies of carbon monoxide (a) and hydrogen (b) production by the electroreduction of CO2 using PDD (red line) and BDD (blue line) electrodes in 0.1 mol L−1 KClO4 aqueous solution; (c) the ratio of faradaic efficiencies of carbon monoxide to hydrogen (CO/H2). Figure S4: Diagram of the microwave plasma–assisted chemical vapor deposition method. Red phosphorus was sublimed and introduced into the reactor as part of the mixed gas flow. Figure S5: (a) Diagram of the microwave plasma–assisted chemical vapor deposition method for preparation of BDD electrode, (b) SEM image, (c) Raman spectrum. growth condition in Table S2. Figure S6: XPS spectra of C1s and O1s spectra of PDD electrode before and after irradiation by a low-pressure mercury lamp (wavelength: 254 nm) for 60 min. Figure S7: Schematic of the batch cell employed for the electrochemical reduction of CO2.
Author Contributions
T.M.: Conceptualization, Methodology, Validation, Formal analysis, Investigation, Data curation, Writing—original draft preparation; Y.E.: Conceptualization, Writing—review and editing, Visualization, Project administration, Funding acquisition. All authors have read and agreed to the published version of the manuscript.
Funding
This study was partially supported by a Grant-in-Aid for Scientific Research, A 23H00288 (Y.E.).
Data Availability Statement
The data will be made available upon request.
Conflicts of Interest
Author Tomokiyo Moriguchi was employed by ADD Co., Ltd. The remaining author declare that the research was conducted in the absence of any commercial or financial relationships that could be construed as a potential conflict of interest.
Abbreviations
The following abbreviations are used in this manuscript:
| BDD | boron-doped diamond |
| PDD | phosphorus-doped diamond |
| HER | hydrogen evolution reaction |
| SEM | scanning electron microscope |
| SIMS | secondary ion mass spectrometry |
| CV | cyclic voltammetry |
| LSV | linear sweep voltammetry |
| EIS | electrochemical impedance spectroscopy |
References
- Gong, E.; Ali, S.; Hiragond, C.B.; Kim, H.S.; Powar, N.S.; Kim, D.; Kim, H.; In, S.-I. Solar fuels: Research and development strategies to accelerate photocatalytic CO2 conversion into hydrocarbon fuels. Energy Environ. Sci. 2022, 15, 880–937. [Google Scholar] [CrossRef]
- Martín, C.; Fiorani, G.; Kleij, A.W. Recent Advances in the Catalytic Preparation of Cyclic Organic Carbonates. ACS Catal. 2015, 5, 1353–1370. [Google Scholar] [CrossRef]
- Hori, Y.; Wakebe, H.; Tsukamoto, T.; Koga, O. Electrocatalytic process of CO selectivity in electrochemical reduction of CO2 at metal electrodes in aqueous media. Electrochim. Acta 1994, 39, 1833–1839. [Google Scholar] [CrossRef]
- Einaga, Y. Application of Boron-doped Diamond Electrodes: Focusing on the Electrochemical Reduction of Carbon Dioxide. Electrochemistry 2022, 90, 101002. [Google Scholar] [CrossRef]
- Tariq, A.; Akram, M.Z.; Ghouri, M.D.; Hussain, S.; Kanade, S.; Kale, B.B.; Gautam, M. Recent Progress on Boron-Doped Diamond Electrodes for Electrochemical CO2 Reduction: A Mini-review. Energy Fuels 2024, 38, 10445–10455. [Google Scholar] [CrossRef]
- Natsui, K.; Iwakawa, H.; Ikemiya, N.; Nakata, K.; Einaga, Y. Stable and Highly Efficient Electrochemical Production of Formic Acid from Carbon Dioxide Using Diamond Electrodes. Angew. Chem. Int. Ed. Engl. 2018, 57, 2639–2643. [Google Scholar] [CrossRef] [PubMed]
- Irkham; Nagashima, S.; Tomisaki, M.; Einaga, Y. Enhancing the Electrochemical Reduction of CO2 by Controlling the Flow Conditions: An Intermittent Flow Reduction System with a Boron-Doped Diamond Electrode. ACS Sustain. Chem. Eng. 2021, 9, 5298–5303. [Google Scholar] [CrossRef]
- Araki, S.; Einaga, Y. Semipermanent Continuous Formic Acid Production from CO2 by Controlling Ion Transport Using Boron-Doped Diamond Electrodes. ACS Sustain. Chem. Eng. 2025, 13, 1227–1232. [Google Scholar] [CrossRef]
- Baluchová, S.; Sung, K.-d.; Weiss, Z.; Kopeček, J.; Fekete, L.; Buijnsters, J.G.; Mortet, V. Unveiling the microstructure and promising electrochemical performance of heavily phosphorus-doped diamond electrodes. Electrochimica Acta 2024, 499, 144696. [Google Scholar] [CrossRef]
- Mukuda, Y.; Watanabe, T.; Ueda, A.; Nishibayashi, Y.; Einaga, Y. Electrochemical properties of phosphorus doped diamond. Electrochimica Acta 2015, 179, 599–603. [Google Scholar] [CrossRef]
- Tominaga, Y.; Uchida, A.; Hunge, Y.M.; Shitanda, I.; Itagaki, M.; Kondo, T.; Yuasa, M.; Uestuska, H.; Terashima, C. Enhanced growth rates of N-type phosphorus-doped polycrystalline diamond via in-liquid microwave plasma CVD. Solid State Sci. 2024, 155, 107650. [Google Scholar] [CrossRef]
- Farrer, R. On the substitutional nitrogen donor in diamond. Solid State Commun. 1969, 7, 685–688. [Google Scholar] [CrossRef]
- Koizumi, S.; Teraji, T.; Kanda, H. Phosphorus-doped chemical vapor deposition of diamond. Diam. Relat. Mater. 2000, 9, 935–940. [Google Scholar] [CrossRef]
- Kato, H.; Makino, T.; Yamasaki, S.; Okushi, H. n-type diamond growth by phosphorus doping on (0 0 1)-oriented surface. J. Phys. D Appl. Phys. 2007, 40, 6189–6200. [Google Scholar] [CrossRef]
- Koizumi, S.; Kamo, M.; Sato, Y.; Mita, S.; Sawabe, A.; Reznik, A.; Uzan-Saguy, C.; Kalish, R. Growth and characterization of phosphorus doped n-type diamond thin films. Diam. Relat. Mater. 1998, 7, 540–544. [Google Scholar] [CrossRef]
- Lambert, N.; Weiss, Z.; Klimša, L.; Kopeček, J.; Gedeonová, Z.; Hubík, P.; Mortet, V. Highly phosphorus-doped polycrystalline diamond growth and properties. Diam. Relat. Mater. 2022, 125, 108964. [Google Scholar] [CrossRef]
- Sung, K.-d.; Irimiciuc, S.A.; Novotný, M.; Weiss, Z.; Hubík, P.; Kopeček, J.; Vondráček, M.; Mortet, V. Advanced perspective on heavily phosphorus-doped diamond layers via optical emission spectroscopy. APL Mater. 2025, 13, 011118. [Google Scholar] [CrossRef]
- Moriguchi, T.; Tomisaki, M.; Sato, S.; Nakamura, J.; Yamada, H.; Einaga, Y. Fabrication of polycrystalline phosphorus-doped diamond electrodes from red phosphorus. Phys. Chem. Chem. Phys. 2024, 26, 14825–14831. [Google Scholar] [CrossRef]
- Naragino, H.; Saitoh, Y.; Honda, K. Electrochemical reduction of carbon dioxide in an aqueous solution using phosphorus-doped polycrystalline diamond electrodes. Electrochem. Commun. 2022, 134, 107164. [Google Scholar] [CrossRef]
- Nebel, C.E. Photocatalysis: A source of energetic electrons. Nat. Mater. 2013, 12, 780–781. [Google Scholar] [CrossRef]
- Xu, J.; Einaga, Y. Effect of sp2 species in a boron-doped diamond electrode on the electrochemical reduction of CO2. Electrochem. Commun. 2020, 115, 106731. [Google Scholar] [CrossRef]
- Zhi, Y.; Shao, J.; Liu, C.; Xiao, Q.; Demir, M.; Al Mesfer, M.K.; Danish, M.; Wang, L.; Hu, X. High-performance CO2 adsorption with P-doped porous carbons from lotus petiole biomass. Sep. Purif. Technol. 2025, 361, 131253. [Google Scholar] [CrossRef]
- Yan, Y.; Wang, H.; Bi, X.; Zhao, Y.; Wu, M. Efficient electrocatalytic reduction of CO2 to CO enhanced by the synergistic effect of N,P on carbon aerogel. Chem. Commun. 2024, 60, 6439–6442. [Google Scholar] [CrossRef] [PubMed]
Disclaimer/Publisher’s Note: The statements, opinions and data contained in all publications are solely those of the individual author(s) and contributor(s) and not of MDPI and/or the editor(s). MDPI and/or the editor(s) disclaim responsibility for any injury to people or property resulting from any ideas, methods, instructions or products referred to in the content. |
© 2026 by the authors. Licensee MDPI, Basel, Switzerland. This article is an open access article distributed under the terms and conditions of the Creative Commons Attribution (CC BY) license.