

Green Fabrication of ZnO Nanoparticles and ZnO/rGO Nanocomposites from Algerian Date Syrup Extract: Synthesis, Characterization, and Augmented Photocatalytic Efficiency in Methylene Blue Degradation

 , ,
, ,  and
and 
Abstract

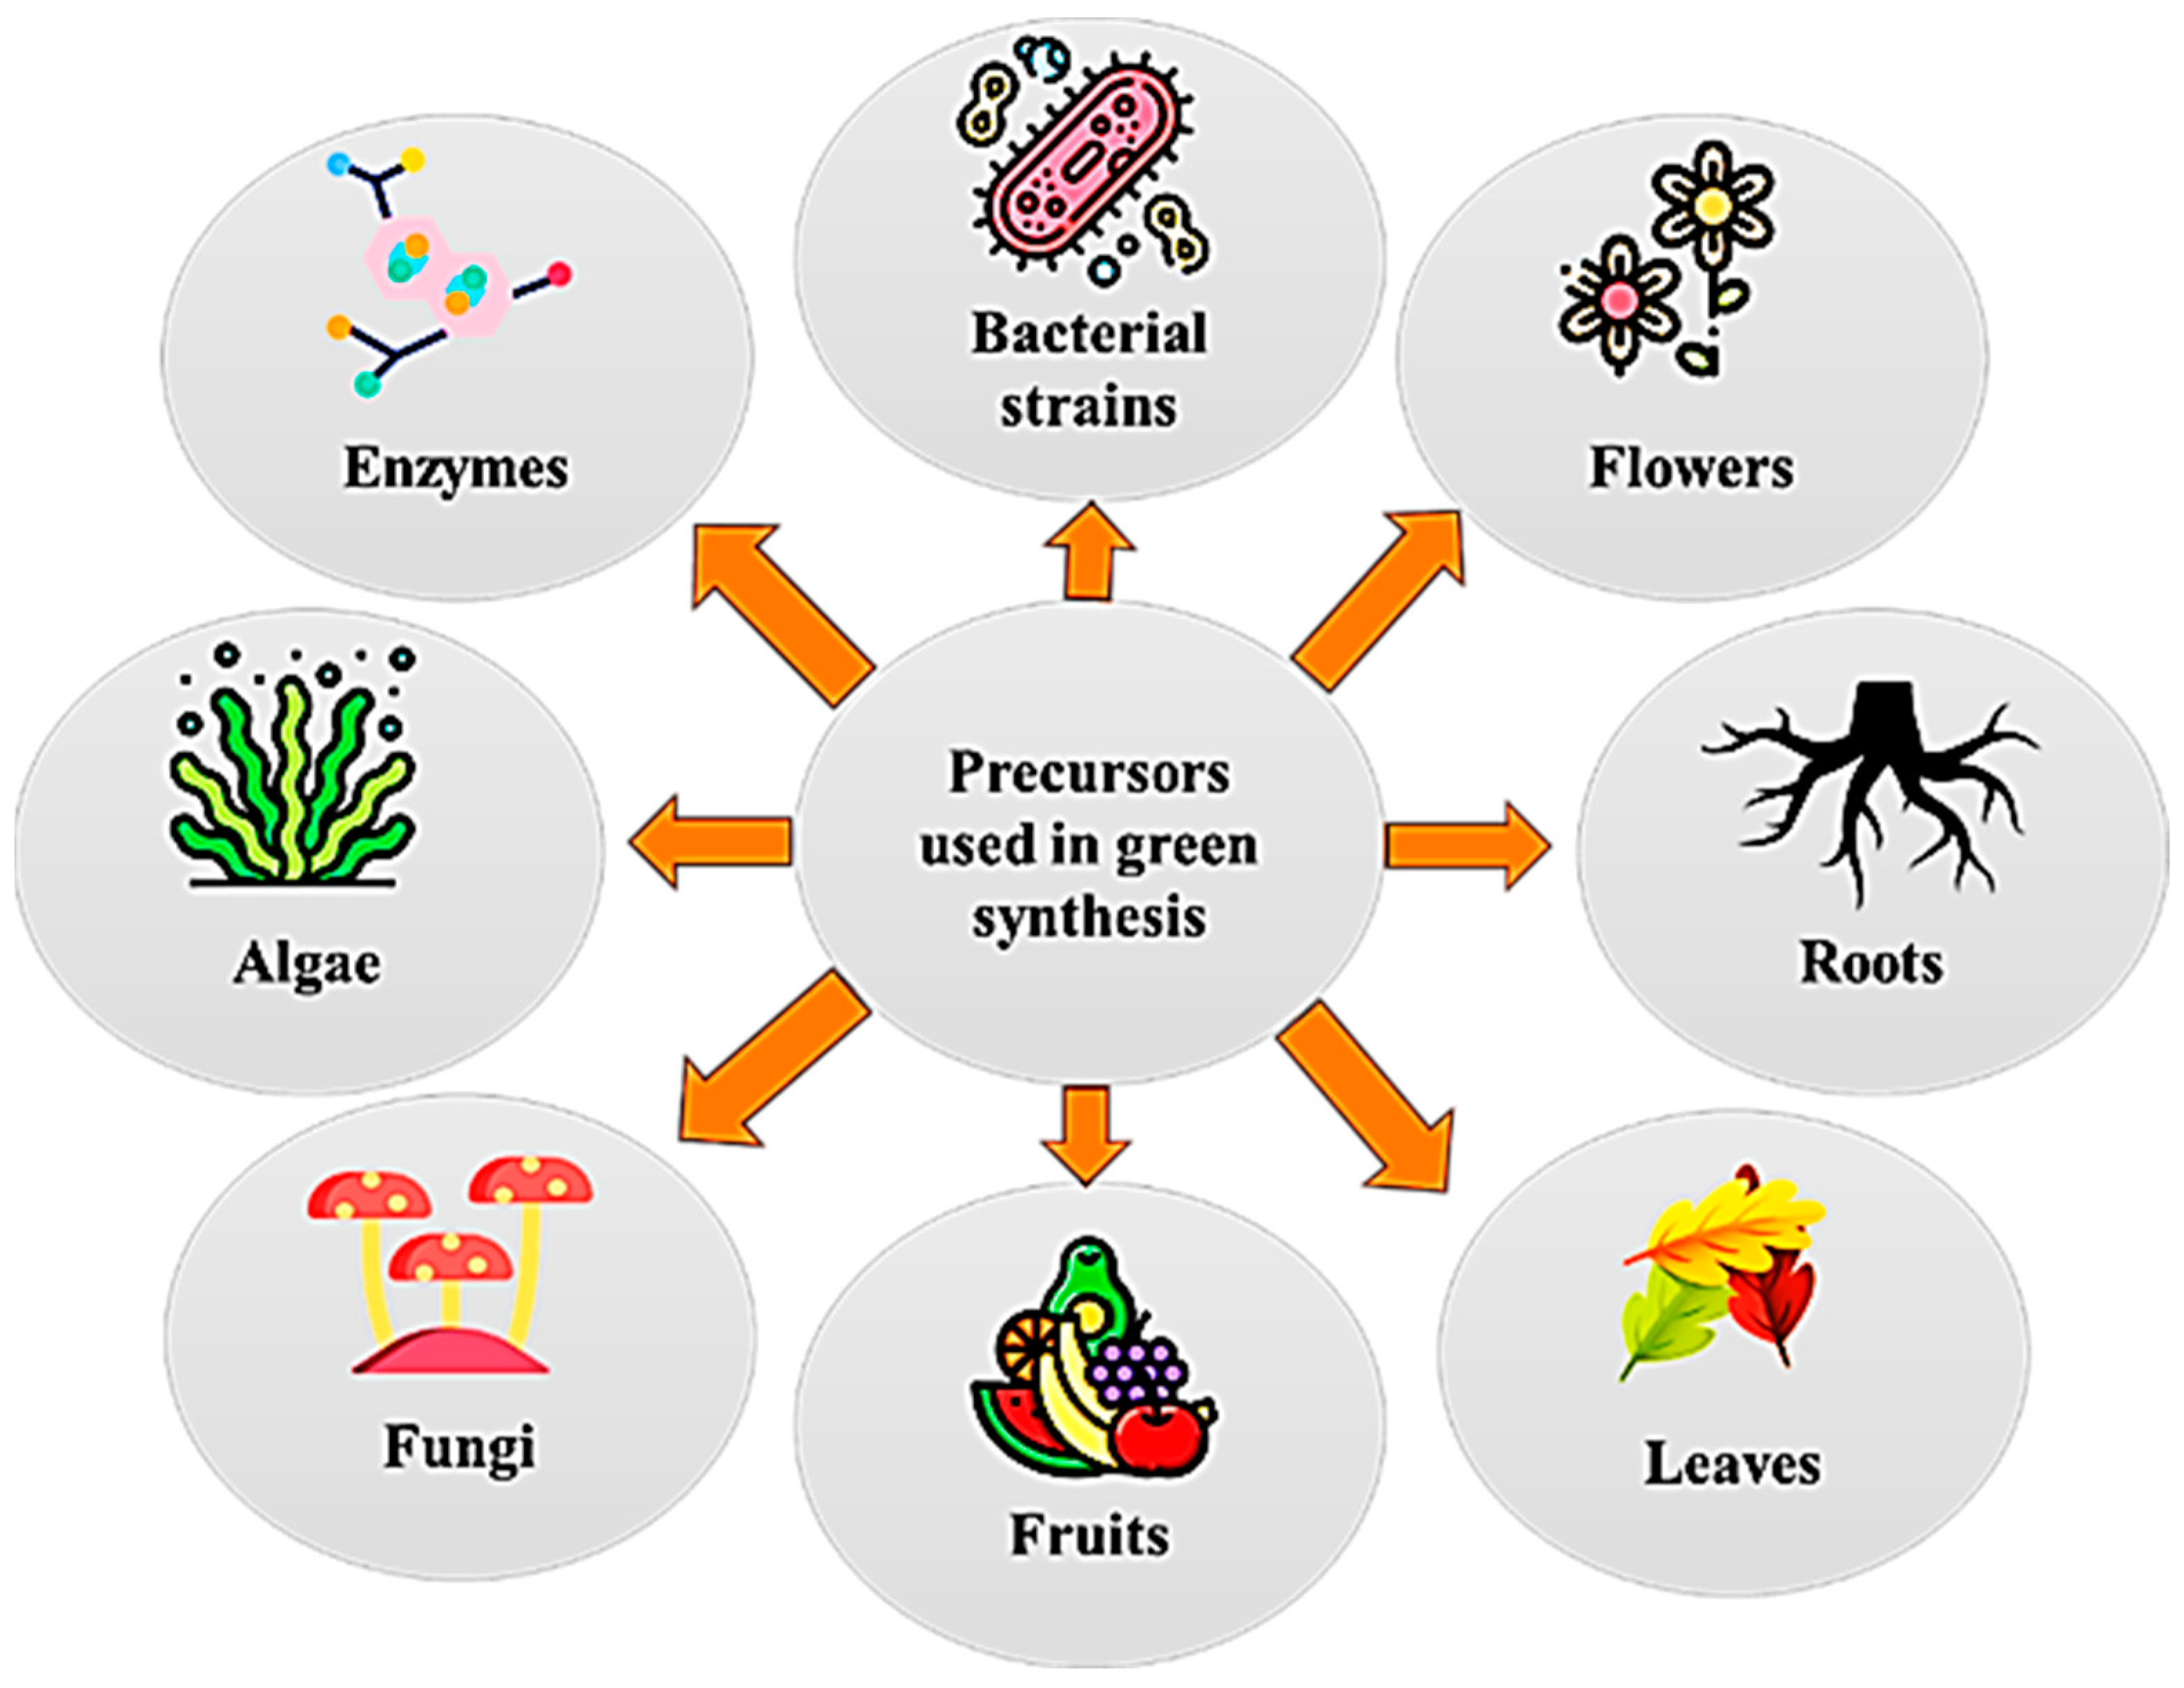
1. Introduction
2. Results
2.1. Characterization
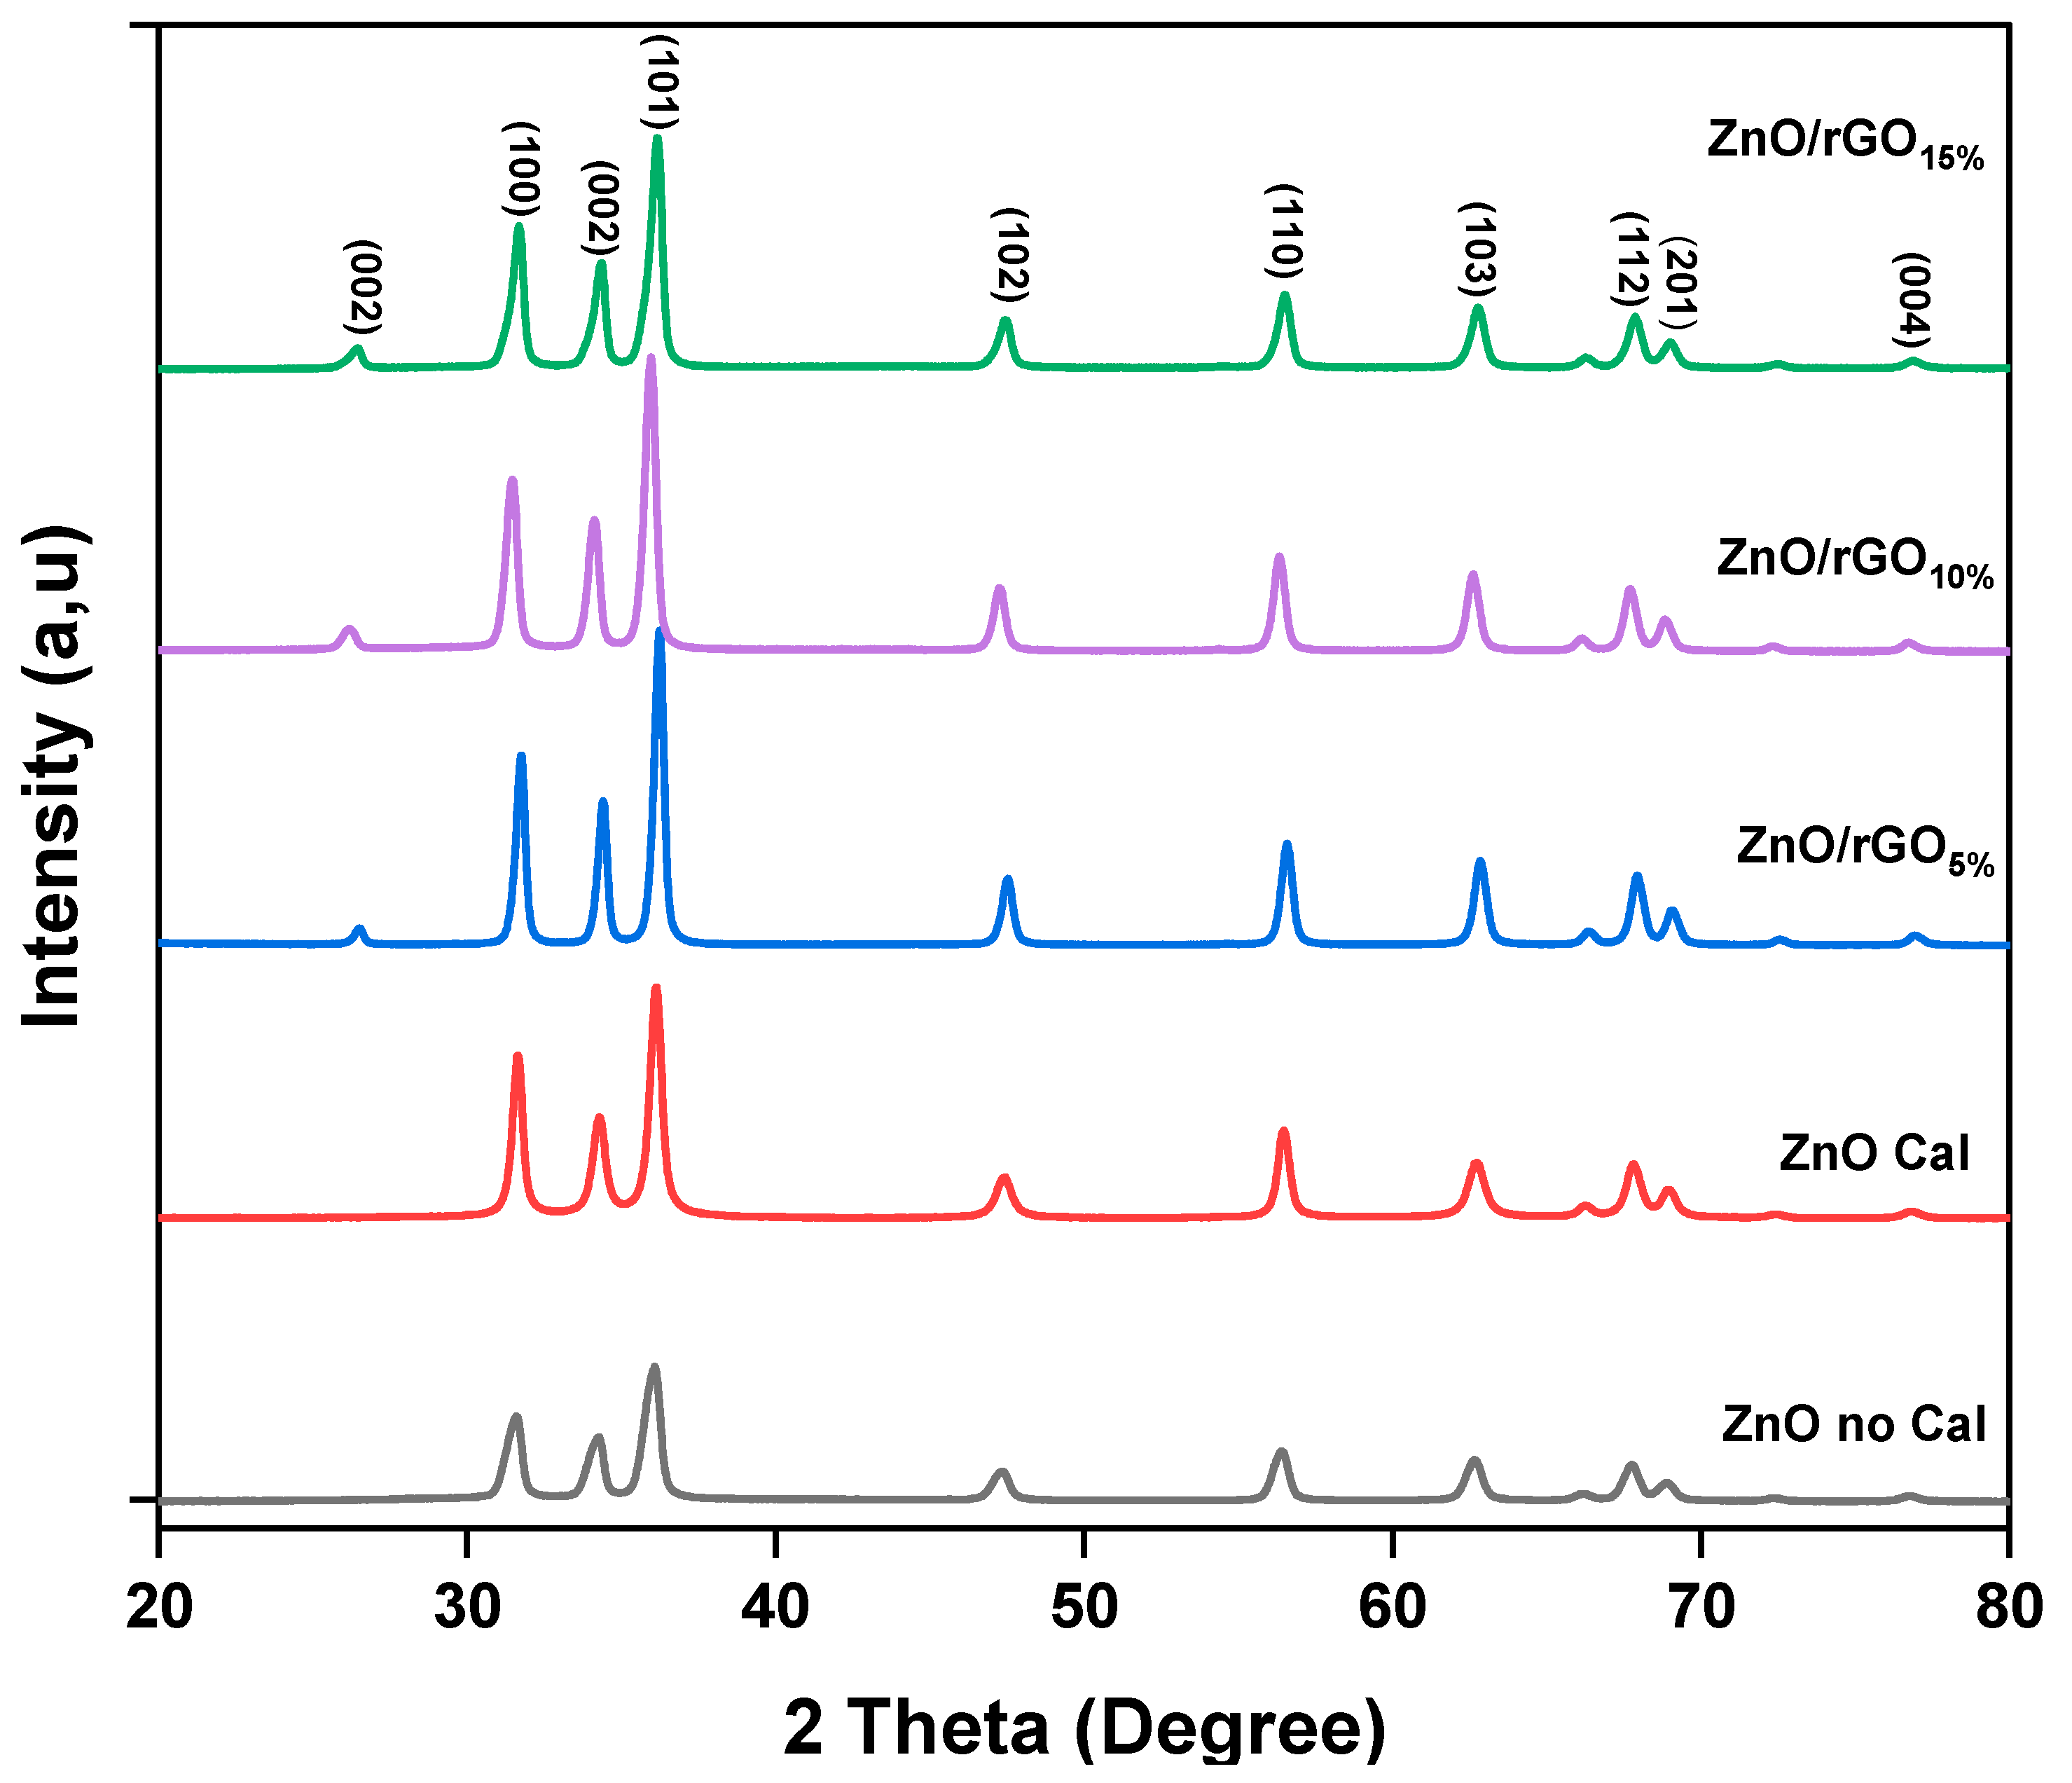
2.1.1. X-ray Diffraction
- D represents the average crystallite size.
- K is the Scherrer constant, which is approximately 0.9 and depends on the crystallite shape.
- λ is the wavelength of the X-ray radiation used for the diffraction.
- β is the full width at half-maximum (FWHM) of the XRD peak, measured in radians.
- θ is the Bragg angle, which is half of the angle between the incident X-ray beam and the scattered X-ray beam.
2.1.2. Fourier-Transform Infrared Spectroscopy
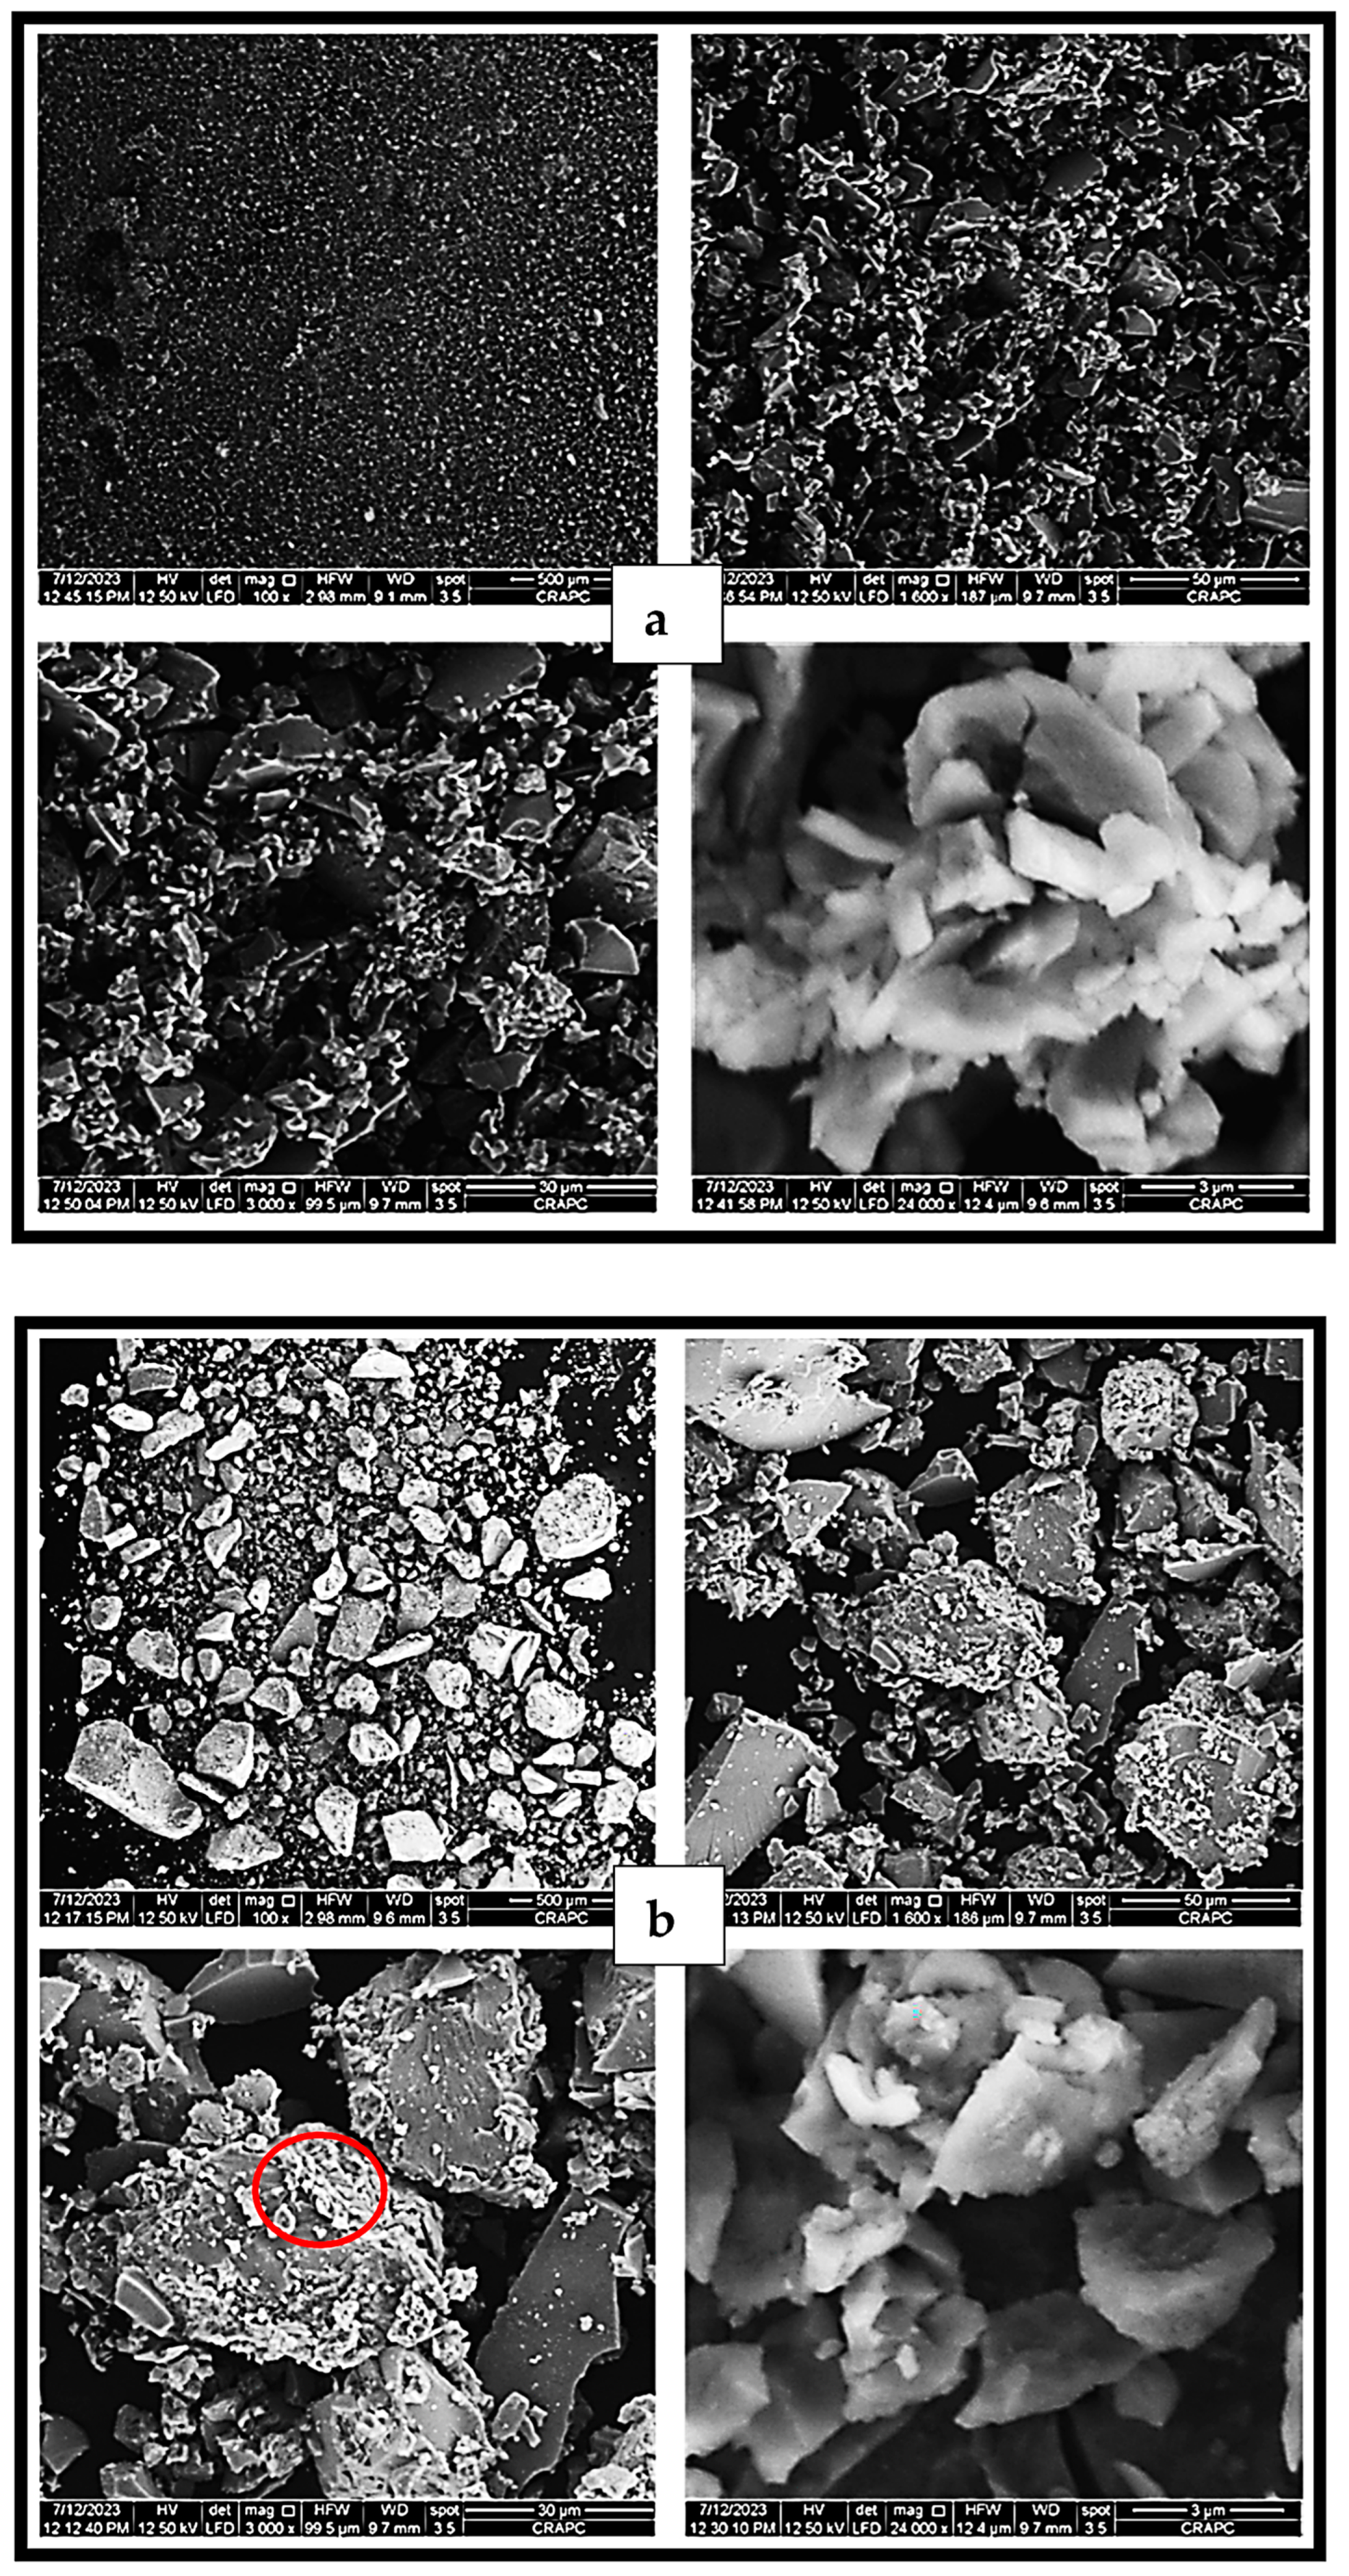
2.1.3. Scanning Electron Microscopy Images
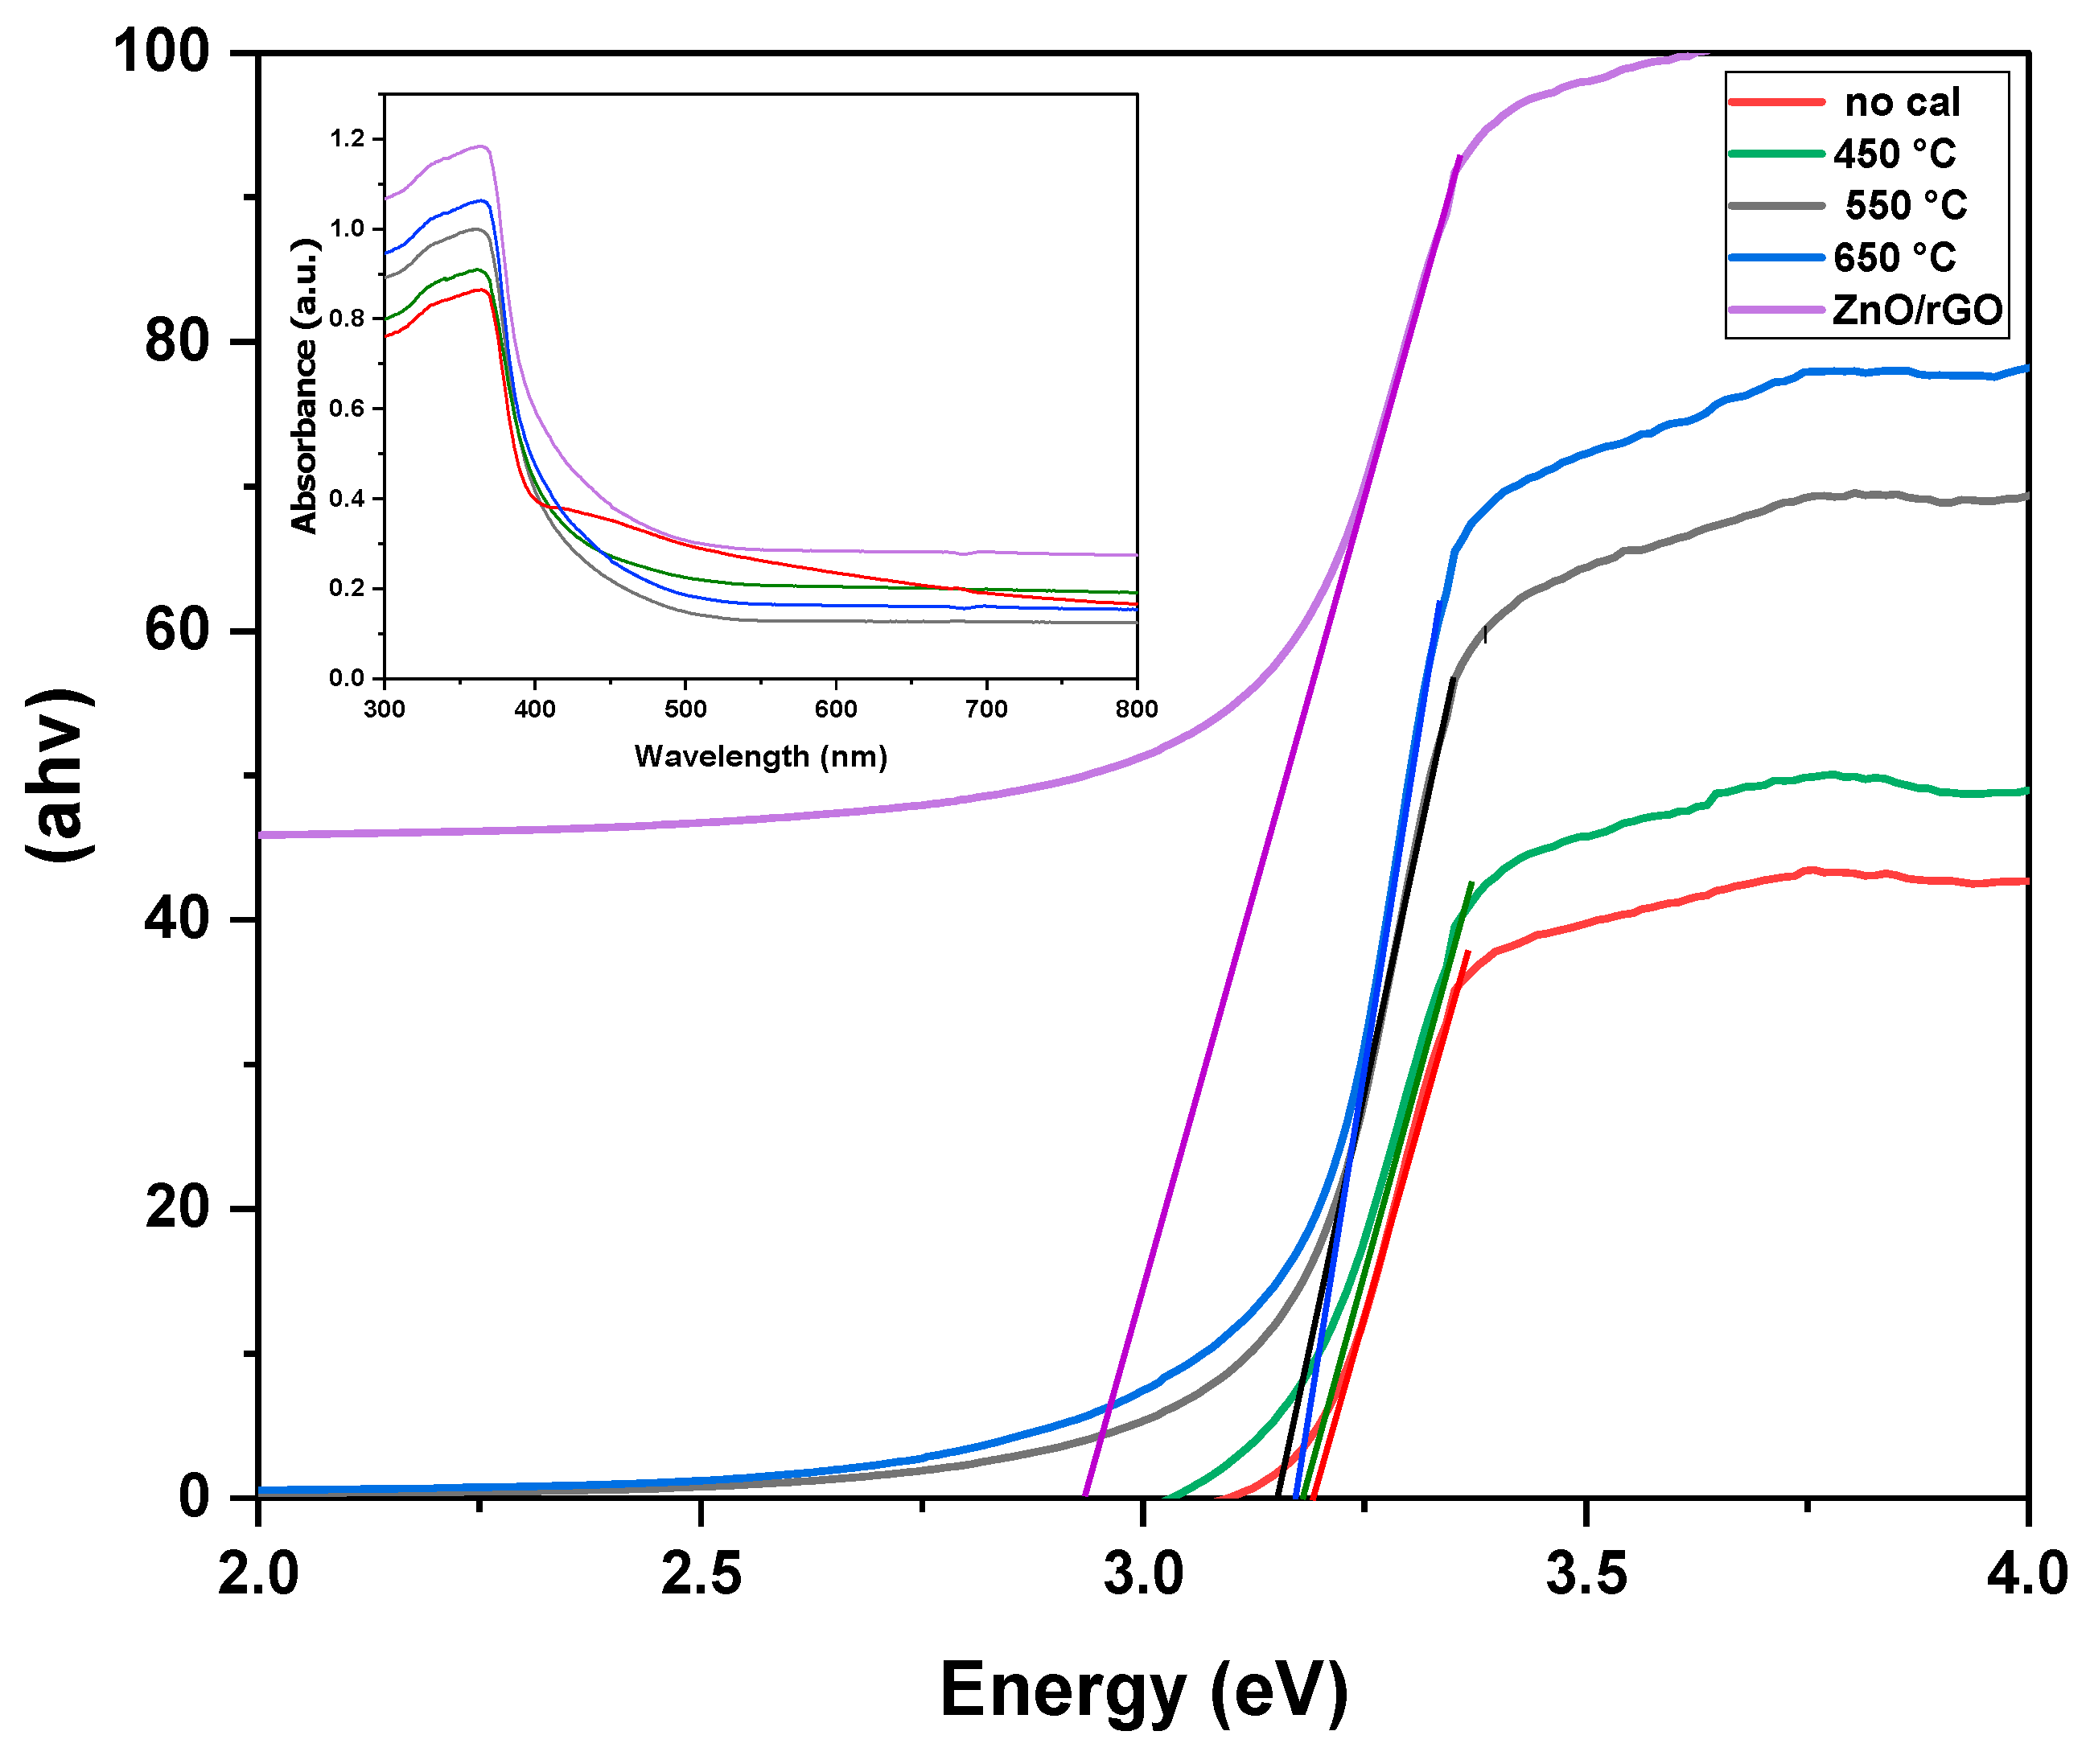
2.1.4. UV-Visible Diffuse Reflectance Spectroscopy
- α is the absorption coefficient.
- hν is the photon energy.
- A is a constant.
- Eg is the bandgap energy.
2.2. Photocatalytic Results
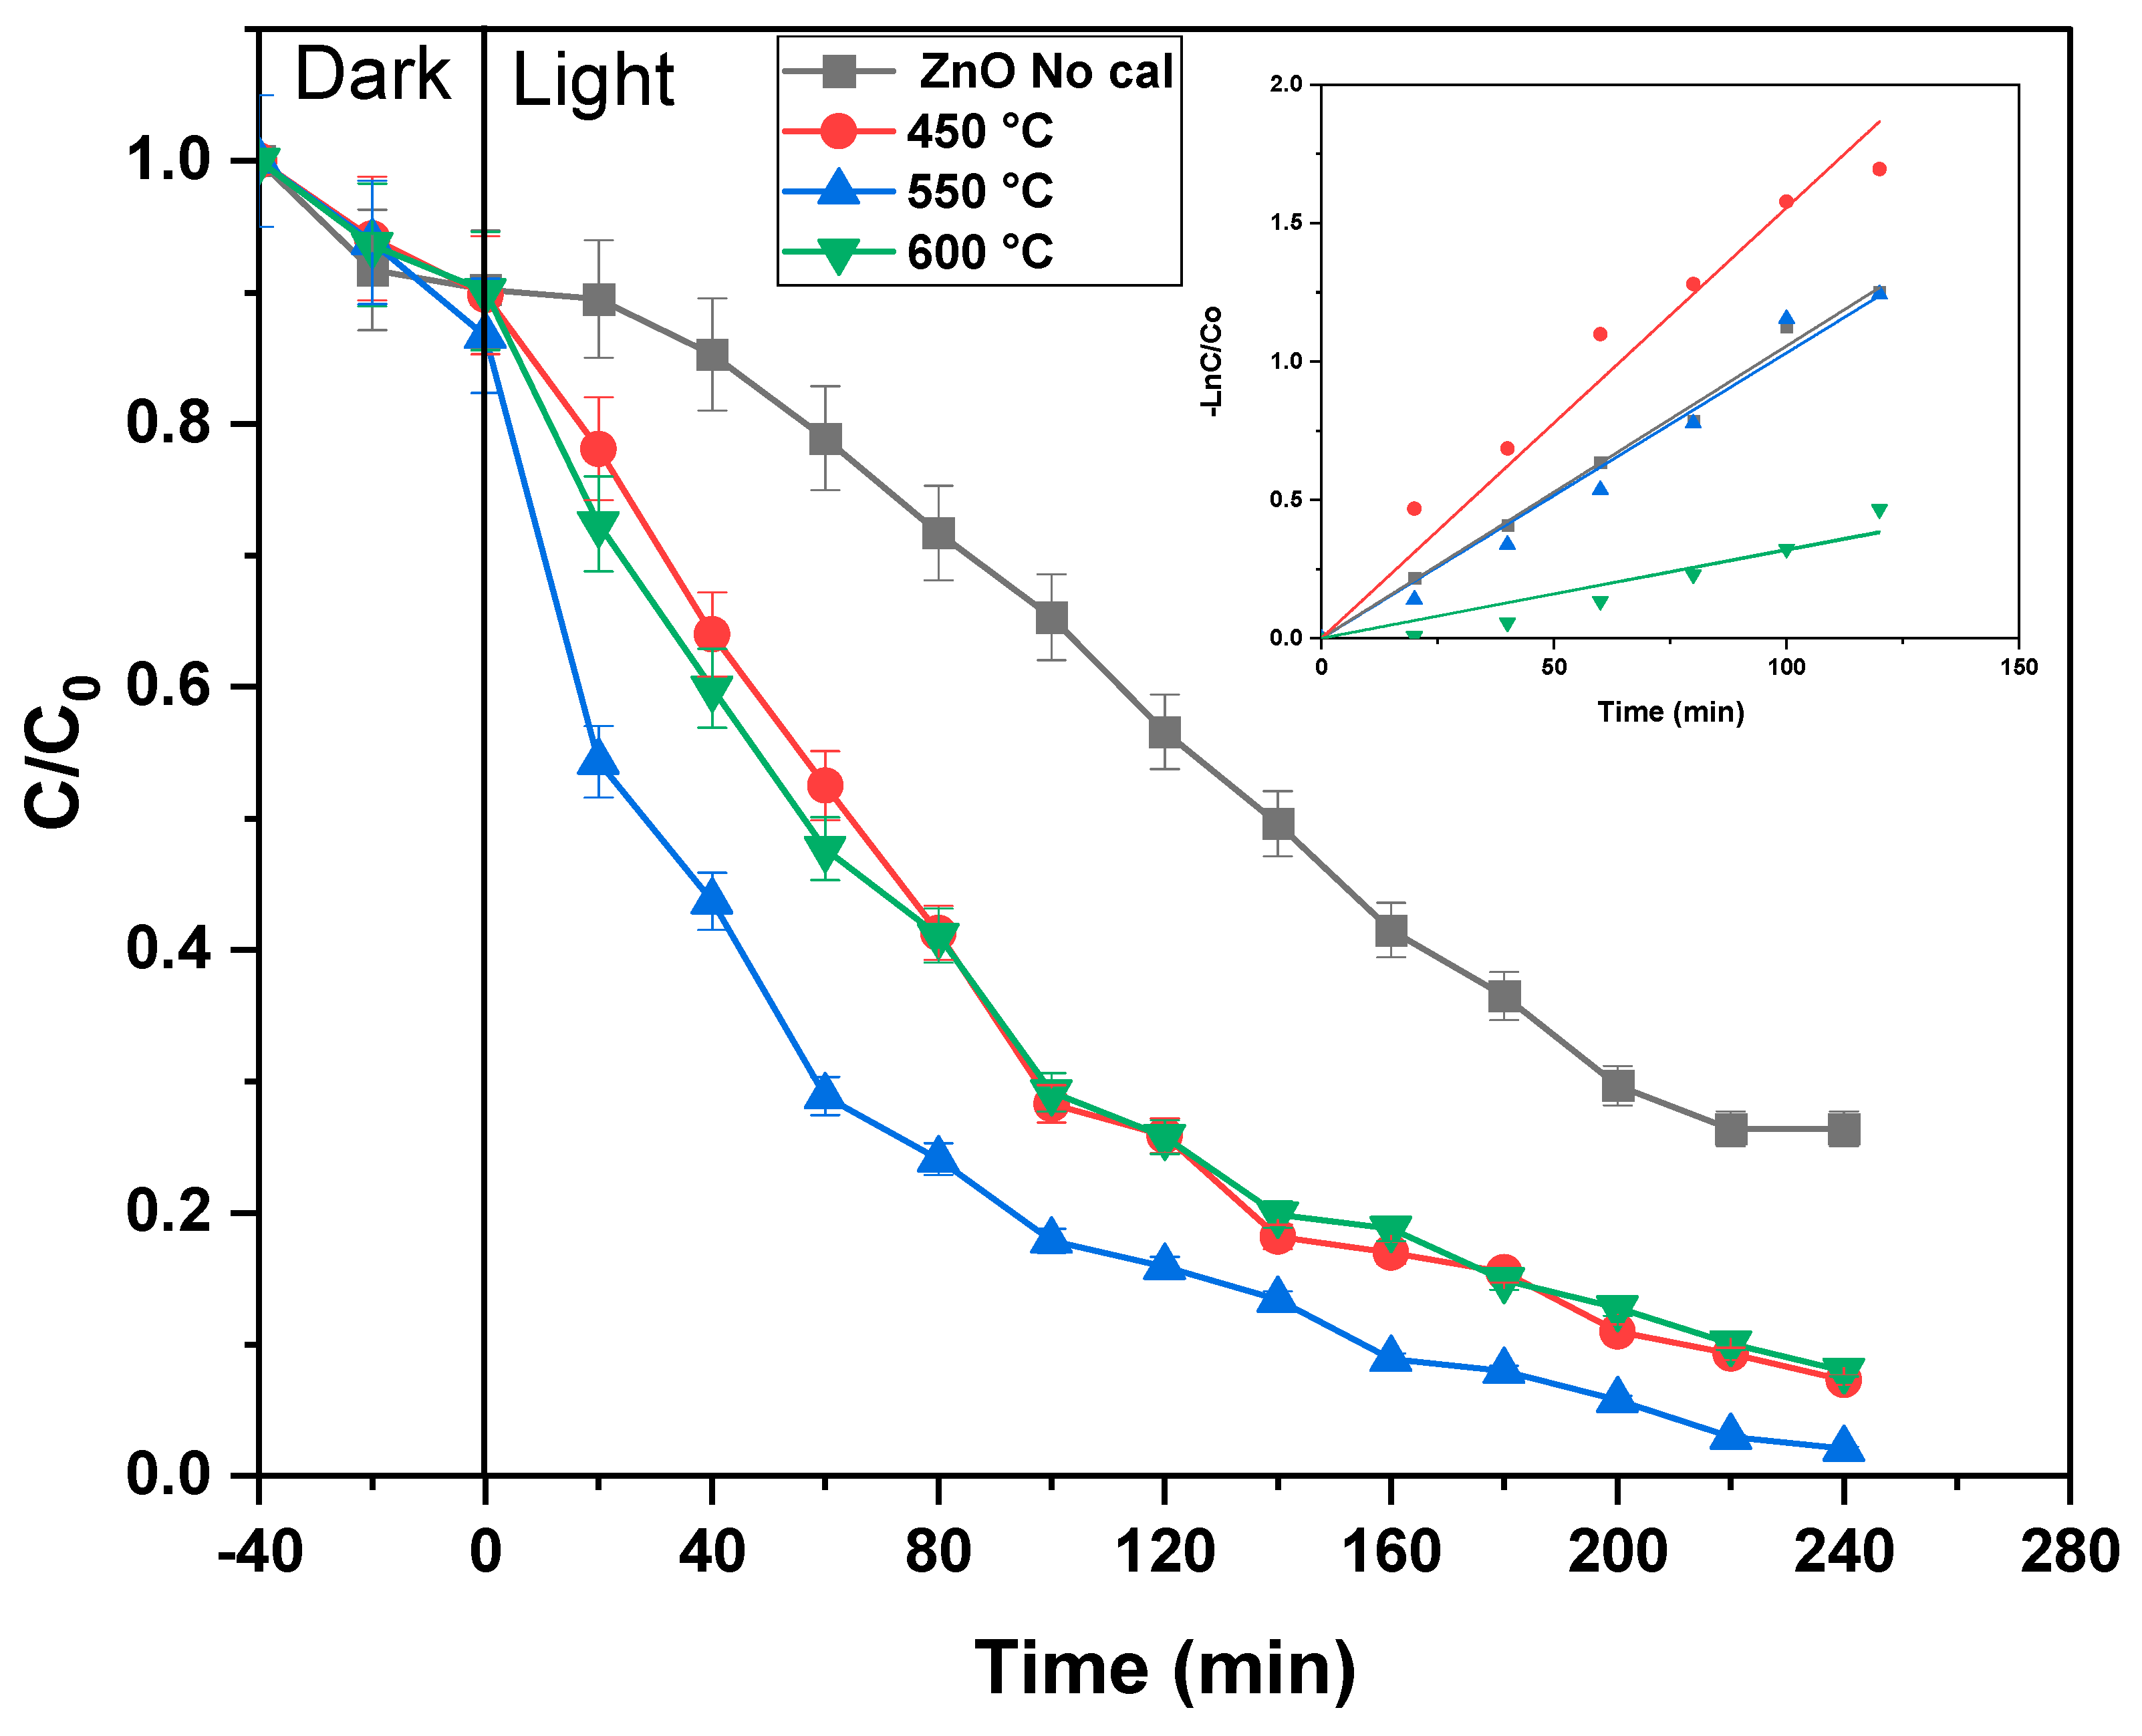
2.2.1. Effect of Calcination Temperature on the Photocatalytic Activity of ZnO NPs
2.2.2. Photocatalytic Activity of ZnO/rGOx
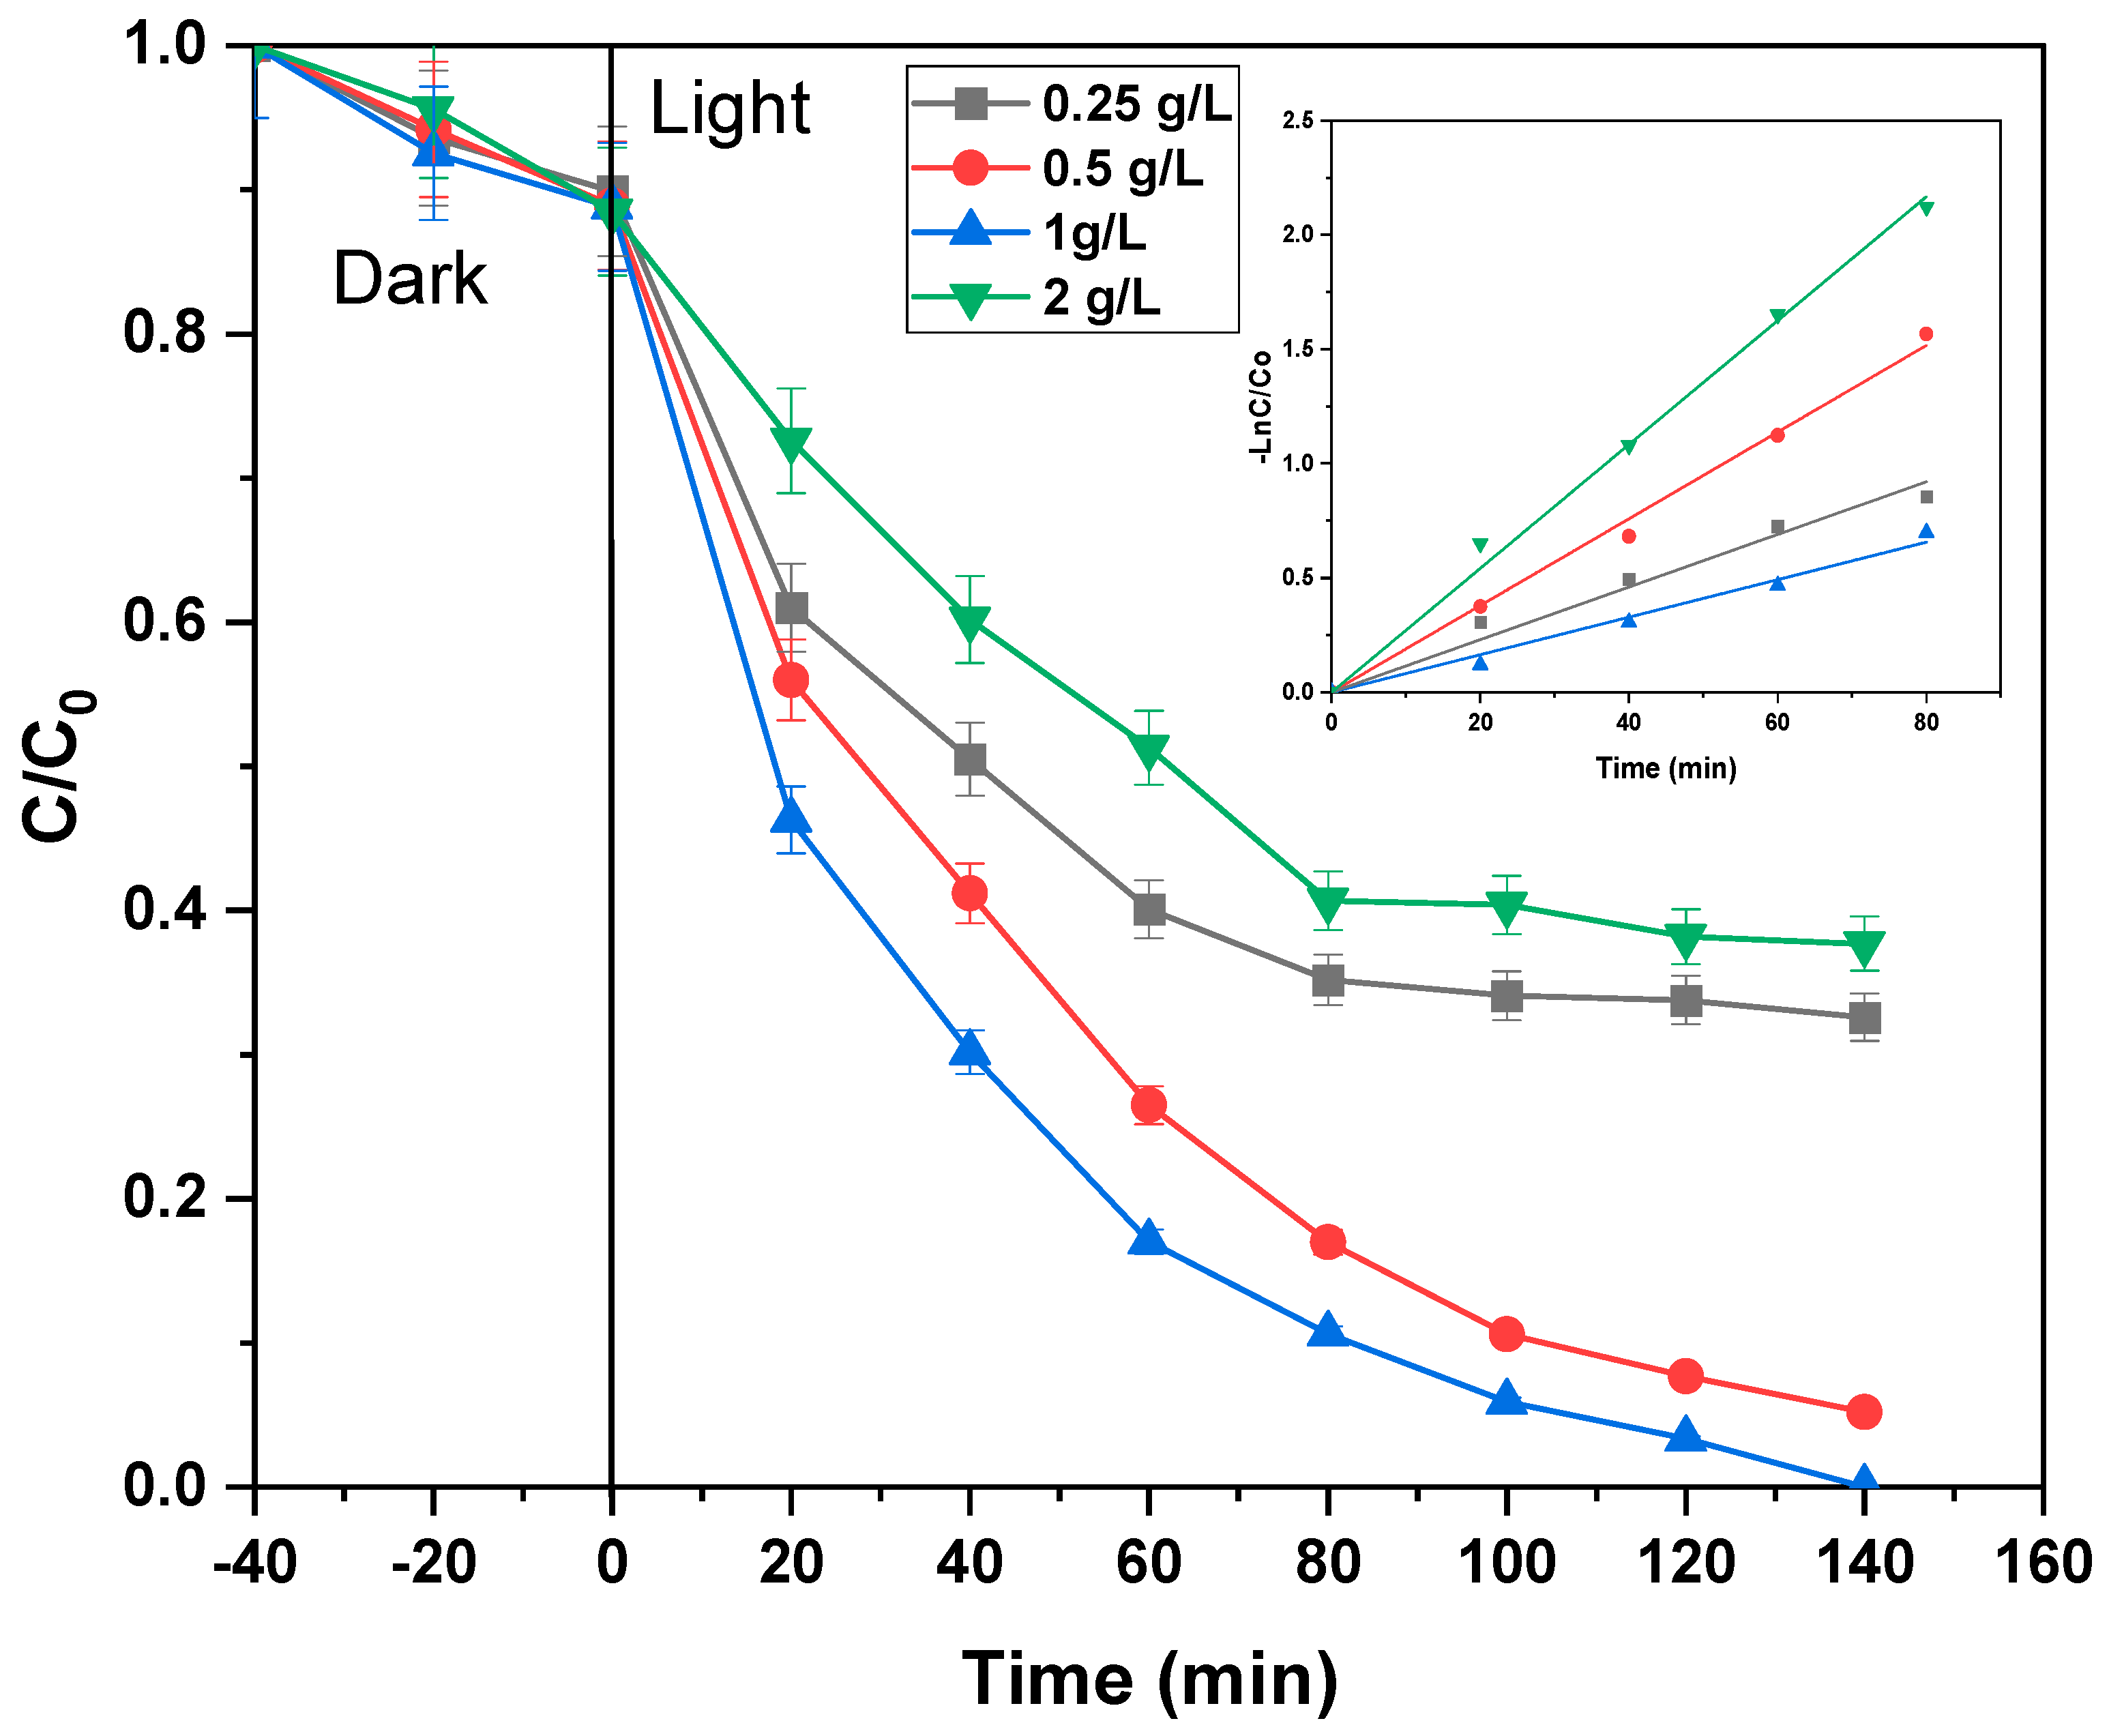
2.2.3. Effect of Catalyst Dosage
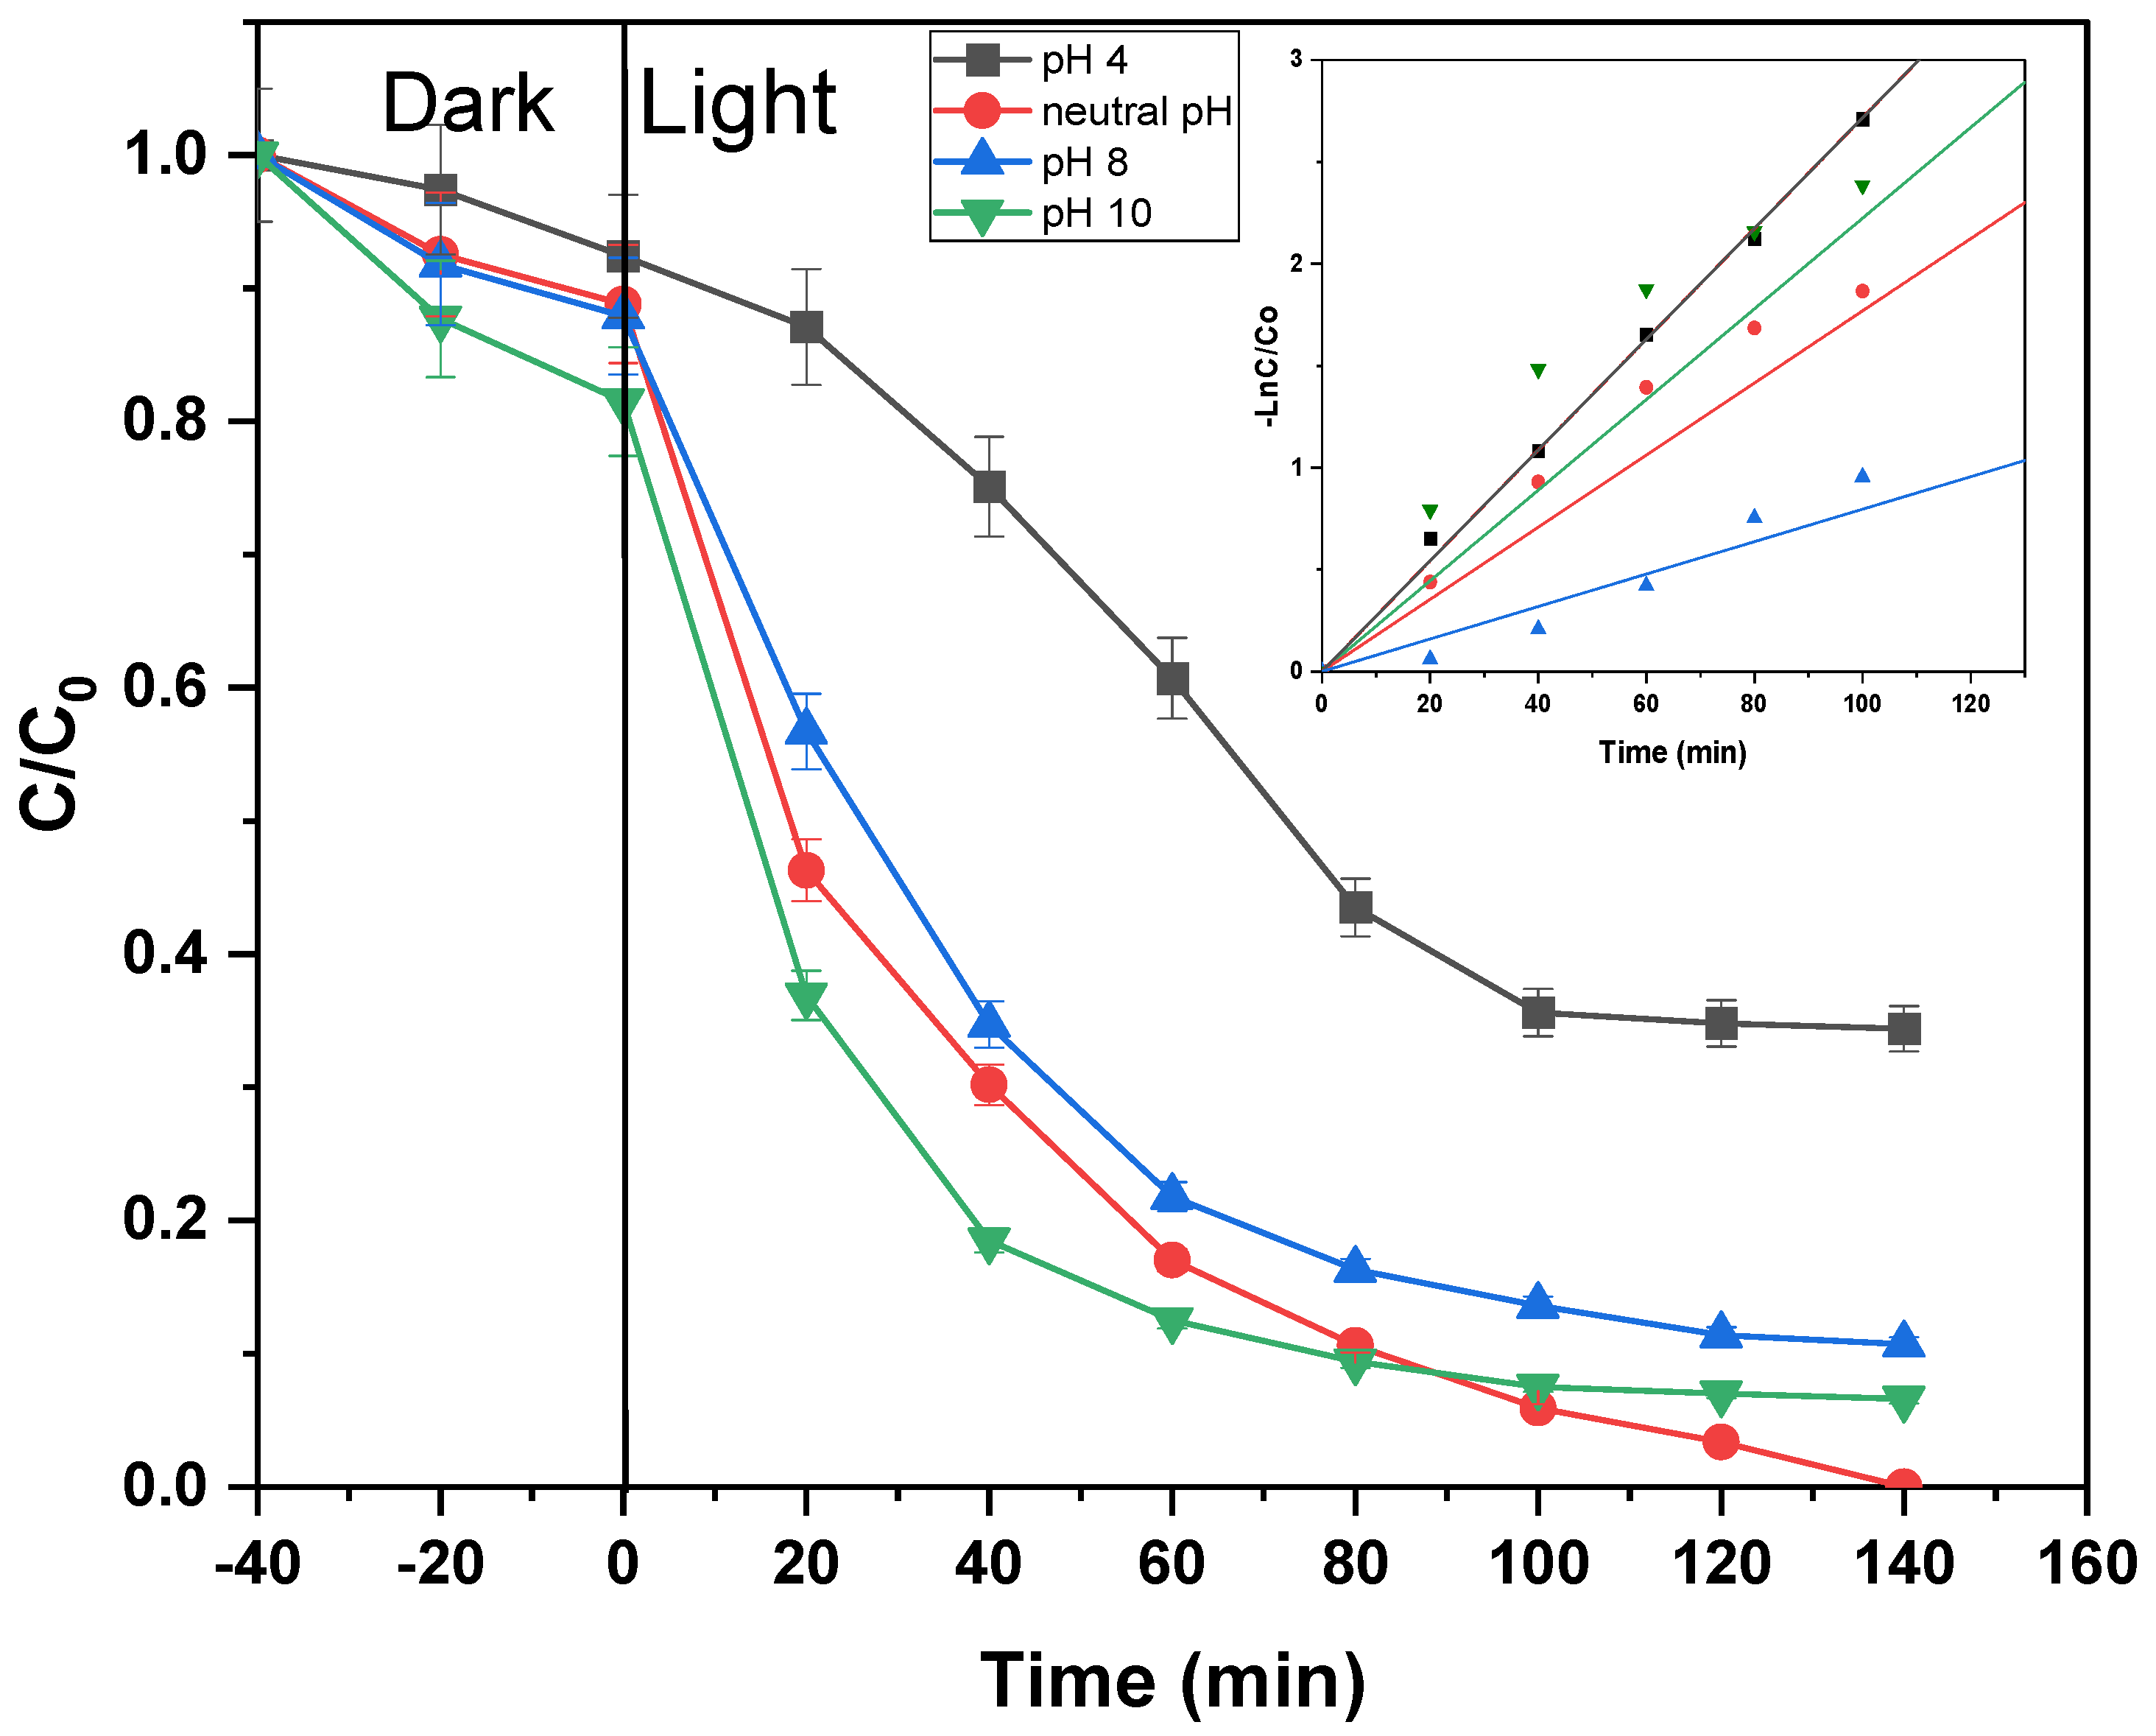
2.2.4. Effect of Reaction pH
2.3. Cycling Test of the Photocatalytic Degradation of Methylene Blue under UV Light
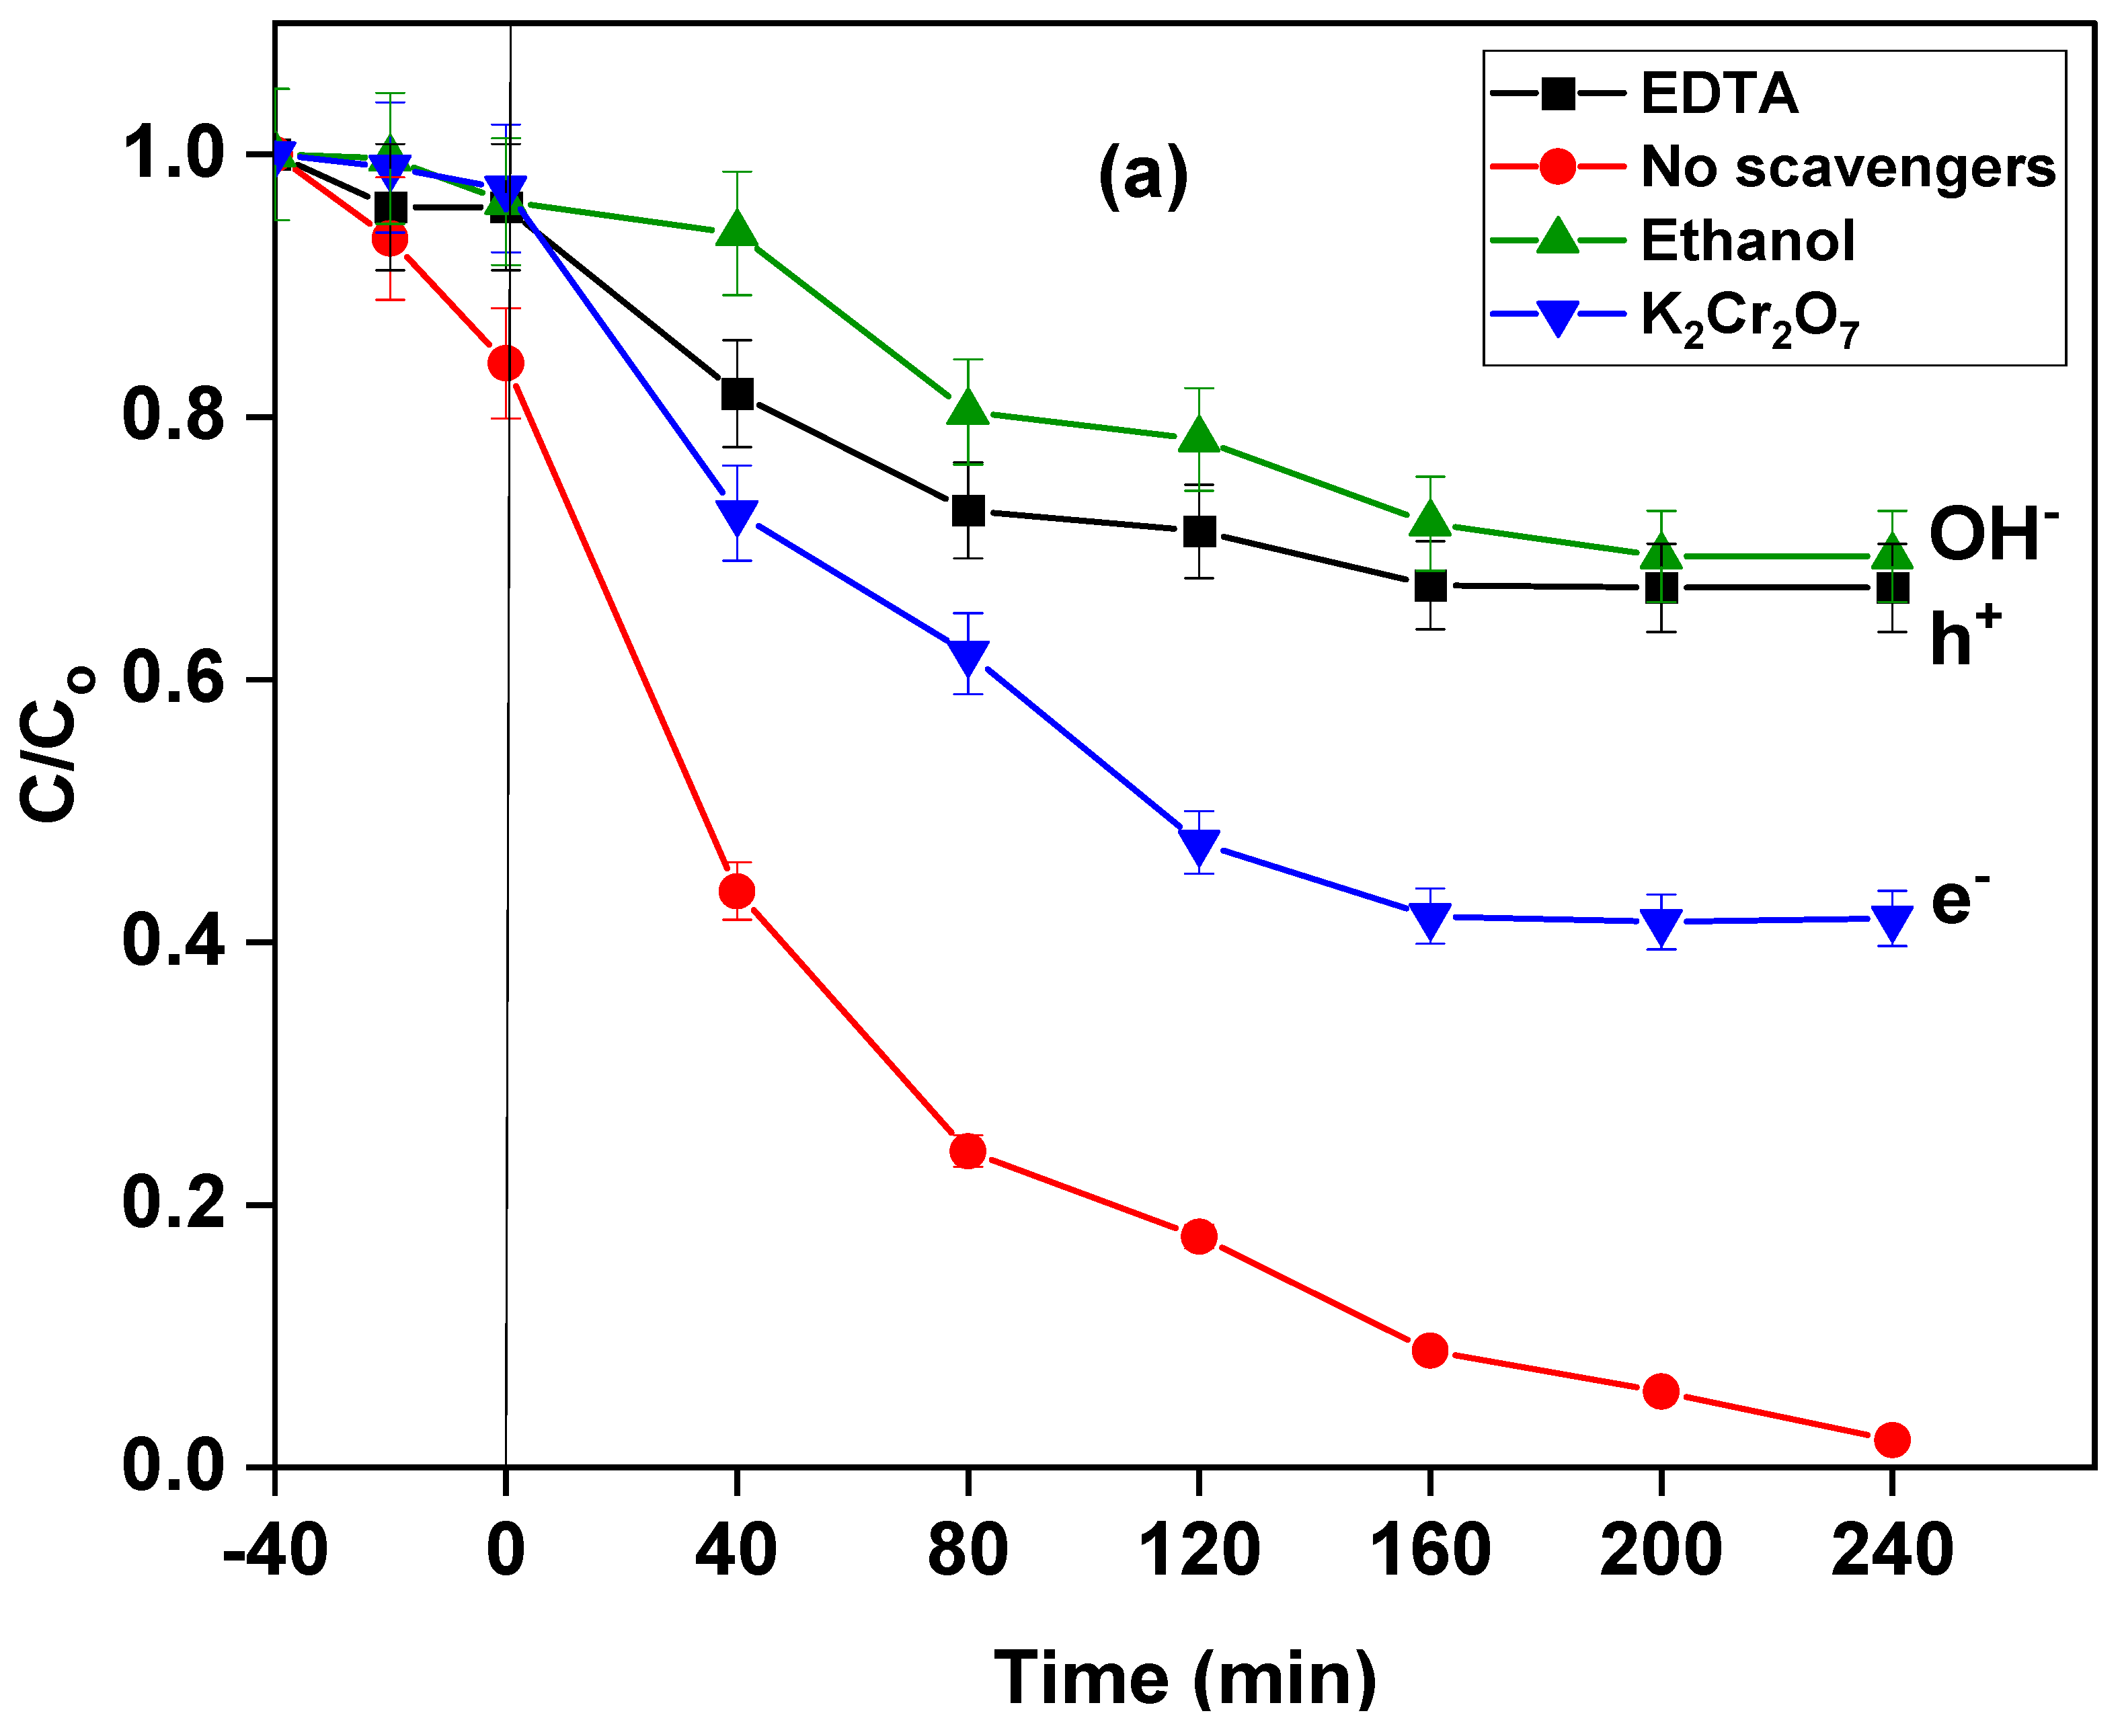
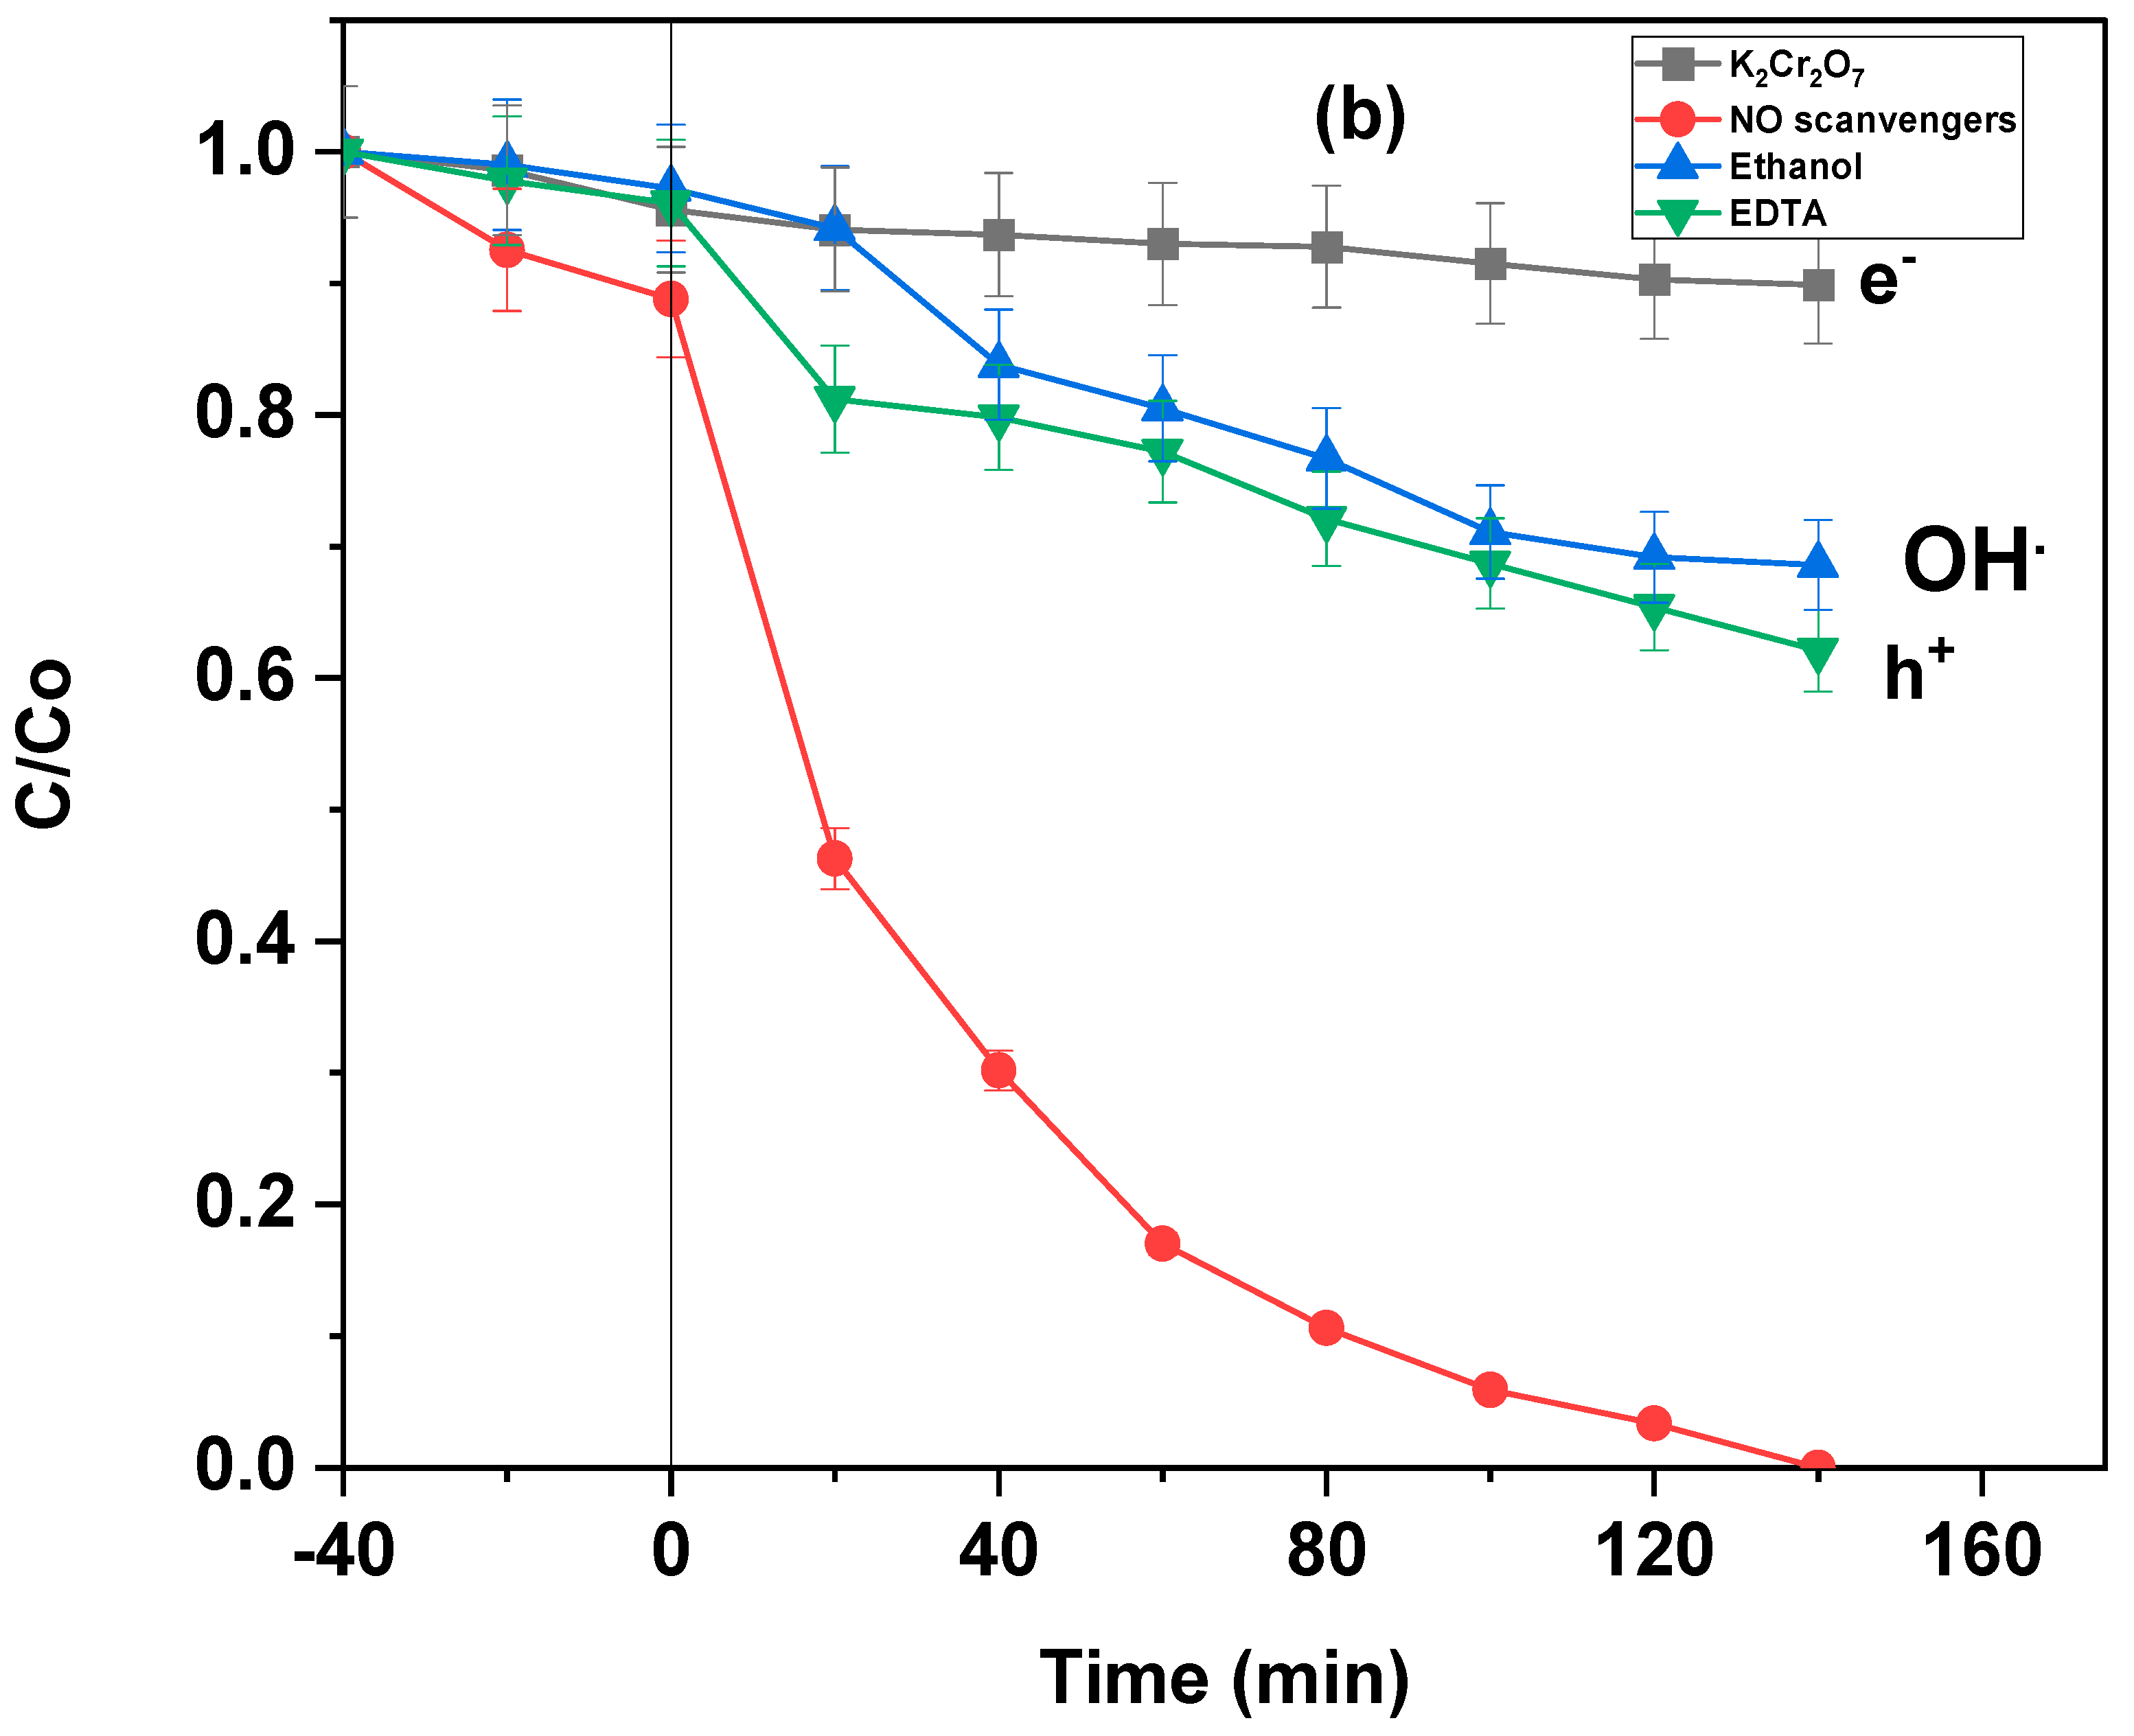
2.4. Effect of Scavengers
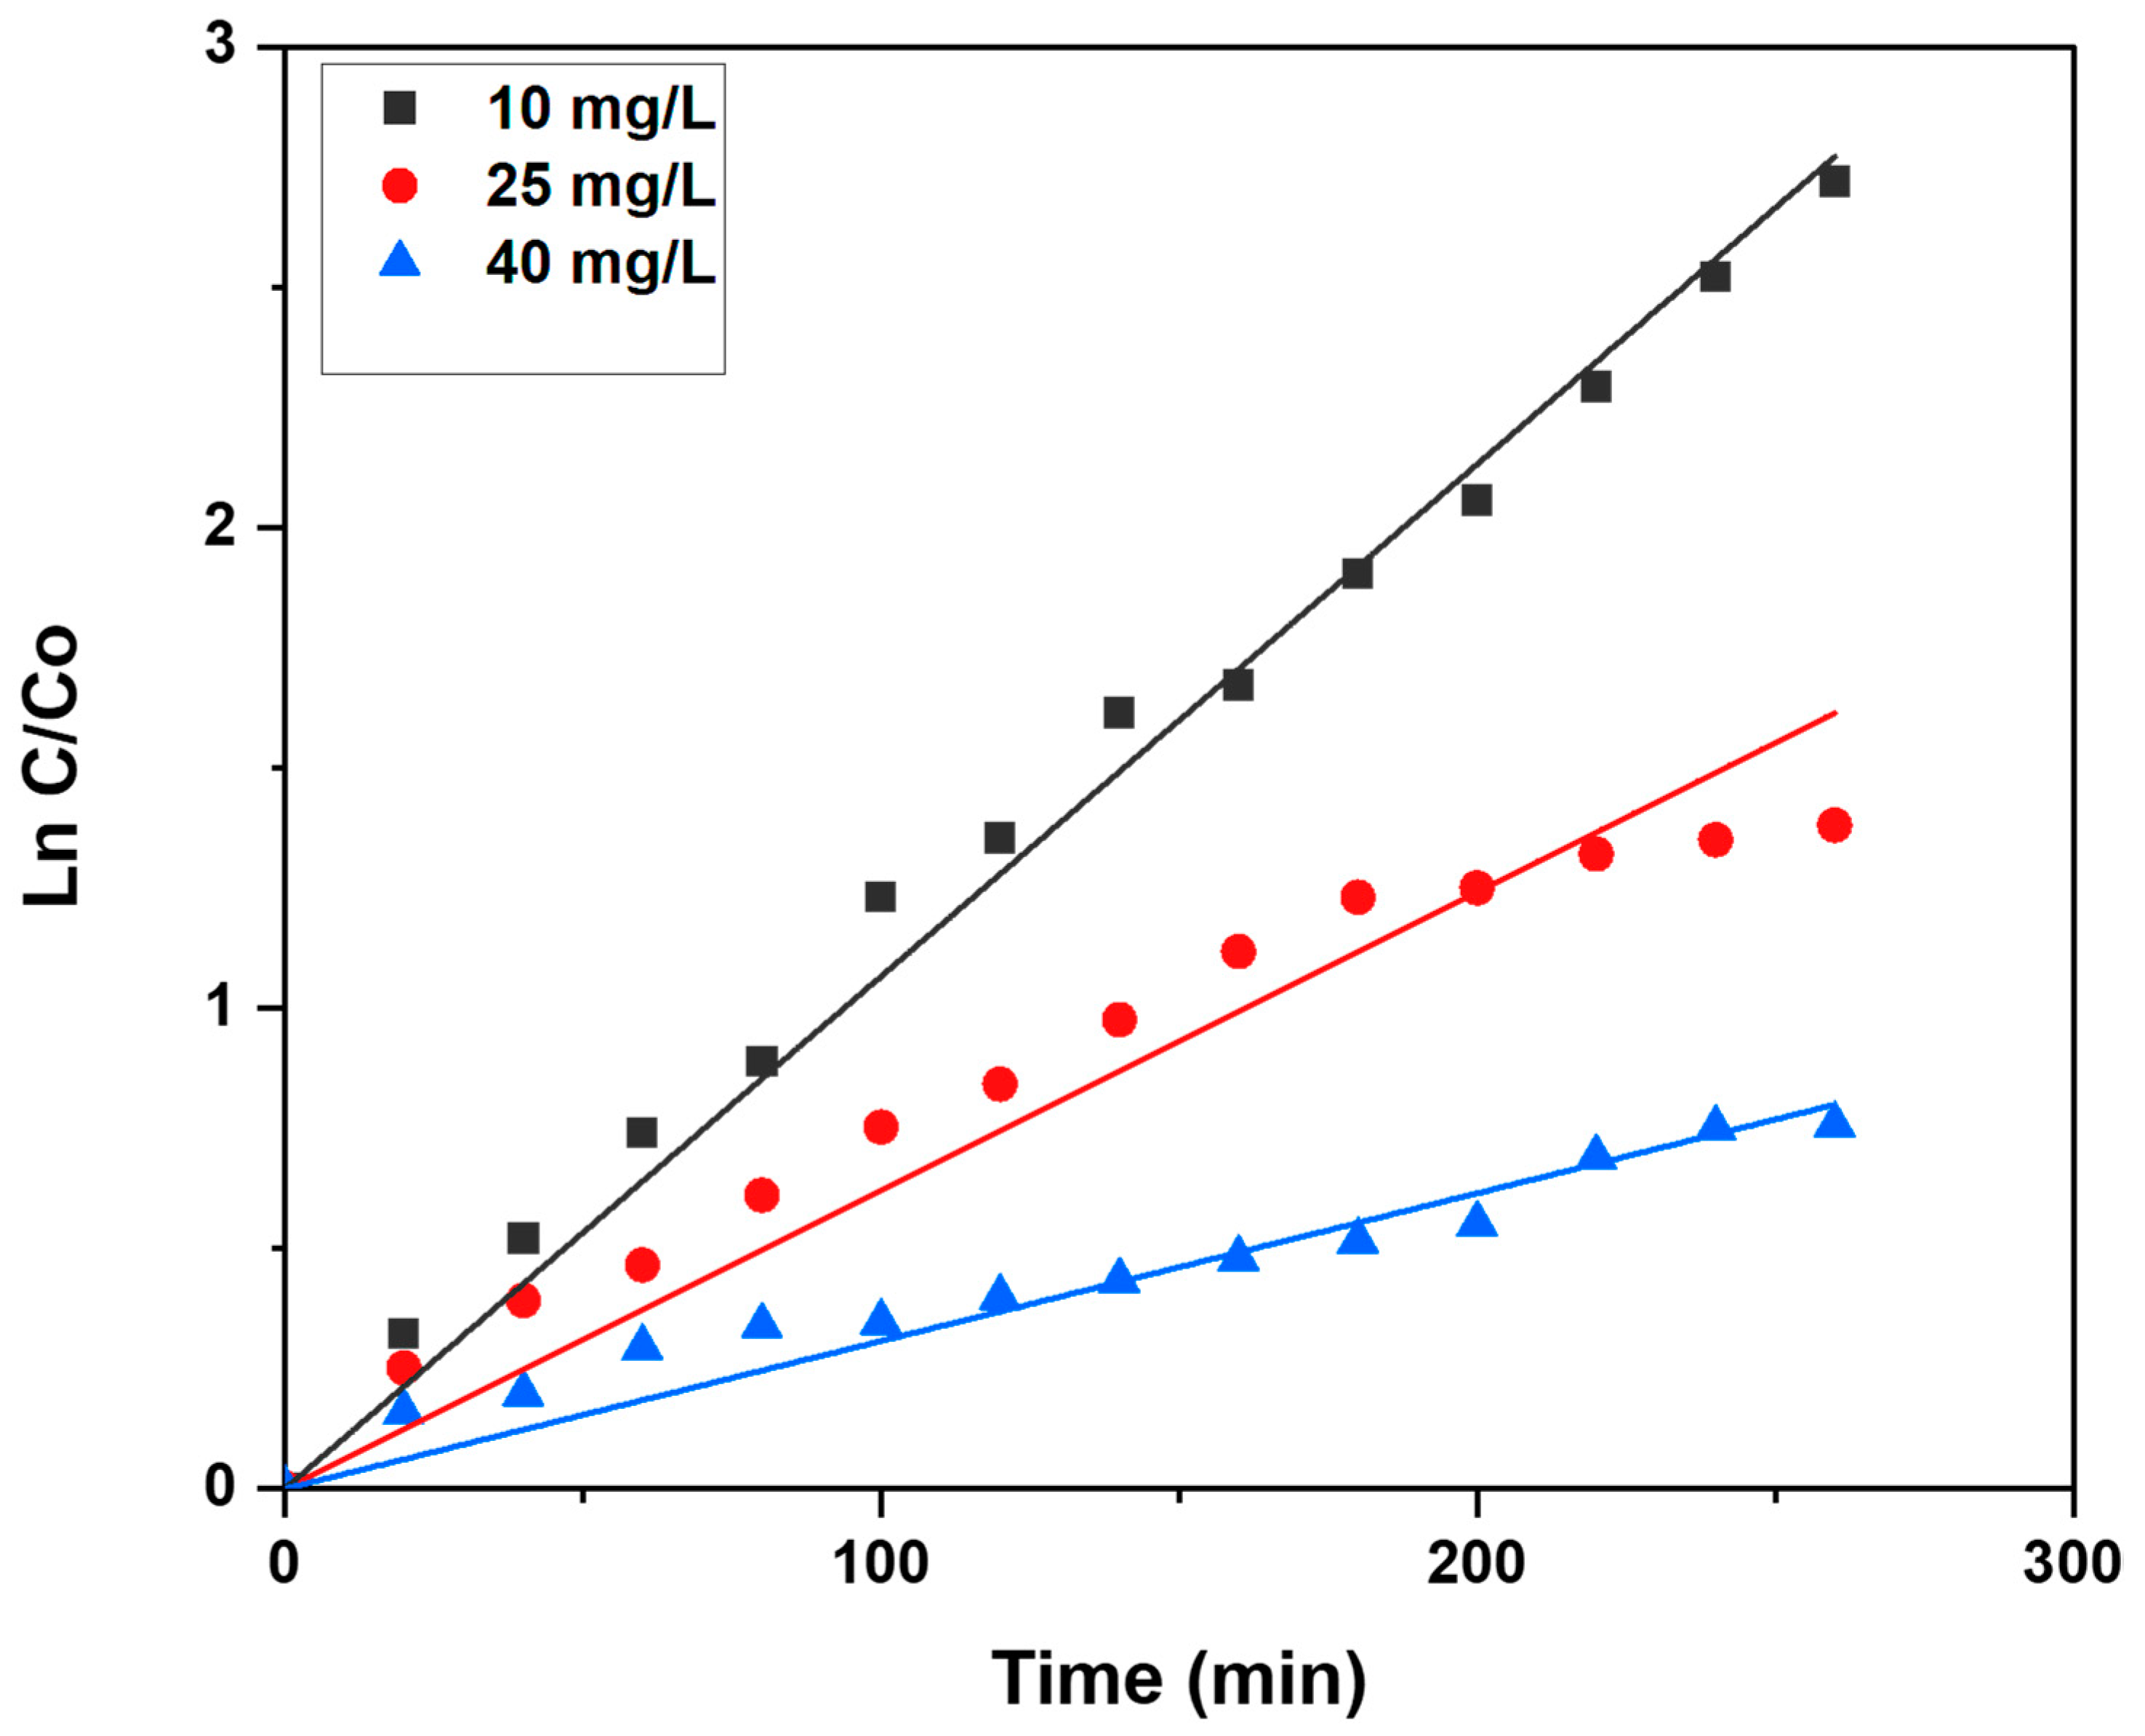
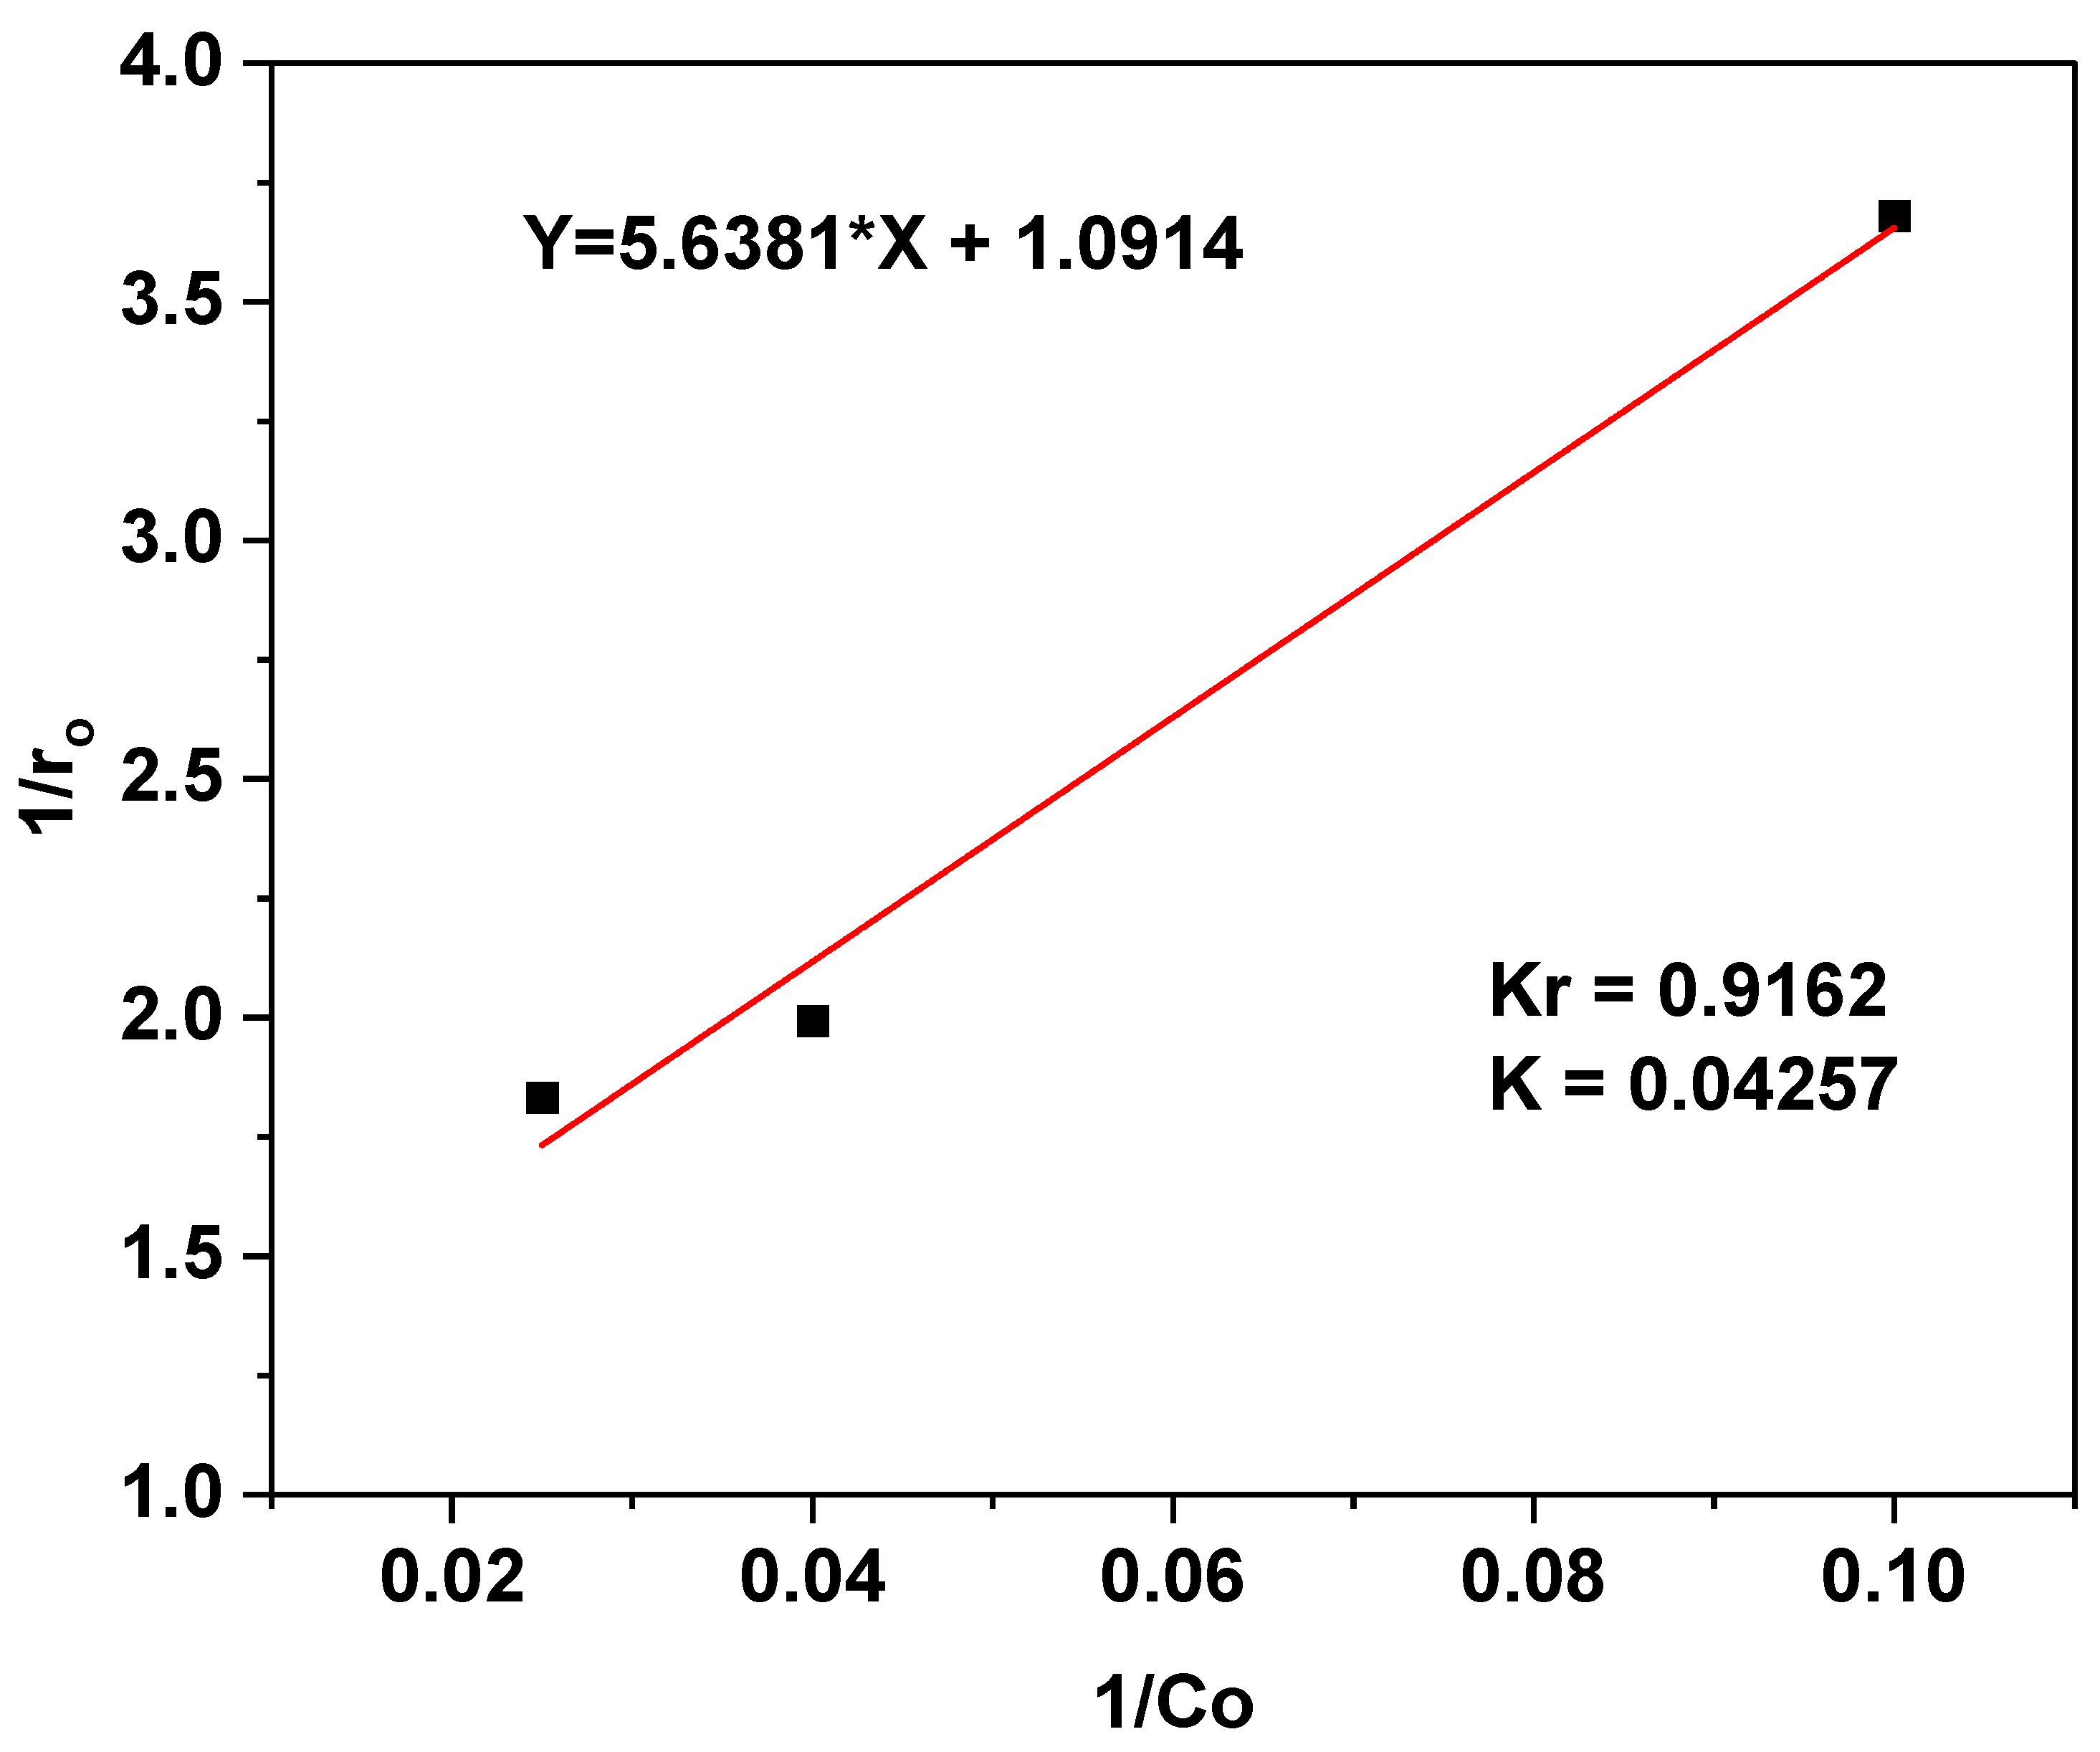
2.5. Degradation Kinetic Modeling
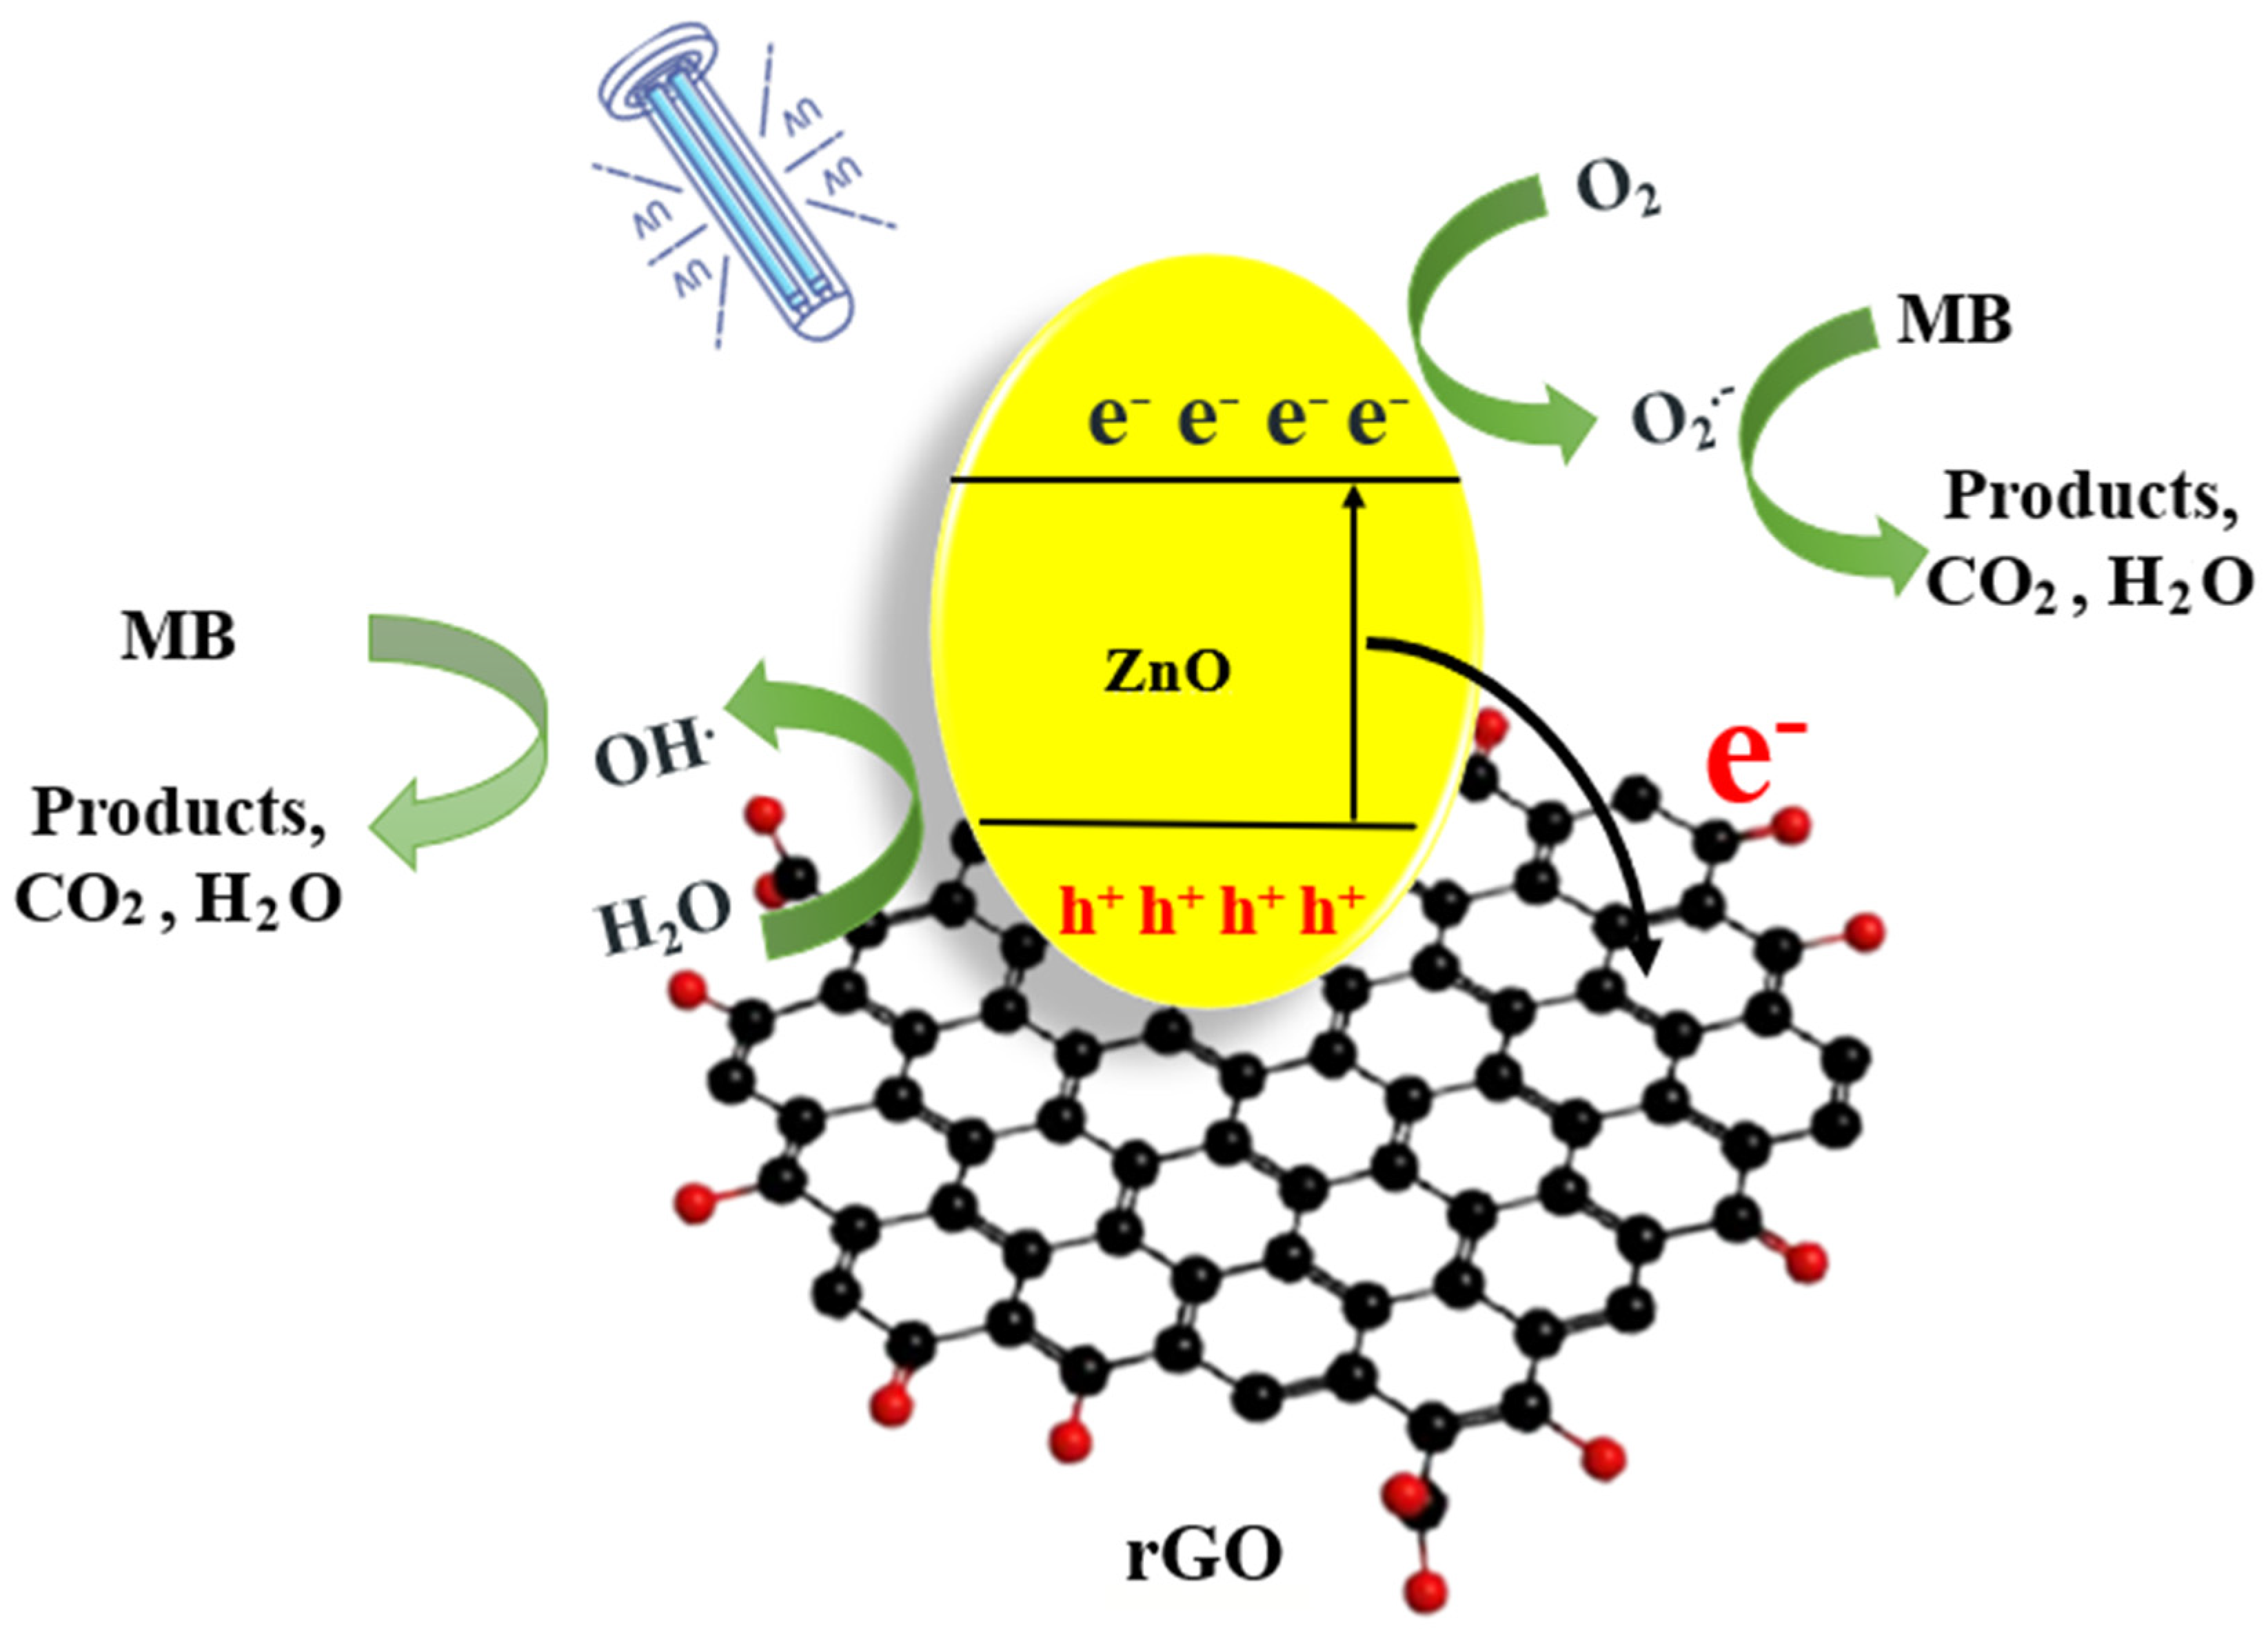
2.6. Proposed Photodegradation Mechanism
- (a)
- Oxidation by superoxide radicals: •O2⁻ attacks MB, causing its breakdown:•O2⁻ + MB (on ZnO/rGO) → Degraded Products
- (b)
- Oxidation by hydroxyl radicals: •OH radicals also attack MB, further breaking it down:•OH + MB (on ZnO/rGO) → Degraded Products
2.7. Comparison of the Photocatalytic Efficacy of Commercial TiO2 P25 and ZnO Nanoparticles Synthetized by Different Methods
3. Materials and Methods
3.1. Materials
3.2. Methods
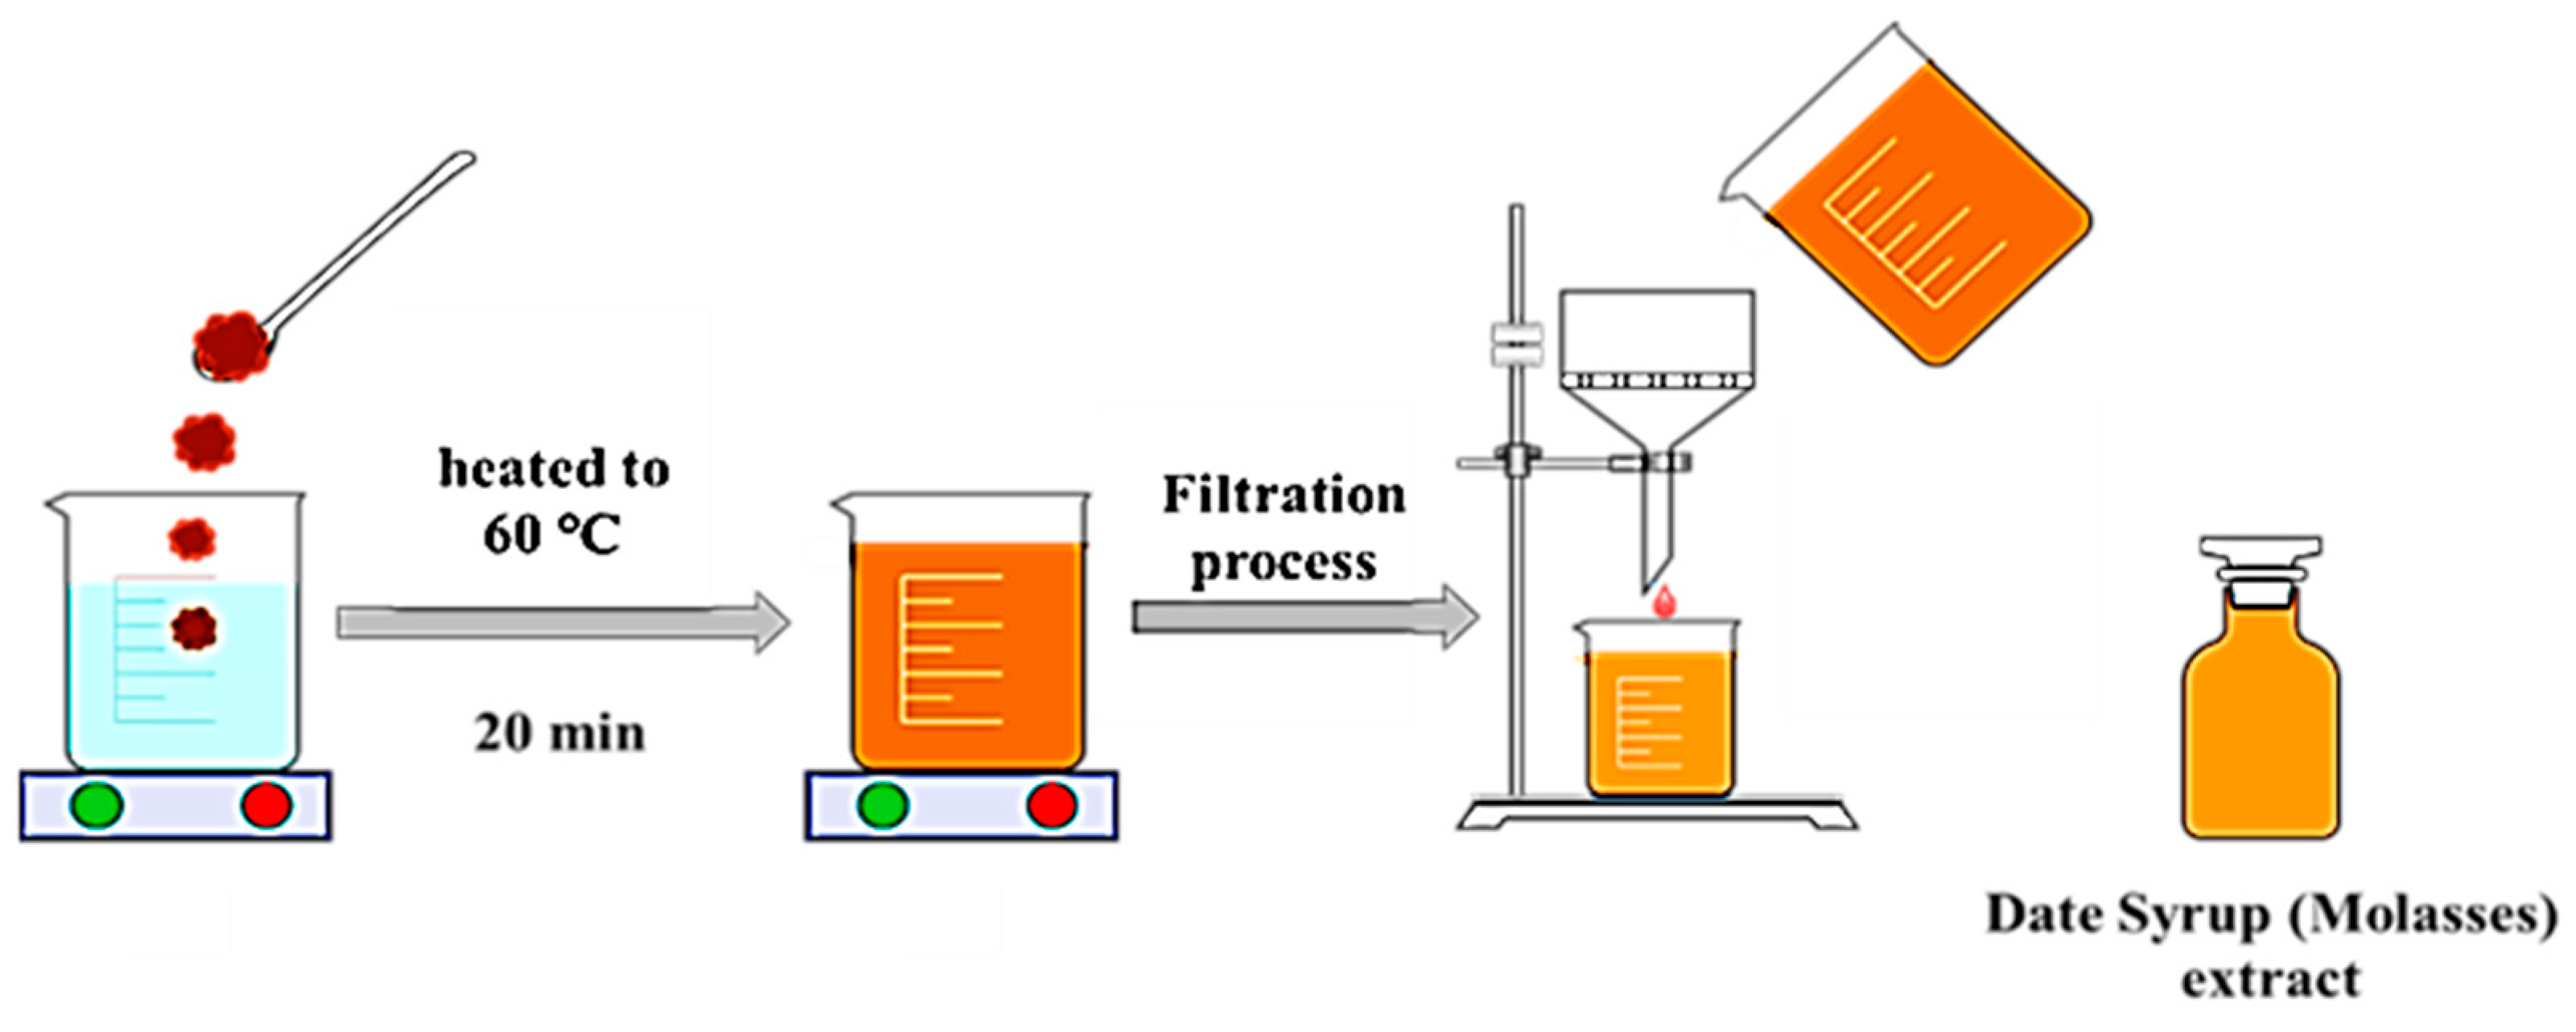
3.2.1. Algerian Date Syrup (Molasses) Extract Preparation
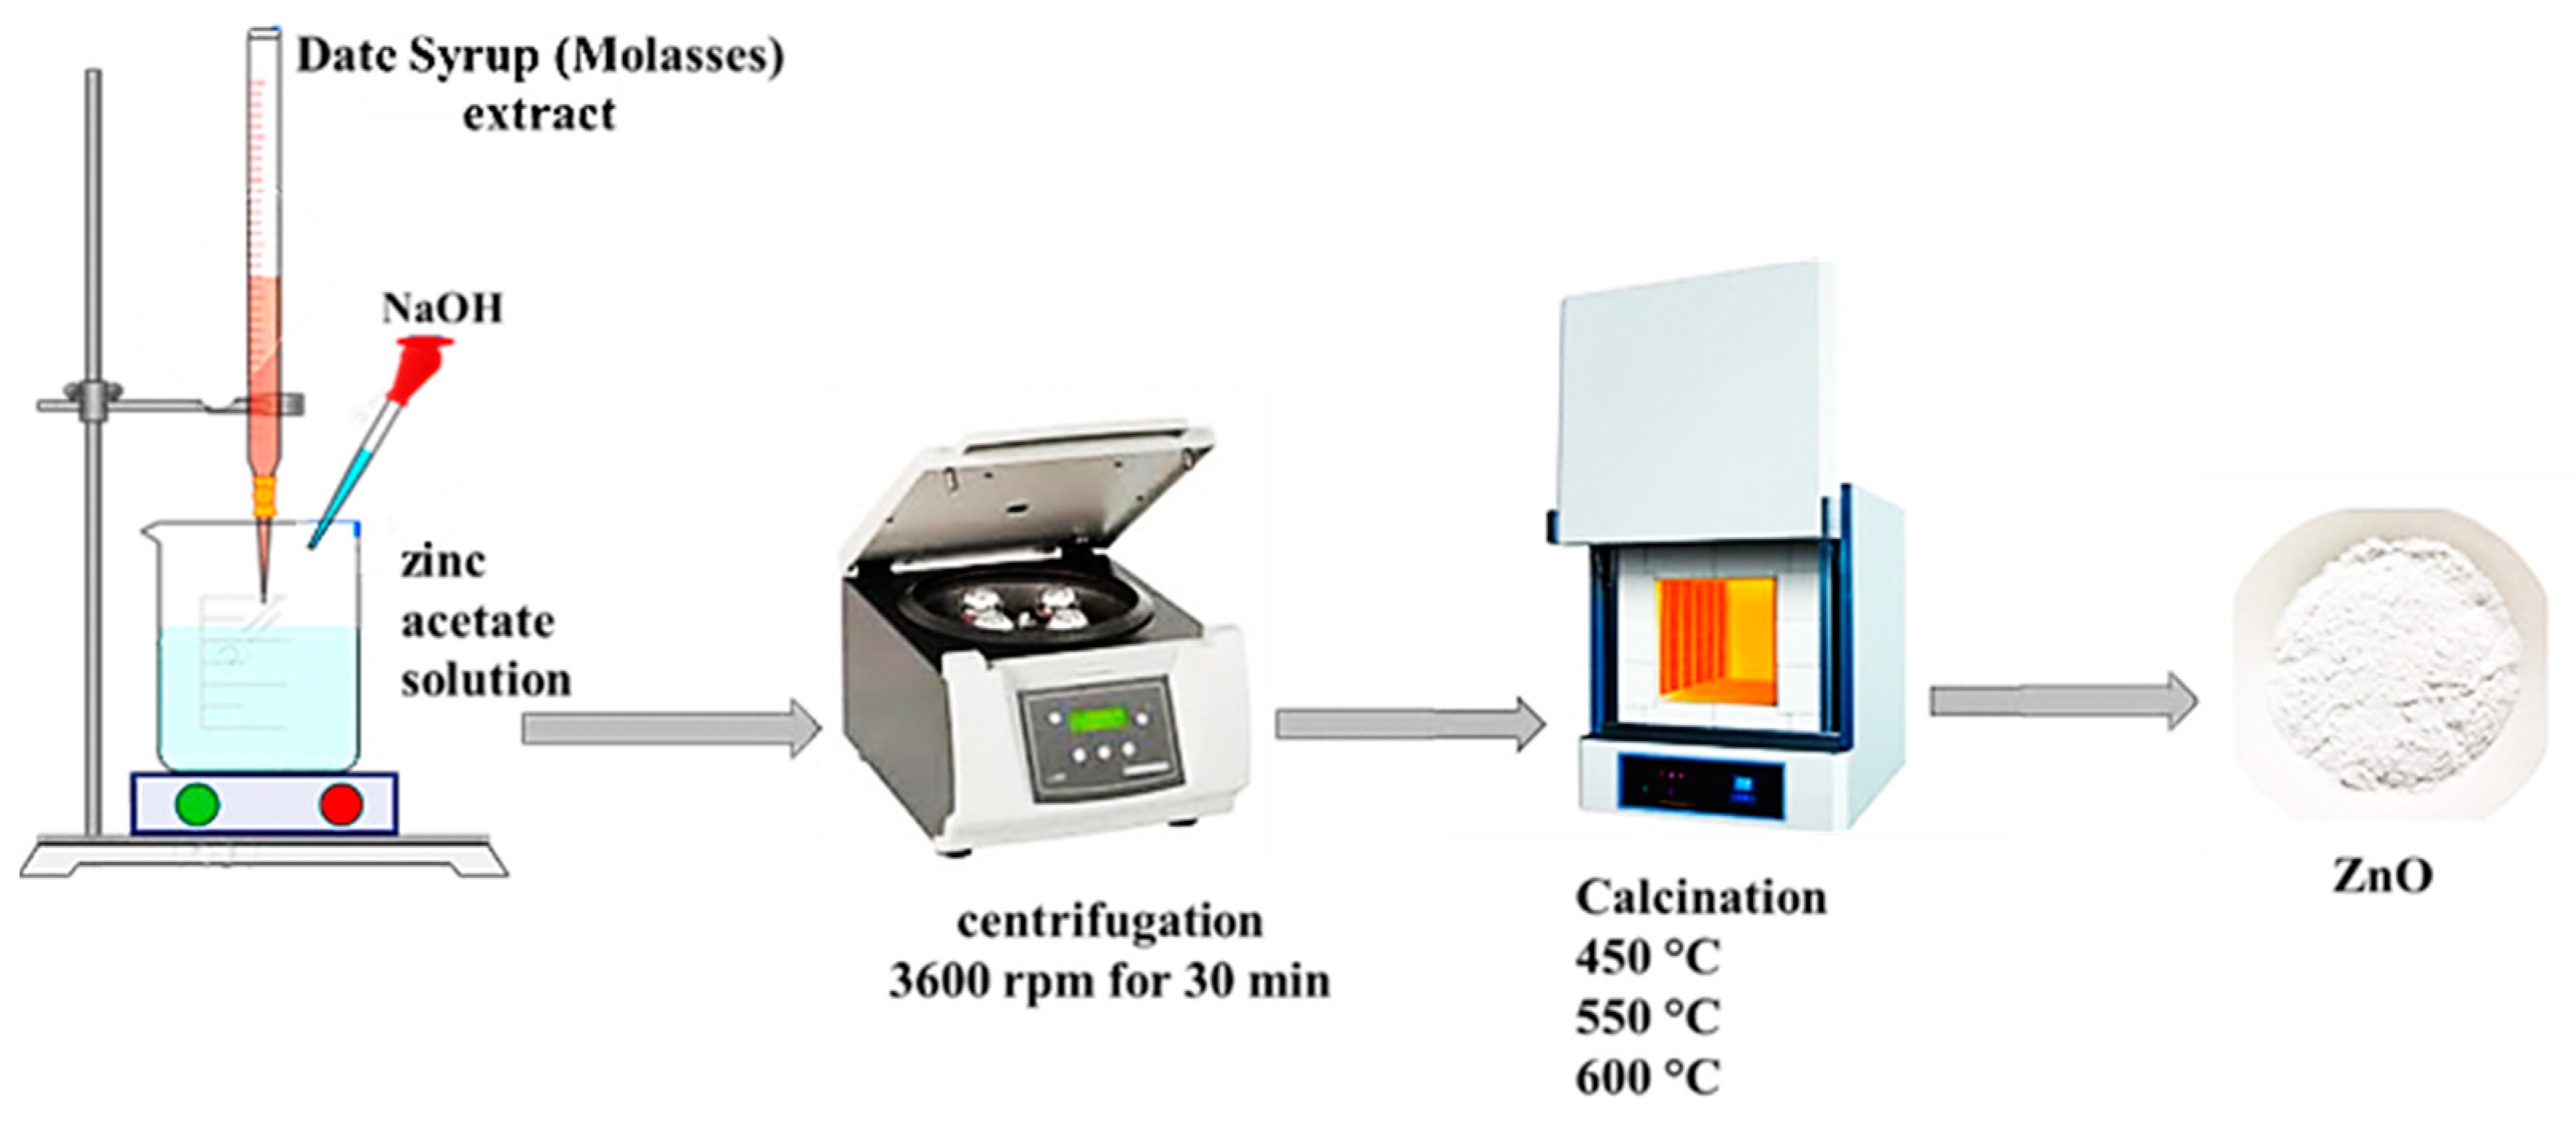
3.2.2. Synthesis of ZnO NPs
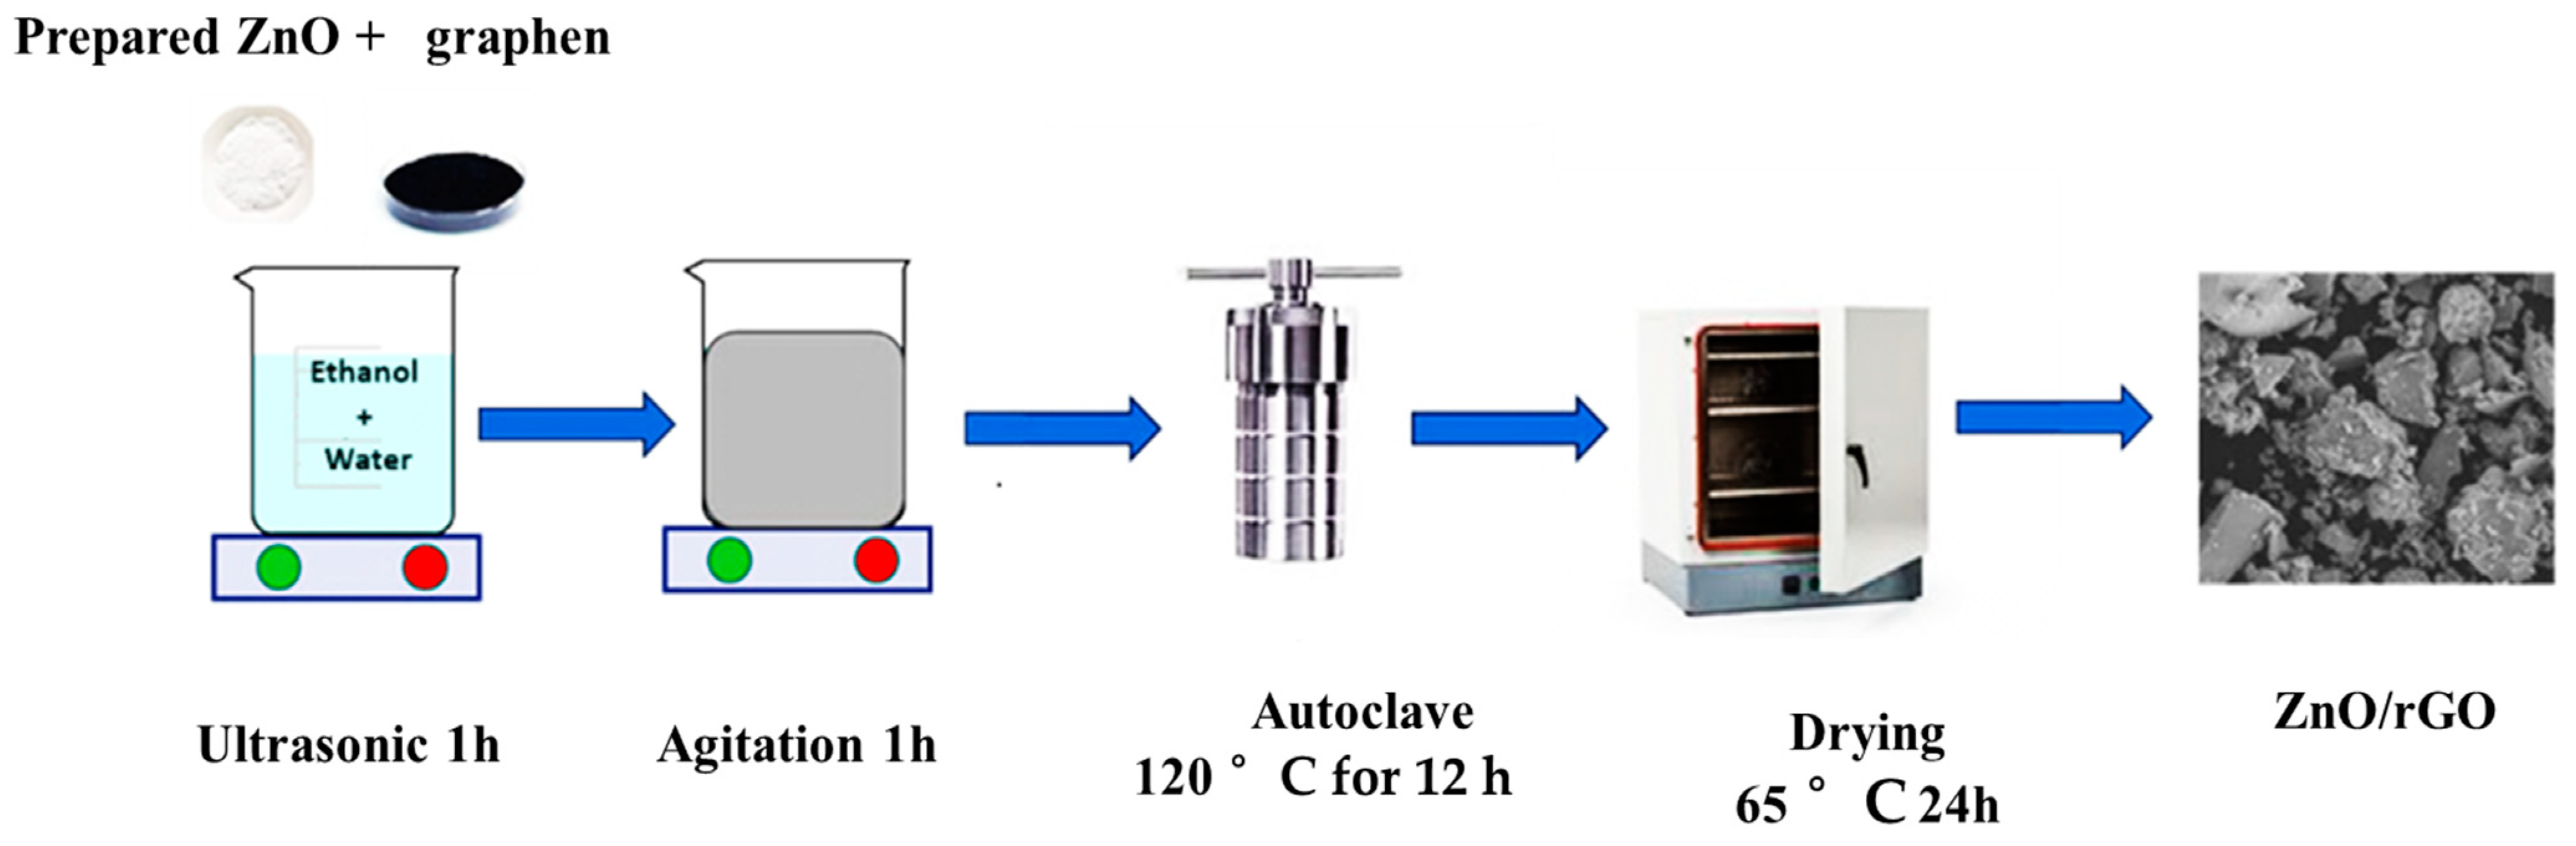
3.2.3. Preparation of ZnO/rGOx Photocatalysts
3.3. Characterization
3.4. Photocatalytic Degradation Studies of Methylene Blue
4. Conclusions
Author Contributions
Funding
Data Availability Statement
Conflicts of Interest
References
- Kuspanov, Z.; Bakbolat, B.; Baimenov, A.; Issadykov, A.; Yeleuov, M.; Daulbayev, C. Photocatalysts for a sustainable future: Innovations in large-scale environmental and energy applications. Sci. Total Environ. 2023, 885, 163914. [Google Scholar] [CrossRef] [PubMed]
- Guediri, M.K.; Chebli, D.; Bouguettoucha, A.; Bourzami, R.; Amrane, A. Interfacial coupling effects on adsorptive and photocatalytic performances for photoresponsive graphene-wrapped SrTiO3@Ag under UV–visible light: Experimental and DFT approach. Environ. Sci. Pollut. Res. 2022, 29, 28098–28114. [Google Scholar] [CrossRef] [PubMed]
- Khan, I.; Saeed, K.; Khan, I. Nanoparticles: Properties, applications and toxicities. Arab. J. Chem. 2019, 12, 908–931. [Google Scholar] [CrossRef]
- Tahir, M.B.; Sohaib, M.; Sagir, M.; Rafique, M. Role of Nanotechnology in Photocatalysis. In Encyclopedia of Smart Materials; Elsevier: Amsterdam, The Netherlands, 2021; pp. 578–589. [Google Scholar] [CrossRef]
- Pal, G.; Rai, P.; Pandey, A. Green Synthesis of Nanoparticles: A Greener Approach for a Cleaner Future; Elsevier: Amsterdam, The Netherlands, 2019; pp. 1–26. [Google Scholar] [CrossRef]
- Alsaiari, N.S.; Alzahrani, F.M.; Amari, A.; Osman, H.; Harharah, H.N.; Elboughdiri, N.; Tahoon, M.A. Plant and Microbial Approaches as Green Methods for the Synthesis of Nanomaterials: Synthesis, Applications, and Future Perspectives. Molecules 2023, 28, 463. [Google Scholar] [CrossRef] [PubMed]
- Baig, N.; Kammakakam, I.; Falath, W. Nanomaterials: A review of synthesis methods, properties, recent progress, and challenges. Mater. Adv. 2021, 2, 1821–1871. [Google Scholar] [CrossRef]
- Klinbumrung, A.; Panya, R.; Pung-Ngama, A.; Nasomjai, P.; Saowalakmeka, J.; Sirirak, R. Green synthesis of ZnO nano-particles by pineapple peel extract from various alkali sources. J. Asian Ceram. Soc. 2022, 10, 755–765. [Google Scholar] [CrossRef]
- Javed, M.N.; Bangash, S.A.K.; Abbas, M.; Ahmed, S.; Kaplan, A.; Iqbal, S.; Wahab, S. Potential and Challenges in Green Synthesis of Nanoparticles: A Review. Xi’an Shiyou Daxue Xuebao (Ziran Kexue Ban)/J. Xi’an Shiyou Univ. 2023, 19, 1155–1165. [Google Scholar]
- Kulkarni, D.; Sherkar, R.; Shirsathe, C.; Sonwane, R.; Varpe, N.; Shelke, S.; More, M.P.; Pardeshi, S.R.; Dhaneshwar, G.; Junnuthula, V.; et al. Biofabrication of nanoparticles: Sources, synthesis, and biomedical applications. Front. Bioeng. Biotechnol. 2023, 11, 1159193. [Google Scholar] [CrossRef]
- Balkrishna, A.; Kumar, A.; Arya, V.; Rohela, A.; Verma, R.; Nepovimova, E.; Krejcar, O.; Kumar, D.; Thakur, N.; Kuca, K. Phytoantioxidant Functionalized Nanoparticles: A Green Approach to Combat Nanoparticle-Induced Oxidative Stress. Oxidative Med. Cell. Longev. 2021, 2021, 1–20. [Google Scholar] [CrossRef]
- Kumar, H.; Bhardwaj, K.; Kuča, K.; Kalia, A.; Nepovimova, E.; Verma, R.; Kumar, D. Flower-Based Green Synthesis of Metallic Nanoparticles: Applications beyond Fragrance. Nanomaterials 2020, 10, 766. [Google Scholar] [CrossRef]
- Alhuzali, S.M.A.; Jibrin, N.M.H.; Aljaber, R.J.A.; Albisher, A.O.M. Dates palm (Phoenix dactylifera L.) Fruits: Nutritional Properties and Potential Applications. المجلة العربية للعلوم الزراعية 2023, 17, 137–160. [Google Scholar] [CrossRef]
- Rambabu, K.; Bharath, G.; Banat, F.; Show, P.L. Green synthesis of zinc oxide nanoparticles using Phoenix dactylifera waste as bioreductant for effective dye degradation and antibacterial performance in wastewater treatment. J. Hazard. Mater. 2020, 402, 123560. [Google Scholar] [CrossRef]
- Subhan, A.; Neogi, N.; Choudhury, K.P. Industrial Manufacturing Applications of Zinc Oxide Nanomaterials: A Comprehensive Study. Nanomanufacturing 2022, 2, 265–291. [Google Scholar] [CrossRef]
- Thakur, K.; Kandasubramanian, B. Graphene and Graphene Oxide-Based Composites for Removal of Organic Pollutants: A Review. J. Chem. Eng. Data 2019, 64, 833–867. [Google Scholar] [CrossRef]
- Al-Marri, A.H.; Janene, F.; Moulahi, A.; Mogharbel, A.T.; Al-Farraj, E.S.; Al-Mohaimeed, A.M.; Mjejri, I. Enhanced photocatalytic properties of the Nb2O5/rGO for the degradation of methylene blue. Ionics 2023, 29, 5505–5515. [Google Scholar] [CrossRef]
- Pu, Y.-C.; Chou, H.-Y.; Kuo, W.-S.; Wei, K.-H.; Hsu, Y.-J. Interfacial charge carrier dynamics of cuprous oxide-reduced graphene oxide (Cu2O-rGO) nanoheterostructures and their related visible-light-driven photocatalysis. Appl. Catal. B Environ. 2017, 204, 21–32. [Google Scholar] [CrossRef]
- Bagheri, S.; Esrafili, A.; Kermani, M.; Mehralipour, J.; Gholami, M. Performance evaluation of a novel rGO-Fe0/Fe3O4-PEI nanocomposite for lead and cadmium removal from aqueous solutions. J. Mol. Liq. 2020, 320, 114422. [Google Scholar] [CrossRef]
- Wen, M.Y.S.; Abdullah, A.H.; Ngee, L.H. Sintesis nanohibrid ZnO/rGO untuk mempertingkatkan aktiviti fo-topemangkinan. Malays. J. Anal. Sci. 2017, 21, 889–900. [Google Scholar] [CrossRef]
- Karpuraranjith, M.; Chen, Y.; Manigandan, R.; Srinivas, K.; Rajaboopathi, S. Hierarchical Ultrathin Layered GO-ZnO@CeO2 Nanohybrids for Highly Efficient Methylene Blue Dye Degradation. Molecules 2022, 27, 8788. [Google Scholar] [CrossRef]
- Li, D.; Lu, J.; Zhang, X.; Jin, D.; Jin, H. Engineering of ZnO/rGO towards NO2 Gas Detection: Ratio Modulated Sensing Type and Heterojunction Determined Response. Nanomaterials 2023, 13, 917. [Google Scholar] [CrossRef]
- Nandiyanto, A.B.D.; Zaen, R.; Oktiani, R. Correlation between crystallite size and photocatalytic performance of micrometer-sized monoclinic WO3 particles. Arab. J. Chem. 2020, 13, 1283–1296. [Google Scholar] [CrossRef]
- AbuDalo, M.A.; Al-Mheidat, I.R.; Al-Shurafat, A.W.; Grinham, C.; Oyanedel-Craver, V. Synthesis of silver nanoparticles using a modified Tollens’ method in conjunction with phytochemicals and assessment of their antimicrobial activity. PeerJ 2019, 7, e6413. [Google Scholar] [CrossRef]
- Matar, H.A.; Ibrahim, M.A.; El-Hagary, M. Simple and cost-effective route for PANI-ZnO-rGO nanocomposite as a biosensor for L-arginine detection. Diam. Relat. Mater. 2023, 133, 109703. [Google Scholar] [CrossRef]
- Souri, M.; Ghaemi, N.; Shakeri, A.; Hoseinpour, V. Optimization of green synthesis of ZnO nanoparticles by Dittrichia graveolens (L.) aqueous extract. Health Biotechnol. Biopharma 2017, 1, 39–49. [Google Scholar] [CrossRef]
- Alzahrani, E.A.; Nabi, A.; Kamli, M.R.; Albukhari, S.M.; Althabaiti, S.A.; Al-Harbi, S.A.; Khan, I.; Malik, M.A. Facile Green Synthesis of ZnO NPs and Plasmonic Ag-Supported ZnO Nanocomposite for Photocatalytic Degradation of Methylene Blue. Water 2023, 15, 384. [Google Scholar] [CrossRef]
- De Peres, M.L.; Delucis, R.d.A.; Amico, S.C.; Gatto, D.A. Zinc oxide nanoparticles from microwave-assisted solvothermal process: Photocatalytic performance and use for wood protection against xylophagous fungus. Nanomater. Nanotechnol. 2019, 9, 1847980419876201. [Google Scholar] [CrossRef]
- Christobel, G.J. Vibrational Spectroscopy of ZnO-ZnS Nanoparticles. Int. J. Sci. Res. 2013, 5, 2013. [Google Scholar] [CrossRef]
- Khan, S.H.; R, S.; Pathak, B.; Fulekar, M. Photocatalytic degradation of organophosphate pesticides (Chlorpyrifos) using synthesized zinc oxide nanoparticle by membrane filtration reactor under UV irradiation. Front. Nanosci. Nanotechnol. 2015, 1, 23–27. [Google Scholar] [CrossRef]
- Jaramillo-Páez, C.; Navío, J.; Hidalgo, M.; Macías, M. ZnO and Pt-ZnO photocatalysts: Characterization and photocatalytic activity assessing by means of three substrates. Catal. Today 2018, 313, 12–19. [Google Scholar] [CrossRef]
- Misra, K.P.; Kumawat, A.; Kumari, P.; Samanta, S.; Halder, N.; Chattopadhyay, S. Band Gap Reduction and Petal-like Nanostructure Formation in Heavily Ce-doped ZnO Nanopowders. J. Nano- Electron. Phys. 2021, 13, 02008. [Google Scholar] [CrossRef]
- Üstün, E.; Önbaş, S.C.; Çelik, S.K.; Ayvaz M, Ç.; Şahin, N. Green Synthesis of Iron Oxide Nanoparticles by Using Ficus Carica Leaf Extract and Its Antioxidant Activity. Biointerface Res. Appl. Chem. 2021, 12, 2108–2116. [Google Scholar] [CrossRef]
- Chandrappa, K.G.; Venkatesha, T.V. Electrochemical Synthesis and Photocatalytic Property of Zinc Oxide Nanoparticles. Nano-Micro Lett. 2012, 4, 14–24. [Google Scholar] [CrossRef]
- Sharma, V.; Sharma, J.; Kansay, V.; Sharma, V.D.; Sharma, A.; Kumar, S.; Bera, M. The effect of calcination temperatures on the structural and optical properties of zinc oxide nanoparticles and their influence on the photocatalytic degradation of leather dye. Chem. Phys. Impact 2023, 6, 100196. [Google Scholar] [CrossRef]
- Tien, H.N.; Luan, V.H.; Hoa, L.T.; Khoa, N.T.; Hahn, S.H.; Chung, J.S.; Shin, E.W.; Hur, S.H. One-pot synthesis of a reduced graphene oxide–zinc oxide sphere composite and its use as a visible light photocatalyst. Chem. Eng. J. 2013, 229, 126–133. [Google Scholar] [CrossRef]
- Xu, S.; Fu, L.; Pham, T.S.H.; Yu, A.; Han, F.; Chen, L. Preparation of ZnO flower/reduced graphene oxide composite with enhanced photocatalytic performance under sunlight. Ceram. Int. 2015, 41, 4007–4013. [Google Scholar] [CrossRef]
- Liu, H.R.; Shao, G.X.; Zhao, J.F.; Zhang, Z.X.; Zhang, Y.; Liang, J.; Liu, X.G.; Jia, H.S.; Xu, B.S. Worm-Like Ag/ZnO Core–Shell Heterostructural Composites: Fabrication, Characterization, and Photocatalysis. J. Phys. Chem. C 2012, 116, 16182–16190. [Google Scholar] [CrossRef]
- Fang, J.; Fan, H.; Dong, G. A facile way to synthesize cost-effective ZnO nanorods with enhanced photocatalytic activity. Mater. Lett. 2014, 120, 147–150. [Google Scholar] [CrossRef]
- Guediri, M.K.; Chebli, D.; Bouguettoucha, A.; Bourzami, R.; Amrane, A. Novel Fe2TiO5/reduced graphene oxide heterojunction photocatalyst with improved adsorption capacity and visible light photoactivity: Experimental and DFT approach. Environ. Sci. Pollut. Res. 2020, 28, 8507–8519. [Google Scholar] [CrossRef] [PubMed]
- Kaus, N.H.M.; Rithwan, A.F.; Adnan, R.; Ibrahim, M.L.; Thongmee, S.; Yusoff, S.F.M. Effective Strategies, Mechanisms, and Photocatalytic Efficiency of Semiconductor Nanomaterials Incorporating rGO for Environmental Contaminant Degradation. Catalysts 2021, 11, 302. [Google Scholar] [CrossRef]
- Garg, R.; Gupta, R.; Singh, N.; Bansal, A. Characterization and performance evaluation of synthesized ZnO nanoflowers, nanorods, and their hybrid nanocomposites with graphene oxide for degradation of Orange G. Environ. Sci. Pollut. Res. 2021, 28, 57009–57029. [Google Scholar] [CrossRef] [PubMed]
- Zhou, F.; Yan, C.; Liang, T.; Sun, Q.; Wang, H. Photocatalytic degradation of Orange G using sepiolite-TiO2 nanocomposites: Optimization of physicochemical parameters and kinetics studies. Chem. Eng. Sci. 2018, 183, 231–239. [Google Scholar] [CrossRef]
- Trenczek-Zajac, A.; Synowiec, M.; Zakrzewska, K.; Zazakowny, K.; Kowalski, K.; Dziedzic, A.; Radecka, M. Scavenger-Supported Photocatalytic Evidence of an Extended Type I Electronic Structure of the TiO2@Fe2O3 Interface. ACS Appl. Mater. Interfaces 2022, 14, 38255–38269. [Google Scholar] [CrossRef] [PubMed]
- Ahmad, R.; Mondal, P.K. Adsorption and Photodegradation of Methylene Blue by Using PAni/TiO2Nanocomposite. J. Dispers. Sci. Technol. 2012, 33, 380–386. [Google Scholar] [CrossRef]
- Aisien, F.; Amenaghawon, A.N.; Urhobotie, O.I. Potential Application of a Locally Sourced Photocatalyst for the Photocatalytic Decolourisation of Methyl Orange in Aqueous Solution. J. Eng. Sci. Technol. 2015, 1641–1653. [Google Scholar]
- Gupta, N.K.; Ghaffari, Y.; Kim, S.; Bae, J.; Kim, K.S.; Saifuddin, M. Photocatalytic Degradation of Organic Pollutants over MFe2O4 (M = Co, Ni, Cu, Zn) Nanoparticles at Neutral pH. Sci. Rep. 2020, 10, 4942. [Google Scholar] [CrossRef] [PubMed]
- Raghu, M.; Parashuram, L.; Prashanth, M.; Kumar, K.Y.; Kumar, C.P.; Alrobei, H. Simple in-situ functionalization of polyaniline with boroncarbonitride as potential multipurpose photocatalyst: Generation of hydrogen, organic and inorganic pollutant detoxification. Nano-Struct. Nano-Objects 2021, 25, 100667. [Google Scholar] [CrossRef]
- Sánchez-Albores, R.; Cano, F.J.; Sebastian, P.; Reyes-Vallejo, O. Microwave-assisted biosynthesis of ZnO-GO particles using orange peel extract for photocatalytic degradation of methylene blue. J. Environ. Chem. Eng. 2022, 10, 108924. [Google Scholar] [CrossRef]
- Waghchaure, R.H.; Adole, V.A.; Jagdale, B.S. Photocatalytic degradation of methylene blue, rhodamine B, methyl orange and Eriochrome black T dyes by modified ZnO nanocatalysts: A concise review. Inorg. Chem. Commun. 2022, 143, 109764. [Google Scholar] [CrossRef]
- Ma, S.; Huang, Y.; Hong, R.; Lu, X.; Li, J.; Zheng, Y. Enhancing Photocatalytic Activity of ZnO Nanoparticles in a Circulating Fluidized Bed with Plasma Jets. Catalysts 2021, 11, 77. [Google Scholar] [CrossRef]
- Rodríguez-Cabo, B.; Rodríguez-Palmeiro, I.; Corchero, R.; Rodil, R.; Rodil, E.; Arce, A.; Soto, A. Photocatalytic degradation of methyl orange, methylene blue and rhodamine B with AgCl nanocatalyst synthesised from its bulk material in the ionic liquid [P6 6 6 14]Cl. Water Sci. Technol. 2016, 75, 128–140. [Google Scholar] [CrossRef]
- Ghaffar, S.; Abbas, A.; Naeem-Ul-Hassan, M.; Assad, N.; Sher, M.; Ullah, S.; Alhazmi, H.A.; Najmi, A.; Zoghebi, K.; Al Bratty, M.; et al. Improved Photocatalytic and Antioxidant Activity of Olive Fruit Extract-Mediated ZnO Nanoparticles. Antioxidants 2023, 12, 1201. [Google Scholar] [CrossRef] [PubMed]
- Azarang, M.; Shuhaimi, A.; Yousefi, R.; Jahromi, S.P. One-pot sol–gel synthesis of reduced graphene oxide uniformly decorated zinc oxide nanoparticles in starch environment for highly efficient photodegradation of Methylene Blue. RSC Adv. 2015, 5, 21888–21896. [Google Scholar] [CrossRef]
- Gawade, V.V.; Sabale, S.R.; Dhabbe, R.S.; Kite, S.V.; Garadkar, K.M. Bio-mediated synthesis of ZnO nanostructures for efficient photodegradation of methyl orange and methylene blue. J. Mater. Sci. Mater. Electron. 2021, 32, 28573–28586. [Google Scholar] [CrossRef]
- Shahzad, R.; Muneer, M.; Khalid, R.; Amin, H.M.A. ZnO-Bi2O3 Heterostructured Composite for the Photocatalytic Degradation of Orange 16 Reactive Dye: Synergistic Effect of UV Irradiation and Hydrogen Peroxide. Catalysts 2023, 13, 1328. [Google Scholar] [CrossRef]
- Reynes, M.; Bouabidi, H.; Piombo, G.; Risterucci, A.M. Caracterisation des principales varietes de dattes cultivees dans la region du Djerid en Tunisie. Fruits 1994, 49, 289–298. [Google Scholar]
- Afnor, Ø. Recueil de Normes Françaises des Produits Dérivés des Fruits et Légumes jus de Fruits; AFNOR: Paris, France, 1982; Volume 325. [Google Scholar]
- Linden, G.; Lavoisier, É. Techniques D’analyse et de Contrôle dans les Industries Agro-Alimentaires: Principes des Techniques D’analyse; Tec & Doc: Paris, France, 1984. [Google Scholar]
- Miller, G.L. Use of Dinitrosalicylic Acid Reagent for Determination of Reducing Sugar. Anal. Chem. 1959, 31, 426–428. [Google Scholar] [CrossRef]
- Ben Thabet, I.; Besbes, S.; Masmoudi, M.; Attia, H.; Deroanne, C.; Blecker, C. Compositional, Physical, Antioxidant and Sensory Characteristics of Novel Syrup from Date Palm (Phoenix dactylifera L.). Food Sci. Technol. Int. 2009, 15, 583–590. [Google Scholar] [CrossRef]
- AOAC. Official Methods of Analysis, 16th ed.; Association of Official Analytical Chemists: Washington, DC, USA, 1995. [Google Scholar]
- Juntachote, T.; Berghofer, E.; Siebenhandl, S.; Bauer, F. Antioxidative effect of added dried Holy basil and its ethanolic extracts on susceptibility of cooked ground pork to lipid oxidation. Food Chem. 2007, 100, 129–135. [Google Scholar] [CrossRef]
- Gursoy, N.; Sarikurkcu, C.; Cengiz, M.; Solak, M.H. Antioxidant activities, metal contents, total phenolics and flavonoids of seven Morchella species. Food Chem. Toxicol. 2009, 47, 2381–2388. [Google Scholar] [CrossRef]


| Samples | Crystallite Size (nm) |
|---|---|
| ZnO non-calcined | 13.99 |
| ZnO calcined at 550 °C | 14.18 |
| ZnO/rGO 5% | 21.42 |
| ZnO/rGO 10% | 20.06 |
| ZnO/rGO 15% | 17.31 |
| Samples | Non-Calcined | 600 °C | 550 °C | 450 °C |
|---|---|---|---|---|
| K (min−1) | 0.0039 | 0.0106 | 0.0156 | 0.0103 |
| R2 | 0.94113 | 0.99285 | 0.99026 | 0.99124 |
| Samples | ZnO | ZnO/rGO5% | ZnO/rGO10% | ZnO/rGO15% |
|---|---|---|---|---|
| K (min−1) | 0.0156 | 0.0106 | 0.0272 | 0.0103 |
| R2 | 0.99026 | 0.99628 | 0.99944 | 0.98212 |
| Dosage (g/L) | 0.25 | 0.5 | 1 | 2 |
|---|---|---|---|---|
| K (min−1) | 0.0115 | 0.0188 | 0.0272 | 0.0082 |
| R2 | 0.99219 | 0.99801 | 0.99944 | 0.99401 |
| pH | 4 | Neutral | 8 | 10 |
|---|---|---|---|---|
| K (min−1) | 0.0079 | 0.0278 | 0.0177 | 0.0223 |
| R2 | 0.97781 | 0.99944 | 0.97807 | 0.9538 |
| Catalyst | Preparation Method/Plant | Dye | Irradiation | Particle Size (nm) | Irradiation Time/min | Catalyst Dose/g L−1 | Dye Conc./ mg L−1 | Degradation Efficiency/% | Ref. |
|---|---|---|---|---|---|---|---|---|---|
| P25 Degussa | MB | UV lamp | <21 | 60 | 1 | 10 | 41 | [52] | |
| ZnO@OFE | Biosynthesis O. europaea | MB | Sunlight | 24.3 | 180 | 1 | 10 | 75 | [53] |
| ZnO | Sol gel | MB | UV (Hg lamp 365 nm) | 25 | 120 | 0.33 | 10 | 37 | [54] |
| ZnO | Biosynthesis/ Syzygium cumini | MB | UV (365 nm) | 25–30 | 60 | 2 | 1–2 | 84 | [55] |
| ZnO-Bi2O3 | Co-precipitation | RO16 | UV lamp | 29.6 | 100 | 0.2 | 100 | 28 | [56] |
| ZnO | Biosynthesis/ Date Syrup | MB | UV lamp | 14 | 140 | 1 | 10 | 86.6 | Present work |
| ZnO/rGO | Hydrothermal | MB | UV lamp | 20 | 140 | 1 | 10 | 100 | This work |
Disclaimer/Publisher’s Note: The statements, opinions and data contained in all publications are solely those of the individual author(s) and contributor(s) and not of MDPI and/or the editor(s). MDPI and/or the editor(s) disclaim responsibility for any injury to people or property resulting from any ideas, methods, instructions or products referred to in the content. |
© 2024 by the authors. Licensee MDPI, Basel, Switzerland. This article is an open access article distributed under the terms and conditions of the Creative Commons Attribution (CC BY) license (https://creativecommons.org/licenses/by/4.0/).
Share and Cite
Madi, K.; Chebli, D.; Ait Youcef, H.; Tahraoui, H.; Bouguettoucha, A.; Kebir, M.; Zhang, J.; Amrane, A. Green Fabrication of ZnO Nanoparticles and ZnO/rGO Nanocomposites from Algerian Date Syrup Extract: Synthesis, Characterization, and Augmented Photocatalytic Efficiency in Methylene Blue Degradation. Catalysts 2024, 14, 62. https://doi.org/10.3390/catal14010062
Madi K, Chebli D, Ait Youcef H, Tahraoui H, Bouguettoucha A, Kebir M, Zhang J, Amrane A. Green Fabrication of ZnO Nanoparticles and ZnO/rGO Nanocomposites from Algerian Date Syrup Extract: Synthesis, Characterization, and Augmented Photocatalytic Efficiency in Methylene Blue Degradation. Catalysts. 2024; 14(1):62. https://doi.org/10.3390/catal14010062
Chicago/Turabian StyleMadi, Kamilia, Derradji Chebli, Hakima Ait Youcef, Hichem Tahraoui, Abdallah Bouguettoucha, Mohammed Kebir, Jie Zhang, and Abdeltif Amrane. 2024. "Green Fabrication of ZnO Nanoparticles and ZnO/rGO Nanocomposites from Algerian Date Syrup Extract: Synthesis, Characterization, and Augmented Photocatalytic Efficiency in Methylene Blue Degradation" Catalysts 14, no. 1: 62. https://doi.org/10.3390/catal14010062
APA StyleMadi, K., Chebli, D., Ait Youcef, H., Tahraoui, H., Bouguettoucha, A., Kebir, M., Zhang, J., & Amrane, A. (2024). Green Fabrication of ZnO Nanoparticles and ZnO/rGO Nanocomposites from Algerian Date Syrup Extract: Synthesis, Characterization, and Augmented Photocatalytic Efficiency in Methylene Blue Degradation. Catalysts, 14(1), 62. https://doi.org/10.3390/catal14010062