Abstract
A series of composites containing nanoparticles of NiO (from 1 to 10% by weight per Ni), deposited on NORIT charcoal, was prepared by the decomposition of the Ni0 complex Ni(cod)2 (cod = cis,cis-1,5-cyclooctadiene). Ni content in the composites was set by loading the appropriate quantities of the Ni(cod)2 precursor. The catalytic activity of the composites was associated with the in situ generation of active sites due to a reduction in NiO, hence the composites could be stored in air without a loss in their catalytic performance. The composites were analyzed by powder XRD, TEM, XPS, and adsorption methods. The hydrogenation of quinoline was used as a reference reaction for studies of the influence of temperature, P(H2), catalyst loading on the product yield, and for the selection of the composite possessing the highest performance. It was found that 3% Ni loading was the most optimal. This composite was used as an efficient catalyst for the hydrogenation of compounds with ethylene and acetylene bonds, nitro- and keto- groups as well as a series of substituted quinolines and analogs. The studied composites can be proposed as air-stable and efficient catalysts for the hydrogenation of a wide range of organic compounds.
1. Introduction
The hydrogenation of unsaturated compounds by hydrogen is one of the most demanded processes in organic chemistry. Hydrogenation has been widely used in lab-scale fine organic synthesis as well as in the chemical industry [1,2,3]. In the dominating majority of cases, hydrogenation requires a catalyst, usually a system containing platinum group metals (PGM) [4,5,6] or 3d metal [7,8,9,10]. The advantage of PGM catalysts include their high activity and selectivity, however, the high (and continuously increasing) price for Pd and Pt is a serious obstacle to a wide application of these systems, especially for large-scale chemical production [11]. The catalysts based on 3d metals, mainly groups 8–10 (Fe, Co, Ni) are a good alternative, and many systems efficient in hydrogenation [12,13,14,15,16,17] and related processes [18,19,20,21] have been recently reported. However, despite many studies performed in this field, the search for an efficient hydrogenation catalyst based on cheap 3d metals is still a challenging task.
Heterogeneous hydrogenation catalysts have several important advantages over soluble metal complexes (i.e., simplicity of separation from the reaction mixture and the possibility of simple repeated use) [22,23]. Such systems are usually created by formation of metallic nanoparticles on suitable supports; the method of nanoparticle formation and the composite catalyst preparation technique play a critical role in the determination of the catalytic activity of such systems [24,25,26,27,28,29].
This study aimed to develop an efficient Ni-based catalyst that can easily be prepared on a multi-gram scale and can be used for the routine hydrogenation of a wide range of organic compounds in conditions of heterogeneous catalysis. This study was grounded on two ideas: first, nickel-based systems have good potential for use in hydrogenation, which has been confirmed by the wide application of Raney nickel [30,31,32], and second, the decomposition of complexes of zero-valent metals can be a way to prepare catalytic systems possessing an outstanding catalytic activity [33,34,35]. In particular, it has been shown that the decomposition of the Ni0(cod)2 complex (Figure 1; cod = cis,cis-1,5-cyclooctadiene) without a carrier [36] or in the presence of charcoal [34] led to an efficient catalyst for the cleavage of diaryl ether C–O bonds. The catalyst described in [34] was reported to be air-sensitive and was stored at −30 °C in a freezer inside the glovebox. However, many so-called “metal-based” hydrogenation catalysts, in fact, contain metal oxide, which is transformed into metal under the action of H2 in situ [37,38,39]. We supposed that aerial oxidation of the metallic nanoparticle immobilized on the solid support might not be a critical factor for the restoration of high catalytic activity under the conditions of the hydrogenation process.
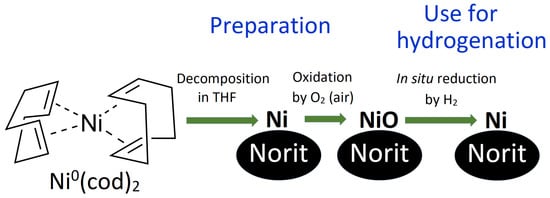
Figure 1.
Scheme of the preparation and use of Ni/C-X composites and formula of the Ni(cod)2 complex, used as a precursor for Ni nanoparticles.
In this study, we reported the synthesis, structure, and catalytic properties of Ni-based catalysts, prepared by the decomposition of the Ni(cod)2 complex on NORIT charcoal (hereinafter referred to as the Ni/C catalyst). Four samples were prepared, which differed by overall Ni content. These composites are hereinafter referred to as Ni/C-1 (1% of Ni by weight), Ni/C-3 (3% of Ni), Ni/C-5 (5% of Ni), and Ni/C-10 (10% of Ni) (though the samples contained both NiO and Ni, only Ni is mentioned in the abbreviation for simplification). A scheme illustrating the preparation of the composites and their use in catalytic hydrogenation is presented in Figure 1. Preparation of the composites included the decomposition of the Ni(cod)2 precursor in the presence of NORIT charcoal and the oxidation of Ni nanoparticles to NiO by aerial oxygen. The catalysts reported herein were stored in air but showed high catalytic productivity in the hydrogenation of a wide range of organic compounds. In the course of the hydrogenation process, NiO is in situ reduced to Ni, which plays the role of the active component of the catalyst. The use of the Ni/C catalyst was safer compared to Raney nickel since the former was not pyrophoric.
2. Results and Discussion
The composites Ni/C-X (X = 1, 3, 5, and 10, this value indicates the weight% of Ni in the form of Ni and NiO) were prepared by the decomposition of Ni(cod)2 in solution in THF in the presence of NORIT charcoal (details are presented in Experimental section). The decomposition of Ni(cod)2 in quantity, which corresponded to 1 and 3% loading counting per metal, occurred at room temperature during 5 min of stirring; the end of the process could be detected by decolorization of the yellow solution of Ni(cod)2. In contrast, at increased loadings of Ni(cod)2, which corresponded to 5 and 10% loadings of Ni in the resulting composite, the yellow color of the solution did not disappear at room temperature, and the reaction mixtures were heated to boiling for completion of the reaction. The prepared composites were stored in air.
The method of the Ni/C-X composite preparation was similar to the one reported in [34], but the essential differences involved a shorter reaction time (5 min instead of 1 h), heating of the reaction mixtures in the cases of the Ni/C-5 and Ni/C-10 composites, and the most important, storage of the prepared composites in air.
According to the data of the EDX analysis, all composites contained a significant quantity of oxygen and the Ni:O ratio in all cases significantly exceeded 1:1, expected for NiO (Table S1, Supplementary Materials). Although some oxygen definitely originated from the NORIT support, it should be noted that the oxygen content in all samples was sufficiently high and did not preclude the formation of NiO. The atomic ratio of O:Ni logically decreased with an increase in the Ni content, which is consistent with the supposition that some part of the oxygen originated from the carrier and its content in the carrier was constant in all samples.
Only one wide reflection was found on the powder XRD patterns of the composites Ni/C-1–Ni/C-10 (Figure 2). This reflection was centered at 2θ = 44.1–44.4°; this position was between the positions of the most intense reflections for NiO (2θ = 43.1° for (200) reflection of NiO, Fmm space group) [40] and Ni (2θ = 44.5° for (111) reflection of Ni, Fmm space group) [40]. Notably, the maximum of the wide reflection in the powder XRD patterns of the Ni/C-X composites shifted with an increase in the Ni content toward 2θ for the (111) reflection of Ni. This finding could evidence the increased content of the metallic Ni in the composite with an increasing overall loading of this element, presumably due to more efficient shielding of the Ni core by the NiO shell, which protects it from oxidation in air. Notably, no Ni0 was found in Ni/C-3 by XPS, evidencing that metallic Ni was not present in the samples containing at least 3% of Ni or less. Thus, the composites contained finely dispersed nanoparticles, which presumably consisted of NiO (minor content of metallic Ni could not be excluded in the case of the composites with high Ni content); this conclusion is consistent with the known ability of the nanosized Ni to be readily oxidized to NiO upon the exposure to aerial oxygen. The large width of the reflections can be explained by the small size of the nanoparticles [41]; it also can be concluded that the composites did not contain any large crystallites, which could give rise to sharp intense reflections on the XRD patterns.
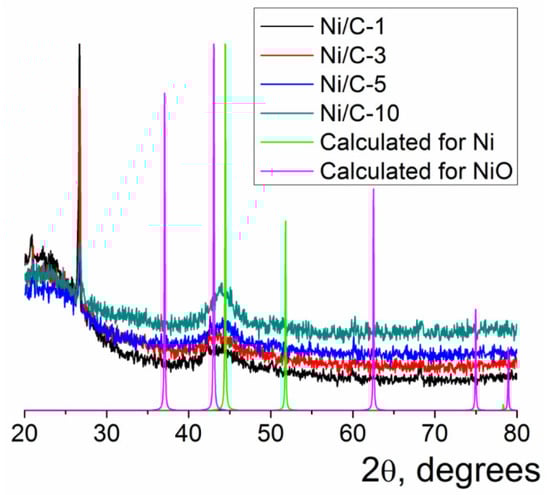
Figure 2.
Powder XRD patterns of the Ni/C-X composites along with the calculated XRD pattern for Ni (Fmm) and NiO (Fmm). The intensity of the calculated reflections was arbitrarily adjusted just for illustrative purposes.
Nickel nanoparticles, obtained by Ni(cod)2 decomposition, are usually kept under strictly oxygen-free conditions [34,35] to prevent the oxidation of Ni to NiO. However, various studies have shown that the exposure of nickel nanoparticles to air for long periods of time led to the formation of small islands of nickel oxide and thin oxide layers [42,43], which prevented the further oxidation of the metal. In some cases, complete oxidation of the metal particles in air only occurred at elevated temperatures up to 300 °C [44].
For the determination of the oxidation state of Ni, X-ray photoelectron spectra (XPS) of the Ni/C-3 composite were measured (this composite was selected because it was the most efficient hydrogenation catalyst, vide infra). The lines corresponding to Ni, C, and O, typical for such systems, were found in XPS. It can be concluded from the analysis of the high-resolution spectra of the O1s and Ni2p peaks that the Ni/C-3 sample contained only NiO or Ni(OH)2 (O1s BE < 530 eV; Ni2p BE 855.5–856.9 eV, Figure 3a) [45,46,47,48,49]. No peaks that could be assigned to metallic Ni were found (peaks in the range 859–862 eV are shake up satellites).
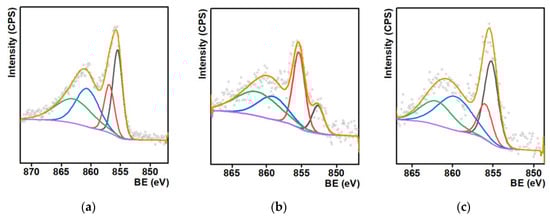
Figure 3.
Ni 2p X-ray photoelectron spectra of the Ni/C-3 composite (a), and the same sample after the catalytic experiments on the hydrogenation of quinoline (T = 100 °C, p(H2) = 100 atm, 24 h, methanol) (b) and after six cycles of the same catalytic experiments (c).
After the use of this composite as a hydrogenation catalyst, a new peak, which could be assigned to Ni0, appeared (ca. 852.5 eV, Figure 3b). Formation of this phase is consistent with the supposition that NiO reduced during the course of the catalytic experiment and Ni0 was the active phase in hydrogenation. Finally, the peak assigned to Ni0 was not found in the XPS of the same composite used in six cycles of catalytic hydrogenation (Figure 3c), and such features can evidence the low stability of metallic nickel toward oxidation in air. In addition, it was found that the surface concentration of Ni decreased upon the use of the composite in the catalytic experiments (Table S1). Such a decrease can be an explanation for the slight decrease in the product yield upon recycled use of the catalyst, vide infra. The hydrogenation of quinoline also led to some changes, which could be attributed to an increase in the number of C=C bonds and a decrease in the quantity of C–OH and C–O–C bonds in the composites (Figure S1). These changes could be caused by the dehydration of C–OH surface groups of the NORIT carrier.
Examination of the Ni/C-X composites by TEM revealed that all of these samples contained ca. 8–10 nm dark nanoparticles—“black particles” (Figure 4, left column). In addition, sample Ni/C-1 contained significantly larger spherical particles, and their density was intermediate between the activated carbon and the darkest small particles (“grey particles”). The size of such “grey particles” varied between ca. 10 nm and 100 nm (for example, large grey particles were observed in Figure 4a, while smaller grey particles were seen in Figure 5). Such grey particles could be assigned to amorphous loose NiO, and smaller dark nanoparticles could be assigned to dense NiO. In addition, some of the grey particles contained smaller black particles inside or on the surface (Figure 5), and such a combination can be evidence that these species were formed by phases of different densities, rather than the same phase of different layer thickness.
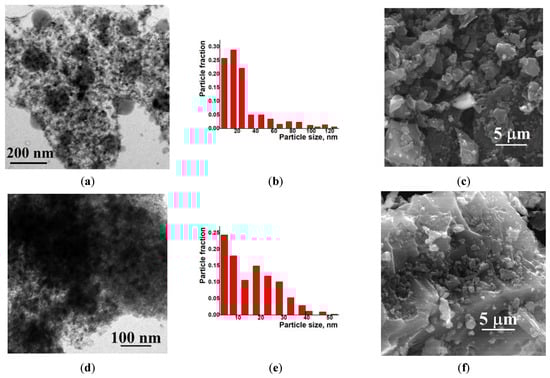
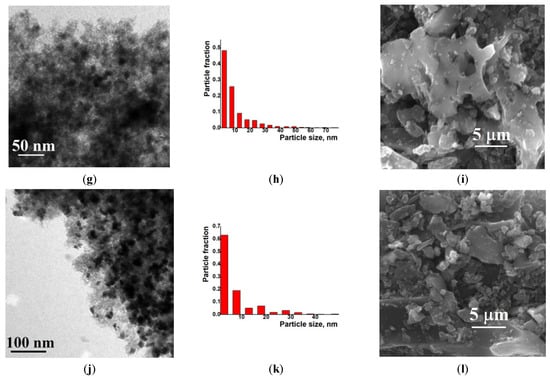
Figure 4.
TEM (left column), particle distribution by size according to the TEM data (middle column) and SEM (right column) images of the composites Ni/C-1 (a–c), Ni/C-3 (d–f), Ni/C-5 (g–i), and Ni/C-10 (j–l).
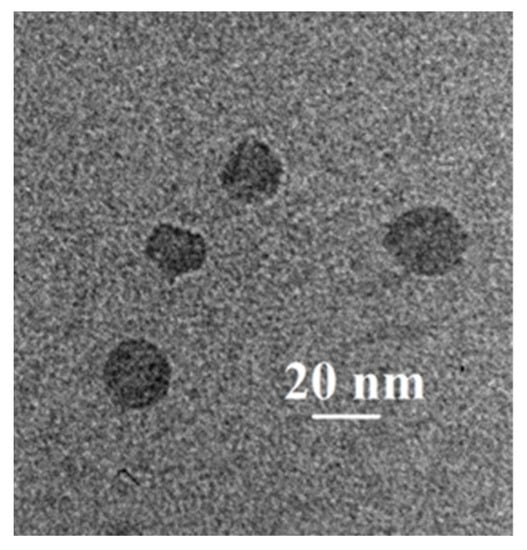
Figure 5.
TEM image of separate nanoparticles in the Ni/C-1 composite.
An increase in the Ni content in the composites led to an increase in the content of dark particles as well as an increase in the content of larger dark particles. However, no aggregates of NiO particles were found by SEM on the micron scale (Figure 4). Generally, it can be concluded that the decomposition of Ni(cod)2 led to an even distribution of NiO nanoparticles on the surface of the activated carbon. The size of such particles was about 8–10 nm.
NORIT carbon, used as a support for the preparation of the composites. is a microporous carrier. Based on the results of the N2 sorption measurements, the composites generally preserved the microporous structure, resembling NORIT. Deposition of such NiO nanoparticles on the NORIT activated carbon led to a slight increase in the specific area SBET, calculated from the N2 sorption isotherms (Table 1; the isotherms of N2 sorption for samples with the lowest and the largest Ni loadings are shown in Figure 6, the remaining isotherms are presented in Figure S2). Such a change could be explained by the formation of NiO particles that have an extended surface, exceeding the surface of the background charcoal carrier. In addition, the volume of the micropores increased upon the deposition of NiO on NORIT, and such an increase can also be explained by the formation of additional micropores in the NiO phase. At the same time, the total pore volume decreased upon the deposition of NiO on NORIT. Taking into account that the size of the NiO particles, determined by TEM, was significantly larger compared to the size of the micropores in NORIT (less than 1 nm), and considering the increase in the volume of micropores, it can be concluded that NiO was predominantly localized on the external surface of NORIT as a separate phase with its own significant microporosity. This phase of NiO partially occupied large cavities on the surface of NORIT and a space between the NORIT particles, resulting in a decrease in the total pore volume.

Table 1.
Surface area and pore volume of the composites and NORIT activated carbon calculated from N2 adsorption at 77 K.
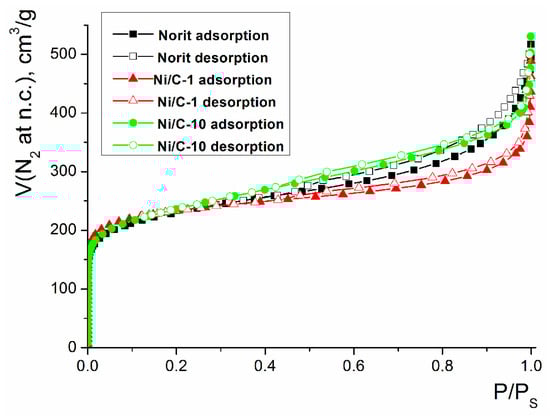
Figure 6.
N2 adsorption isotherms for the composites Ni/C-1, Ni/C-10, and NORIT.
Information on the average size of the Ni nanoparticles was also derived from the CO chemisorption data [50]. It is important to note that prior to the measurements, the samples were heated in H2 at 380 °C for 3 h and then kept in a vacuum at 370 °C. This treatment led to the reduction of all NiO to metallic nickel and the elimination of all adsorbed water, gases, and traces of organic compounds (such as adsorbed solvent, if any). Thus, the chemisorption experiment allowed us to obtain information not only on the size of the nanoparticles in the initial composites, but on the size of the derivative Ni nanoparticles, which formed upon the reduction of NiO by H2.
In the chemisorption experiment, two isotherms of CO sorption were consequently measured for the same sample (the isotherms for Ni/C-3 are shown in Figure 7, while the isotherms for the other samples are shown in Supplementary Materials, Figures S3 and S4). The first isotherm of CO sorption on the “pristine” sample corresponded to its binding with all surface sites, both on the surface of the Ni nanoparticles and NORIT support. After the measurement, the pressure was reduced to 10−4 Torr, leading to the desorption of all weakly-bound CO, however, the strongly-bound CO on the surface of the Ni remained intact. In the second run of CO sorption, the binding of CO molecules occurred only on the surface of the support (because the bonding sites on Ni were already filled with CO remaining after the first run), and the quantity of CO adsorbed in the second run corresponded to the surface of the support. The difference between the two isotherms corresponded to the isotherm of CO sorption on Ni.
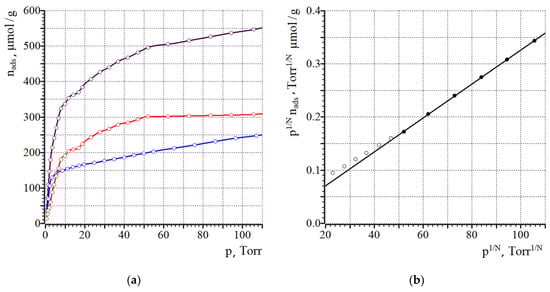
Figure 7.
Isotherms of CO sorption (1st run—black, 2nd run—red, difference isotherm—blue) for Ni/C-3 (a) and the fit in the model of Langmuir adsorption, where N is the dissociation stoichiometry coefficient, N = 1 for this case (b). On (b), filled symbols indicate those, which were used for linear fit.
Analysis of the difference in CO sorption isotherms by the Langmuir model [51,52,53] gives the monolayer capacity, and the surface of Ni (SNi) can be calculated by assuming that one CO molecule is bound on one surface Ni atom. The average diameter of Ni nanoparticles can be calculated, assuming that the particles have a spherical shape, as d = 6/(SNi·ρNi), where ρNi is the density of nickel [54]. The results are summarized in Table 2. Application of the extrapolation to the zero pressure model gave very similar results (see the Supplementary Materials, Table S2).
Table 2.
The results of the analysis of the composites by CO chemisorption using the Langmuir model.
According to the data of the chemisorption of CO, an increase in the quantity of Ni deposited on NORIT led to the formation of significantly larger Ni nanoparticles (size of the nanoparticles varied from 0.7 nm to 7.4 nm, calculated by the Langmuir adsorption method, Table 2). The particle size in deposition processes is governed by the balance between the rate of seeding and crystal growth [55,56]. The growth of Ni particles upon an increase in Ni loading can be explained by a higher increase in the crystals’ growth rate with an increase in the Ni loading compared to the seeding rate. Such situations can occur when Ni seeding occurs on certain sites of the carrier, in which the quantity is limited and does not depend on the Ni concentration in the reaction mixture. Notably, these conclusions are valid for the case where the decomposition of Ni(cod)2 resulted in the formation of Ni nanoparticles that were further oxidized in air to NiO as well as for the case where the decomposition of the same precursor led to the formation of NiO directly.
The size of the particles evaluated from the CO chemisorption data was significantly lower compared to the particle size in the Ni/C-X composites measured by TEM. However, since Ni nanoparticles (studied by chemisorption of CO) formed as a result of the reduction in NiO particles in the Ni/C-X composites by H2, the size of such Ni nanoparticles had to correlate with the size of the NiO species in the respective initial Ni/C-X composites. In theory, even for dense particles, a 16% decrease in size had to occur upon the reduction of NiO to Ni: a cube of NiO with a = 1 nm and density 6.67 g/cm3 corresponds to a cube of Ni with density 8.91 g/cm3 and a = 0.84 nm. A more significant decrease in size upon the reduction of NiO to Ni, observed in the case of the Ni/C-X composites, could be explained by the loose structure of NiO in the composites. This finding agrees very well with the conclusion on the presence of a loose microporous NiO phase, which was based on the results of the N2 sorption isotherms analysis.
Examination by TEM of the composites Ni/C-3, Ni/C-5, and Ni/C-10, obtained after the reduction of these samples with H2 and the chemisorption of CO, indeed revealed smaller particles compared to the starting Ni/C-X materials (Figure 8). These reduced samples contained more crystalline species compared to the initial Ni/C-X composites, as could be concluded from distinct circular electron diffraction (Figure S4). This observation is consistent with the above supposition regarding the formation of denser species upon the reduction of NiO in Ni/C-X with H2.
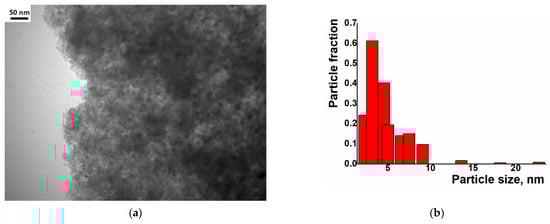
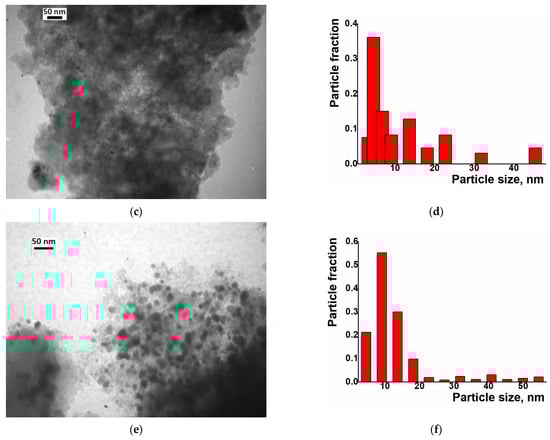
Figure 8.
TEM images (left column) and particle distribution by size according to the TEM data (right column) for the composites Ni/C-3 (a,b), Ni/C-5 (c,d), and Ni/C-10 (e,f) after reduction with H2 and experiments on the chemisorption of CO.
The specific surface of metallic Ni decreased with an increase in the Ni loading on NORIT from 935 to 91 m2 per 1 g of nickel. The increase in the Ni content in the row Ni/C-1–Ni/C-10 partially compensated by decreasing the specific surface of the Ni, and the overall surface of the metallic nickel per 1 g of the composite was the highest in the case of Ni/C-5 (15.3 m2 of Ni per 1 g of the composite), but in the case of the Ni/C-10, the specific surface of Ni was so small that even a high content of Ni could not counterbalance this decrease, and the specific surface of Ni per 1 g of the composite was the lowest in this case (Table 2). Such a change in the accessible areas of Ni could be responsible for the different catalytic performances of these composites and can contribute to the highest performance of Ni/C-3: it could be expected that the best catalyst would combine a high concentration of active sites and the low quantity of centers that absorb reagents and products without activation [57].
For the evaluation of the optimal conditions and optimal catalyst loading for the hydrogenation experiments, several tests on the hydrogenation of quinoline in the presence of the Ni/C-X composites were carried out. Quinoline was used as a reference because its hydrogenation is a more difficult task compared to hydrogenation of many other classes of organic compounds (alkenes, alkynes, nitro-compounds, etc.), and there is a high probability that a catalyst, active in the hydrogenation of quinoline, would be suitable for the hydrogenation of compounds of other classes. It was found that at P(H2) = 100 atm, T = 100 °C, reaction time 24 h in methanol, quantitative conversion of quinoline to 1,2,3,4-tetrahydroquinoline occurred at 2.5 mol. % loading of the composites counting per Ni (clearly, the weight of Ni/C-1 in the reaction mixture was 10 times higher compared to Ni/C-10 and 5 times higher compared to Ni/C-5, etc.). At 1% loading counting per Ni in the same conditions, the yield of 1,2,3,4-tetrahydroquinoline was ca. 96% for Ni/C-3, while it decreased to 88–89% for Ni/C-5 and Ni/C-10, and fell to 44% in the case of Ni/C-1 (Table 3). A significantly lower yield in the case of Ni/C-1 can be explained, in part, by the adsorption of the product on the activated carbon (1% loading of Ni using Ni/C-1 was accompanied the by introduction of 58 mg of the activated carbon per 1 mmole of quinoline, while, for example, in the case of Ni/C-5, the weight of the activated carbon was 11.5 mg per 1 mole of quinoline). On the other hand, the lower yields of 1,2,3,4-tetrahydroquinoline in the cases of Ni/C-5 and Ni/C-10 can be explained by larger particle sizes and an increased content in larger Ni particles in these samples, which could have a lower catalytic activity compared to smaller particles in Ni/C-3. Based on the experiments performed, it can be concluded that ca. 2 mol % loading of the catalysts (counting per Ni) ensured almost a quantitative yield of 1,2,3,4-tetrahydroquinoline in the studied conditions (P(H2) = 100 atm, T = 100 °C, reaction time 24 h in methanol), and among the composites, Ni/C-3 possessed the highest productivity.
Table 3.
Yields of the 1,2,3,4-tetrahydroquinoline at different loadings of the composites. Reaction conditions: p(H2) = 100 atm, T = 100 °C, 24 h, methanol. The yields presented in the table are the average of two runs.
For the evaluation of the influence of temperature on the catalytic productivity of the composites, the experiments on quinoline hydrogenation were performed at different temperatures at p(H2) = 100 atm. 1,2,3,4-Tetrahydroquinoline was the only reaction product. The 0.5 mol % catalyst loadings (per Ni) were used in order to obtain better differentiation of the samples (higher loadings would result in 100% yield in the majority of cases, which would not allow us to find the difference between the composites). For all composites, the conversion was less than 10% at 80 °C, while complete conversion was achieved at 150 °C. Additionally, for all composites, the conversion gradually increased with growing temperature, however, the rates of such growth were different (Figure 9a). For example, a temperature increase from 80 to 100 °C led to the growth of the conversion from 0 to 21% in the case of Ni/C-1, and from 8 to 77% in the case of Ni/C-3. Similarly, an increase in p(H2) at T = 100 °C led to the growth of the yield of 1,2,3,4-tetrahydroquinoline in the cases of all four catalysts, however, the highest yield was achieved for the Ni/C-3 composite (Figure 9b). After the analysis of both diagrams (Figure 9), it can be concluded that the Ni/C-3 composite was the most efficient in the hydrogenation of quinoline.
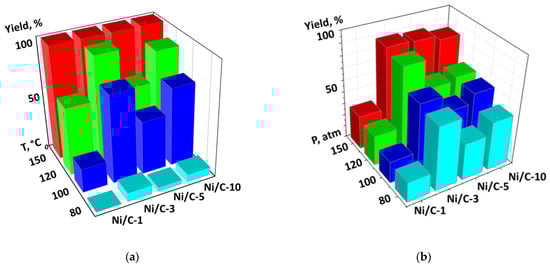
Figure 9.
Diagram showing the dependency of the yield of 1,2,3,4-tetrahydroquinoline in the hydrogenation of quinoline vs. temperature. p(H2) = 100 atm. (a) and a diagram showing the dependency of the yield of the same compound on p(H2) at T = 100 °C (b). In both cases, the catalyst loading was 0.5 mol % (counting per Ni), 24 h, methanol.
For the evaluation of the possibility of organic compound hydrogenation at very low catalyst loadings, the hydrogenation of quinoline was performed in the presence of 0.1–0.4% of Ni in Ni/C-3. The reaction time was increased to 72 h (other conditions–p(H2) = 100 atm, T = 100 °C). The yield of 1,2,3,4-tetrahydroquinoline varied from ca. 38% at 0.1% loading of Ni to almost 100% in the case of the 0.3% loading of Ni (Figure 10). The growth of the yield in the range of Ni loadings of 0.1–0.3% was linear. Thus, the Ni/C-3 composite had good homogeneity (a small quantity of the material preserved the properties of a large sample). Therefore, it can be concluded that the composite can be used as a hydrogenation catalyst at low Ni loadings, however, the reaction time has to be respectively increased.
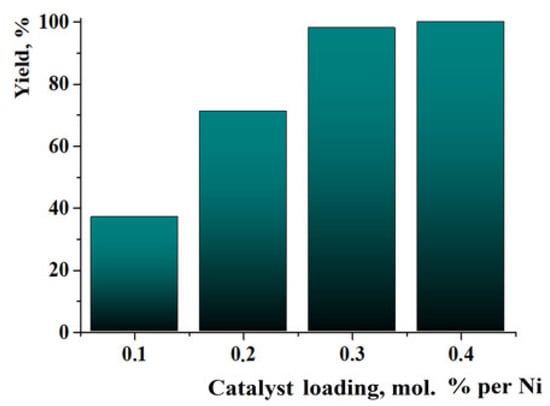
Figure 10.
Yields of 1,2,3,4-tetrahydroquinoline in experiments on the hydrogenation of quinoline in the presence of very low catalyst loadings. Reaction conditions: T = 100 °C, p(H2) = 100 atm, 72 h, methanol.
The most efficient composite Ni/C-3 was evaluated as a catalyst for the hydrogenation of a wide range of organic compounds. The results are summarized in Table 4. It can be noted that the composite appears to be an efficient catalyst for many organic compounds such as alkenes (entries 1–4), alkynes (entries 5–8), ketones (entries 9–11), nitro-compounds (entries 12, 13 and 29), pyridine (entry 14), quinoline and substituted quinolines (entries 15–29), and isoquinoline (entry 30). Several comments, however, can be made. Hydrogenation of the aromatic substrates, which contained amino- or hydroxy groups (entries 27 and 28 as well as 12 and 29, where the amino-group occurred after hydrogenation of the nitro-group) led to products with generally lower yields compared to similar compounds. Such lower yields can be explained by the passivation of Ni due to the adsorption of amines or phenols. At the same time, a similar effect did not seem to be significant in the case of the hydrogenation of non-aromatic compounds with the OH or NH2 groups (entries 2–4, 6–8), where quantitative conversions to the respective saturated products were achieved. Such a difference between the hydrogenation yields in the cases of aromatic and non-aromatic substrates can be explained by the inherent higher reactivity of the latter: even if the catalyst activity decreased due to the coordination of amine or alcohol, it still was sufficiently high for the complete transformation of the non-aromatic alcohol or amine. The hydrogenation of bromoquinoline led to complete debromination (entry 22), even in the case when Br was in the carbocyclic ring, which did not undergo hydrogenation. However, the hydrogenation of nitro-bromobenzene (entry 12) resulted in the formation of the respective aminobromobenzene; preservation of the C–Br bond in this case can be explained by the passivation of Ni by amino-groups. The hydrogenation of 6-chloroquinoline resulted in the formation of 6-chloro-1,2,3,4-tetrahydroquinoline with high yield, along with the dechlorinated product (entry 21). The hydrogenation of nitro-compounds bearing a nitrile function resulted in the transformation of the NO2 group to NH2 and the hydrolysis of nitrile to amide, instead of the expected reduction to benzylamine (entry 13). Finally, in one case, the formation of a significant quantity of N-methyl-1,2,3,4-tetrahydroquinoline was observed (entry 22), which occurred due to the N-methylation of 1,2,3,4-tetrahydroquinoline with methanol (solvent), presumably by a hydrogen borrowing mechanism [58]. A similar methylation was previously observed in the case of the hydrogenation of quinoline and its derivatives [13,15,59].
Table 4.
Product yields in the processes of organic compound hydrogenation in the presence of Ni/C-3 in MeOH, T = 100 °C, p(H2) = 100 atm. Time is 24 h if not otherwise explicitly indicated.
Taking into account that the composites predominantly contained NiO, the efficiency of the catalysts in catalytic hydrogenation can be explained by the in situ reduction of NiO to Ni by hydrogen. Thus, the composites can be considered as the pre-catalysts for hydrogenation, and this feature can be an explanation for their insensitivity to oxidation by air.
Catalyst recycling was tested for Ni/C-3 in the hydrogenation of quinoline. It was found that repeated use of the same catalyst six times resulted in a decrease in the 1,2,3,4-tetrahydroquinoline yield from 100 to 86%, but in all cases, the hydrogenation selectivity was 100% (Figure 11). All manipulations with the composites between separate runs were performed in air. A significant decrease in the product yield was observed on the fifth run. Therefore, the composite can be repeatedly used as a hydrogenation catalyst several times at least. Examination of the composites by SEM after one use in the hydrogenation of quinoline (Figure S6) did not reveal any noticeable changes in the morphology and Ni content (Ni content was estimated by EDS integrated into SEM as an average value for 6–7 measurements at different points of the surface).
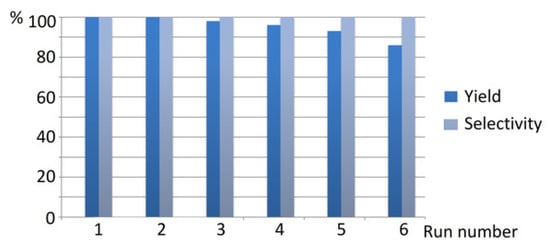
Figure 11.
The results of Ni/C-3 catalyst recycling in the hydrogenation of quinoline (2 mol % catalyst loading counting per Ni, p(H2) = 100 atm, T = 100 °C, MeOH, 24 h).
Information on several quinoline hydrogenation catalysts containing Ni or other metals is summarized in Table 5. For comparison, we also performed several experiments using Raney nickel as a quinoline hydrogenation catalyst (lines 3–5). It can be noted that the performance (in terms of the yield of 1,2,3,4-tetrahydroquinoline) of Ni/C-3 exceeded the performance of other Ni-containing systems including Raney nickel (lines 3–11), was comparable to the Co-containing composite (line 12), but was generally lower than the performance of the platinum group metals (lines 13–15). Taking into account the low cost and simple preparation, and the lack of need for special storage conditions, the Ni/C-3 composite can be considered as a good candidate for wide use in the hydrogenation of organic compounds.
Table 5.
The yields of 1,2,3,4-tetrahydroquinoline in the processes of quinoline hydrogenation by H2 in the presence of different catalysts.
3. Materials and Methods
The solvents were purified according to standard procedures [67]. Bis(1,5-cyclooctadiene) nickel(0) (Ni(cod)2) was prepared as described in [68]. The exact method used for the synthesis of Ni(cod)2 is provided in the Supplementary Materials. Hydrogen (99.99%) was purchased from Galogas Ltd. (Kyiv, Ukraine) and used without further purification. NORIT GSX activated carbon was purchased from Energochimservise (Kyiv, Ukraine). All other starting materials and reagents were available from Enamine Ltd. (Kyiv, Ukraine) and UkrOrgSintez Ltd. (Kyiv, Ukraine). The TEM and electron diffraction measurements were performed using a JEM-1230 transmission electron microscope (JEOL, Tokyo, Japan) operating at a 100 kV acceleration voltage. Samples were suspended in methanol upon ultrasonic irradiation for 1 min, and a drop of the suspension was applied onto a Cu grid (300 mesh), covered by a film of amorphous carbon, immediately after the end of the ultrasonic treatment. The SEM measurements were carried out using a scanning electron microscope (FEI Quanta Inspect) at 20 kV acceleration voltage. The samples were not specially prepared (in particular, they were not coated with conducting material) for the SEM measurements. The Ni content in the composites was determined by atomic adsorption using a SOLAAR S4 spectrometer with a double beam optical system (ThermoElectron Co., Waltham, MA, USA). Prior to analysis, samples were dried in a dessicator to remove water adsorbed from the air. Samples were calcinated in air at 600 °C and solid ash was dissolved in HNO3 with the addition of ca. 10% of HCl. Powder X-ray diffraction measurements were performed using a Bruker D8 Advance diffractometer with CuKα radiation (λ = 1.54056 Å). The XPS analysis was carried out using a PHI5600 spectrometer with a monochromatic Al Kα source. The work function and linearity adjustments were calculated using the Au 4f7/2 (BE 84 eV) and Cu 2p3/2 (BE 932.6 eV) peaks. The peak positions were corrected using the C=C peak (284.5 eV) as the reference. Measurements of N2 sorption were studied on a Sorptomatic-1990 instrument by the volumetric method at 78 K. Prior to the measurements, the samples were heated at 200 °C in a 10−4 Torr vacuum for 2 h. Measurements of CO chemisorption were studied on the same instrument by the volumetric method at 296 K (23 °C). Prior to the measurements, the samples were heated at 380 °C in 10−4 Torr vacuum for 3 h, then in a H2 atmosphere at 380 °C for 3 h, and again at 370 °C in 10−4 Torr vacuum. This procedure led to the reduction of all NiO to metallic Ni and desorption of all gases and vapors from the surface of the samples. The samples did not make contact with air between the treatment with H2 and CO sorption.
Column chromatography was performed using Kieselgel Merck 60 (230–400 mesh) as the stationary phase. 1H and 13C{1H} spectra were recorded on a Varian Unity Plus 400 spectrometer (at 400 MHz for 1H NMR, 101 MHz for 13C{1H} NMR. Mass spectra were recorded on an Agilent 1100 LCMSD SL instrument (chemical ionization (CI)) and an Agilent 5890 Series II 5972 GCMS instrument (electron impact ionization (EI)). High-resolution mass spectra (HRMS) were recorded on an Agilent Infinity 1260 UHPLC system coupled to a 6224 Accurate Mass TOF LC/MS system. Hydrogenation experiments were carried out in a steel autoclave equipped with a manometer, magnetic stirrer, and temperature controller.
Synthesis of the composites.
All manipulations were carried out in a glovebox using oxygen-free solvents, while the final products were stored in air under ambient conditions.
Synthesis of Ni/C-1. A solution of Ni(cod)2 (156 mg, 0.57 mmol) in 10 mL of THF was added dropwise to a suspension of 2.97 g of NORIT activated carbon in 30 mL of THF at room temperature. Stirring was continued for 5 min until the reaction mixture decolorized. Then, the reaction vessel was brought in air, and the suspension was filtered and washed with three portions of THF (10 mL each). The filter cake was dried at 100 °C under a vacuum overnight to obtain Ni/C-1. Anal.: Found 0.9% of Ni.
Synthesis of Ni/C-3. The same procedure as described for Ni/C-1 was used, with the difference that a solution of Ni(cod)2 (467 mg, 1.7 mmol) in 30 mL of THF was added to a suspension of 2.91 g of NORIT activated carbon in 30 mL of THF. Anal.: Found 2.8% of Ni.
Synthesis of Ni/C-5. A solution of Ni(cod)2 (780 mg, 2.84 mmol) in 60 mL of THF was added dropwise to a suspension of 2.85 g of NORIT activated carbon in 30 mL of THF at 60 °C. Stirring was continued for 5 min until the reaction mixture was decolorized. The reaction mixture was cooled down to room temperature and treated as described above for Ni/C-1. Anal.: Found 4.5% of Ni.
Synthesis of Ni/C-10. The same procedure as described for Ni/C-5 was used, with the difference that a solution of Ni(cod)2 (1.56 g, 5.67 mmol) in 120 mL of THF was added to a suspension of 2.85 g of NORIT activated carbon in 30 mL of THF at 60 °C. Anal.: Found 9.1% of Ni.
Spectral data for the hydrogenation products:
Ethylbenzene 1H NMR (400 MHz, DMSO-d6): δ 7.34–7.14 (m, 5H), 2.59 (q, J = 8.0 Hz, 2H), 1.17 (t, J = 8.0 Hz, 3H).
Butan-1-ol 1H NMR (400 MHz, CDCl3): δ 3.66 (t, J = 7.0 Hz, 2H), 1.56 (m, 2H), 1.44–1.35 (m, 3H), 0.95 (t, J = 7.0 Hz, 3H)
Butan-1-amine 1H NMR (400 MHz, CDCl3): δ 2.62 (t, J = 7.0 Hz, 2H), 1.39–1.35 (m, 4H), 1.32–1.24 (m, 2H), 0.85 (t, J = 7.0 Hz, 3H).
1-Phenylethanol 1H NMR (400 MHz, CDCl3): δ 7.37–7.32 (m, 4H), 7.28–7.24 (m, 1H), 4.89 (q, J = 5 Hz, 1H), 1.49 (d, J = 4 Hz, 3H).
4,4-Difluorocyclohexanone 1H NMR (400 MHz, CDCl3): δ 3.93 (q, J = 7.0 Hz, 1H), 2.18–2.08 (m, 2H), 1.92–1.88 (m, 4H), 1.85–1.76 (m, 2H).
2-Hydroxy-1,2-diphenylethanone 1H NMR (400 MHz, DMSO-d6): δ 7.99 (d, J = 7.0 Hz, 2H), 7.56 (t, J = 6.0 Hz, 1H), 7.47–7.41 (m, 4H), 7.33–7.29 (m, 2H), 7.25–7.21 (m, 1H), 6.08 (d, J = 8.0 Hz, 1H), 6.03 (d, J = 8.0 Hz, 1H).
3-Bromoaniline 1H NMR (400 MHz, DMSO-d6): δ 6.95–6.91 (t, J = 8.0 Hz, 1H), 6.72 (s, 1H), 6.62–6.58 (m, 1H), 6.55–6.48 (m, 1H), 5.35 (s, 2H).
2-Aminobenzamide 1H NMR (400 MHz, DMSO-d6): δ 7.69 (brs, 1H), 7.50 (d, J = 8.0 Hz, 1H), 7.12 (t, J = 8.0 Hz, 1H), 7.03 (brs, 1H), 6.65 (d, 8.0 Hz, 1H), 6.53 (s, 2H), 6.46 (t, J = 6.0 Hz, 1H).
Piperidine 1H NMR (400 MHz, CDCl3): δ 2.79 (s, 4H), 2.01 (s, 1H), 1.50 (s, 6H).
1,2,3,4-Tetrahydroquinoline 1H NMR (400 MHz, CDCl3) δ 7.00-6.92 (m, 2H), 6.61 (t, J = 7.4 Hz, 1H), 6.48 (d, J = 7.9, 1H), 3.35–3.27 (m, 2H), 2.77 (t, J = 6.4 Hz, 2H), 1.98–1.92 (m, 2H).
2-Methyl-1,2,3,4-tetrahydroquinoline 1H NMR (400 MHz, CDCl3) δ = 6.96 (t, J = 8.8 Hz, 2H), 6.61 (t, J = 7.3 Hz, 1H), 6.48 (d, J = 8.3 Hz, 1H), 3.81 (brs, 1H), 3.41 (m, 1H), 2.87–2.81 (m, 1H), 2.75–2.71 (m, 1H), 1.96–1.91 (m, 1H), 1.64–1.56 (m, 1H), 1.22 (d, J = 6.3 Hz, 3H)
3-Methyl-1,2,3,4-tetrahydroquinoline 1H NMR (400 MHz, CDCl3): δ 6.99–6.94 (m, 2H), 6.61 (t, J = 7.0 Hz, 1H), 6.50 (d, J = 8.0 Hz, 1H), 3.84 (brs, 1H), 3.30–3.25 (m, 1H), 2.93–2.88 (m, 1H), 2.77 (m, 1H), 2,43 (m, 1H), 2.10–2.03 (m, 1H), 1.05 (d, J = 6.0 Hz, 3H).
4-Methyl-1,2,3,4-tetrahydroquinoline 1H NMR (400 MHz, DMSO-d6): δ 7.40 (d, J = 7.0 Hz, 1H), 7.34–7.27 (m, 2H), 7.23 (d, J = 7.0 Hz, 1H), 3.37–3.33 (m, 1H), 3.30–3.25 (m, 1H), 3.02–2.96 (m, 1H), 2.16–2.09 (m, 1H), 1.27 (d, J = 7.0 Hz, 3H).
6-Methyl-1,2,3,4-tetrahydroquinoline 1H NMR (400 MHz, CDCl3): δ 6.79 (m, 2H), 6.43 (d, J = 4.0 Hz, 1H), 3.27 (d, J = 8.0 Hz, 2H), 2.73 (t, J = 6.0 Hz, 2H), 1.93 (m, 2H)
6-Fluoro-1,2,3,4-tetrahydroquinoline 1H NMR (400 MHz, CDCl3): δ 6.88 (t, J = 8.0 Hz, 1H), 6.32 (t, J = 10.0 Hz, 1H), 6.22 (d, J = 8.0 Hz, 1H), 3.31 (m, 2H), 2.73 (t, J = 6.5 Hz, 2H), 1.95 (m, 2H).
6-Chloro-1,2,3,4-tetrahydroquinoline 1H NMR (400 MHz, DMSO-d6): δ 6.82 (m, 2H), 6.40 (d, J = 2.4 Hz, 1H), 3.15 (d, J = 8.0 Hz, 1H), 2.63 (t, J = 6.4 Hz, 2H), 1.75 (m, 2H).
1,2,3,4-Tetrahydroquinoline-6-carboxylic acid 1H NMR (400 MHz, DMSO-d6): δ 7.45–7.42 (m, 2H), 6.50 (s, 1H), 6.40 (d, J = 9.0 Hz, 1H), 3.22 (m, 2H), 2.66 (t, J = 6.0 Hz, 2H), 1.77 (m, 2H).
6-Methoxy-1,2,3,4-tetrahydroquinoline 1H NMR (400 MHz, CDCl3): δ 6.62–6.56 (m, 2H), 6.50 (d, J = 8.5 Hz, 1H), 3.72 (s, 3H), 3.27 (m, 2H), 2.76 (t, J = 6.5 Hz, 2H), 1.97–1.91 (m, 2H).
3,4-Dihydroquinolin-2(1H)-one 1H NMR (400 MHz, DMSO-d6): δ 10.04 (s, 1H), 7.14–7.08 (m, 2H), 6.89–6.82 (m, 2H), 2.83 (t, J = 6.0 Hz, 2H), 2.41 (t, J = 6.0 Hz, 2H).
6-(Trifluoromethyl)-1,2,3,4-tetrahydroquinoline 1H NMR (400 MHz, CDCl3): δ 7.17–7.15 (m, 2H), 6.43 (s, 1H), 3.32 (t, J = 6.0 Hz, 2H), 2.75 (t, J = 6.0 Hz, 2H), 1.91 (m, 2H).
1,2,3,4-Tetrahydroquinolin-6-ol 1H NMR (400 MHz, DMSO-d6): δ 8.23 (s, 1H), 6.34–6.25 (m, 3H), 4.92 (s, 1H), 3.09–3.05 (m, 2H), 2.59–2.54 (m, 2H), 1.77–1.71 (m, 2H).
1,2,3,4-Tetrahydroquinolin-6-amine 1H NMR (400 MHz, CDCl3): δ 6.43 (m, 3H), 3.25–3.14 (m, 4H), 2.70 (m, 2H), 1.95–1.90 (m, 2H).
1,2,3,4-Tetrahydroisoquinoline 1H NMR (400 MHz, DMSO-d6): δ 7.14–7.07 (m, 3H), 7.01 (m, 1H), 4.02 (s, 2H), 3.14 (t, J = 6.0 Hz, 2H), 2.80 (t, J = 6.0 Hz, 2H).
4. Conclusions
The most important conclusion from this study is the fact that the decomposition of Ni(cod)2 in the presence of NORIT activated carbon led to the formation of Ni-containing composites, which could be used as efficient hydrogenation catalysts for a wide range of organic compounds such as the ones containing ethylene and acetylene bonds, nitro- and keto- groups as well as substituted quinolines and analogs. An important advantage of the composites is their stability in air. Efficiency of the composites as catalysts for the hydrogenation of organic compounds could be explained by the in situ formation of the active sites upon the reduction of NiO to Ni by hydrogen. Due to this feature, storage in air did not affect the composite. These composites can be considered as pre-catalysts, which were transformed into the catalysts in the reaction mixture.
It was found that an increase in the Ni loading in the row of composites Ni/C-1–Ni/C-10 led to the growth in the size of Ni nanoparticles, which formed upon reduction with H2, and their size changed from 0.7 nm to 7.4 nm. At the same time, the specific surface of nickel, counted per 1 g of this metal, abruptly decreased in this row, from 935 to 91 m2 per 1 g of nickel. Counterbalancing the decreasing specific surface of Ni with its increasing content in the composites led to the highest SNi per 1 g of the composite in the cases of Ni/C-3 and Ni/C-5 (11.1 and 15.3 m2 of Ni per 1 g of the composite, respectively). The high specific surface of Ni could have contributed to the best performance of the Ni/C-3 composite because it provides for a high content of active sites and a low content of activated carbon, which adsorbs reagents and products.
The composite containing 3% of Ni on NORIT charcoal had the best performance in the hydrogenation of quinoline by several parameters, in particular, the use of such a composite (Ni/C-3) led to the highest yields of the hydrogenation products, under the same conditions, compared to its analogs with other Ni content. In many cases, quantitative conversion of the substrates to hydrogenation products was achieved. Lower yields of the hydrogenation products were observed in the case of N-containing heterocycles bearing OH or NH2 groups; this effect could be explained by the passivation of Ni with such donor groups (however, such passivation did not seem to be noticeable in the case of the hydrogenation of non-aromatic substrates, probably because of their inherent higher reactivity). The F and Cl substituents could be preserved in heterocyclic molecules, while the hydrogenation of bromoquinoline resulted in complete debromination.
The studied composites can be proposed as air-stable and efficient catalysts for the hydrogenation of a wide range of organic compounds and can be considered as a good alternative to Pd-containing hydrogenation catalysts.
Supplementary Materials
The following supporting information can be downloaded at: https://www.mdpi.com/article/10.3390/catal13040706/s1, Method for synthesis of Ni(cod)2; Figure S1. 1s X-ray photoelectron spectra of the Ni/C-3 composite (a) and the same sample after catalytic experiments on the hydrogenation of quinoline (T = 100 °C, p(H2) = 100 atm, 24 h, methanol) (b) and after six cycles of the same catalytic experiments (c); Figure S2. N2 adsorption isotherms for samples Ni/C-3 and Ni/C-5; Figure S3. Isotherms of CO sorption (1st run—black, 2nd run—red, difference isotherm—blue) (a,b), the fit in the model of extrapolation to zero pressure (c,d) and the fit in the model of Langmuir adsorption, where N is the dissociation stoichiometry coefficient, N = 1 for this case (e,f) for Ni/C-1 (left column) and Ni/C-3 (right column); Figure S4. Isotherms of CO sorption (1st run—black, 2nd run—red, difference isotherm—blue) (a,b), the fit in the model of extrapolation to zero pressure (c,d) and the fit in the model of Langmuir adsorption, where N is the dissociation stoichiometry coefficient, N = 1 for this case (e,f) for Ni/C-5 (left column) and Ni/C-10 (right column); Figure S5. Electron diffraction patterns of composites Ni/C-3 (a), Ni/C-5 (b), and Ni/C-10 (c) after reduction with H2 and experiments on the chemisorption of CO; Figure S6. SEM images of the Ni/C-1 (a), Ni/C-3 (b), Ni/C-5 (c), and Ni/C-10 (d) composites after the catalytic hydrogenation of quinoline at 100 °C, p(H2) = 100 atm in methanol for 24 h; Figure S7. 1H NMR spectrum of ethylbenzene; Figure S8. 1H NMR spectrum of butan-1-ol; Figure S8. 1H NMR spectrum of butan-1-amine; Figure S10. 1H NMR spectrum of 1-phenylethanol; Figure S11. Figure S9. 1H NMR spectrum of 2-hydroxy-1,2-diphenylethanone; Figure S12. 1H NMR spectrum of 2-hydroxy-1,2-diphenylethanone; Figure S13. 1H NMR spectrum of 3-bromoaniline; Figure S14. 1H NMR spectrum of 2-aminobenzamide; Figure S15. 1H NMR spectrum of piperidine; Figure S16. 1H NMR spectrum of 1,2,3,4-tetrahydroquinoline; Figure S17. 1H NMR spectrum of 2-methyl-1,2,3,4-tetrahydroquinoline; Figure S18. 1H NMR spectrum of 3-methyl-1,2,3,4-tetrahydroquinoline; Figure S19. 1H NMR spectrum of 4-methyl-1,2,3,4-tetrahydroquinoline; Figure S20. 1H NMR spectrum of 6-methyl-1,2,3,4-tetrahydroquinoline; Figure S21. 1H NMR spectrum of 6-fluoro-1,2,3,4-tetrahydroquinoline; Figure S22. 1H NMR spectrum of 6-chloro-1,2,3,4-tetrahydroquinoline; Figure S23. 1H NMR spectrum of 1,2,3,4-tetrahydroquinoline-6-carboxylic acid; Figure S24. 1H NMR spectrum of 6-methoxy-1,2,3,4-tetrahydroquinoline; Figure S25. 1H NMR spectrum of 3,4-dihydroquinolin-2(1H)-one; Figure S26. 1H NMR spectrum of 6-(trifluoromethyl)-1,2,3,4-tetrahydroquinoline; Figure S27. 1H NMR spectrum of 1,2,3,4-tetrahydroquinolin-6-ol; Figure S28. 1H NMR spectrum of 1,2,3,4-tetrahydroquinolin-6-amine; Figure S29. 1H NMR spectrum of 1,2,3,4-tetrahydroisoquinoline.
Author Contributions
Conceptualization, D.M.V. and S.V.K.; Data curation, S.V.R.; Formal analysis, O.O.P., S.V.R. and D.M.V.; Investigation, V.V.S., M.O.I., A.V.T., P.S.Y., O.O.P., Y.M.A., I.E.K., T.M.S. and M.M.K.; Methodology, V.V.S., M.O.I. and D.M.V.; Writing—original draft, V.V.S. and S.V.K.; Writing—review & editing, S.V.K. All authors have read and agreed to the published version of the manuscript.
Funding
This research received no external funding.
Data Availability Statement
Data are available from the authors.
Acknowledgments
The authors wish to thank V.G. Khomenko (Kyiv National University of Technologies and Design) for his assistance with the atomic adsorption analysis. V.V.S., M.M.K. and S.V.K. thank to the National Academy of sciences (the project “The development of heterogeneous catalytic processes for the production of liquid synthetic motor fuels from domestic raw for the energy independence of the state”).
Conflicts of Interest
The authors declare no conflict of interest.
References
- Nishimura, S. Handbook of Heterogeneous Catalytic Hydrogenation for Organic Synthesis, 1st ed.; Wiley-Interscience: New York, NY, USA, 2001; pp. 7–19. [Google Scholar]
- Rylander, P.N. Hydrogenation and Dehydrogenation. In Ullmann’s Encyclopedia of Industrial Chemistry; Wiley-VCH: Weinheim, Germany, 2005. [Google Scholar]
- Zhao, X.; Chang, Y.; Chen, W.-J.; Wu, Q.; Pan, X.; Chen, K.; Weng, B. Recent Progress in Pd-Based Nanocatalysts for Selective Hydrogenation. ACS Omega 2022, 7, 17–31. [Google Scholar] [CrossRef] [PubMed]
- Sedgwick, D.M.; Hammond, G.B. The history and future challenges associated with the hydrogenation of vinyl fluorides Author links open overlay panel. J. Fluor. Chem. 2018, 207, 45–58. [Google Scholar] [CrossRef]
- Stoffels, M.A.; Klauck, F.J.R.; Hamadi, T.; Glorius, F.; Leker, J. Technology Trends of Catalysts in Hydrogenation Reactions: A Patent Landscape Analysis. Adv. Synth. Catal. 2020, 362, 1258–1274. [Google Scholar] [CrossRef]
- Zhang, L.; Zhou, M.; Wang, A.; Zhang, T. Selective Hydrogenation over Supported Metal Catalysts: From Nanoparticles to Single Atoms. Chem. Rev. 2020, 120, 683–733. [Google Scholar] [CrossRef] [PubMed]
- Westerhaus, F.A.; Jagadeesh, R.V.; Wienhofer, G.; Pohl, M.-M.; Radnik, J.; Surkus, A.-E.; Rabeah, J.; Junge, K.; Junge, H.; Nielsen, M.; et al. Heterogenized cobalt oxide catalysts for nitroarene reduction by pyrolysis of molecularly defined complexes. Nat. Chem. 2013, 5, 537–543. [Google Scholar] [CrossRef]
- Chen, F.; Surkus, A.-E.; He, L.; Pohl, M.-M.; Radnik, J.; Topf, C.; Junge, K.; Beller, M. Selective Catalytic Hydrogenation of Heteroarenes with N-Graphene-Modified Cobalt Nanoparticles (Co3O4–Co/NGr@α-Al2O3). J. Am. Chem. Soc. 2015, 137, 11718–11724. [Google Scholar] [CrossRef] [PubMed]
- Jagadeesh, R.V.; Surkus, A.-E.; Junge, H.; Pohl, M.-M.; Radnik, J.; Rabeah, J.; Huan, H.; Schünemann, V.; Brückner, A.; Beller, M. Nanoscale Fe2O3-Based Catalysts for Selective Hydrogenation of Nitroarenes to Anilines. Science 2013, 342, 1073–1076. [Google Scholar] [CrossRef]
- Morales, M.V.; Conesa, J.M.; Guerrero-Ruiz, A.; Rodríguez-Ramos, I. Tunable selectivity of Ni catalysts in the hydrogenation reaction of 5-hydroxymethylfurfural in aqueous media: Role of the carbon supports. Carbon 2021, 182, 265–275. [Google Scholar] [CrossRef]
- Palladium Prices—Interactive Historical Chart. Available online: https://www.macrotrends.net/2542/palladium-prices-historical-chart-data (accessed on 27 February 2023).
- Lipshutz, B.H. Development of Nickel-on-Charcoal as a “Dirt-Cheap’’ Heterogeneous Catalyst: A Personal Account. Adv. Synth. Catal. 2001, 343, 515–526. [Google Scholar] [CrossRef]
- Asaula, V.M.; Lytvynenko, A.S.; Mishura, A.M.; Gavrilenko, K.S.; Ryabukhin, S.V.; Volochnyuk, D.M.; Kolotilov, S.V. In-situ formation of Ni nanoparticles supported by MIL-101 porous coordination polymer for catalytic hydrogenation of quinoline. Inorg. Chem. Comm. 2020, 121, 108203. [Google Scholar] [CrossRef]
- Asaula, V.M.; Shvets, O.V.; Pariiska, O.O.; Bur’yanov, V.V.; Ryabukhin, S.V.; Volochnyuk, D.M.; Kolotilov, S.V. Composites Based on Nanodispersed Nickel, Graphene-Like Carbon, and Aerosil for Catalytic Hydrogenation of Furfural and Quinoline. Theor. Experim. Chem. 2020, 56, 261–267. [Google Scholar] [CrossRef]
- Asaula, V.M.; Buryanov, V.V.; Solod, B.Y.; Tryus, D.M.; Pariiska, O.O.; Kotenko, I.E.; Volovenko, Y.M.; Volochnyuk, D.M.; Ryabukhin, S.V.; Kolotilov, S.V. Catalytic Hydrogenation of Substituted Quinolines on Co–Graphene Composites. Eur. J. Org. Chem. 2021, 2021, 6616–6625. [Google Scholar] [CrossRef]
- Hahn, G.; Kunnas, P.; de Jonge, N.; Kempe, R. General synthesis of primary amines via reductive amination employing a reusable nickel catalyst. Nat. Catal. 2019, 2, 71–77. [Google Scholar] [CrossRef]
- Miroshnikova, A.V.; Kazachenko, A.S.; Tarabanko, V.E.; Sychev, V.V.; Skripnikov, A.M.; Mikhlin, Y.L.; Kosivtsov, Y.; Chudina, A.I.; Taran, O.P. Hydrogenation of Flax Shives in Ethanol over a Ni/C Catalyst. Catalysts 2022, 12, 1177. [Google Scholar] [CrossRef]
- Murugesan, K.; Beller, M.; Jagadeesh, R.V. Reusable nickel nanoparticles-catalyzed reductive amination for selective syn-thesis of primary amines. Angew. Chem. Int. Ed. 2019, 131, 5118–5122. [Google Scholar] [CrossRef]
- Subotin, V.V.; Asaula, V.M.; Lishchenko, Y.L.; Ivanytsya, M.O.; Pariiska, O.O.; Ryabukhin, S.V.; Volochnyuk, D.M.; Kolotilov, S.V. Catalytic Reductive Amination of Aromatic Aldehydes on Co-Containing Composites. Chemistry 2023, 5, 281–293. [Google Scholar] [CrossRef]
- Wang, M.; Zhao, Y.; Mei, D.; Bullock, R.M.; Gutiérrez, O.Y.; Camaioni, D.M.; Lercher, J.A. The Critical Role of Reductive Steps in the Nickel-Catalyzed Hydrogenolysis and Hydrolysis of Aryl Ether C−O Bonds. Angew. Chem. Int. Ed. 2020, 59, 1445–1449. [Google Scholar] [CrossRef] [PubMed]
- Sergeev, A.G.; Hartwig, J.F. Selective, Nickel-Catalyzed Hydrogenolysis of Aryl Ethers. Science 2011, 332, 439–443. [Google Scholar] [CrossRef] [PubMed]
- Friend, C.M.; Xu, B. Heterogeneous Catalysis: A Central Science for a Sustainable Future. Acc. Chem. Res. 2017, 50, 517–521. [Google Scholar] [CrossRef]
- Ivanytsya, M.O.; Ryabukhin, S.V.; Volochnyuk, D.M.; Kolotilov, S.V. Modern Approaches to the Creation of Immobilized Metal-Complex Catalysts for Hydrogenation, Alkene Metathesis, and Cross-Coupling Processes: A Review. Theor. Exp. Chem. 2020, 56, 283–308. [Google Scholar] [CrossRef]
- Lipshutz, B.H.; Tasler, S.; Chrisman, W.; Spliethoff, B.; Tesche, B. On the Nature of the ‘Heterogeneous’ Catalyst: Nickel-on-Charcoal. J. Org. Chem. 2003, 68, 1177–1189. [Google Scholar] [CrossRef]
- Urushibara, Y.; Nishimura, S. A Method for the Preparation of the Raney Nickel Catalyst with a Greater Activity. Bull. Chem. Soc. Jpn. 1957, 30, 199. [Google Scholar]
- Subotin, V.V.; Vashchenko, B.V.; Asaula, V.M.; Verner, E.V.; Ivanytsya, M.O.; Shvets, O.; Ostapchuk, E.N.; Grygorenko, O.O.; Ryabukhin, S.V.; Volochnyuk, D.M.; et al. Screening of Palladium/Charcoal Catalysts for Hydrogenation of Diene Carboxylates with Isolated-Rings (Hetero)aliphatic Scaffold. Molecules 2023, 28, 1201. [Google Scholar] [CrossRef]
- Alsalme, A.; Toraba, M.A.; Khan, M.; Alzaqri, N.A.; Alshammari, S.G.; Alotaibic, M.A.; Siddiqui, M.R.H. Facile synthesis of nickel based nanostructures from Ni[EMIM]Cl2 ionic liquid precursor: Effects of thermal and chemical methods on the properties of nanoparticles. RSC Adv. 2016, 6, 86340–86345. [Google Scholar] [CrossRef]
- Adil, S.F.; Ashraf, M.; Khan, M.; Assal, M.E.; Shaik, M.R.; Kuniyil, M.; Al-Warthan, A.; Siddiqui, M.R.H.; Tremel, W.; Tahir, M.N. Advances in graphene/inorganic nanoparticle composites for catalytic applications. Chem. Rec. 2022, 22, e202100274. [Google Scholar] [CrossRef]
- Kumar, M.; Xiong, X.; Sun, Y.; Yu, I.K.M.; Tsang, D.C.W.; Hou, D.; Gupta, J.; Bhaskar, T.; Pandey, A. Critical review on biochar-supported catalysts for pollutant degradation and sustainable biorefinery. Adv. Sustain. Syst. 2020, 4, 1900149. [Google Scholar] [CrossRef]
- Raney, M. Method of Producing Finely-Divided Nickel. U.S. Patent 1,628,190, 14 May 1926. [Google Scholar]
- Harry, B.; Homer, A. Catalyst, Raney Nickel, W6 (with high contents of aluminum and adsorbed hydrogen). Org. Synth. 1949, 29, 24. [Google Scholar]
- Augustine, R.L. Heterogeneous Catalysis for the Synthetic Chemist; CRC Press: Boca Raton, FL, USA, 1996; pp. 248–249. [Google Scholar]
- Yakukhnov, S.A.; Pentsak, E.O.; Galkin, K.I.; Mironenko, R.M.; Drozdov, V.A.; Likholobov, V.A.; Ananikov, V.P. Rapid “Mix-and-Stir” Preparation of Well-Defined Palladium on Carbon Catalysts for Efficient Practical Use. ChemCatChem 2018, 10, 1869–1873. [Google Scholar] [CrossRef]
- Gao, F.; Webb, J.D.; Hartwig, J.F. Chemo- and Regioselective Hydrogenolysis of Diaryl Ether C-O Bonds by a Robust Heterogeneous Ni/C Catalyst: Applications to the Cleavage of Complex Lignin-Related Fragments. Angew. Chem. Int. Ed. 2016, 55, 1474–1478. [Google Scholar] [CrossRef]
- Afanasenko, A.; Elangovan, S.; Stuart, M.C.A.; Bonura, G.; Frusteri, F.; Barta, K. Efficient nickel-catalysed N-alkylation of amines with alcohols. Catal. Sci. Technol. 2018, 8, 5498–5505. [Google Scholar] [CrossRef]
- Sergeev, A.G.; Webb, J.D.; Hartwig, J.F. A Heterogeneous Nickel Catalyst for the Hydrogenolysis of Aryl Ethers without Arene Hydrogenation. J. Am. Chem. Soc. 2012, 134, 20226–20229. [Google Scholar] [CrossRef] [PubMed]
- Noack, K.; Zbinden, H.; Schlögl, R. Identification of the state of palladium in various hydrogenation catalysts by XPS. Catal. Lett. 1990, 4, 145–156. [Google Scholar] [CrossRef]
- Teschner, D.; Révay, Z.; Borsodi, J.; Hävecker, M.; Knop-Gericke, A.; Schlögl, R.; Milroy, D.; Jackson, S.D.; Torres, D.; Sautet, P. Understanding Palladium Hydrogenation Catalysts: When the Nature of the Reactive Molecule Controls the Nature of the Catalyst Active Phase. Angew. Chem. Int. Ed. 2008, 47, 9274–9278. [Google Scholar] [CrossRef]
- Okamoto, Y.; Nitta, Y.; Imanaka, T.; Teranishi, S. Surface state, catalytic activity and selectivity of nickel catalysts in hydrogenation reactions. Part 2; Surface characterization of Raney nickel and Urushibara nickel catalysts by X-ray photoelectron spectroscopy. J. Chem. Soc. Faraday Trans. 1 1980, 76, 998–1007. [Google Scholar] [CrossRef]
- Leineweber, A.; Jacobs, H.; Hull, S. Ordering of Nitrogen in Nickel Nitride Ni3N Determined by Neutron Diffraction. Inorg. Chem. 2001, 40, 5818–5822. [Google Scholar] [CrossRef] [PubMed]
- Patterson, A.L. The Scherrer formula for X-ray particle size determination. Phys. Rev. 1939, 56, 978–982. [Google Scholar] [CrossRef]
- D’Addato, S.; Grillo, V.; Altieri, S.; Tondi, R.; Valeri, S.; Frabboni, S. Structure and stability of nickel/nickel oxide core–shell nanoparticles. J. Condens. Matter Phys. 2011, 23, 175003. [Google Scholar] [CrossRef]
- Duan, Y.; Li, J. Structure study of nickel nanoparticles. Mater. Chem. Phys. 2004, 87, 452–454. [Google Scholar] [CrossRef]
- Railsback, J.G.; Johnston-Peck, A.C.; Wang, J.; Tracy, J.B. Size-Dependent Nanoscale Kirkendall Effect During the Oxidation of Nickel Nanoparticles. ACS Nano 2010, 4, 1913–1920. [Google Scholar] [CrossRef]
- Grosvenor, A.P.; Biesinger, M.C.; Smart, R.S.C.; McIntrye, N.S. New interpretations of XPS spectra of nickel metal and oxides. Surf. Sci. 2006, 600, 1771–1779. [Google Scholar] [CrossRef]
- Biesinger, M.C.; Payne, B.P.; Lau, L.W.M.; Gerson, A.R.; Smart, R.S.C. X-ray photoelectron spectroscopic chemical state quantification of mixed nickel metal, oxide and hydroxide systems. Surf. Interface Anal. 2009, 41, 324–332. [Google Scholar] [CrossRef]
- Biesinger, M.C.; Payne, B.P.; Grosvenor, A.P.; Lau, L.W.M.; Gerson, A.R.; Smart, R.S.C. Resolving surface chemical states in XPS analysis of first row transition metals, oxides and hydroxides: Cr, Mn, Fe, Co and Ni. Appl. Surf. Sci. 2011, 257, 2717–2730. [Google Scholar] [CrossRef]
- Biesinger, M.C.; Lau, L.W.M.; Gerson, A.R.; Smart, R.S.C. The role of the Auger parameter in XPS studies of nickel metal, halides and oxides. Phys. Chem. Chem. Phys. 2012, 14, 2434–2442. [Google Scholar] [CrossRef]
- Nickel X-ray Photoelectron Spectra, Nickel Electron Configuration, and Other Elemental Information. Available online: https://www.thermofisher.com/ua/en/home/materials-science/learning-center/periodic-table/transition-metal/nickel.html (accessed on 30 March 2023).
- Kurmach, M.M.; Konysheva, K.M.; Pertko, O.P.; Yaremov, P.S.; Voloshyna, Y.G.; Shvets, O.V. Catalytic Properties of Nickel-Containing Hierarchical Zeolites in the Reaction of n-Hexane Hydroizomerization. Theor. Exp. Chem. 2023. [Google Scholar] [CrossRef]
- Langmuir, I. The adsorption of gases on plane surfaces of glass, mica and platinum. J. Am. Chem. Soc. 1918, 40, 1361–1403. [Google Scholar] [CrossRef]
- Hyward, D.O.; Trapnell, B.M.W. Chemisorption, 2nd ed.; Butterworths: London, UK, 1964; p. 159. [Google Scholar]
- Thomas, J.M.; Lambert, R.M. (Eds.) Characterisation of Catalysts; J. Wiley & Sons: New York, NY, USA, 1980. [Google Scholar]
- Anderson, J.R. Structure of Metallic Catalysts; Academic Press: London, UK, 1975; p. 360. [Google Scholar]
- Lim, B.; Jiang, M.; Yu, T.; Camargo, P.H.C.; Xia, Y. Nucleation and growth mechanisms for Pd-Pt bimetallic nanodendrites and their electrocatalytic properties. Nano Res. 2010, 3, 69–80. [Google Scholar] [CrossRef]
- Simonov, P.A.; Troitskii, S.Y.; Likholobov, V.A. Preparation of the Pd/C catalysts: A molecular-level study of active site formation. Kinet. Catal. 2000, 41, 255–269. [Google Scholar] [CrossRef]
- Yurchenko, D.V.; Lytvynenko, A.S.; Abdullayev, E.N.; Peregon, N.V.; Gavrilenko, K.S.; Gorlova, A.; Ryabukhin, S.V.; Volochnyuk, D.M.; Kolotilov, S.V. Catalytic oxidation of benzoins by hydrogen peroxide on nanosized HKUST-1: Influence of substituents on the reaction rates and DFT modeling of the reaction path. Molecules 2023, 28, 747. [Google Scholar] [CrossRef]
- Reed-Berendt, B.G.; Polidano, K.; Morrill, L.C. Recent advances in homogeneous borrowing hydrogen catalysis using earth-abundant first row transition metals. Org. Biomol. Chem. 2019, 17, 1595–1607. [Google Scholar] [CrossRef] [PubMed]
- Pariiska, O.O.; Mazur, D.O.; Asaula, V.M.; Buryanov, V.V.; Socha, R.; Kurys, Y.I.; Kolotilov, S.V.; Koshechko, V.G.; Pokhodenko, V.D. Influence of the Structure of Nanocomposites Based on Co,N,S-Doped Carbon and Co9S8 on the Catalytic Properties in the Processes of Quinoline and Its Methyl Derivatives Hydrogenation. Theor. Exp. Chem. 2023. [Google Scholar] [CrossRef]
- Hyejin, C.; Fanni, T.; Béla, T. Selective Reduction of Condensed N-Heterocycles using Water as a Solvent and a Hydrogen Source. Org. Biomol. Chem. 2013, 11, 1209–1215. [Google Scholar]
- Du, H. A Kind of Preparation Method of Hydrogenated Quinoline. Patent CN103613539B, 18 November 2015. [Google Scholar]
- Ryabchuk, P.; Agostini, G.; Pohl, M.-M.; Lund, H.; Agapova, A.; Junge, H.; Junge, K.; Beller, M. Intermetallic Nickel Silicide Nanocatalyst—A Non-noble Metal–Based General Hydrogenation Catalyst. Sci. Adv. 2018, 4, eaat0761. [Google Scholar] [CrossRef]
- Mao, S.; Ryabchuk, P.; Dastgir, S.; Anwar, M.; Junge, K.; Beller, M. Silicon-Enriched Nickel Nanoparticles for Hydrogenation of N-Heterocycles in Aqueous Media. ACS Appl. Nano Mater. 2022, 5, 5625–5630. [Google Scholar] [CrossRef]
- Wang, Y.; Cui, X.; Denga, Y.; Shi, F. Catalytic Hydrogenation of Aromatic Rings Catalyzed by Pd/NiO. RSC Adv. 2014, 4, 2729–2732. [Google Scholar] [CrossRef]
- Cao, Y.; Zhang, H.; Liu, K.; Chen, K.-J. Water-assisted One-pot Synthesis of N-Doped Carbon Supported Ru Catalysts for Heterogeneous Catalysis. Chem. Commun. 2020, 56, 11311–11314. [Google Scholar] [CrossRef]
- Fang, M.; Sánchez-Delgado, R.A. Ruthenium Nanoparticles Supported on Magnesium Oxide: A Versatile and Recyclable Dual-site Catalyst for Hydrogenation of Mono- and Poly-cyclic Arenes, N-heteroaromatics, and S-heteroaromatics. J. Catal. 2014, 311, 357–368. [Google Scholar] [CrossRef]
- Armarego, W.L.F.; Chai, C. Purification of Laboratory Chemicals, 5th ed.; Elsevier: Oxford, UK, 2003. [Google Scholar]
- Krysan, D.J.; Mackenzie, P.B. A new, convenient preparation of bis (1,5-cyclooctadiene) nickel (0). J. Org. Chem. 1990, 55, 4229–4230. [Google Scholar] [CrossRef]


Disclaimer/Publisher’s Note: The statements, opinions and data contained in all publications are solely those of the individual author(s) and contributor(s) and not of MDPI and/or the editor(s). MDPI and/or the editor(s) disclaim responsibility for any injury to people or property resulting from any ideas, methods, instructions or products referred to in the content. |
© 2023 by the authors. Licensee MDPI, Basel, Switzerland. This article is an open access article distributed under the terms and conditions of the Creative Commons Attribution (CC BY) license (https://creativecommons.org/licenses/by/4.0/).