Article

Generating Novel and Soluble Class II Fructose-1,6-Bisphosphate Aldolase with ProteinGAN

School of Biology and Biological Engineering, South China University of Technology, Guangzhou 510006, China
*
Authors to whom correspondence should be addressed.
These authors contributed equally to this work.
Current address: Shenzhen Institute of Synthetic Biology, Shenzhen Institutes of Advanced Technology, Chinese Academy of Sciences, Shenzhen 518055, China.
Catalysts 2023, 13(12), 1457; https://doi.org/10.3390/catal13121457
Submission received: 30 October 2023 / Revised: 18 November 2023 / Accepted: 21 November 2023 / Published: 22 November 2023
(This article belongs to the Special Issue State-of-the-Art Enzyme Engineering and Biocatalysis in China)

Abstract

:
Fructose-1,6-bisphosphate aldolase (FBA) is an important enzyme involved in central carbon metabolism (CCM) with promising industrial applications. Artificial intelligence models like generative adversarial networks (GANs) can design novel sequences that differ from natural ones. To expand the sequence space of FBA, we applied the generative adversarial network (ProteinGAN) model for the de novo design of FBA in this study. First, we corroborated the viability of the ProteinGAN model through replicating the generation of functional MDH variants. The model was then applied to the design of class II FBA. Computational analysis showed that the model successfully captured features of natural class II FBA sequences while expanding sequence diversity. Experimental results validated soluble expression and activity for the generated FBAs. Among the 20 generated FBA sequences (identity ranging from 85% to 99% with the closest natural FBA sequences), 4 were successfully expressed as soluble proteins in E. coli, and 2 of these 4 were functional. We further proposed a filter based on sequence identity to the endogenous FBA of E. coli and reselected 10 sequences (sequence identity ranging from 85% to 95%). Among them, six were successfully expressed as soluble proteins, and five of these six were functional—a significant improvement compared to the previous results. Furthermore, one generated FBA exhibited activity that was 1.69fold the control FBA. This study demonstrates that enzyme design with GANs can generate functional protein variants with enhanced performance and unique sequences.

1. Introduction

Central carbon metabolism (CCM) is crucial for providing energy and diverse substrates required to sustain essential life processes. CCM includes multiple metabolic pathways and regulatory networks [1]. Exploring the diversity of these proteins enhances our understanding of life and provides novel building blocks for protein or metabolic engineering. In the past, proteins have often been discovered from natural resources through protein chemistry or data mining [2,3]. A more recently strategy to expanding functional protein sequence spaces involves de novo design, which can be used to create completely novel protein sequences rather than optimizing existing natural sequences [4]. Artificial intelligence (AI) technology has been applied for de novo design [5,6,7] using generative models, which focus on learning the distribution characteristics of the data and then directly generating diverse new sequences [8]. For example, ProGen, utilizing a large language model (LLM), is trained on a dataset encompassing approximately 280 million protein sequences. ProGen is capable of generating artificial lysozymes that exhibit as low as 31.4% sequence identity compared to natural sequences, albeit with significantly reduced activity, approximately 200-fold lower than the natural control [9]. Through utilizing graph neural networks (GNNs), ProteinSolver is able to process PDB files containing protein structures as input. This allows the generation of new sequences that fold into predetermined shapes, although the biological activity of the generating proteins have not confirmed [10]. Another generative model, known as variational auto-encoder (VAE), is capable of learning the underlying structure of complex data and generating new data that closely resemble the training data. VAE has been utilized to generate ornithine transaminases, with 87 unique mutants demonstrating improved stability or activity compared to the wild type, and with an average of eight amino acid substitutions [11]. Generative adversarial networks (GANs) employ a game-theoretic approach to learn the generation process of functional sequences [8]. Using GAN based on the self-attention mechanism, ProteinGAN is capable of capturing the intricate evolutionary relationships within the multi-dimensional space of amino acid sequences. It has successfully generated malate dehydrogenases (MDHs) (EC: 1.1.1.37) that have been experimentally verified to exhibit natural catalytic activity and have sequence identities ranging from 66% to 98% compared to natural MDHs, including a highly mutated variant of 106 amino acid mutations (66% identity) [12].
In this study, we apply the ProteinGAN model to the de novo design of a CCM metabolic enzyme—Fructose-1,6-bisphosphate aldolase (FBA) (EC 4.1.2.13) (Figure 1). FBA is an essential glycolytic enzyme, ubiquitous in various organisms and extensively involved in diverse biological processes [13,14]. Based on their structural and catalytic characteristics, FBAs can be classified into two types: class I and class II [15]. Class I FBA, primarily found in higher eukaryotes such as animals, plants, and algae, forms a tetramer [16]. It catalyzes reactions through forming a Schiff-base intermediate through the interaction between the amino group on the active center lysine and the carbonyl group of the natural substrate [17]. In contrast, class II FBA, predominantly found in bacteria, forms various types of multimers [16]. It catalyzes reactions through polarizing the keto carbonyl group of the substrate to an enediol intermediate through divalent metal ions [18]. We chose class II FBA for our design based on the following considerations: (1) There is a comparable number of diverse sequences to MDH (19,527 bacteria class II FBA sequences vs. 16,706 for MDH). (2) It is more readily expressed as it originates primarily from bacteria. (3) It possesses a more intricate structure and function compared to MDH. It incorporates motifs for binding metals and substrate, and it cleaves a substrate molecule into two distinct product molecules.
Initially, we corroborated the viability of the ProteinGAN model in generating MDHs [12]. Subsequently, we assessed the model’s efficacy in generating sequences for class II FBA. Out of the 20 FBA sequences generated in silico, 4 showed soluble expression in E. coli, with 2 exhibiting activity. We further proposed a filter predicated on sequence identity to the endogenous FBA of the expression host. After reselection, 10 sequences were obtained, of which 6 were found to be soluble, and 5 sequences exhibited activity, with a maximal activity 1.69 times that of the control FBA. This study successfully demonstrated the feasibility of using ProteinGAN to explore the potential protein sequence space of FBA and generate diverse and high-performance novel enzymes.

2. Results

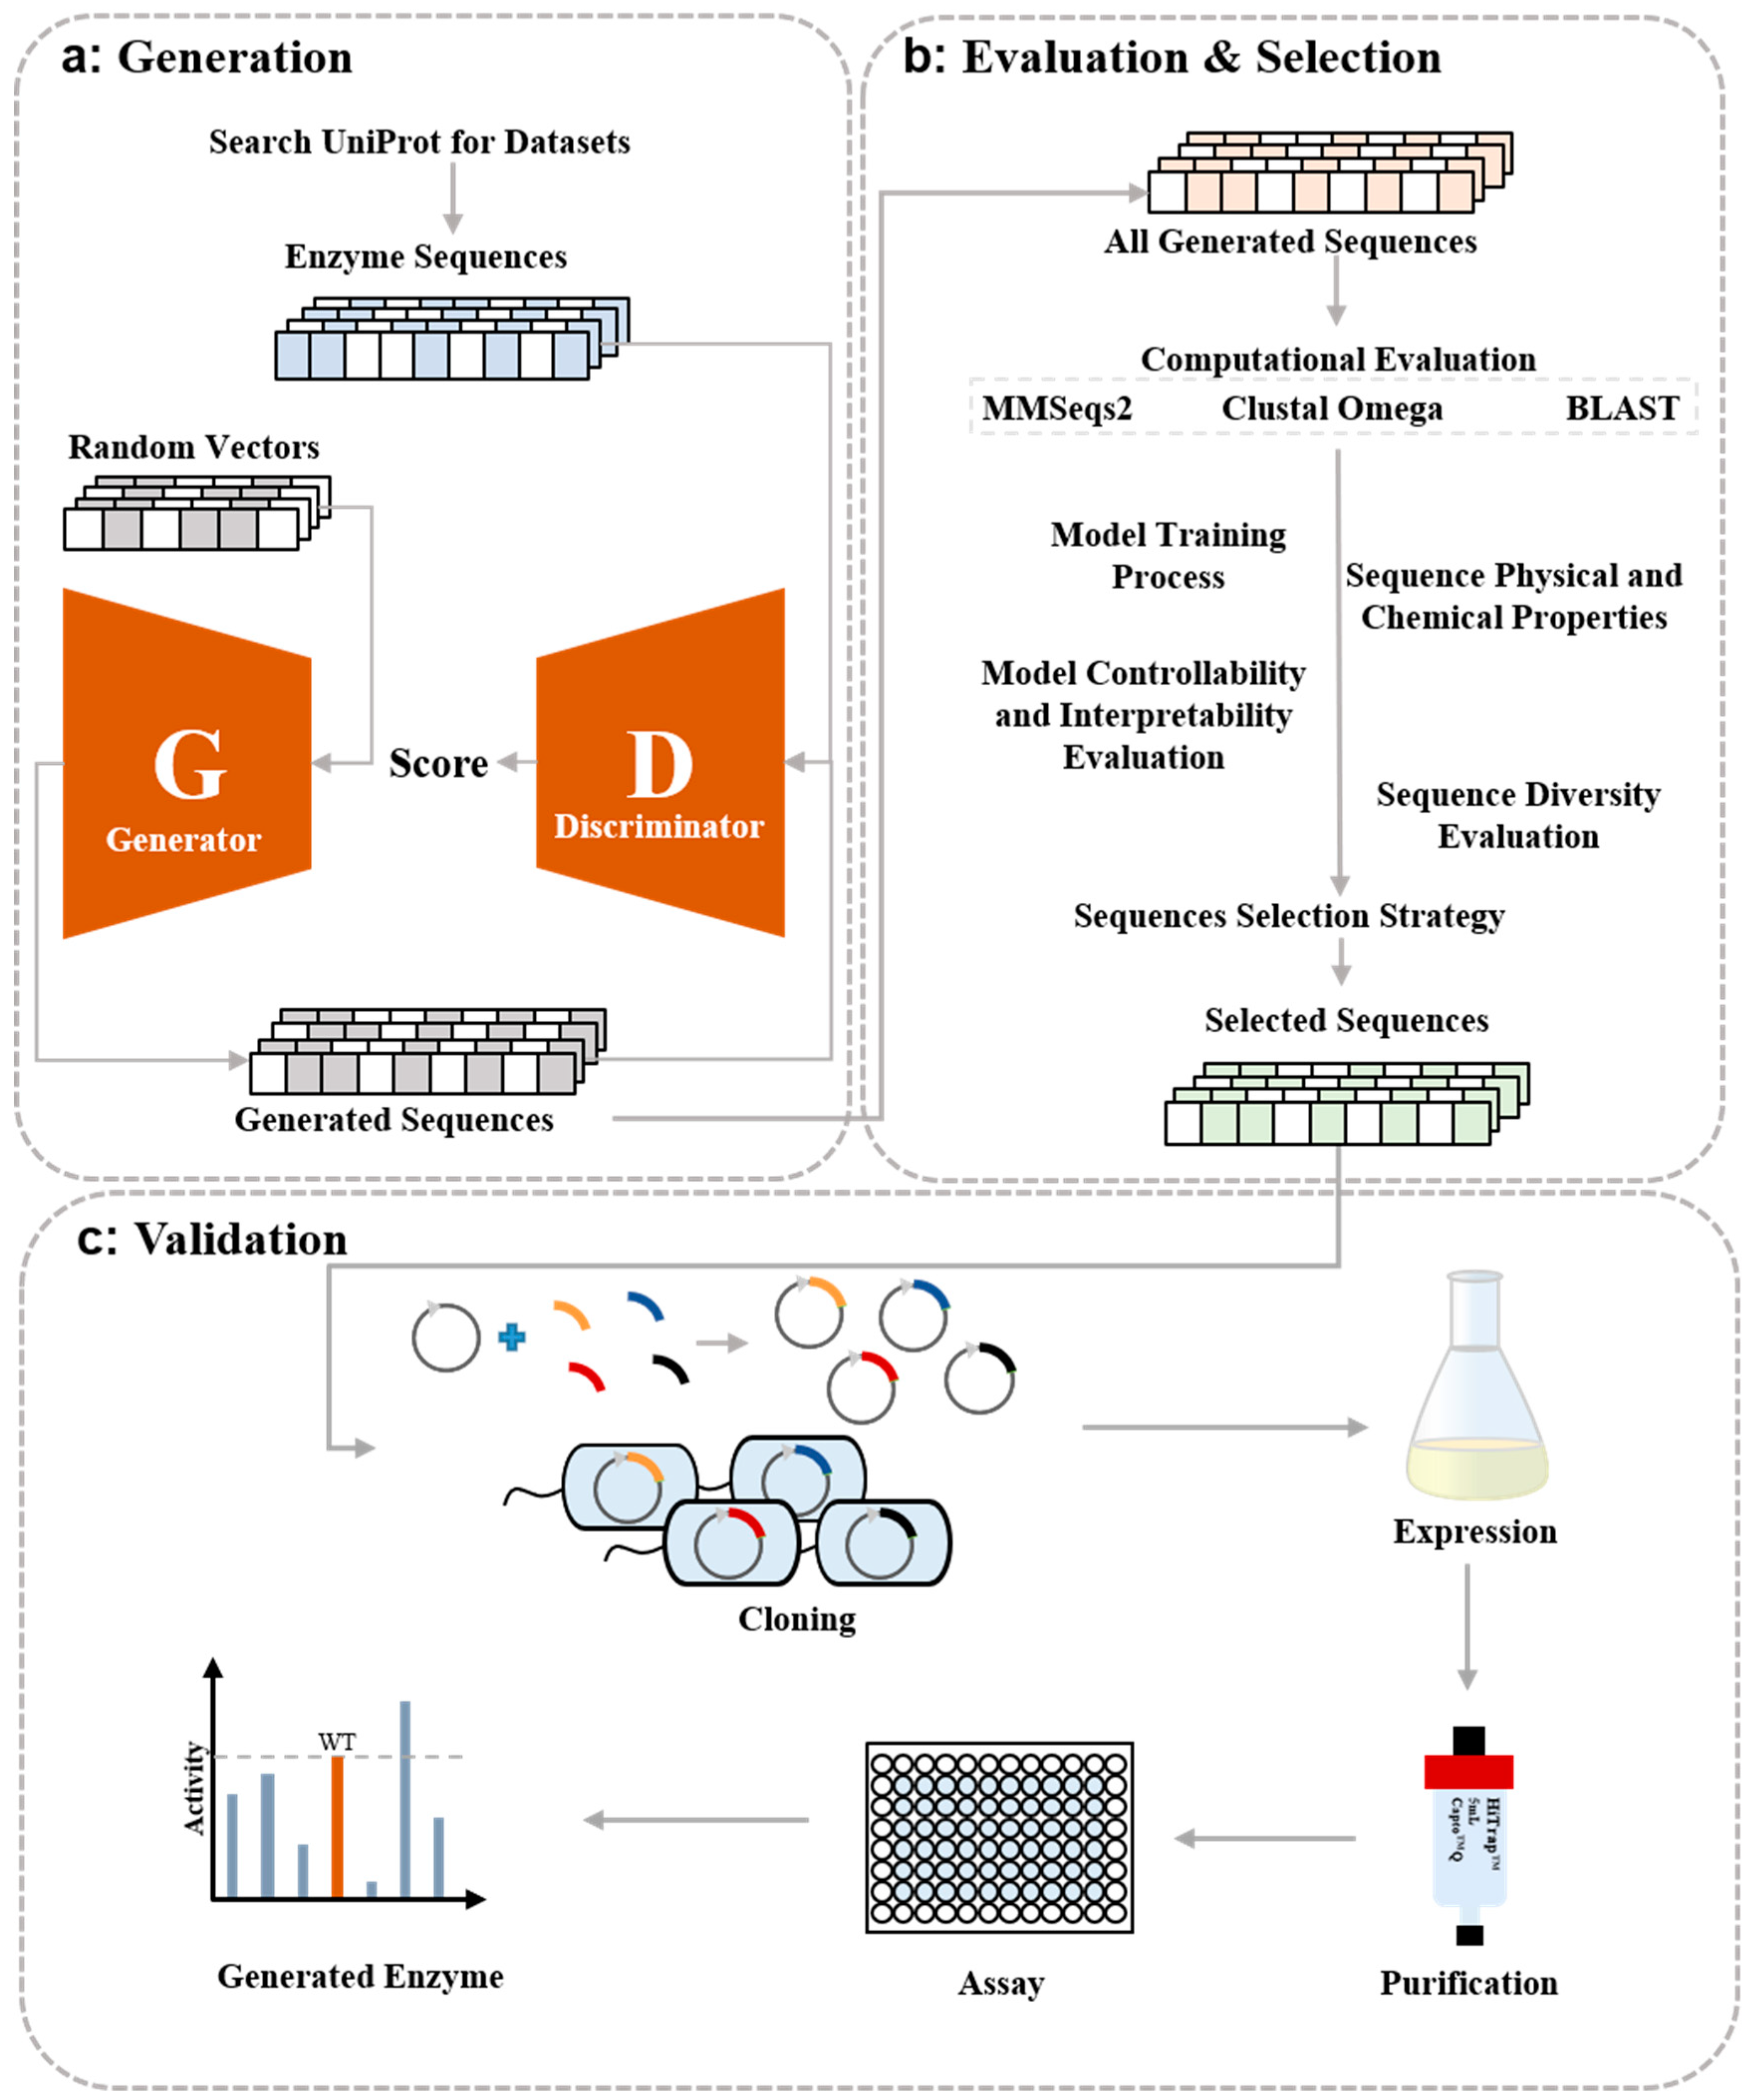
2.1. Replication of ProteinGAN and Validation Using MDH

We replicated the ProteinGAN model based on the code provided by Repecka et al. and evaluated its efficacy with the identical MDH dataset [12] (Tables S1 and S2). During training, we noticed that the generator-to-discriminator decay ratio had a substantial influence on model convergence, with successful convergence achieved at a ratio of 5:2 (Figure S1a). The remaining parameters of the model were configured based on Repecka et al.’s study: learning rate—5 × 10⁻⁵; steps—2,500,000 [12]. The model convergence was evaluated through monitoring several variables, including the loss of the generator and discriminator, the discriminator’s scoring, the sequence identity, and the BLOSUM matrix score between generated sequences and training sequences (Figure S2). After the initial training, both the generator and discriminator losses exhibited a relatively stable trend before plateauing (Figure S2a). The discriminator network demonstrated effective differentiation between generated and natural sequences, with the scoring gap between these two types of sequences gradually narrowing as training steps increased (Figure S2b). For every 1200 learning steps, the model generated 64 sequences. The identity and BLOSUM matrix scores of these generated sequences were then compared to the natural sequences in both the training and validation datasets. The identity and BLOSUM matrix scores between generated and natural sequences showed a progressive increase and eventually reached a stable state after 2,500,000 learning steps (Figures S3a and S2c,d). Monitoring these variables led to the conclusion that the generator’s data quality improved over time, indicating steady model convergence.
We evaluated the interpretability and controllability of the model via interpolation as described [12]. The resulting correlation matrix heatmap visualized the correlations between the physicochemical properties of sequences and the dimensions of the latent space (Figure S3b). On average, the absolute Pearson’s correlation coefficient was 0.86, with 81% of latent space dimensions highly correlated (absolute Pearson’s correlation coefficient > 0.8) with corresponding primary or secondary sequence features. This indicates the tunability of physicochemical properties through manipulating the latent vector. These results are consistent with those reported previously (average Pearson’s r = 0.86, 76% highly correlated dimensions), demonstrating the effective replication of the ProteinGAN model and its controllability in this study [12].
We then conducted a series of bioinformatics analyses to evaluate the quality of the generated sequences, aiming to determine if the model captured the latent representations and evolutionary relationships inherent to natural sequences. First, we performed amino acid composition analysis, which showed a strong correlation between the generated and natural MDHs when categorized according to their physicochemical properties (Pearson’s correlation coefficient > 0.9) (Figure S3c). This indicates that the model successfully learned evolutionary and physicochemical constraints. Next, we examined amino acid types and distributions at each position through aligning generated and natural sequences. Sequence logo analysis (Figure S3d) and Shannon entropy (Figure S3e) revealed the preservation of key catalytic and substrate-binding residues, indicating a high degree of consistency between the generated and natural sequences. This suggests the effective learning of relationships inherent to the natural data. We also evaluated the diversity of the generated MDH sequences, finding up to four-fold more clusters for generated versus natural MDHs (Figure S3f). The t-distributed stochastic neighbor embedding (t-SNE) [19] dimensionality reduction visualization further demonstrated a broader distribution for the generated sequences, indicating an enhanced sampling of sequence space (Figure S3g). Overall, these analyses demonstrated the model’s ability to generate diverse sequences capturing key features of natural protein evolution.
We used the trained model to generate a total of 16,706 sequences, equivalent to natural sequences. These sequences were filtered to include pairs with an identity exceeding 85% of the natural sequences (based on the experimental results from Repecka et al. [12]) and obtained a total of 897 sequences. From this subset, we picked up 20 sequences with closet identity to natural MDH ranging from 85% to 99%, containing 6–46 amino acid mutations (including substitutions, insertions, and deletions, Table S3). These sequences were checked for essential amino acids in functional positions (including active site, substrate binding sites, and NAD+ binding sites, Figure S3d). The resulting sequences were synthesized and cloned into the pET32a expression vector. These constructs were then expressed in E. coli Origami B (DE3) and tested for enzyme activity. Four sequences were successfully soluble expressed, and three of them were successfully purified using affinity chromatography, which showed 91.36%, 61.35%, and 4.51% enzymatic activity relative to MDH−WT, respectively. These three MDH sequences exhibited 91.46%, 86.59%, and 94.14% of identity to the closest natural MDH sequence, equal to containing 28, 44, and 17 amino acid mutations (Table S3, Figures S4 and S5).
The soluble expression variants and the functional variants accounted for 20% (4/20) and 15% (3/20), respectively, slightly lower than the results of Repecka et al. [12] (35% or 19/55, 24% or 13/55) [11]. It was noteworthy that to improve the soluble expression ratio of MDH, Repecka et al. used a second expression host, ArcticExpress (DE3) [12]. However, in our experiments, we found that MDH−WT could not be normally expressed in this expression system. Using this method, 14 out of 20 generated MDH sequences were soluble or partially soluble expressed, but the enzyme activity validation results showed that their expression supernatants were all inactive. Therefore, using ArcticExpress (DE3) for expression failed to provide a solution for optimizing the solubility of the generated MDHs. Additionally, protein solubility predictions via Protein-Sol [20] also disagreed with our results (Table S3) [19].
We compared our functional MDH sequences to those produced by Repecka et al. The highest identity found was 71% (Table S4), indicating our generated sequences are novel and distinct from the sequences generated in their study. Furthermore, the preserved enzymatic activity demonstrates ProteinGAN’s ability to produce functional MDH variants on par with natural sequences.

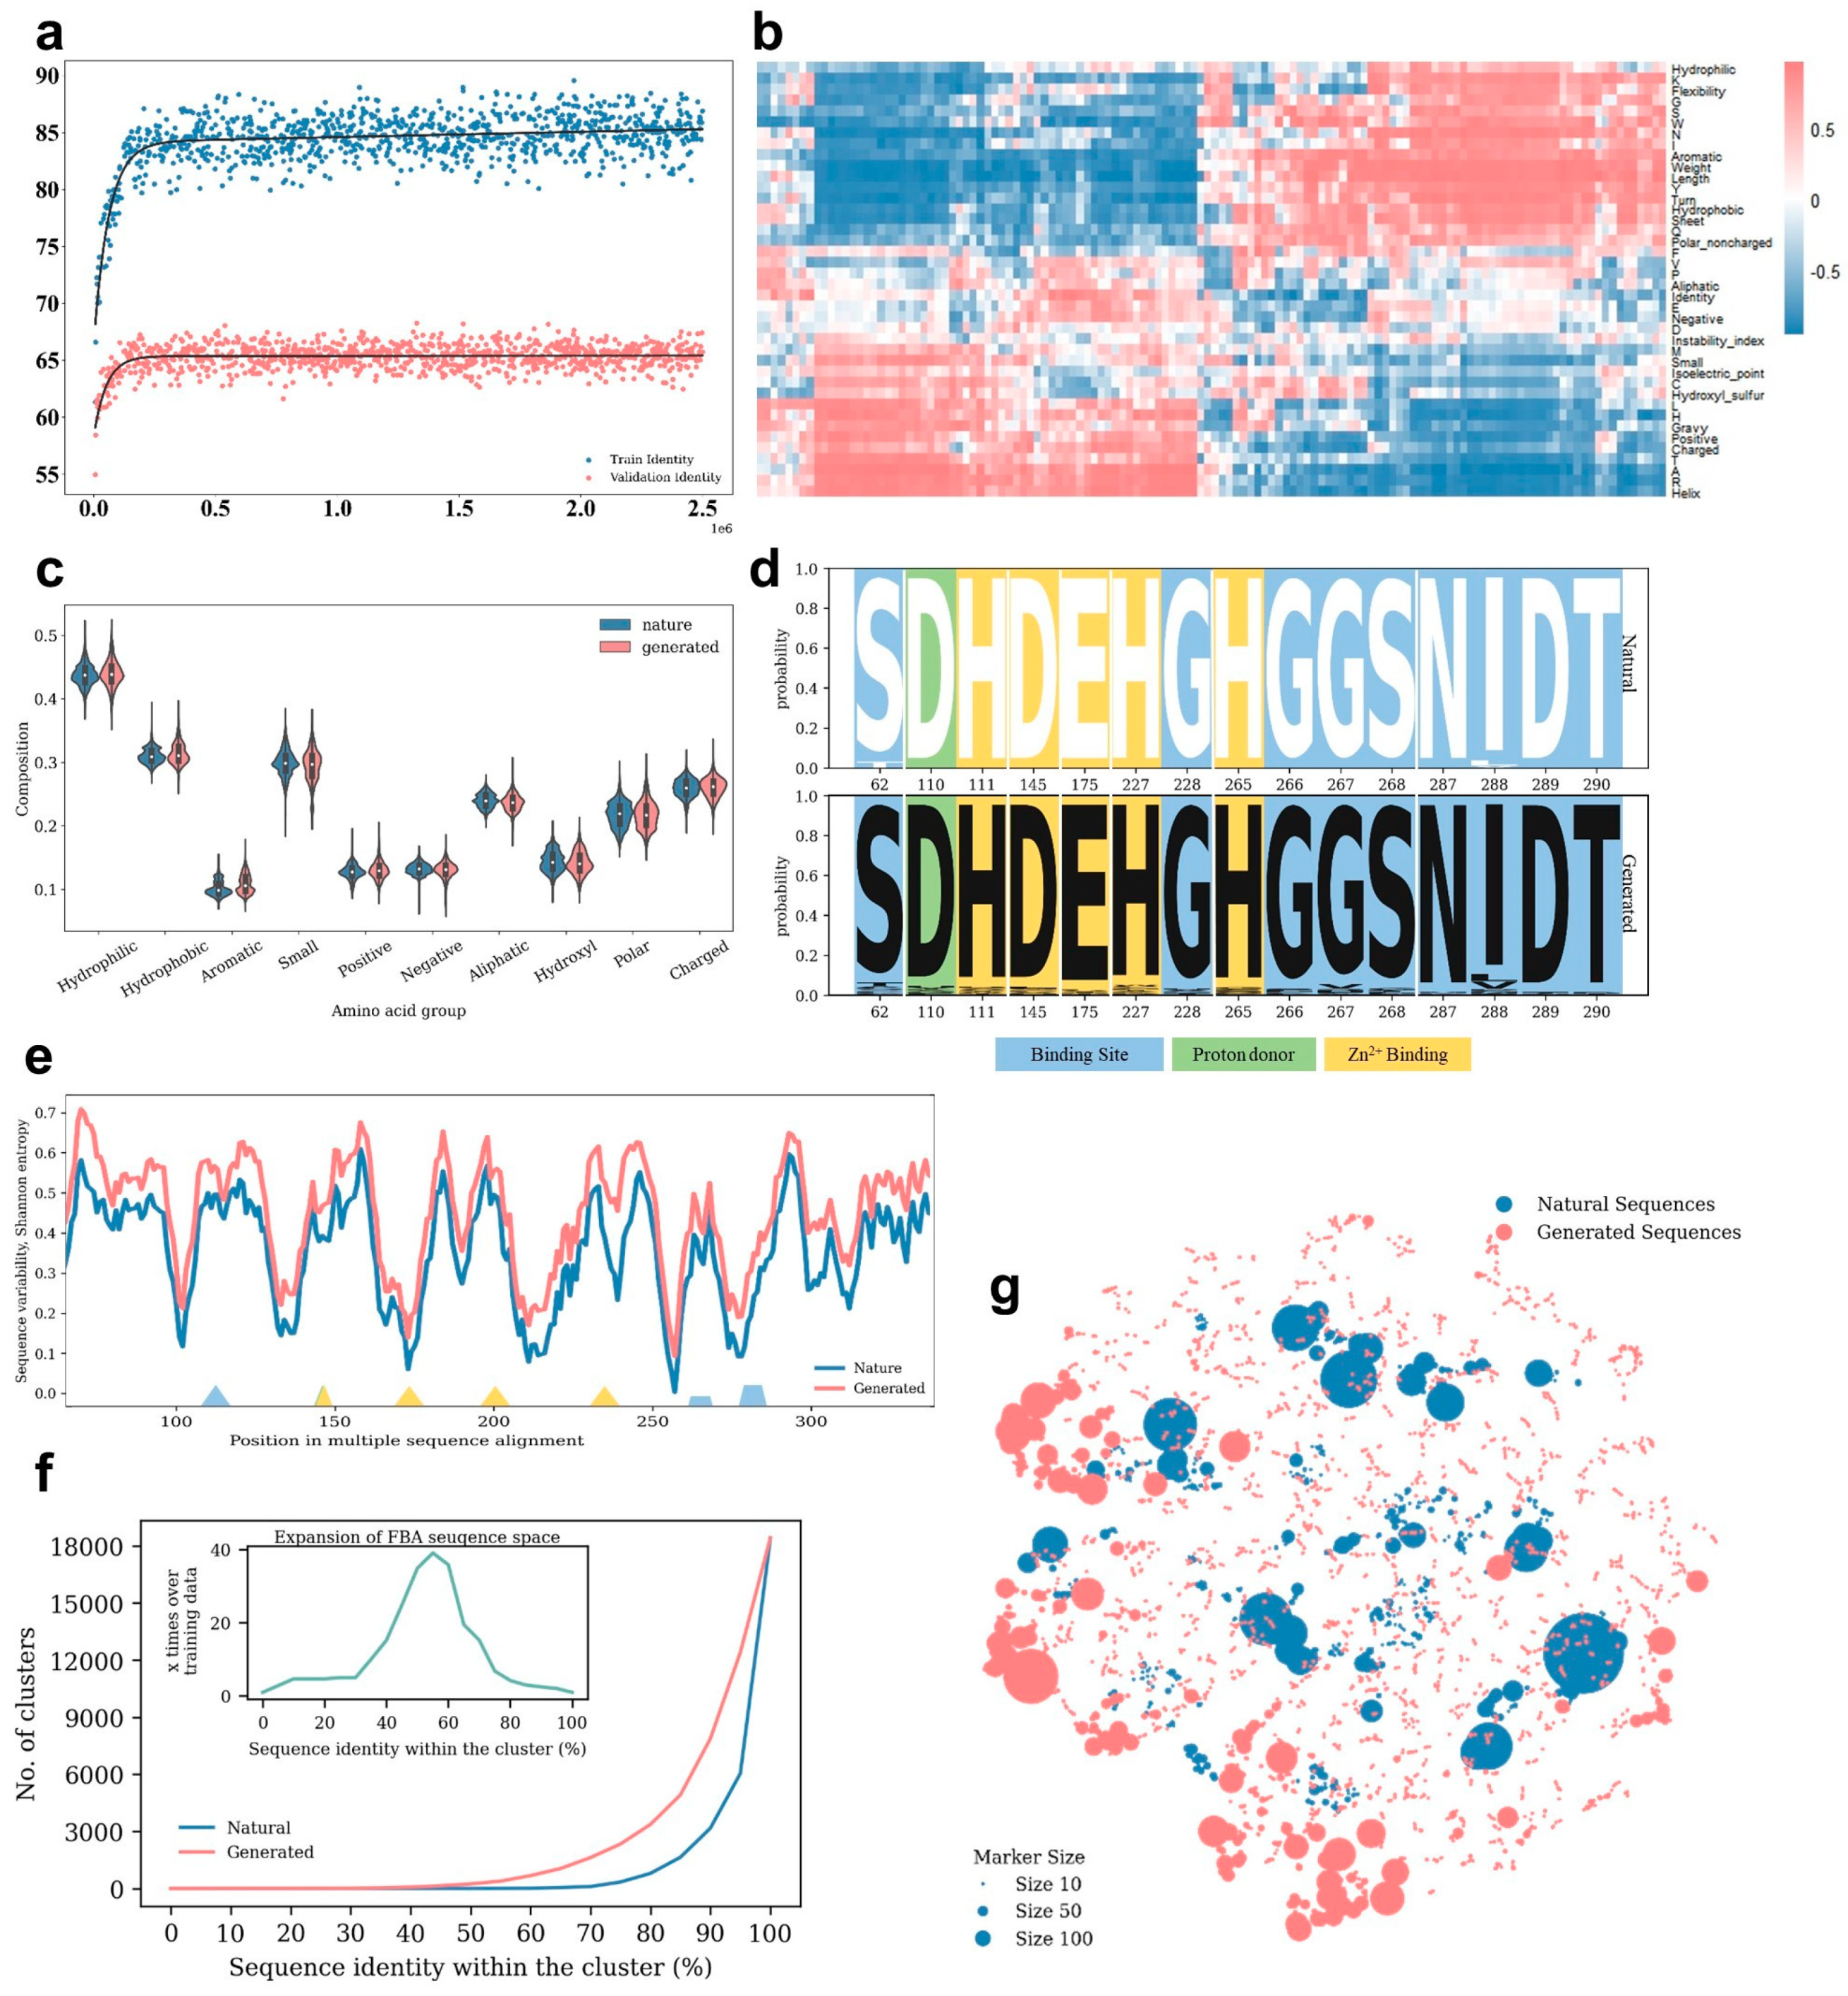
2.2. Computational Evaluation of Generated FBA Sequences

We then applied this model for the de novo design of class II FBA. A total of 19,527 bacterial class II FBA family sequences were downloaded from UniProt (https://www.uniprot.org/, accessed on 25 September 2022) on September 25, 2022. Sequences with lengths less than 300 amino acids and longer than 512 amino acids were excluded. To balance the dataset, an up-sampling approach was utilized, resulting in 18,404 sequences designated for training and 160 sequences allocated for validation (Tables S5 and S6).
We optimized three hyper-parameters, including steps, learning rate, and decay ratio, to obtain a ProteinGAN model that can better understand and control primary and secondary sequence properties for FBA. Four different sets of hyperparameters were selected, and three models were trained in parallel for each set, resulting in a total of 12 models (Table S7). The Class II FBA-4 model, which has a learning rate of 5 × 10⁻⁴, a decay ratio of 3:2, and 2,500,000 steps, was chosen for further investigation. The model convergence was assessed through monitoring variable trends as stated previously and yielded results similar to those presented earlier (Figure 2a and Figure S6).
A similar computational evaluation approach to that of MDH was used for the FBA model. Statistical analysis of the final model’s correlation matrix revealed that approximately 97.6% of latent space dimensions were highly correlated (absolute Pearson’s correlation coefficient > 0.8) with corresponding primary or secondary sequence features, with an average absolute Pearson’s correlation coefficient of 0.91 (Figure 2b). Furthermore, the generated FBA sequences exhibited strong correlations with natural FBA sequences in terms of physicochemically categorized amino acid composition (Pearson’s correlation coefficient > 0.9) (Figure 2c). Sequence logo analysis and Shannon entropy demonstrated that the amino acid compositions of conserved positions in the generated FBA sequences were consistent with those of the natural sequences (Figure 2d,e). The diversity of the generated FBA sequences was also evaluated, revealing that the cluster numbers of the generated sequences were up to 40 times higher than those of the natural sequences (Figure 2f,g). Despite the conservative nature of the FBA training dataset, the use of ProteinGAN effectively expanded the sequence space, highlighting their utility for expanding the space of highly conserved functional proteins.

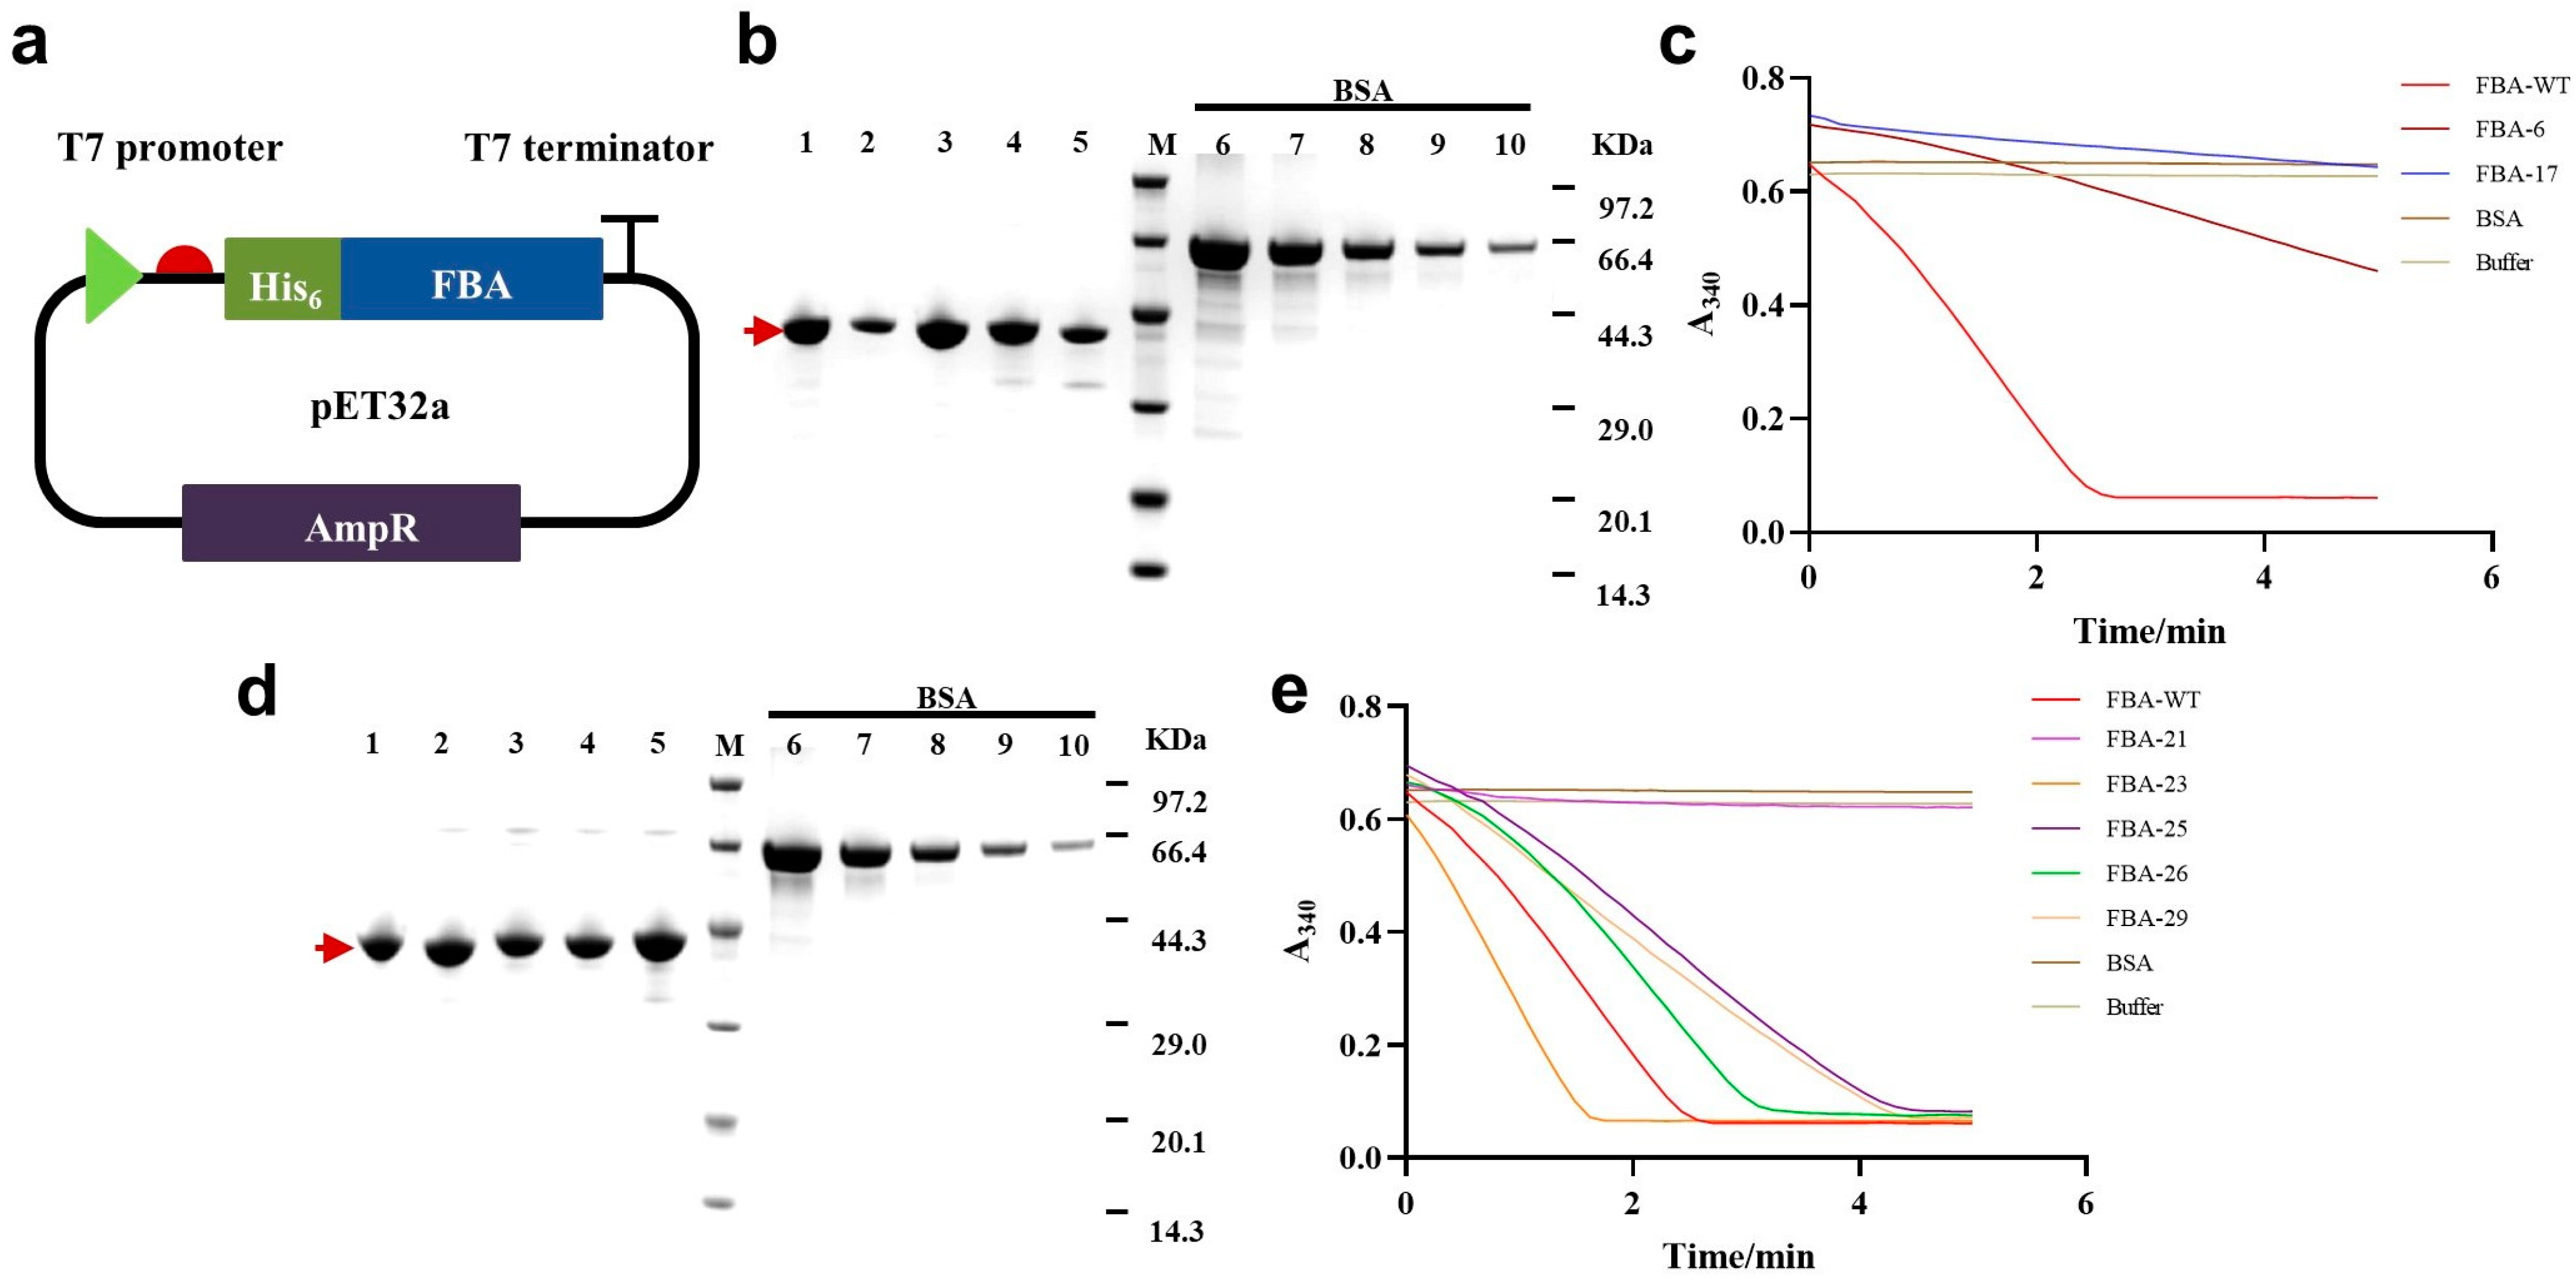
2.3. Experimental Validation of Generated FBA Sequences

We generated a total of 18,564 sequences using the trained model, equivalent to natural sequences. Among them, 2033 sequences exhibited an identity of over 85%. From this subset, we picked up 20 sequences with closest identity to natural FBA ranging from 85% to 99%, containing 2–52 amino acid mutations (including substitutions, insertions and deletions, Table S8). These sequences were checked for essential amino acids in functional positions (including the active site, substrate binding sites, and Zn2+ binding sites; Figure 2d) [21]. The 20 selected sequences were successfully synthesized and cloned into the pET32a expression vector, which included an N-terminal histidine tag, respectively (Figure 3a) [22,23]. In E. coli BL21 (DE3) cells, 16 of these sequences were expressed, but only 4, i.e., FBA−1, FBA−6, FBA−8, and FBA−17, were expressed as soluble proteins, and the remaining 12 were found to be insoluble (Figure S7).
Three variants, i.e., FBA−1, FBA−6, FBA−17, and FBA−WT, were purified from the soluble fraction of the cell lysate using the Ni-NTA method, with yields ranging from 18.9 to 112.9 mg/L LB and purities ranging from 86 to 95% (Table 1, Figure 3b). The FBA activity of the purified proteins was evaluated through monitoring NADH consumption in a spectrophotometer using a coupled enzyme method [12,24]. The FBA gene was amplified from the E. coli K12 genome as a control, referred to as FBA−WT [25]. FBA−6 and FBA−17 exhibited relative FBA activity of 15.58% and 13.97%, respectively, compared to the wild-type FBA. The sequence identity relative to the closest natural FBA sequence for FBA−6 and FBA−17 was 96.90% and 88.55%, respectively, equal to containing 11 and 41 amino acid mutations (Figure 3c, Table S8). However, FBA−1 did not exhibit detectable enzymatic activity in our assays.
It is worth noting that only 20% (4/20) of the 20 designed FBAs were expressed in a soluble form, which was consistent with the MDH case. Analysis of the first batch of 20 sequences revealed that those sequences exhibiting soluble expression shared a high degree of identity with FBA−WT from E. coli (Table S8). We hypothesized that the solubility of recombinant proteins is correlated with their identity to endogenous genes in the expression strain. To optimize the soluble expression ratio, a filter was implemented during the selection process of generated sequences, ensuring that the identity to the E. coli FBA was kept above 80%, which is higher than the highest identity to the E. coli FBA in the first batch. Additionally, sequences with the closest identity to natural FBA sequences ranging from 85% to 95% were chosen to introduce more diversity in the generated FBAs. To validate the feasibility of this strategy, 10 generated FBA sequences were re-selected for further experimentation (Table S9).

2.4. Experimental Validation of Re-Selected FBA Sequences

We successfully cloned and expressed 9 of the 10 selected sequences, of which 6 were soluble (Figure 3b,d and Figure S8). After purification, five sequences (FBA−21, FBA−23, FBA−25, FBA−26, and FBA−29) exhibited FBA activities ranging from 9% to 169% relative to FBA−WT, with protein yields ranging from 4.78 to 36.81 mg/L LB and purities above 85% (Table 1). Among these sequences, FBA−23 showed the highest activity, with an enzymatic activity 1.69 times that of the FBA−WT. It contained 28 amino acid mutations and had an identity of 92.98% to the closest natural FBA sequence (UniProt ID: A0A7V8PSN0) from Pectobacterium carotovorum. FBA−29, with 47 amino acid mutations and an identity of 86.87% to the closest natural FBA sequence (UniProt ID: A0A0A0CT14) from Photorhabdus luminescens, retained approximately 65% of the activity relative to FBA−WT (Figure 3e, Table S9). After implementing the optimized sequence selection strategy, the solubility expression ratio increased to 60% (6/10), and 83.33% (5/6) were functional, which was significantly higher than the previous results. These results demonstrate the successful application of ProteinGAN for the design of FBA, resulting in the generation of new, highly diverse, and functional enzymes.

2.5. Sequence Diversity Analysis of FBA−23

Compared to their closest natural sequences, the five functional FBA variants contained 21–47 mutations (excluding the active site and substrate/Zn2+ binding site), primarily situated at a considerable distance from the active pocket. Computational analysis revealed all 28 mutations in the top-performing variant, FBA−23, were localized to distal sites (10.9–37.5 Å, averaging 22 Å; residues >10 Å from the active site were defined as distal [26]; Figure S9). In contrast, prior engineering of E. coli FBA reported 19 mutants (brenda-enzymes.org, accessed on 16 October 2023, 18 single mutants, 1 double mutant) involving 16 sites, with 1 in the active site, 5 proximal sites (4 substrate/Zn2+ binding sites), and 10 distal sites (1 substrate/Zn2+ binding site). Notably, FBA−23 only shared two sites with these variants, with different amino acid changes.

3. Discussion

This study effectively demonstrated the successful application of ProteinGAN for exploring the sequence space of FBA. Through combining this with experimental validation, we were able to obtain diverse and high-performance enzymes. This methodology has proven efficient in protein engineering.
It is worth noting that the endogenous FBA of E. coli has the potential to form heteromeric complexes with our designed FBA, as FBA is a dimeric enzyme [15]. However, the impact of these heteromeric complexes can be disregarded due to the significantly higher expression levels (several dozen to hundred times) of our designed FBAs compared to the endogenous FBA in E. coli (Figures S7 and S8). Additionally, the designed FBAs were purified using the His-tag strategy. Nonetheless, further meticulous verification is required to assess the impact of endogenous proteins.
Our work is based on unsupervised learning and does not make full use of function tag information. In future research, we can further combine unsupervised learning with supervised learning through using conditional generative adversarial networks [27], applying sequence activity or specificity functional labels to further refine boundary conditions for generating data and controlling the model data generation direction. During the generation process, both the generator and discriminator incorporate external conditional information, such as sequence functional values, allowing the generator to produce authentic data under specific circumstances. Through an adversarial training game, the generator and discriminator work together to iteratively improve the quality of generated outcomes. GANs can also be applied to a finer-grained mutation library, learning to generate more diverse variants and providing a new sampling method for subsequent supervised learning. With the growth and improvement of protein structure data, it will be possible to directly learn protein structure and design sequences with new structures and functions from scratch [28].

4. Materials and Methods

4.1. Model Training

4.1.1. FBA Datasets

A total of 19,527 bacteria class II FBA (EC: 4.1.2.13) sequences were downloaded from UniProt [29] on 25 September 2022. During the process of selecting sequences, we filtered out sequences that were shorter than 300 amino acids (as the known length range of natural enzymes is mostly concentrated around 300–400 amino acids, Table S6), longer than 512 amino acids (the fixed-length input limitation of the model, as indicated by prior study [12]), or contained non-standard amino acids. In the end, a total of 18,564 sequences were selected to construct the FBA dataset (Table S6).
Dynamic up-sampling was applied to balance the dataset to prevent model collapse and generate more diverse sequences [12]. First, we use the MMSeqs2 [30] tool to cluster the sequences used for training with a threshold of 0.7, grouping these sequences into multiple clusters with a sequence identity of 70%. Up-sampling factors were set based on the number of sequences for each cluster (Table S5). In the FBA dataset, sequences in clusters with fewer than 3 sequences were used for validation (160 sequences), while the rest of the data were used for training (18,404 sequences).

4.1.2. Architecture of the Model

We use a generative adversarial network model based on ProteinGAN to carry out the de novo design of MDH and FBA [12]. The model consists of a generator and a discriminator. It uses convolutional layers [31] to extract local features from protein sequences and self-attention layers [32] to capture the global features of the sequences. Residual blocks were used to solve the degradation problem of gradient vanishing or explosion during the training process [33]. Spectral normalization (SN) was applied in each layer to ensure training stability [34]. Non-saturating loss functions and R1 regularization were used to aid model convergence [35]. The gumbel softmax trick was used to address the problem of gradient non-backpropagation in using GANs to generate discrete data [36].

4.1.3. Training Process

In the process of FBA de novo design, we selected 4 final hyperparameter sets, each training 3 parallel models for a total of 12 models (Table S7). The optimal model was chosen based on computational performance metrics. Its configuration was as follows: Adam optimizer parameters of 0.0 and 0.9; 3 × 3 convolutional kernel size; batch size of 64; BLAST [37] sequence identity and BLOSUM45 matrix scoring against training/validation sets every 1200 steps; 2,500,000 training steps over ~10 days. The model had 58,990,542 total trainable parameters, with 29,258,456 in the generator and 29,732,086 in the discriminator. Starting from training step 100,000, the learning rates for both the generator and discriminator decreased from 5 × 10⁻⁴, with a ratio of 3:2, until reaching 5 × 10⁻⁵ without further changes (Figure S1b).

4.1.4. Interpolation

The controllability and interpretability of the generator indicate its ability to control specific features of generated samples through adjusting the latent space. We assessed these using the interpolation method [12], which evaluates correlations between statistical sequence analysis and the biophysical properties of interpolated latent vectors. Evaluated properties included percentages of standard amino acids, identity to the closest training sequence, sequence length, etc. [12]. First, uniform interpolation was performed in the input latent vector space, interpolating 1024 values from −1 to 1 for each of the 128 dimensions while holding others at 0, generating 128 × 1024 vectors. These were input to the generator, producing 128 × 1024 sequences. The biophysical properties of each sequence were computed and analyzed statistically. Finally, Pearson’s correlation coefficient between the input value and property value was calculated for each dimension, yielding a correlation interpolation matrix. Statistical analysis of correlations between latent dimensions and primary/secondary sequence features evaluated the controllability of the generated sequence distribution through altering latent vector variances.

4.2. Computational Evaluation

4.2.1. Amino Acids and a Group of Amino Acids Composition

The trained model was used to generate sequences matching the training set size. Amino acid and amino acid group proportions were statistically compared between generated and natural sequences using box plots with matplotlib. Amino acid groupings were based on shared biochemical properties [12].

4.2.2. Shannon Entropy

The trained model was used to generate sequences matching the training set size. Generated and natural sequences were aligned using Clustal Omega [38]. Alignments were separated into generated and natural sets. Columns with >70% gaps were excluded to avoid bias. The Shannon entropy (SE) of each column was calculated as in [12]:
S E = i = 1 20 p ( x i ) log 20 p ( x i )
In the formula, p ( x i ) denotes the frequency of amino acids appearing in a column of sequence alignment. For both the generated and natural sequences, we analyze the SE values at each position, along with the occurrence of peaks (high entropy) and valleys (low entropy).

4.2.3. Sequence Logo

Utilizing the multiple sequence alignment results, we create sequence logos to visually assess the distribution of amino acid types at crucial positions within both the generated and natural sequences.
First, we queried the essential key positions of the positive controls, such as binding sites, active sites, and others, from the UniProt database [29]. Then, based on the positions of the wild-type key sites, we analyzed the sequence alignment results at those locations. Subsequently, we created separate sequence logos for both the natural and generated sequences and marked the key positions relative to the Shannon entropy.

4.2.4. Sequence Diversity

We utilized the well-trained model to generate a set of sequences equivalent in size to natural sequences. Next, we performed separate clustering analyses on the sequences generated by the model and the natural sequences using thresholds ranging from 0.1 to 0.95 in increments of 0.05, with the help of the MMSeqs2 [30] tool. The clustering results were visualized using Matplotlib, and we calculated the ratio of the number of sequences at each threshold for both the generated and natural sequences.
Equal numbers of generated and natural sequences were clustered at the 0.8 threshold with MMSeqs2 [30]. Representative sequences and cluster sizes were obtained. Representatives were aligned in Clustal Omega [38] to create distance matrices. The post-clustering distance matrix was input to t-SNE [19] for dimensionality reduction and visualization using Scikit-learn (default settings) and an embedding generation perplexity of 7. The visualization was then plotted using the Matplotlib library, with the point radius correlated to cluster size.

4.3. Experimental Validation of Generated Enzymes

MDH experimental validation methods can be found in the supplementary method.
The FBA gene was amplified from the E. coli K12 genome as a natural control, referred to as FBA−WT. The sequences generated by ProteinGAN were codon-optimized and synthesized by Beijing Ruiboxingke Biotechnology Co., Ltd. (Beijing, China). The synthetic sequence was cloned into the pET32a expression vector with a 6×His tag at the N-terminus for downstream affinity purification. The constructs were transformed into the E. coli BL21 (DE3) expression strain, and the transformants were inoculated into 3 mL Luria Broth (LB) medium containing 100 µg mL−1 ampicillin and incubated overnight at 37 °C with shaking at 220 rpm. Then, 2 mL of the overnight culture was transferred to 100 mL fresh LB medium with the same resistance (1:50 dilution) and grown at 37 °C for 2 h until the cell density reached 0.6–0.8 at 600 nm, followed by induction with 0.1 mM IPTG at 16 °C with shaking at 200 rpm overnight.
Cells were harvested via centrifugation at 4000× g and 4 °C for 10 min, resuspended at 50 OD600/mL in a binding buffer (0.1 M sodium phosphate buffer, 0.5 M NaCl, 30 mM imidazole, pH 7.4), and sonicated on ice with 30% amplitude for a total of 15 min (3 s on/off, power 30%) in a 50 mL centrifuge tube. The cell debris was removed via centrifugation at 15,000× g and 4 °C for 20 min, and the supernatant was filtered through a 0.22 µm low protein binding filter membrane and purified using a HisTrapTM HP 5 mL affinity chromatography column (Activa) for soluble recombinant FBA mutants. The column was washed with a binding buffer, and the protein was eluted with an elution buffer (0.1 M sodium phosphate buffer, 0.5 M NaCl, 500 mM imidazole, pH 7.4) gradient. The purified protein was dialyzed against a 0.1 M Tris-HCl buffer (pH 7.4) containing 300 µM ZnCl2. The purified protein was further characterized via SDS-PAGE using bovine serum albumin (BSA) standard for quantification.
Under the action of propanose phosphate isomerase and α-glycerol phosphate dehydrogenase, NADH and dihydroxyacetone phosphate are catalyzed to generate NAD+ and glycerol 3-phosphate. We monitored FBA activity using the coupled enzyme method, which involved a fructose-1,6-bisphosphate aldolase activity assay kit (Solarbio, Beijing, China) containing both propanose phosphate isomerase and α-glycerol phosphate dehydrogenase. The reaction mixture (final volume of 200 µL) containing equal amounts of purified protein (20 µL) and freshly prepared assay kit reaction mixture (180 µL) was incubated in a 96-well UV-transparent plate (UV-Star microplate, Greiner Bio-One, Frickenhausen, Germany) at 25 °C [39]. The absorbance was continuously read at 340 nm for 5 min using an Infinite M200 Pro microplate reader (TECAN). The extinction coefficient for NADH at 340 nm was 6.22 mM cm−1 (εM), and the path length (l) in the microplate was 0.5. One unit of enzyme activity was defined as the amount of enzyme required to consume 2 µmol of NADH per minute under these conditions.

Supplementary Materials

The following supporting information can be downloaded at: https://www.mdpi.com/article/10.3390/catal13121457/s1, Figure S1: Learning rate schedules during the training process; Figure S2: Training process of the selected MDH model; Figure S3: Evaluation of MDH training process and generated sequences; Figure S4: SDS-PAGE results for expression of recombinant MDHs; Figure S5: Purification and activity verification of soluble generated MDHs; Figure S6: Training process of the selected FBA model; Figure S7: SDS-PAGE results for expression of recombinant FBAs (FBA−1 to FBA−20); Figure S8: SDS-PAGE results for expression of recombinant reselected FBAs (FBA−21 to FBA−30); Figure S9: The distribution of differential sites in FBA−23 relative to FBA−WT; Table S1: Sequence Length Distribution of Malate Dehydrogenase Dataset; Table S2: Up-sampling Factor for MDH Dataset; Table S3: Sequence identity, solubility, and activity information of the selected 20 generated MDHs; Table S4: Sequence alignment results of MDH−8, MDH−11, and MDH−18 with 13 functional sequences generated by Repecka et al.; Table S5: Up-sampling Factor for Class II FBA Dataset; Table S6: Sequence Length Distribution of Class II FBA Dataset; Table S7: Evaluation and comparison of the 12 FBA models using interpolation methods; Table S8: Sequence identity, solubility, and activity information of the selected 20 generated FBAs; Table S9: Sequence identity, solubility, and activity information of the 10 reselected FBAs.

Author Contributions

Conceptualization, Z.L. and X.Y.; methodology, F.T. and M.R.; software, M.R.; validation, F.T. and X.L.; formal analysis, F.T. and M.R.; investigation, F.T. and M.R.; resources, Z.L. and X.Y.; data curation, M.R.; writing—original draft preparation, F.T. and M.R.; writing—review and editing, Z.L., X.Y., F.T. and M.R.; visualization, F.T. and M.R.; supervision, Z.L. and X.Y.; project administration, Z.L. and X.Y.; funding acquisition, Z.L. All authors have read and agreed to the published version of the manuscript.

Funding

This research was funded by National Key R&D Program of China (2018YFA0901000, 2022YFC2104800).

Data Availability Statement

The data presented in this study are available on request from the corresponding author.

Conflicts of Interest

A copyright (2023SR0505132) has been filed for the FBA design method.

References

  1. Schink, S.J.; Christodoulou, D.; Mukherjee, A.; Athaide, E.; Brunner, V.; Fuhrer, T.; Bradshaw, G.A.; Sauer, U.; Basan, M. Glycolysis/gluconeogenesis specialization in microbes is driven by biochemical constraints of flux sensing. Mol. Syst. Biol. 2022, 18, e10704. [Google Scholar] [CrossRef] [PubMed]
  2. Genee, H.J.; Bali, A.P.; Petersen, S.D.; Siedler, S.; Bonde, M.T.; Gronenberg, L.S.; Kristensen, M.; Harrison, S.J.; Sommer, M.O.A. Functional mining of transporters using synthetic selections. Nat. Chem. Biol. 2016, 12, 1015–1022. [Google Scholar] [CrossRef]
  3. Uchiyama, T.; Miyazaki, K. Substrate-induced gene expression screening: A method for high-throughput screening of metagenome libraries. In Metagenomics: Methods and Protocols; Streit, W.R., Daniel, R., Eds.; Humana Press: Totowa, NJ, USA, 2010; pp. 153–168. [Google Scholar] [CrossRef]
  4. Woolfson, D.N. A brief history of de novo protein design: Minimal, rational, and computational. J. Mol. Biol. 2021, 433, 167160. [Google Scholar] [CrossRef]
  5. Yang, K.K.; Wu, Z.; Arnold, F.H. Machine learning-guided directed evolution for protein engineering. Nat. Methods 2019, 16, 687–694. [Google Scholar] [CrossRef]
  6. Amrein, B.A.; Steffen-Munsberg, F.; Szeler, I.; Purg, M.; Kulkarni, Y.; Kamerlin, S.C. CADEE: Computer-aided directed evolution of enzymes. IUCrJ 2017, 4, 50–64. [Google Scholar] [CrossRef] [PubMed]
  7. Siedhoff, N.E.; Schwaneberg, U.; Davari, M.D. Machine learning-assisted enzyme engineering. Methods Enzymol. 2020, 643, 281–315. [Google Scholar] [CrossRef] [PubMed]
  8. Goodfellow, I.; Pouget-Abadie, J.; Mirza, M.; Xu, B.; Warde-Farley, D.; Ozair, S.; Courville, A.; Bengio, Y. Generative adversarial networks. Commun. ACM 2020, 63, 139–144. [Google Scholar] [CrossRef]
  9. Madani, A.; Krause, B.; Greene, E.R.; Subramanian, S.; Mohr, B.P.; Holton, J.M.; Olmos, J.L.; Xiong, C.; Sun, Z.Z.; Socher, R.; et al. Large language models generate functional protein sequences across diverse families. Nat. Biotechnol. 2023, 41, 1099–1106. [Google Scholar] [CrossRef]
  10. Strokach, A.; Becerra, D.; Corbi-Verge, C.; Perez-Riba, A.; Kim, P.M. Fast and flexible protein design using deep graph neural networks. Cell Syst. 2020, 11, 402–411. [Google Scholar] [CrossRef]
  11. Hawkins-Hooker, A.; Depardieu, F.; Baur, S.; Couairon, G.; Chen, A.; Bikard, D. Generating functional protein variants with variational autoencoders. PLoS Comput. Biol. 2021, 17, e1008736. [Google Scholar] [CrossRef]
  12. Repecka, D.; Jauniskis, V.; Karpus, L.; Rembeza, E.; Rokaitis, I.; Zrimec, J.; Poviloniene, S.; Laurynenas, A.; Viknander, S.; Abuajwa, W.; et al. Expanding functional protein sequence spaces using generative adversarial networks. Nat. Mach. Intell. 2021, 3, 324–333. [Google Scholar] [CrossRef]
  13. Lv, G.Y.; Guo, X.G.; Xie, L.P.; Xie, C.G.; Zhang, X.H.; Yang, Y.; Xiao, L.; Tang, Y.Y.; Pan, X.L.; Guo, A.G.; et al. Molecular characterization, gene evolution, and expression analysis of the fructose-1, 6-bisphosphate aldolase (FBA) gene family in wheat (Triticum aestivum L.). Front. Plant Sci. 2017, 8, 1030. [Google Scholar] [CrossRef]
  14. Iwaki, T.; Wadano, A.; Yokota, A.; Himeno, M. Aldolase—An important enzyme in controlling the ribulose 1,5-bisphosphate regeneration rate in photosynthesis. Plant Cell Physiol. 1991, 32, 1083–1091. [Google Scholar] [CrossRef]
  15. Rutter, W.J.; Hunsley, J.R.; Groves, W.E.; Calder, J.; Rajkumar, T.; Woodfin, B. Fructose diphosphate aldolase. In Methods in Enzymology; Elsevier: Amsterdam, The Netherlands, 1966; Volume 9, pp. 479–498. [Google Scholar]
  16. Mendonca, M.; Moreira, G.M.; Conceicao, F.R.; Hust, M.; Mendonca, K.S.; Moreira, A.N.; Franca, R.C.; da Silva, W.P.; Bhunia, A.K.; Aleixo, J.A. Fructose 1,6-bisphosphate aldolase, a novel immunogenic surface protein on Listeria species. PLoS ONE 2016, 11, e0160544. [Google Scholar] [CrossRef]
  17. Ocampos, D.; Bacila, M. Purification and properties of fructose-1, 6-diphosphate aldolase from beef heart muscle. An. Acad. Bras. Cienc. 1975, 47, 551–556. [Google Scholar] [PubMed]
  18. Daher, R.; Coincon, M.; Fonvielle, M.; Gest, P.M.; Guerin, M.E.; Jackson, M.; Sygusch, J.; Therisod, M. Rational design, synthesis, and evaluation of new selective inhibitors of microbial class II (zinc dependent) fructose bis-phosphate aldolases. J. Med. Chem. 2010, 53, 7836–7842. [Google Scholar] [CrossRef] [PubMed]
  19. Van der Maaten, L.; Hinton, G. Visualizing data using t-SNE. J. Mach. Learn. Res. 2008, 9, 2579–2605. [Google Scholar]
  20. Hebditch, M.; Carballo-Amador, M.A.; Charonis, S.; Curtis, R.; Warwicker, J. Protein–sol: A web tool for predicting protein solubility from sequence. Bioinformatics 2017, 33, 3098–3100. [Google Scholar] [CrossRef]
  21. Plater, A.R.; Berry, A.; Zgiby, S.M.; Thomson, G.J. Conserved residues in the mechanism of the E. coli class II FBP-aldolase. J. Mol. Biol. 1999, 285, 843–855. [Google Scholar] [CrossRef]
  22. Wehmeier, U.F. Molecular cloning, nucleotide sequence and structural analysis of the Streptomyces galbus DSM40480 fda gene: The S. galbus fructose-1,6-bisphosphate aldolase is a member of the class II aldolase. FEMS Microbiol. Lett. 2001, 197, 53–58. [Google Scholar] [CrossRef]
  23. Rukseree, K.; Thammarongtham, C.; Palittapongarnpim, P. One-step purification and characterization of a fully active histidine-tagged class II fructose-1,6-bisphosphate aldolase from Mycobacterium tuberculosis. Enzym. Microb. Technol. 2008, 43, 500–506. [Google Scholar] [CrossRef]
  24. Baldwin, S.A.; Perham, R.N.; Stribling, D. Purification and characterization of the class II d-fructose 1,6-bisphosphate aldolase from Escherichia coli (crookes’ strain). Biochem. J. 1978, 169, 633–641. [Google Scholar] [CrossRef]
  25. Berry, A.; Marshall, K.E. Identification of zinc-binding ligands in the class II fructose-l, 6-bisphosphate aldolase of Escherichia coli. FEBS 1993, 318, 11–16. [Google Scholar] [CrossRef]
  26. Wang, X.; Zhang, X.; Peng, C.; Shi, Y.; Li, H.; Xu, Z.; Zhu, W. D3DistalMutation: A database to explore the effect of distal mutations on enzyme activity. J. Chem. Inf. Model. 2021, 61, 2499–2508. [Google Scholar] [CrossRef] [PubMed]
  27. Miyato, T.; Koyama, M. cGANs with projection discriminator. arXiv 2018, arXiv:1802.05637. [Google Scholar] [CrossRef]
  28. Anand, N.; Eguchi, R.; Mathews, I.I.; Perez, C.P.; Derry, A.; Altman, R.B.; Huang, P.S. Protein sequence design with a learned potential. Nat. Commun. 2022, 13, 746. [Google Scholar] [CrossRef] [PubMed]
  29. Consortium, U. UniProt: A hub for protein information. Nucleic Acids Res. 2015, 43, D204–D212. [Google Scholar] [CrossRef]
  30. Steinegger, M.; Söding, J. MMseqs2 enables sensitive protein sequence searching for the analysis of massive data sets. Nat. Biotechnol. 2017, 35, 1026–1028. [Google Scholar] [CrossRef]
  31. Vaswani, A.; Shazeer, N.; Parmar, N.; Uszkoreit, J.; Jones, L.; Gomez, A.N.; Kaiser, Ł.; Polosukhin, I. Attention is all you need. In Proceedings of the 31st Annual Conference on Neural Information Processing Systems (NIPS), Long Beach, CA, USA, 4–9 December 2017. [Google Scholar]
  32. Zhang, H.; Goodfellow, I.; Metaxas, D.; Odena, A. Self-attention generative adversarial networks. In Proceedings of the International Conference on Machine Learning, Long Beach, CA, USA, 9–15 June 2019; pp. 7354–7363. [Google Scholar]
  33. He, K.; Zhang, X.; Ren, S.; Sun, J. Deep residual learning for image recognition. In Proceedings of the IEEE Conference on Computer Vision and Pattern Recognition, Las Vegas, NV, USA, 27–30 June 2016; pp. 770–778. [Google Scholar]
  34. Miyato, T.; Kataoka, T.; Koyama, M.; Yoshida, Y. Spectral normalization for generative adversarial networks. arXiv 2018, arXiv:1802.05957. [Google Scholar]
  35. Mescheder, L.; Geiger, A.; Nowozin, S. Which training methods for GANs do actually converge? In Proceedings of the International Conference on Machine Learning, Stockholm, Sweden, 10–15 July 2018; pp. 3481–3490. [Google Scholar]
  36. Jang, E.; Gu, S.; Poole, B. Categorical reparameterization with gumbel-softmax. arXiv 2016, arXiv:1611.01144. [Google Scholar]
  37. Altschul, S.F.; Gish, W.; Miller, W.; Myers, E.W.; Lipman, D.J. Basic local alignment search tool. J. Mol. Biol. 1990, 215, 403–410. [Google Scholar] [CrossRef] [PubMed]
  38. Sievers, F.; Higgins, D.G. Clustal Omega, accurate alignment of very large numbers of sequences. Mult. Seq. Alignment Methods 2014, 1079, 105–116. [Google Scholar] [CrossRef]
  39. Xia, J.; Xin, W.; Wang, F.; Xie, W.; Liu, Y.; Xu, J. Cloning and characterization of fructose-1,6-bisphosphate aldolase from Euphausia superba. Int. J. Mol. Sci. 2022, 23, 10478. [Google Scholar] [CrossRef] [PubMed]
Figure 1. Workflow of de novo protein design and validation. (a) Train the ProteinGAN model on an enzyme dataset, generate an equal number of sequences as the natural ones, and validate further. (b) Evaluate the generated sequences using four computational methods and then filter them using a sequence selection strategy. (c) Synthesize, clone, express, and purify the selected sequences, followed by enzyme activity validation.
Catalysts 13 01457 g001
Figure 2. Evaluation of FBA training process and generated sequences. (a) The identity of generated sequences to training and validation sequences was monitored during the training process. A regression fit using a weighted sum of linear and exponential terms was applied, depicted by solid lines. (b) Interpolation results were obtained through correlating the latent space vectors with protein properties calculated through the interpolation of each variable dimension. (c) Amino acids were grouped based on physicochemical properties and box plots of the percentage amino acid composition of the output and natural sequences were plotted. This analysis provides insight into the differential distribution of amino acid composition between the generated and natural sequences. (d) A sequence logo was created to illustrate the key conserved positions within the multiple sequence alignment. This visualization helped identify important residues or motifs that were preserved in the generated sequences, indicating their potential functional significance. (e) Shannon entropies were calculated to estimate the sequence variability for both the generated and training sequences, based on the multiple sequence alignment. This analysis provided insights into the diversity and conservation of amino acids at different positions within the sequences. (f) Evaluating the sequence diversity between the sequences we generated and the FBA training dataset. (g) A tSNE visualization was performed to visualize the natural and generated FBA sequences. The dot sizes represented the cluster size based on 80% identity for each representative sequence. This analysis provided a visual representation of the distribution and clustering of the generated sequences compared to the natural FBA sequences.
Catalysts 13 01457 g002
Figure 3. Purification and activity verification of soluble generated FBAs. (a) A schematic diagram of the FBA expression vector. (b) SDS-PAGE results of the purified soluble FBAs. The protein in each lane was diluted to a concentration in the range of the BSA standards of 0.03–0.5 mg/mL, and 8 µL of each sample was loaded for analysis. Lane M, protein molecular mass marker; lane 1, FBA−WT; lane 2, FBA−17; lane 3, FBA−6; lane 4, FBA−1; lane 5, FBA−29. (c) FBA activity measured via fluorescently monitoring NADH consumption (Methods). Bovine serum albumin (BSA) was used as a negative control, while FBA−WT was used as a positive control. (d) Another set of SDS-PAGE results of purified soluble FBAs. Lane M, protein molecular mass marker; lane 1, FBA−WT; lane 2, FBA−21; lane 3, FBA−23; lane 4, FBA−25; lane 5, FBA−26. (e) The activity data of the FBAs obtained via optimizing the sequence selection strategy. BSA was used as a negative control, while FBA−WT was used as a positive control.
Catalysts 13 01457 g003
Table 1. Expression and purification of soluble generated FBA sequences.
IDTotal Protein a (mg)Yield b (mg/L)Purity c (%)
FBA−WT2.7627.6391
FBA−111.29112.9195
FBA−67.3273.1693
FBA−171.8918.8786
FBA−213.6836.8189
FBA−231.2312.3587
FBA−252.3323.3585
FBA−263.1031.0286
FBA−290.484.7888
a Total protein is the total amount of target protein obtained after purification. b Yield of target proteins after Ni-NTA purification is measured as the amount obtained per liter of culture. c Purity is calculated as the mass ratio of the target protein to total protein in the purified solution, estimated using densitometry analysis software ImageJ (Version 1.8.0).
Disclaimer/Publisher’s Note: The statements, opinions and data contained in all publications are solely those of the individual author(s) and contributor(s) and not of MDPI and/or the editor(s). MDPI and/or the editor(s) disclaim responsibility for any injury to people or property resulting from any ideas, methods, instructions or products referred to in the content.

