Article

Activated Bentonite Nanocomposite for the Synthesis of Solketal from Glycerol in the Liquid Phase

by
Federico M. Perez
1,2,
Celeste Legarto
3,
María B. Lombardi
3,
Gerardo F. Santori
1,2,
Francisco Pompeo
1,2 and
Nora N. Nichio
1,2,*
1
Centro de Investigación y Desarrollo en Ciencias Aplicadas (CINDECA), Facultad de Ciencias Exactas, Universidad Nacional de La Plata (UNLP)—CONICET, Calle 47, 257, La Plata 1900, Argentina
2
Facultad de Ingeniería, Universidad Nacional de La Plata (UNLP), Calle 1 esq. 47, La Plata 1900, Argentina
3
CETMIC (UNLP-CIC-CONICET), Camino Parque Centenario 2499-2599, Gonnet, Buenos Aires 1897, Argentina
*
Author to whom correspondence should be addressed.
Catalysts 2022, 12(6), 673; https://doi.org/10.3390/catal12060673
Submission received: 20 May 2022 / Revised: 11 June 2022 / Accepted: 15 June 2022 / Published: 20 June 2022
(This article belongs to the Special Issue Catalytic Processes in Biofuel Production and Biomass Valorization)

Abstract

:
Activated bentonites are low-cost acid catalysts used in several reactions. However, their application at an industrial scale is affected by the formation of colloidal suspensions when these bentonites are in aqueous solutions. In order to overcome these limitations, this work proposes obtaining a catalyst based on a composite containing natural bentonite within a silica–resin structure, which allows separating and re-utilizing the catalyst more easily and without centrifugal filtration requirements. By means of characterization techniques, the present study determined that the activated bentonite composite presented a total specific surface area of ~360 m2 g−1, ~4 mmol of acid sites per gram of bentonite, and sites with strong acid strength, all of which bestowed activity and selectivity in the solketal synthesis reaction from glycerol and acetone, reaching equilibrium conversion within a short reaction time. Furthermore, the present work developed a Langmuir–Hinshelwood–Hougen–Watson kinetic model, achieving an activation energy of 50.3 ± 3.6 kJ mol−1 and a pre-exponential factor of 6.4 × 10⁶ mol g−1 L−1 s−1, which are necessary for reactor design.

Graphical Abstract

1. Introduction

In the transesterification process of biodiesel production, glycerol is formed as a byproduct with a mass yield of 10 wt% [1]. For the purpose of increasing the biodiesel production value chain and considering its reactivity, glycerol can be transformed into diverse chemical compounds of industrial interest [2,3,4,5,6,7,8]. In particular, the reaction between glycerol and acetone leads to the formation of 2,2-dimethyl-1,3-dioxolane-4-yl methanol, known as solketal, a novel compound with interesting applications. Furthermore, 2,2-dimethyl-1,3-dioxan-5-ol and water are also obtained as byproducts of this reaction (Scheme 1) [9,10].
Oliveira et al. reported that solketal improves the octane number and prevents the formation of gum as a fuel additive. They employed up to 5% v/v of solketal in gasoline and studied the effect of adding ethanol [11]. As a biodiesel additive, solketal improves viscosity in cold surroundings and enhances its stability against oxidation [12,13]. Furthermore, solketal can be employed as a “green solvent” in different applications, e.g., paints, refrigerants, cleaning, and pharmaceutical products [14].
The ketalization reaction of glycerol with acetone presents some difficulties. Firstly, its low equilibrium constant and the formation of water during the reaction limit the maximum glycerol conversion. Secondly, the immiscibility of the reactants can lead to mass transport limitations. Esteban et al. reported that, as the reaction progresses, the solketal produced acts as a cosolvent improving the solubility of glycerol in the acetone phase. Thus, an excess of acetone is often used as a solubility enhancer and as a means to shift the chemical equilibrium toward the formation of solketal [15].
The synthesis of solketal requires the presence of Brønsted or Lewis acid sites, and both homogeneous and heterogeneous catalysts are employed. Among the former, sulfuric, p-toluene sulfonic, and hydrochloric acids are the most widely used. However, the use of these catalysts presents several environmental issues and, for this reason, heterogeneous catalysts have been employed in recent years. Several solids can be mentioned, such as exchange resins [16], zeolites [17], modified activated carbon [18,19], silica-included heteropolyacids [20], and modified clays [21].
The reaction mechanism proposed by several authors starts with the acid activation of the carbonyl group, leading almost instantly to a positive pole in the middle carbon of the acetone molecule [22]. Then, this atom is attacked by the primary alcohol group of glycerol, bringing about the formation of hemiacetal [23]. Then, the water remotion leads to the formation of a short-lived carbocation that closes into the five- or six-membered ring, depending on which alcohol group attacked the positively charged atom (Scheme 2). However, six-membered ring formation is less favorable than five-membered ring formation, as demonstrated by Ozorio et al., who performed DFT theoretical calculations of the relative stability of these isomers, showing that solketal is thermodynamically more stable than its isomer due to the steric repulsion associated with the presence of the methyl group in an axial position of the six-membered ring [12].
Among the solids mentioned above, modified clays represent interesting materials due to their availability, low cost, versatility, and environmental compatibility. Argentina has one of the most important deposits of bentonite in Latin America, being one of the main producers and exporters around the world.
Bentonite is a natural clay composed of smectite as the main clay mineral (mainly montmorillonite). The smectite structure consists of laminar layers with negative net charge; hence, in the interlaminar space, cations are balancing the charges, such as Na+ and Ca2+. The acid properties of these materials have two sources. On the one hand, interlayer cations have a polarizing effect on the water molecules, constituting acid sites. On the other hand, specific sites on the layer edges can be compensated with the formation of OH groups, such as Si–OH, representing Brønsted acid sites. Furthermore, Al3+ ions from the structure of the smectites act as Lewis acid sites [24]. However, there exist different treatments that can be implemented with the aim of enhancing the acid properties of smectites. One of them is activation with inorganic acids, provoking the replacement of exchangeable cations with protons and the protonation of the sites on the smectite layer edges [25,26].
Although activated bentonites have already been used as acid catalysts in a wide variety of reactions, such as esterification [27], cracking [28], hydrolysis [29], and pyrolysis [30], these materials form colloidal suspensions in water or in aqueous solutions, which makes their separation and recovery difficult and prevents their implementation on an industrial scale. This work proposes obtaining a catalyst based on a composite containing natural bentonite with all its properties within a silica–resin structure, thus allowing its application not only at a laboratory scale, due to the possibility of separating and reusing the catalyst. Such a catalyst has not been reported yet. This work also analyzes the structural and acidic properties of this composite bentonite, as well as its catalytic yield in the synthesis of solketal from glycerol and acetone, and proposes a kinetic model necessary for reactor design.

2. Results and Discussion

2.1. Characterization

Figure 1 shows the SEM images of natural bentonite (B), the bentonite nanocomposite (CB), and the activated bentonite nanocomposite (CBA). As can be observed, natural bentonite B (Figure 1a) consists of particles that seem to be formed by several flaky particles stacked together in the form of agglomerates [31]. On the other hand, solid CB (Figure 1b) has smaller particles than B, and they seem to have a sponge-type structure, indicating that the condensation process took place [32]. Finally, the acid treatment generated the disaggregation and decrease in size of the particles, as can be observed in Figure 1c (solid CBA).
Table 1 shows the composition of solids B, CB, and CBA determined by EDS analysis. As observed, the Si content was higher in solids CB and CBA due to the incorporation of TEOS. However, in solid CBA (treated with nitric acid) the sodium content decreased, indicating that the Na+ ions were replaced by the protons from the acid solution.
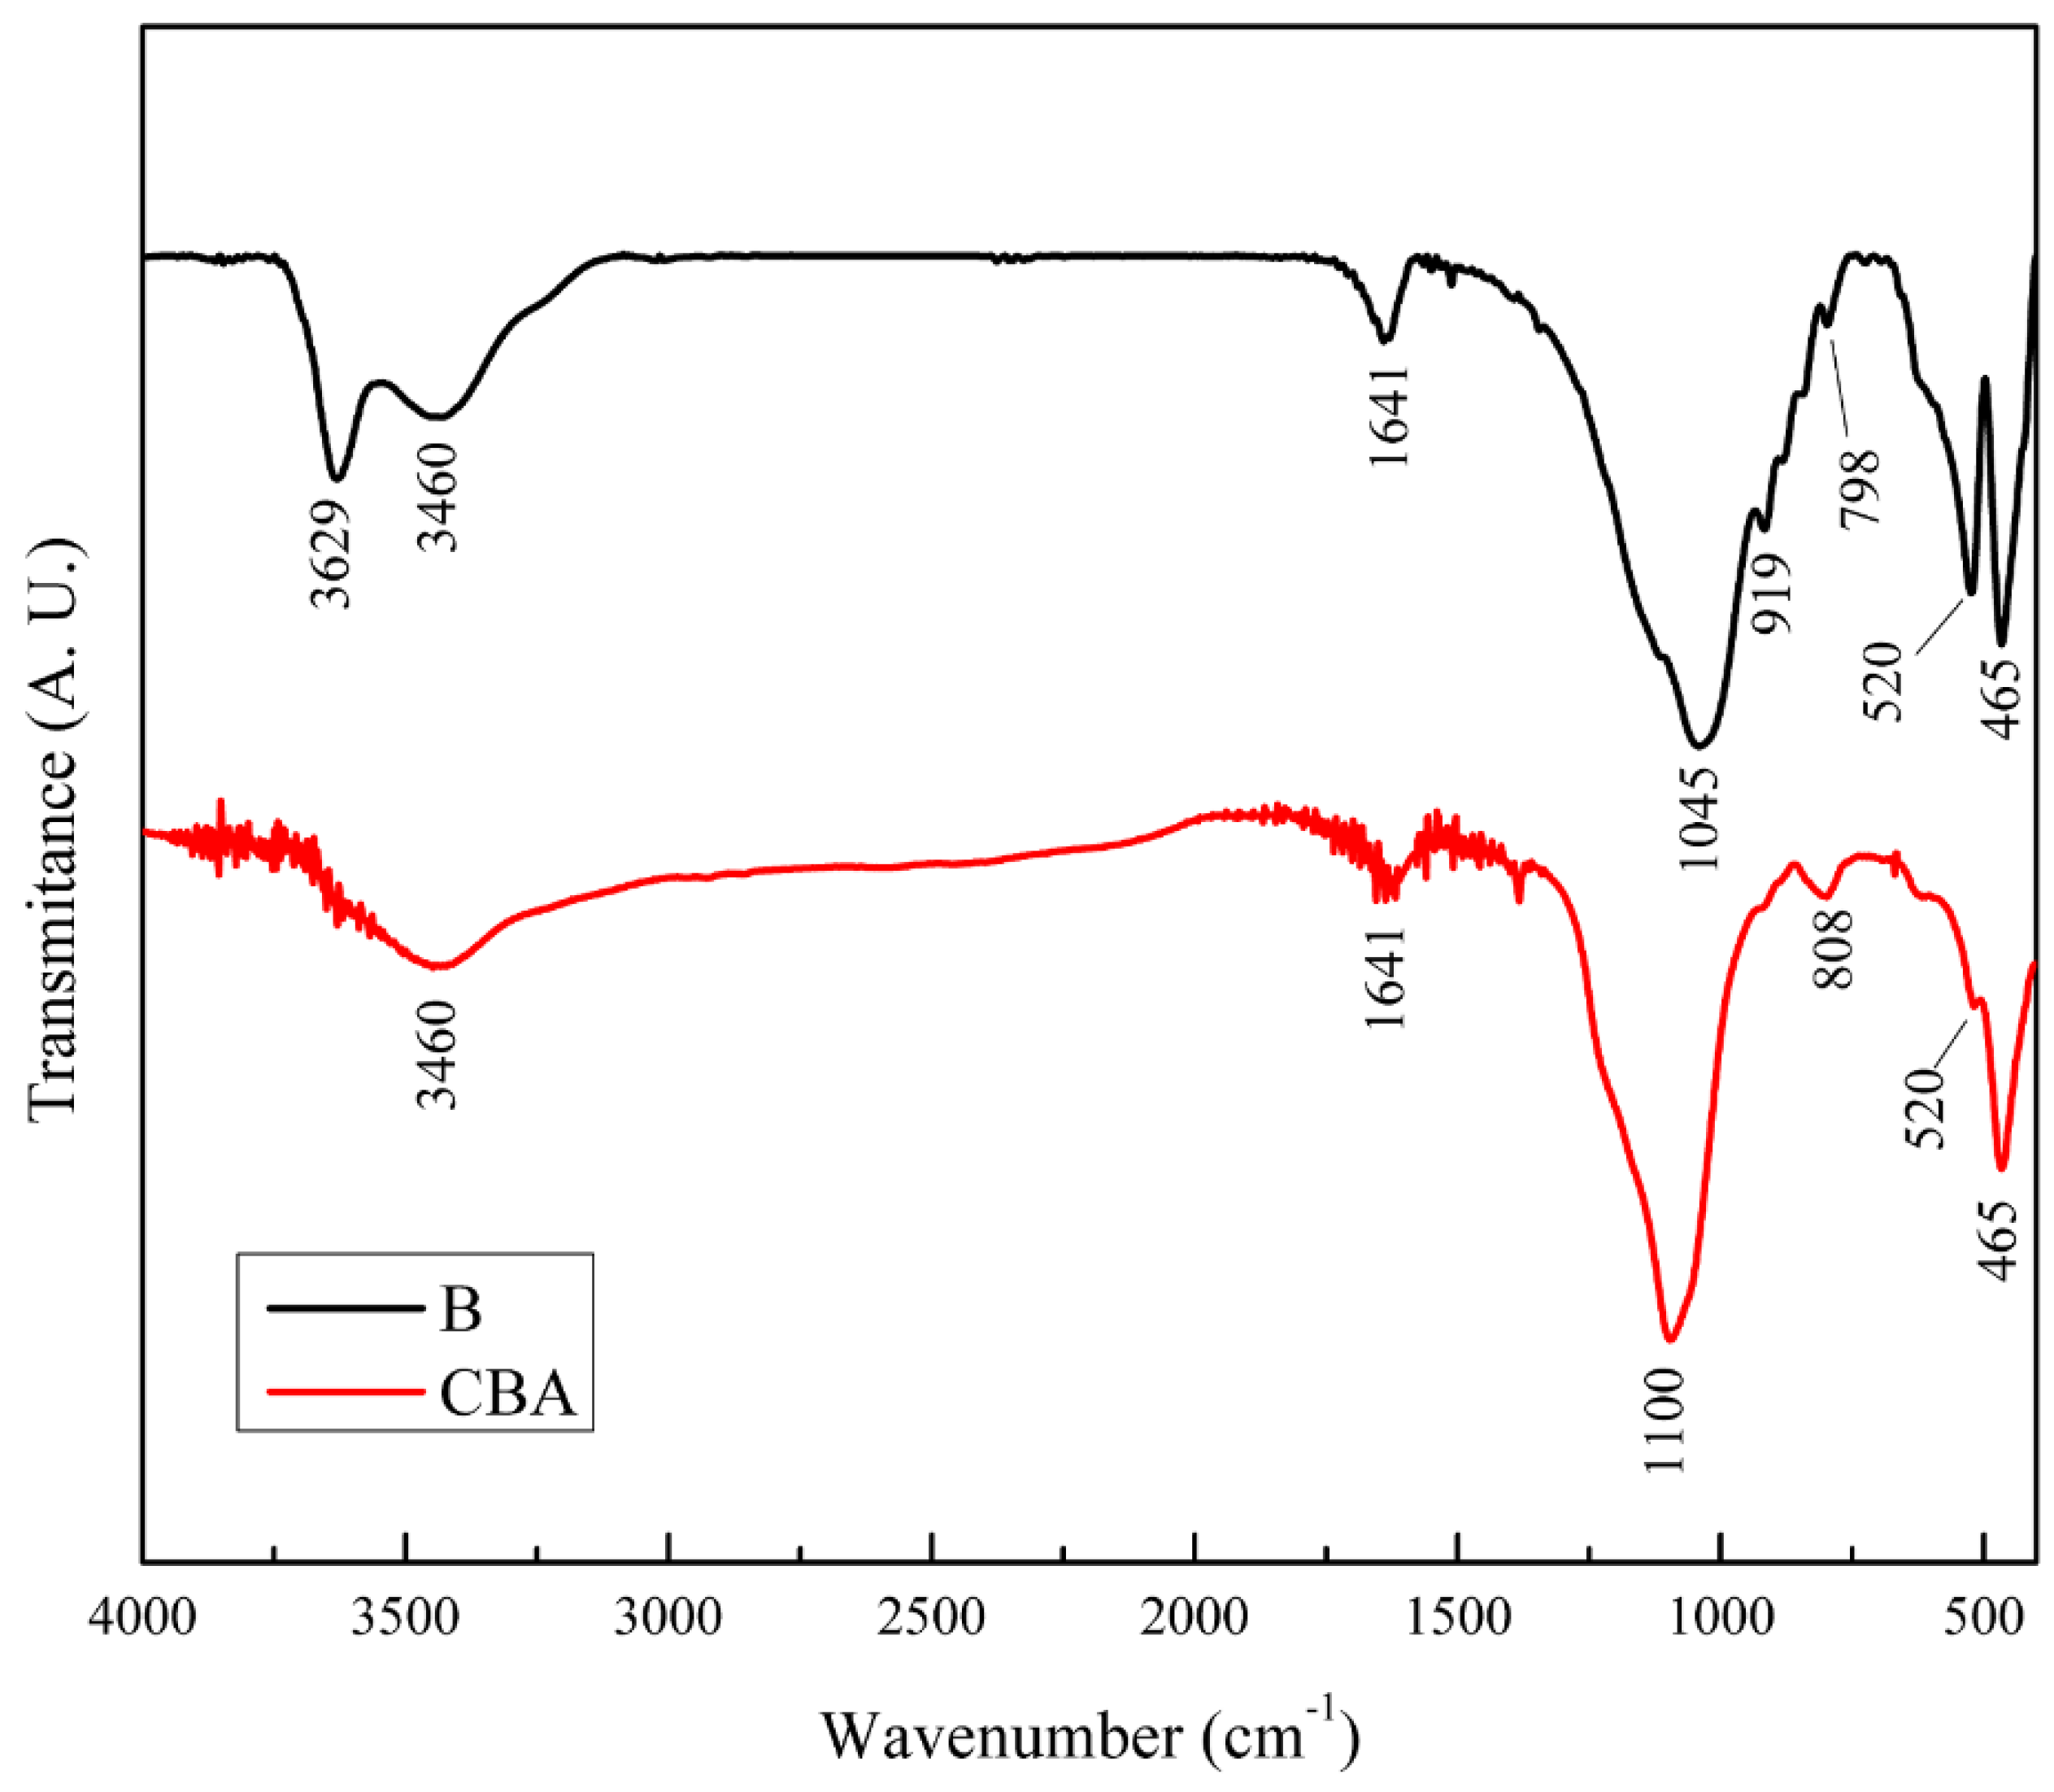
Figure 2 shows the infrared spectra of solids CBA and B. The spectra of both solids presented signals at 465 and 520 cm−1, which corresponded to the Si–O vibrations in the tetrahedral layer. In addition, the signal observed at 798 cm−1 in solid B was related to the Si–O vibration, which is characteristic of quartz, and the signals at 919 cm−1 and 3629 cm−1 were attributed to Al–OH vibrations in the octahedral layers of the bentonite [33]. The bands observed at 1641 and 3460 cm−1 were attributed to the H–OH vibrations of the water adsorbed on the interlayer structure and were observed in both solids [34].
On the other hand, solid CB presented two bands at 808 and 1100 cm−1, which could be attributed to the Si–O–Si unions from the condensation of TEOS [33]. As can be observed, the acid treatment did not generate important changes in the solid structure.
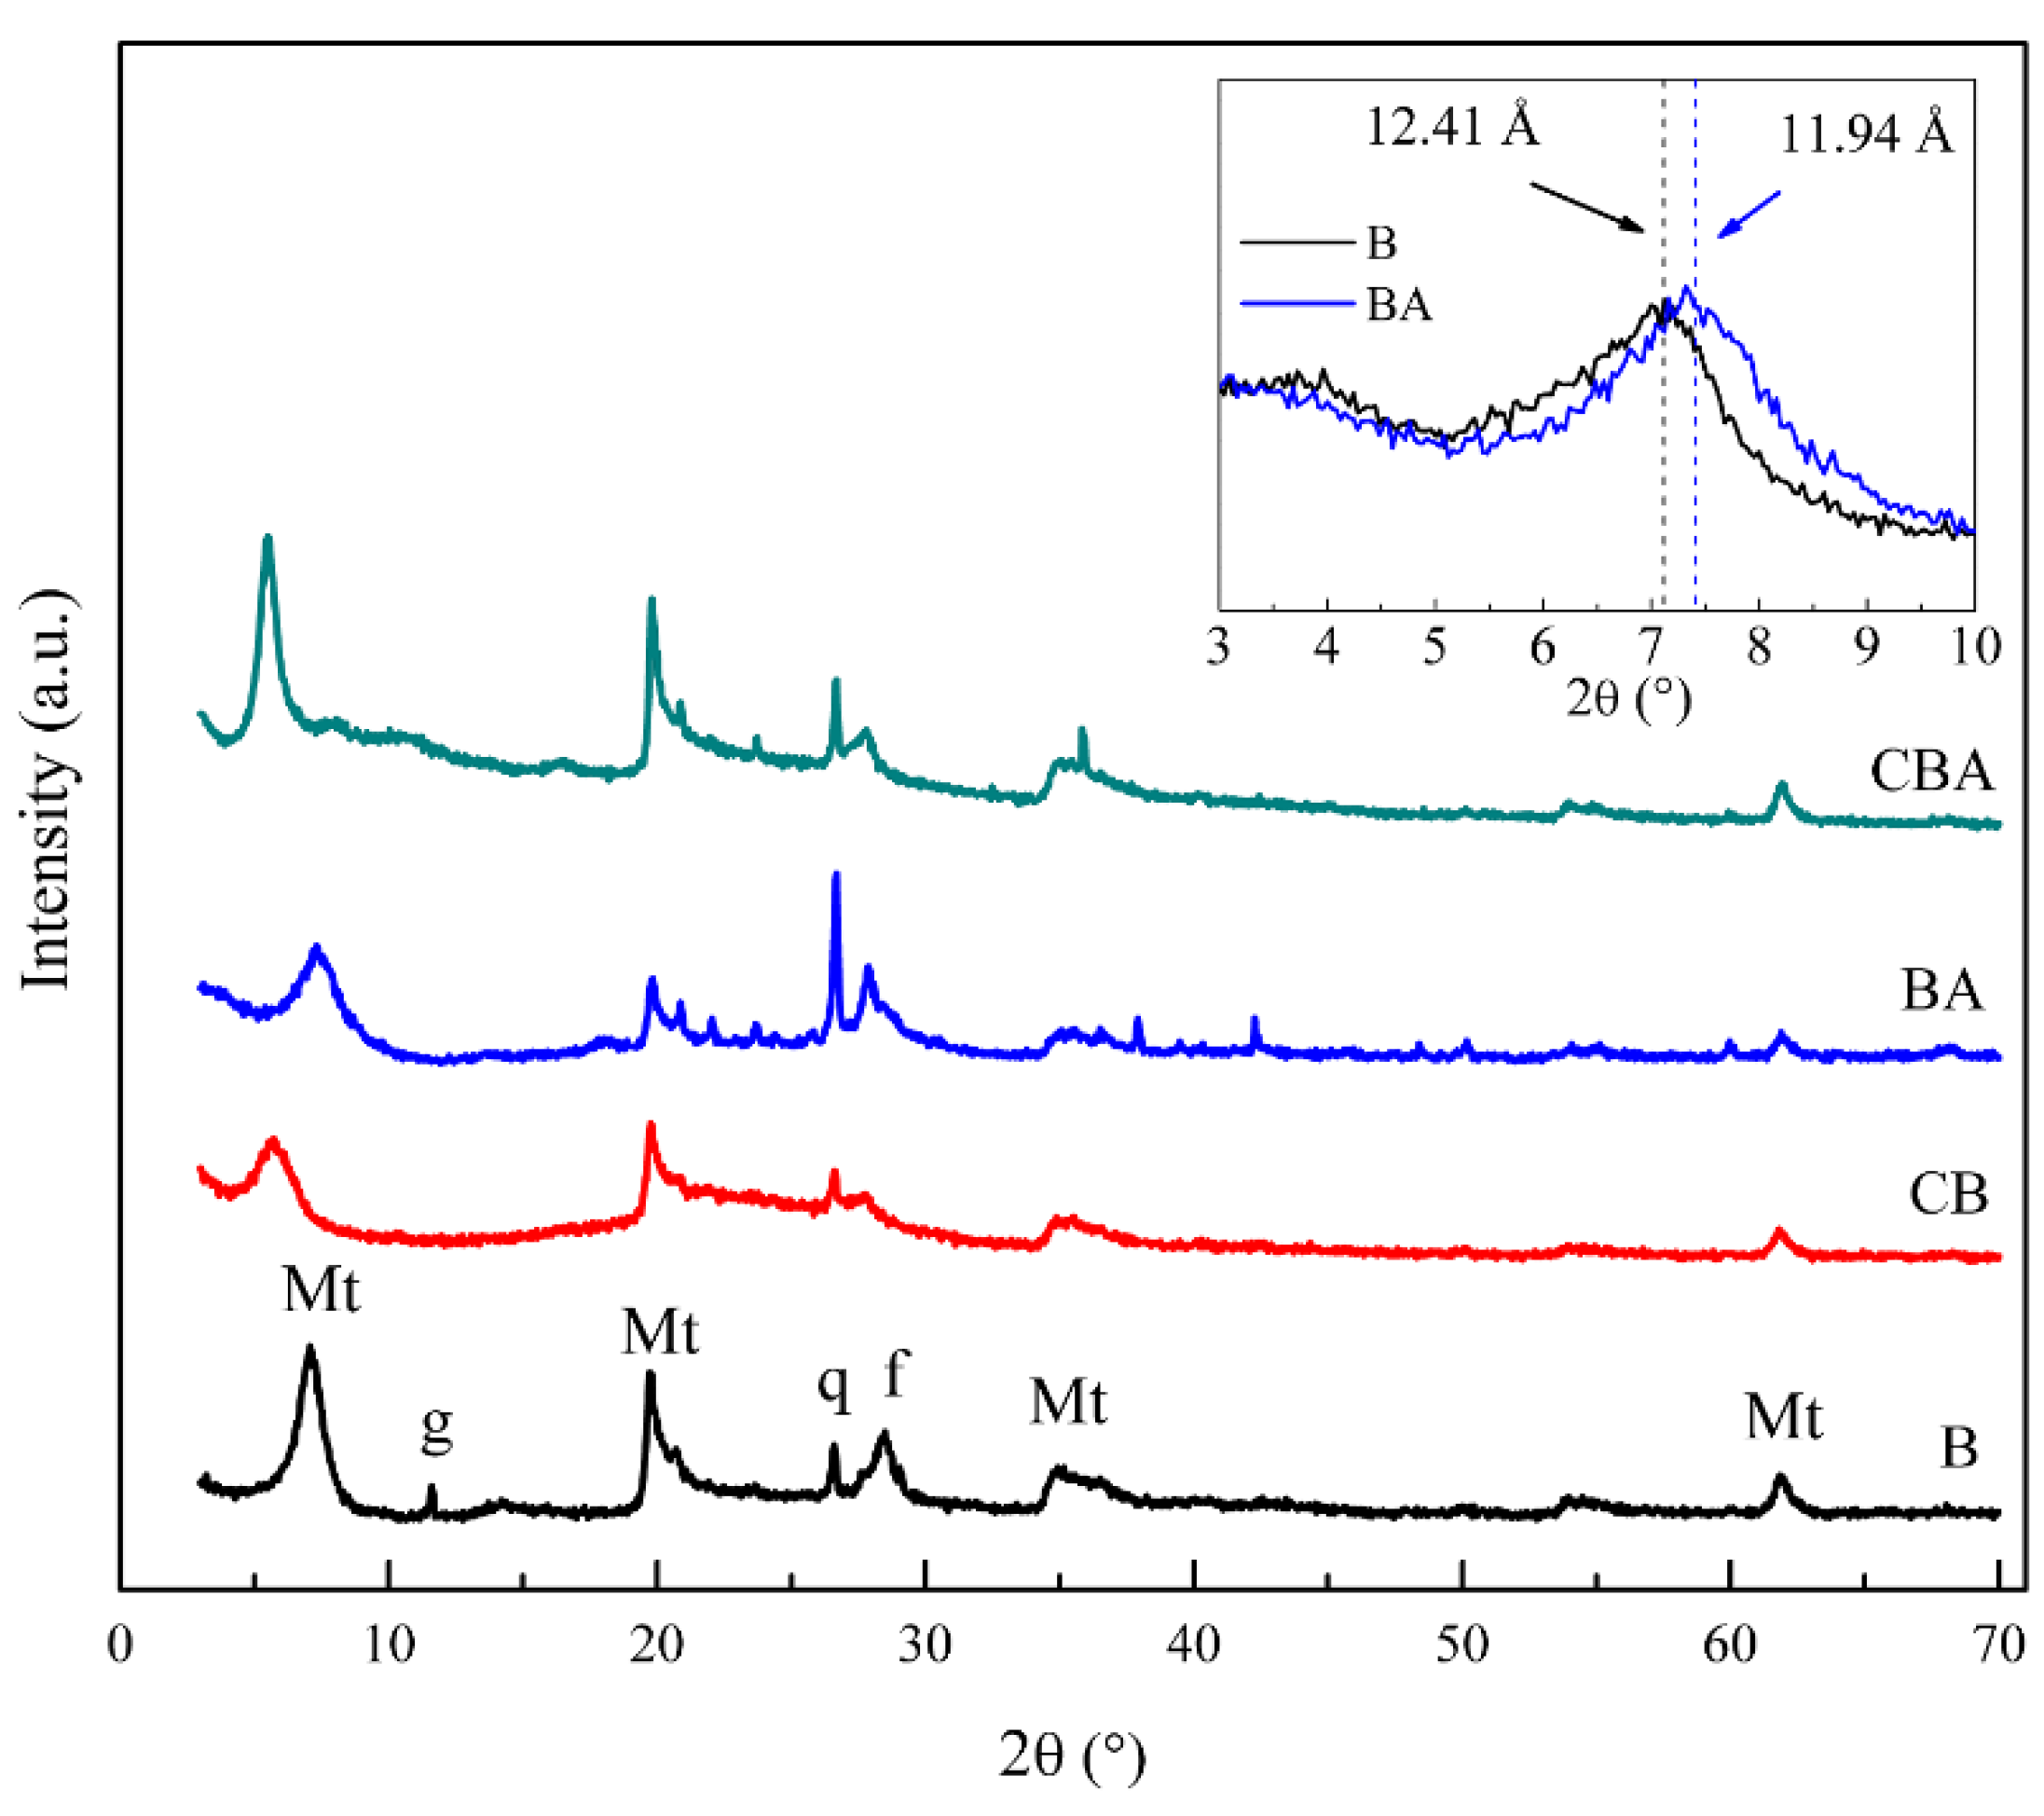
The X-ray diffraction technique was used to study the structure of the bentonite in the composite and to evaluate the effect of acidification on the bentonite’s structure.
The diffraction patterns of natural bentonite B (Figure 3) were analyzed and compared with the shown reflections of montmorillonite and the accompanying minerals, such as quartz, at positions 2θ = 20.8° and 2θ = 26.8° (PDF card No. 00-046-1045), gypsum at 2θ = 11.0° (PDF card No. 00-021-0816), and feldspar at 2θ = 28.8° (PDF card No. 00-020-0548). The rest of the peaks assigned to montmorillonite corresponded to PDF card No. 00-029-1498, and the reflection d001 at position 2θ = 7.1° was characteristic of dry montmorillonite [35].
The diffractogram of bentonite composite CB (Figure 3) shows that the d001 peak shifted to lower angles, from 2θ = 7.1° to 2θ = 5.6°, indicating the expansion of the interlaminar space from 12.41 to 15.8 Å, respectively. There were numerous sol-gel reactions involved in the formation of the hybrid composite, such as the complete hydrolysis of tetraethyl orthosilicate (TEOS) and the condensation of the hydroxyl groups (–OH) in the organic and inorganic precursors with the hydroxyl groups (–OH) of montmorillonite layer edges. This generated a continuous network and, as it grew, it probably penetrated the interlayer and expanded the basal space. Then, after the aging and curing stages, the structure remained swollen, pillaring the montmorillonite. It was also observed that the peaks corresponding to the bentonite, such as montmorillonite and other minerals, preserved their structure in the composite, although they overlapped the amorphous silicon band.
As can be observed, the activated bentonite (BA) and the activated bentonite composite (CBA) conserved the peaks of the crystalline structure of the bentonite layers, showing that the acid treatment did not modify the crystalline structure of the bentonite. Additionally, the activation of the B solid produced a shift of the d001 peak at 2θ = 7.1° to 2θ = 7.4° (Figure inserted in Figure 1), whereas this effect could not be observed in the solid CBA due to the expansion of the basal space mentioned above.
The use of nitrogen to calculate the specific surface area only allows the determination of the external specific surface area (ESSA) [36,37], a value that can be around 10% of the total specific surface area (TSSA) [38].
The results obtained are shown in Table 2, employing the BET technique for ESSA and water adsorption for TSSA. It can be observed that the ESSA of solid B was approximately 110 m2 g−1, a value that is in agreement with those reported in the literature [36].
As can be observed in Table 2, the composites CB and CBA presented a remarkably lower TSSA than the bentonites due to the inclusion of the silica–resin structure in the interlaminar spaces of the bentonites, as discussed above in the XRD diffractograms. In addition, the ESSA values of CB and CBA were similar, which is in agreement with Timofeeva and coworkers, who did not observe any differences in the ESSA when weak conditions were employed for the activation of bentonites [21].
Furthermore, Table 2 shows the results of the potentiometric titration technique. The acid strength of sites can be studied through the potentiometric titration technique with n-butylamine, in which the initial electrode potential (Ei) indicates the maximum acid strength according to the following scale: very strong, Ei > 100 mV; strong, 0 < Ei < 100 mV; weak, −100 < Ei < 0 mV; and very weak, Ei < −100 mV [39]. As observed, the acid treatment of the solids generated an increment in the Ei value from −62.7 mV to ~ 490 mV, indicating the generation of acid sites stronger than those present in solids B and CB. Furthermore, the values of Ei for BA and CBA were similar (~ 490 mV), indicating that the acid strength generated was comparable in both solids.
To study the distribution of these acid sites, the ammonia temperature-programmed desorption (NH3-TPD) and FTIR spectroscopy of pyridine adsorption techniques were used. However, the latter did not produce good results because the signal corresponding to the silica–resin structure overlapped the signal of adsorbed pyridine. 
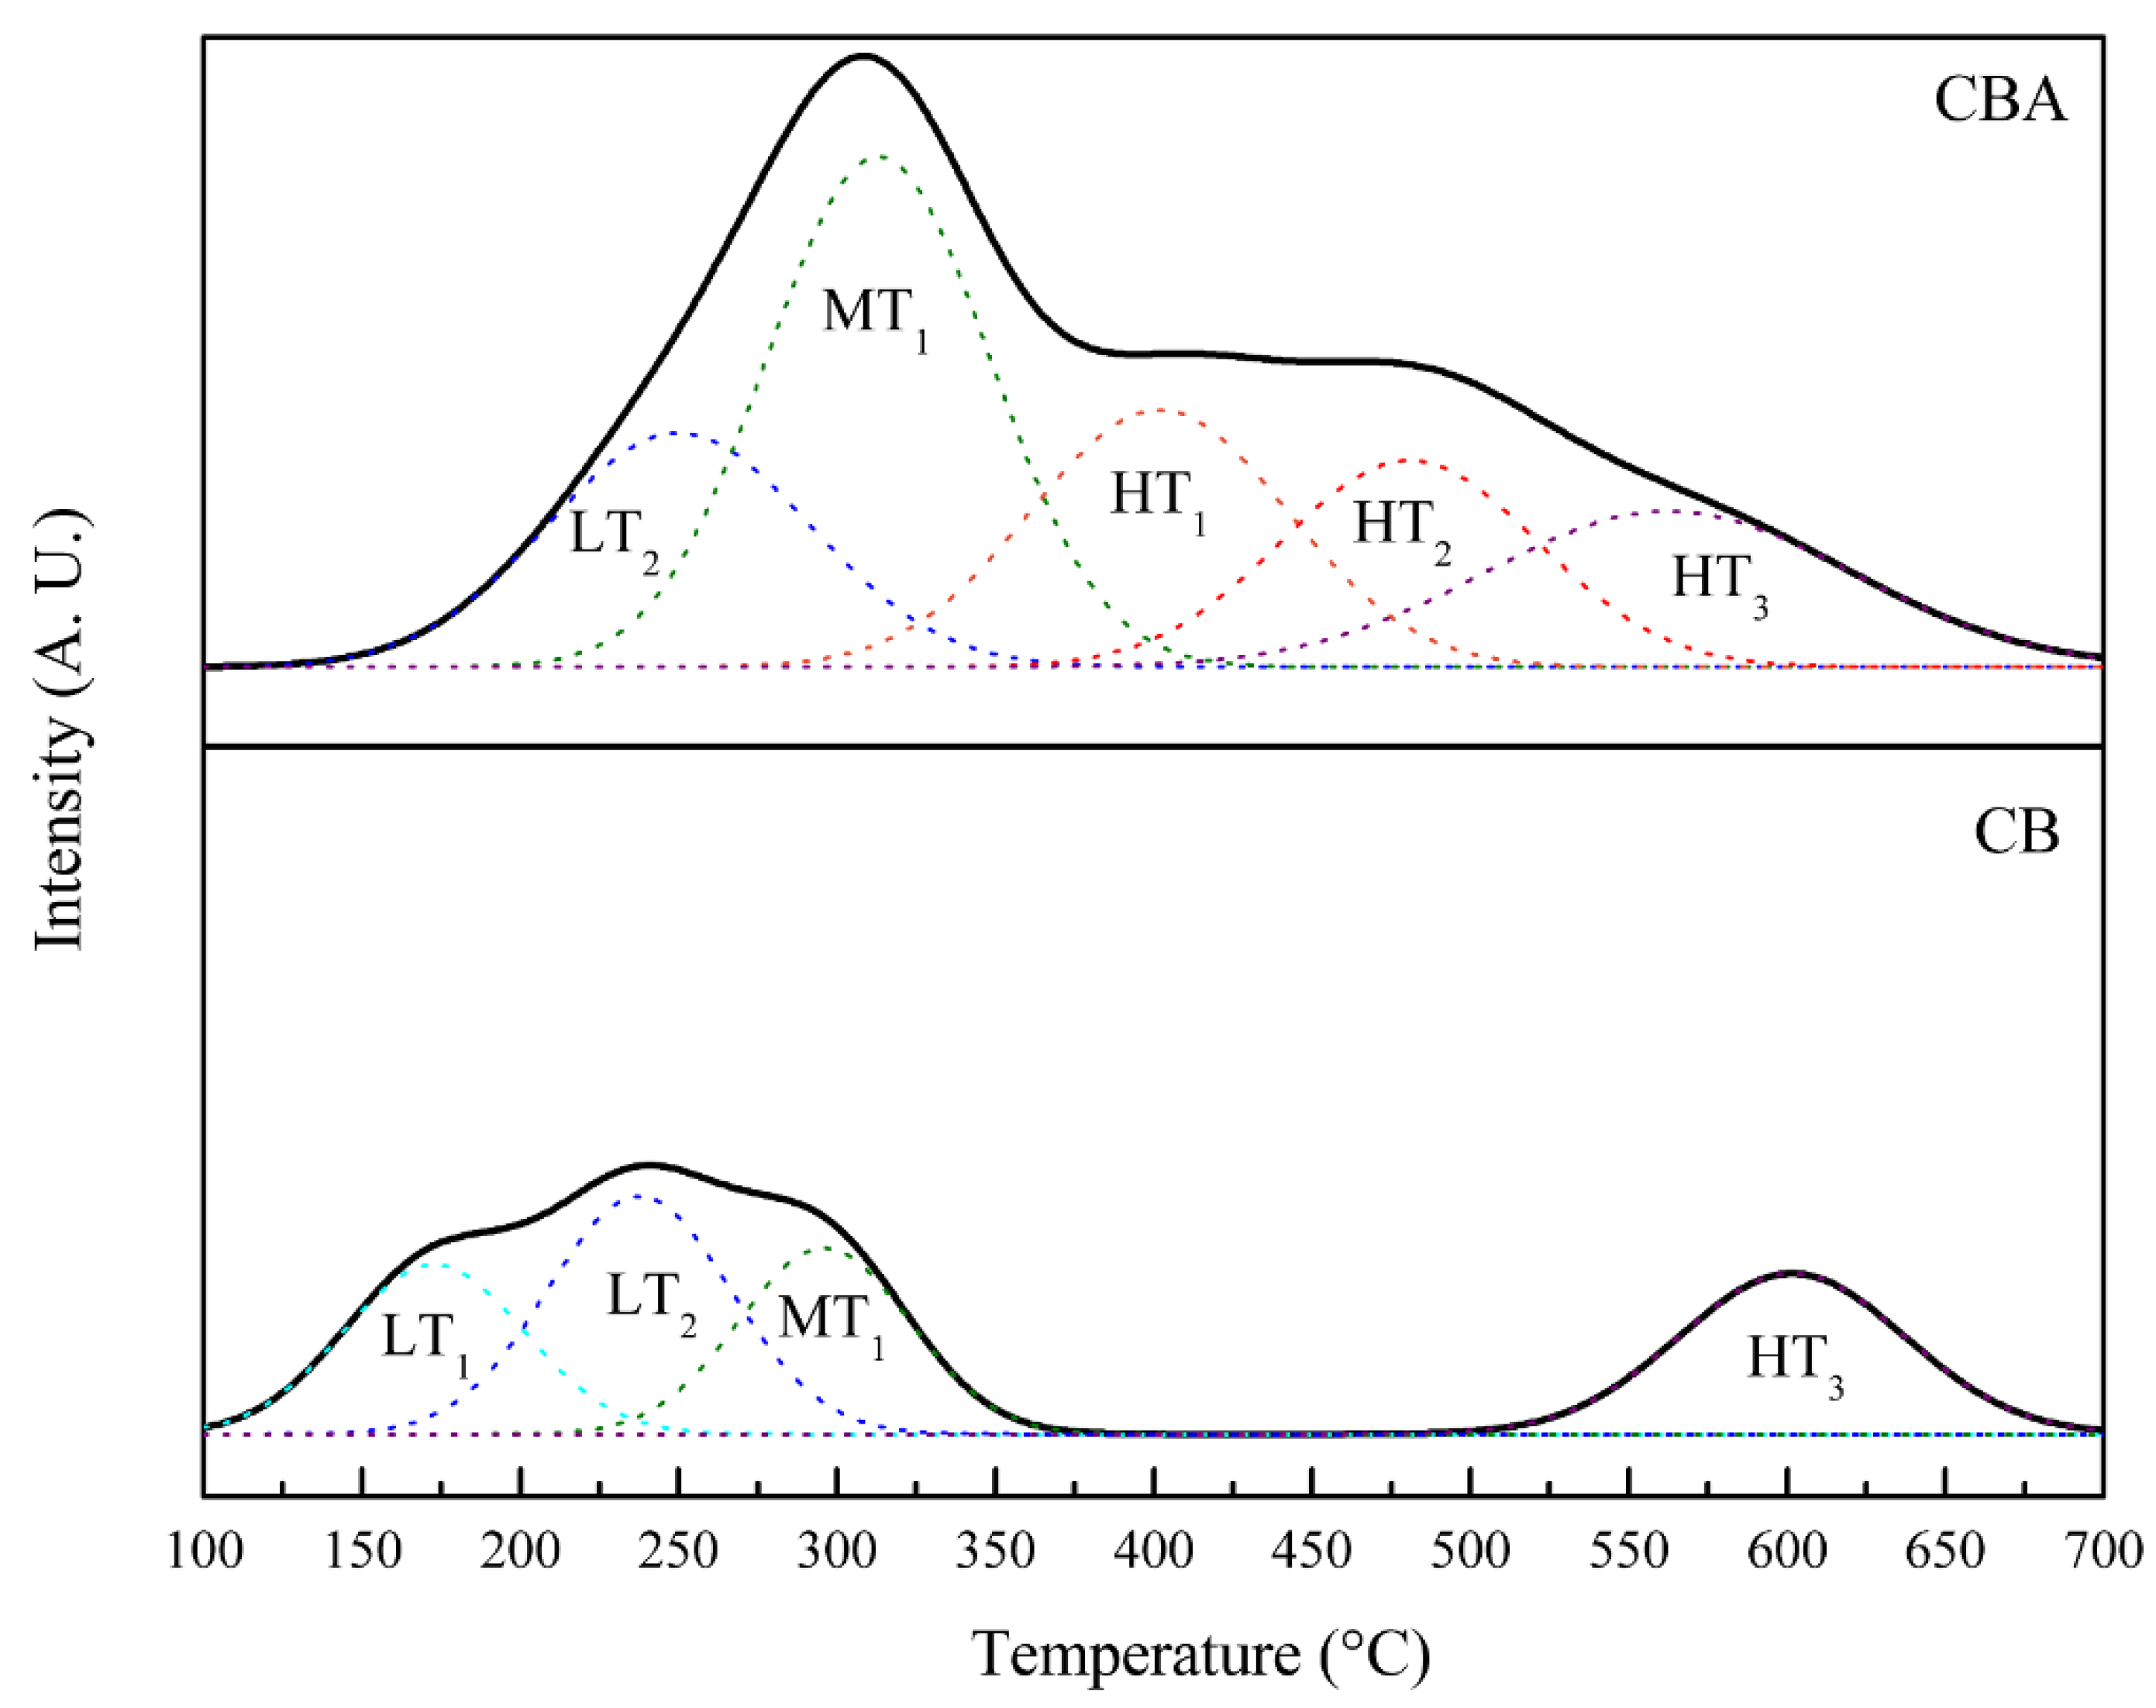
Figure 4 shows the NH3 desorption spectrum and the peak deconvolution. The measurements were carried out between 50 °C and 700 °C, identifying three desorption zones: the first at low temperatures (150–250 °C), identified as LT, which corresponded to weak acid sites, the second at medium temperatures (250–350 °C), identified as MT, which corresponded to medium acid sites, and the third zone at high temperatures (>350 °C), identified as HT, which corresponded to strong acid sites [25]. Signals observed below 150 °C were not considered because NH3 desorbed at such low temperatures corresponds to physisorbed molecules [40].
The CB solid presented two desorption peaks with maximums at 160 °C (denoted as “LT1”) and 240 °C (denoted as “LT2”), which corresponded to acid sites of weak strength that proceeded from Si-OH groups on the surface. Furthermore, it presented a peak with a maximum at 300 °C (denoted as “MT1”), attributed to medium acid sites, which proceeded from the polarized water molecules in the interlayer space. The region at ~600 °C (HT3) could be attributed to the desorption of NH3 from the framework Al sites [41].
On the other hand, the CBA solid conserved the peaks at LT2 and MT1 and presented an increase in the desorption peaks in the region at temperatures higher than 400 °C, attributed to the generation of sites with strong acid strength. This solid presented a desorption peak with a maximum at 400 °C (denoted as “HT1”), which corresponded to acid sites generated by the protonation of Si–OH groups, forming terminal Si–OH2+ species. In addition, it presented a desorption peak with a maximum at 500 °C (denoted as “HT2”) attributed to the presence of protons in the interlaminar space [42] as a result of the acid treatment with HNO3. This result is in agreement with the EDS results, which indicated the reduction in the Na+ content due to the incorporation of protons from the acid solution.
The acid site density, obtained by NH3-TPD, was about 4 mmol per gram of bentonite for solids BA and CBA, and it was corroborated by the neutralization back titration method with NaOH. This result confirmed that the acid sites were generated on the clay and not on the silica–resin structure.

2.2. Catalytic Activity

2.2.1. Temperature Effect

The results shown in Table 3 confirm that solids B and CB did not present catalytic activity, which was expected due to the absence of sufficient acid sites. Furthermore, the catalysts BA and CBA converted the same amount of glycerol per gram of activated bentonite. This confirms that the acidification process did not generate acid sites on the silica–resin structure of the composite, and the bentonite incorporated represented the active phase, which is in agreement with the acid characterization. Therefore, in order to reach conversions similar to bentonites, it is necessary to employ twice as much weight of the composite due to its content of 47 wt% of activated bentonite.
The activity of composite CBA was evaluated at different temperatures, determining the reaction rate at 15 min, and comparing it with the glycerol conversion achieved at 240 min. As can be observed in Table 4, when the reaction was carried out at 40 °C, the reaction rate at 15 min and the glycerol conversion achieved at 240 min were significantly lower than the values obtained at 60, 80, and 100 °C.
If the results of CBA are compared with those of other activated bentonites reported in the literature (commercial and prepared by other authors), it can easily be seen that the activity of CBA is good, as can be observed in Table 5.

2.2.2. Catalytic Stability

The stability results of the CBA solid after 240 min of reaction employing a 0.25 wt% amount of catalyst with respect to glycerol are shown in Figure 3. After the reaction time, the reaction mixture was separated from the catalyst, fresh reactants were introduced into the reactor and the procedure was repeated. As observed in Figure 5, the catalyst preserved its activity at least after three uses at all of the temperatures studied.
Potentiometric titration measurements were performed on the post-reaction samples, employed in reactions at 60, 80, and 100 °C, in order to determine any changes in comparison with fresh catalysts. The results show that the initial potentials Ei of the used samples were approximately the same as those of the fresh ones (~ 480–490 mV), indicating that the strength of the acid sites was not altered after the reaction.

2.2.3. Kinetic Model

Several models for the kinetics of the synthesis of solketal have been proposed in the literature, such as the Pseudo-Homogeneous model (PH) [16,46], the Langmuir–Hinshelwood–Hougen–Watson model (LHHW) [22,23], and the Eley–Rideal model (ER) [47]. The main difference between them is the hypothesis of the adsorption of the reactants to the acid sites of the catalyst. In this work, a LHHW model was considered, involving the steps described in Table 6, as shown in Scheme 2. The first and second steps consisted of the adsorption of acetone and glycerol, respectively, to the acid sites. In the third step, the surface reaction led to hemiacetal formation. In step 4, the carbocation and water were formed, while in step 5, this short-lived carbocation formed solketal. Finally, in steps 6 and 7, solketal and water were desorbed, respectively. As reported by other authors, the reaction to form hemiacetal can be considered as the rate-determining step [22,23,46]. Therefore, in this work, we consider that step 3 (formation of the hemiacetal) is the controlling one.
In Table 6, Ac, Gly, HA, C, Solk, and W stand for acetone, glycerol, hemiacetal, carbocation, solketal, and water, respectively. The * symbol represents an active site of the catalyst, and the * superscript indicates that the compound is adsorbed on the catalyst’s surface.
The steps proposed lead to the general kinetic expression shown in Equation (1).
r = k C Gly · C Ac C Solk · C W K eq ( 1 + i = 1 n K i · C i ) 2
where r stands for the reaction rate and Ci is the molar concentration of compound i. In addition, k stands for the rate constant, Keq is the equilibrium constant, and Ki is the adsorption constant of compound i. The experimental data were adjusted considering the adsorption of different compounds individually in the denominator of Equation (1), but the parameters obtained considering acetone, water, and solketal did not adjust the experimental data, except for glycerol. The results of this study are presented in the Supplementary Information. The expression finally employed is shown in Equation (2).
r = k C Gly · C Ac C Solk · C W K eq ( 1 + K Gly · C Gly ) 2
The parameters of Equation (2) were determined by employing the general reduced gradient (GRG) algorithm for non-linear optimization problems, and Table 7 shows the values obtained. It can be observed that, as expected, the kinetic parameter increased with temperature, while the equilibrium constant was lower. This result agreed with the exothermic behavior of the reaction. Furthermore, the adsorption constant of glycerol slightly decreased by increasing the temperature, as reported by other authors [47].
From the results shown in Table 7, the activation energy value (Ea) was estimated to be 50.3 ± 3.6 kJ.mol−1 and the pre-exponential factor to be 6.4 × 10⁶ mol g−1 L−1 sec−1. These results are within the range of values reported by other authors, as can be observed in Table 8. However, it is well known that this value depends on the type of catalyst employed and temperature range studied. Furthermore, the effect of temperature on the glycerol adsorption constant was negligible due to the narrow range of temperatures studied. This behavior was reported by other authors who studied different acetalization reactions [48,49].
Figure 6 shows the evolution of glycerol conversion with time at 60, 80, and 100 °C, where discrete points correspond to experimental data and the solid line represents the LHHW model obtained. As expected, when the temperature increased, the reaction rate became higher and the equilibrium conversion value decreased since this is an exothermic reaction, as previously stated [51]. It can also be observed that the model implemented and the estimated parameters were able to accurately describe this behavior in terms of both the reaction kinetics and the reaction’s thermodynamic equilibrium.

3. Materials and Methods

3.1. Preparation of an Activated Bentonite Nanocomposite (CBA)

The natural sodic bentonite employed (Bentonita del Lago) was extracted from the Lago Pellegrini deposit in Río Negro Province, Argentina. This material, named B, was used as received without further purification, avoiding the time-consuming processes of the purification and separation of the clay. As demonstrated in previous studies, this bentonite has a high purity level (97.4% of montmorillonite) and its main properties are as follows: a cation exchange capacity (CEC) of 105 meq/100 g, a specific surface area of 110 m2 g−1 and 1187 m2 g−1 (measured by nitrogen and water adsorption–desorption isotherms, respectively), pH = 7.1, and isoelectric point at pH = 3.6 [52].
The composite, named CB, was prepared from the sol-gel precursor mixture of the partially hydrolyzed tetraethyl orthosilicate TEOS (Evonik Industries, Hanau-Wolfgang, Germany) and a phenol-formaldehyde F-919 resin (Foundry Resins S.A, Florida, Buenos Aires, Argentina), mixing 12 mL of TEOS with 6 g of F-919 resin until an emulsion was obtained. Then, 12 mL of commercial ethyl alcohol (96%, purchased by Anedra, Los troncos del Talar, Buenos Aires, Argentina) was gradually added until a translucent amber liquid was obtained, and, finally, 6 mL of distilled water was added. When the gel was formed, bentonite B was added, which was previously thermally treated at 300 °C for 72 h in order to dehydrate the interlayer and thus limit TEOS penetration into the clay during mixing.
The pre-gelled liquids were placed in cylindrical jars and covered; then, they were left for 24 h at room temperature without the evaporation of the solvents (alcohol and water). After that, they were uncovered, allowing the evaporation of the solvents within 24–48 h. When the syneresis process was finished, the samples were ready to be removed from the mold. Once unmolded, they were aged at room temperature for another 24 h. After that, the curing process was carried out by thermal treatment with a heating rate of 0.5 °C min−1 from 25 to 270 °C, maintaining the final temperature for 60 min. Under these conditions, the resin polymerized and solidified, finally yielding the monolithic composite.
The bentonite mass added to the composite during preparation varied between 5 and 25 g, corresponding to 21 and 60% in weight of bentonite in the solid, respectively. Nevertheless, at bentonite contents higher than 47%, no homogeneity could be achieved in the preparation mixture. For this reason, the solid containing 47% bentonite in the composite was selected for activating and obtaining catalyst CBA. For activation, 0.5 M nitric acid (Anedra, Los troncos del Talar, Buenos Aires, Argentina) was mixed in a three-neck round bottom flask with the CB composite at an acid/solid ratio of 25 mL g−1 under stirring for 1 h at 90 °C. Then, the solution was filtered and the solid was washed with distilled water until a neutral pH was reached. Finally, the catalyst denoted as CBA was dried at 120 °C for 24 h.

3.2. Characterization of Materials

The textural properties were determined by the nitrogen adsorption–desorption isotherms at the temperature of liquid nitrogen (−196 °C) in a Micrometrics ASAP 2020 instrument (Micromeritics Instrument Corporation, Norcross, GA, USA). Before adsorption, the samples were evacuated by heating at 100 °C in a vacuum with a pressure lower than 4 Pa for 12 h. The specific surface area was calculated according to the Brunauer–Emmett–Teller (BET) equation in the 0.05−0.35 relative pressure range. The pore size distribution was obtained by the Barret–Joyner–Halenda (BJH) method using the adsorption branch and assuming a slit-shaped pore geometry. Since nitrogen is a nonpolar molecule, it cannot penetrate the clay mineral interlayers due to the charged surface. Therefore, the surface area calculated with the BET method represented the external specific surface area (ESSA) and underestimated the total area.
In order to estimate the total specific surface area (TSSA), water vapor adsorption was carried out by the adsorption of water molecules under a controlled humidity as an indicative measure of the interaction capacity of the composite with water. A sorption isotherm of a clay is a plot of the amount of gas that this solid adsorbs on its surface by changing the vapor pressure of the gas at a constant temperature. For the water vapor sorption isotherms, the gas is water vapor, and the changing pressure is represented by the changing relative humidity (RH) of the environment. Balwant Rai Puri et al. reported that an effective monolayer of water in the interlaminar space is completed when the clay is in equilibrium, with an atmosphere of 53% of RH, which can be generated by employing a saturated solution of Na2Cr2O7 (Anedra, Los troncos del Talar, Buenos Aires, Argentina) [53]. Therefore, to determine the TSSA, the samples were previously dried at 60 °C until a constant weight was reached, and later exposed for 72 h to a controlled humidity of 53%, registering its weight until no changes were observed. The measurements were replicated three times, keeping the temperature constant at 25 °C. Then, the TSSA was calculated using Equation (3).
TSSA   ( m 2 g 1 ) = G ads · N · A · 10 18 G clay · MW
where Gads is the amount of adsorbed water in grams, N is the Avogadro number, A is the surface of a molecule (for water is 0.106 nm2), Gclay is the amount of clay employed in grams, and MW is the water’s molar weight.
Powder X-ray diffraction patterns of the catalysts were recorded with Panalytical X’Pert PRO equipment (Malvern Panalytical Ltd, Malvern, United Kingdom), employing Cu Kα radiation (λ = 1.542 Å) and operating at a voltage of 40 kV and an amperage of 20 mA. The samples were scanned in the 2θ range of 2–70°, with a step size of 0.02°. The identification of the crystalline phases was carried out employing the PDF cards from the International Centre for Diffraction Data.
The strength of the acid sites was estimated by potentiometric titration. A known mass (0.05 g) of the solids was suspended in acetonitrile and kept under stirring for 3 h. The suspension was titrated with a solution of n-butylamine in acetonitrile (0.05 M) at 0.05 mL min−1. The electrode’s potential variation was obtained on a digital pH meter (Metrohm 794 Basic Titrino apparatus with a double junction electrode, purchased by Metrohm, C.A.B.A, Buenos Aires, Argentina).
The temperature-programmed desorption (TPD) of NH3 was performed to determine the solid acid strength distribution, employing Micromeritics AutoChem II equipment (Micromeritics Instrument Corporation, Norcross, GA, USA). Firstly, 100 mg of the sample was treated at 100 °C under Ar flow (60 mL min−1) for 1 h to eliminate the adsorbed water. Secondly, the NH3 was adsorbed at 100 °C for 3 h under NH3 flow NH3(1%)/Ar (60 mL min−1). Then, the physisorbed NH3 was eliminated at 100 °C under Ar flow (60 mL min−1) for 1 h. Finally, the sample was heated from 50 °C to 600 °C with a heating rate of 10 °C min−1. The desorbed NH3 was registered with a Thermo Star TM GSD 301 T (Pfeiffer Vacuum, Nashua, NH, USA) mass detector, monitoring signal m/z=16.
Scanning electron microscopy with energy-dispersive X-ray spectroscopy (SEM-EDS) analyses were performed using SEM Philips 505 equipment (Philips Co, Amsterdam, The Netherlands). The energy dispersive X-ray analysis of the samples was performed using an EDAX DX PRIME 10 analyzer (EDAX, New Jersey, NJ, USA) at a working potential of 15 kV.
Fourier-transform infrared spectroscopy (FTIR) was performed using a Nicolet 380 spectrophotometer (ThermoFisher Scientific, Waltham, MA USA), obtaining transmission spectra in the range of 4000–400 cm−1; the samples were prepared in KBr-supported pellets.
The number of acid sites was measured by neutralization with the back-titration method [27]. In this procedure, 100 mg of the samples was mixed with a solution of NaOH 0.05 M and stirred at 600 rpm for 4 h. After that, the mixture was filtered, and the resultant solution was titrated with 0.05 M HCl. According to Equation (4), the number of moles consumed during neutralization indicates the number of acid sites in the catalyst.
C ( mmol   g 1 ) = total   mmoles   of   NaOH     remaining   mmoles   of   NaOH catalyst   mass ( g )

3.3. Catalytic Activity

The ketalization of glycerol was carried out in a 100 cm3 BR-100 (Berghof, Eningen, Germany) high-pressure stainless-steel batch reactor. Before the catalytic evaluation, experiments were performed to verify the negligible contribution of the reaction in the absence of a catalyst and in the absence of external and internal diffusion limitations. In a typical experiment, acetone, glycerol, and the catalyst were loaded into the reactor. Then, the reactor was pressurized to 2 MPa with N2 and heated to the desired temperature (40–100 °C) at a stirring rate of 1000 rpm in order to ensure the kinetic control conditions. Once the experiment was over, the reactor was cooled to 20 °C and the catalyst was separated by centrifugation and filtration. The identification and quantification of the reaction products were carried out by gas chromatography employing a Shimadzu GCMS QP5050A (Shimadzu Corporation, Tokyo, Japan) equipped with a PE-Elite-Wax capillary column (30 m × 0.25 mm × 0.5 μm, purchased by Perkin Elmer, Bradford, PA, USA) and an FID detector (Shimadzu Corporation, Tokyo, Japan), using n-propanol (Anedra, Los troncos del Talar, Buenos Aires, Argentina) as an external standard. For the kinetic measurements, four reactions were carried out under each condition, and the average of these values was considered to adjust the kinetic model.
The glycerol conversion was determined by Equation (5), and the selectivity toward solketal was determined by Equation (6).
X % = ( initial   glycerol   moles     final   glycerol   moles ) initial   glycerol   moles
S % = solketal   moles ( initial   glycerol   moles     final   glycerol   moles )

4. Conclusions

A bentonite nanocomposite was successfully prepared from a sol-gel precursor mixture of the partially hydrolyzed tetraethyl orthosilicate and a phenol–formaldehyde resin, adding the sodic bentonite.
The catalyst activated with nitric acid, due to the inclusion of the silica–resin structure in the interlaminar spaces of the bentonites, had a total specific surface area of ~360 m2 g−1. Additionally, this catalyst exhibited a density of ~4 mmol of acid sites per gram of bentonite, mainly due to the presence of protons in the interlaminar space, which was responsible for the strong acidity. These characteristics helped the activated catalyst to become active and selective for solketal at reaction temperatures between 60 and 100 °C, reaching equilibrium conversions within a short reaction time. It was demonstrated that the catalyst was stable after three uses and the Langmuir–Hinshelwood–Hougen–Watson kinetic model made it possible to adjust the experimental data. These results show that this catalyst is a promissory route to implement activated bentonites at an industrial scale for solketal production.

Supplementary Materials

The following supporting information can be downloaded at: https://www.mdpi.com/article/10.3390/catal12060673/s1, Figure S1: Results of conversion vs. time considering the adsorption of different compounds; Table S1: Adsorption parameters’ values.

Author Contributions

F.M.P. carried out all the experimental work, which was conceived and designed with G.F.S. and F.P.; C.L. and M.B.L. conducted the synthesis of the bentonite composite; N.N.N. wrote the paper. All authors have read and agreed to the published version of the manuscript.

Funding

This research was funded by “Consejo Nacional de Investigaciones Científicas y Técnicas” (CONICET-PIP 0065) and “Universidad Nacional de La Plata” (UNLP-I248).

Data Availability Statement

Not applicable.

Acknowledgments

The doctoral fellowship granted by UNLP to Federico M. Perez is gratefully acknowledged as well as the doctoral fellowship granted by CONICET to Celeste Legarto.

Conflicts of Interest

The authors declare no conflict of interest. The funders had no role in the design of the study; in the collection, analyses, or interpretation of data; in the writing of the manuscript, or in the decision to publish the results.

References

  1. Gonçalves, V.L.C.; Pinto, B.P.; Silva, J.C.; Mota, C.J.A. Acetylation of Glycerol Catalyzed by Different Solid Acids. Catal. Today 2008, 133–135, 673–677. [Google Scholar] [CrossRef]
  2. Gonçalves, M.; Rodrigues, R.; Galhardo, T.S.; Carvalho, W.A. Highly Selective Acetalization of Glycerol with Acetone to Solketal over Acidic Carbon-Based Catalysts from Biodiesel Waste. Fuel 2016, 181, 46–54. [Google Scholar] [CrossRef]
  3. Rahaman, M.S.; Phung, T.K.; Hossain, M.A.; Chowdhury, E.; Tulaphol, S.; Lalvani, S.B.; O’Toole, M.; Willing, G.A.; Jasinski, J.B.; Crocker, M.; et al. Hydrophobic Functionalization of HY Zeolites for Efficient Conversion of Glycerol to Solketal. Appl. Catal. A Gen. 2020, 592, 117369. [Google Scholar] [CrossRef]
  4. Esposito, R.; Raucci, U.; Cucciolito, M.E.; Di Guida, R.; Scamardella, C.; Rega, N.; Ruffo, F. Iron(III) Complexes for Highly Efficient and Sustainable Ketalization of Glycerol: A Combined Experimental and Theoretical Study. ACS Omega 2019, 4, 688–698. [Google Scholar] [CrossRef] [Green Version]
  5. Abdullah, A.; Zuhairi Abdullah, A.; Ahmed, M.; Khan, J.; Shahadat, M.; Umar, K.; Alim, M.A. A Review on Recent Developments and Progress in Sustainable Acrolein Production through Catalytic Dehydration of Bio-Renewable Glycerol. J. Clean. Prod. 2022, 341, 130876. [Google Scholar] [CrossRef]
  6. Fatimah, I.; Sahroni, I.; Fadillah, G.; Musawwa, M.M.; Mahlia, T.M.I.; Muraza, O. Glycerol to Solketal for Fuel Additive: Recent. Energies 2019, 12, 2872. [Google Scholar] [CrossRef] [Green Version]
  7. Corrêa, I.; Faria, R.P.V.; Rodrigues, A.E. Continuous Valorization of Glycerol into Solketal: Recent Advances on Catalysts, Processes, and Industrial Perspectives. Sustain. Chem. 2021, 2, 286–324. [Google Scholar] [CrossRef]
  8. Hidalgo-Carrillo, J.; Estévez-Toledano, R.C.; López-Tenllado, F.J.; Bautista, F.M.; Urbano, F.J.; Marinas, A. Fourth Generation Synthesis of Solketal by Glycerol Acetalization with Acetone: A Solar-Light Photocatalytic Approach. J. Taiwan Inst. Chem. Eng. 2021, 125, 297–303. [Google Scholar] [CrossRef]
  9. Oliveira, P.A.; Souza, R.O.M.A.; Mota, C.J.A. Atmospheric Pressure Continuous Production of Solketal from the Acid-Catalyzed Reaction of Glycerol with Acetone. J. Braz. Chem. Soc. 2016, 27, 1832–1837. [Google Scholar] [CrossRef]
  10. da Silva, M.J.; Teixeira, M.G.; Chaves, D.M.; Siqueira, L. An Efficient Process to Synthesize Solketal from Glycerol over Tin (II) Silicotungstate Catalyst. Fuel 2020, 281, 118724. [Google Scholar] [CrossRef]
  11. Mota, C.J.A.; Da Silva, C.X.A.; Rosenbach, N.; Costa, J.; Da Silva, F. Glycerin Derivatives as Fuel Additives: The Addition of Glycerol/Acetone Ketal (Solketal) in Gasolines. Energy Fuels 2010, 24, 2733–2736. [Google Scholar] [CrossRef]
  12. Ozorio, L.P.; Pianzolli, R.; Mota, M.B.S.; Mota, C.J.A. Reactivity of Glycerol/Acetone Ketal (Solketal) and Glycerol/Formaldehyde Acetals toward Acid-Catalyzed Hydrolysis. J. Braz. Chem. Soc. 2012, 23, 931–937. [Google Scholar] [CrossRef] [Green Version]
  13. Nanda, M.R.; Zhang, Y.; Yuan, Z.; Qin, W.; Ghaziaskar, H.S.; Xu, C. Catalytic Conversion of Glycerol for Sustainable Production of Solketal as a Fuel Additive: A Review. Renew. Sustain. Energy Rev. 2016, 56, 1022–1031. [Google Scholar] [CrossRef]
  14. Zahid, I.; Ayoub, M.; Abdullah, B.B.; Nazir, M.H.; Ameen, M.; Zulqarnain; Mohd Yusoff, M.H.; Inayat, A.; Danish, M. Production of Fuel Additive Solketal via Catalytic Conversion of Biodiesel-Derived Glycerol. Ind. Eng. Chem. Res. 2020, 59, 20961–20978. [Google Scholar] [CrossRef]
  15. Esteban, J.; Vorholt, A.J.; Behr, A.; Ladero, M.; Garcia-ochoa, F. Liquid − Liquid Equilibria for the System Acetone + Solketal +. J. Chem. Eng. Data 2014, 59, 2850–2855. [Google Scholar] [CrossRef]
  16. Cornejo, A.; Campoy, M.; Barrio, I.; Navarrete, B.; Lázaro, J. Solketal Production in a Solvent-Free Continuous Flow Process: Scaling from Laboratory to Bench Size. React. Chem. Eng. 2019, 4, 1803–1813. [Google Scholar] [CrossRef]
  17. Catuzo, G.L.; Santilli, C.V.; Martins, L. Hydrophobic-Hydrophilic Balance of ZSM-5 Zeolites on the Two-Phase Ketalization of Glycerol with Acetone. Catal. Today 2020, 381, 215–223. [Google Scholar] [CrossRef]
  18. Rodrigues, R.; Santos, M.S.; Nunes, R.S.; Carvalho, W.A.; Labuto, G. Solvent-Free Solketal Production from Glycerol Promoted by Yeast Activated Carbons. Fuel 2021, 299, 120923. [Google Scholar] [CrossRef]
  19. Fernández, P.; Fraile, J.M.; García-Bordejé, E.; Pires, E. Sulfonated Hydrothermal Carbons from Cellulose and Glucose as Catalysts for Glycerol Ketalization. Catalysts 2019, 9, 804. [Google Scholar] [CrossRef] [Green Version]
  20. Huang, Y.; Zhang, G.; Zhang, Q. Preparation of the WOX/MCM-41 Solid Acid Catalyst and the Catalytic Performance for Solketal Synthesis. ACS Omega 2021, 6, 3875–3883. [Google Scholar] [CrossRef]
  21. Timofeeva, M.N.; Panchenko, V.N.; Krupskaya, V.V.; Gil, A.; Vicente, M.A. Effect of Nitric Acid Modification of Montmorillonite Clay on Synthesis of Solketal from Glycerol and Acetone. Catal. Commun. 2017, 90, 65–69. [Google Scholar] [CrossRef]
  22. Moreira, M.N.; Faria, R.P.V.; Ribeiro, A.M.; Rodrigues, A.E. Solketal Production from Glycerol Ketalization with Acetone: Catalyst Selection and Thermodynamic and Kinetic Reaction Study. Ind. Eng. Chem. Res. 2019, 58, 17746–17759. [Google Scholar] [CrossRef]
  23. Nanda, M.R.; Yuan, Z.; Qin, W.; Ghaziaskar, H.S.; Poirier, M.A.; Xu, C.C. Thermodynamic and Kinetic Studies of a Catalytic Process to Convert Glycerol into Solketal as an Oxygenated Fuel Additive. Fuel 2014, 117, 470–477. [Google Scholar] [CrossRef]
  24. Komadel, P. Chemically Modified Smectites. Clay Miner. 2003, 38, 127–138. [Google Scholar] [CrossRef] [Green Version]
  25. Komadel, P. Acid Activated Clays: Materials in Continuous Demand. Appl. Clay Sci. 2016, 131, 84–99. [Google Scholar] [CrossRef]
  26. Jeenpadiphat, S.; Tungasmita, D.N. Esterification of Oleic Acid and High Acid Content Palm Oil over an Acid-Activated Bentonite Catalyst. Appl. Clay Sci. 2014, 87, 272–277. [Google Scholar] [CrossRef]
  27. Tangestanifard, M.; Ghaziaskar, H.S. Arenesulfonic Acid-Functionalized Bentonite as Catalyst in Glycerol Esterification with Acetic Acid. Catalysts 2017, 7, 211. [Google Scholar] [CrossRef] [Green Version]
  28. Rabie, A.M.; Mohammed, E.A.; Negm, N.A. Feasibility of Modified Bentonite as Acidic Heterogeneous Catalyst in Low Temperature Catalytic Cracking Process of Biofuel Production from Nonedible Vegetable Oils. J. Mol. Liq. 2018, 254, 260–266. [Google Scholar] [CrossRef]
  29. Vilcocq, L.; Spinola, V.; Moniz, P.; Duarte, L.C.; Carvalheiro, F.; Fernandes, C.; Castilho, P. Acid-Modified Clays as Green Catalysts for the Hydrolysis of Hemicellulosic Oligosaccharides. Catal. Sci. Technol. 2015, 5, 4072–4080. [Google Scholar] [CrossRef] [Green Version]
  30. Elfadly, A.M.; Zeid, I.F.; Yehia, F.Z.; Abouelela, M.M.; Rabie, A.M. Production of Aromatic Hydrocarbons from Catalytic Pyrolysis of Lignin over Acid-Activated Bentonite Clay. Fuel Process. Technol. 2017, 163, 663–669. [Google Scholar] [CrossRef]
  31. Bendou, S.; Amrani, M. Effect of Hydrochloric Acid on the Structural of Sodic-Bentonite Clay. J. Miner. Mater. Charact. Eng. 2014, 2, 404–413. [Google Scholar] [CrossRef]
  32. Legarto, C.M.; Scian, A.; Lombardi, M.B. Preparation and Characterization of Bentonite Nanocomposites via Sol–Gel Process. SN Appl. Sci. 2019, 1, 770. [Google Scholar] [CrossRef] [Green Version]
  33. Legarto, M.C.; Benito, D.; Scian, A.; Lombardi, M.B. Obtention and Characterization of a Hybrid Nanocomposite Monolith by Sol–Gel Process. Bol. Soc. Esp. Ceram. Vidr. 2021, 1–11, in press. [Google Scholar] [CrossRef]
  34. Alabarse, F.G.; Conceição, R.V.; Balzaretti, N.M.; Schenato, F.; Xavier, A.M. In-Situ FTIR Analyses of Bentonite under High-Pressure. Appl. Clay Sci. 2011, 51, 202–208. [Google Scholar] [CrossRef] [Green Version]
  35. Andrini, L.; Moreira Toja, R.; Gauna, M.R.; Conconi, M.S.; Requejo, F.G.; Rendtorff, N.M. Extended and Local Structural Characterization of a Natural and 800 °C Fired Na-Montmorillonite–Patagonian Bentonite by XRD and Al/Si XANES. Appl. Clay Sci. 2017, 137, 233–240. [Google Scholar] [CrossRef]
  36. Fernández, M.; Alba, M.D.; Torres Sánchez, R.M. Effects of Thermal and Mechanical Treatments on Montmorillonite Homoionized with Mono- and Polyvalent Cations: Insight into the Surface and Structural Changes. Colloids Surfaces A Physicochem. Eng. Asp. 2013, 423, 1–10. [Google Scholar] [CrossRef] [Green Version]
  37. Kaufhold, S.; Dohrmann, R.; Klinkenberg, M.; Siegesmund, S.; Ufer, K. N2-BET Specific Surface Area of Bentonites. J. Colloid Interface Sci. 2010, 349, 275–282. [Google Scholar] [CrossRef]
  38. Laird, D.A. Layer Charge Influences on the Hydration of Expandable 2:1 Phyllosilicates. Clays Clay Miner. 1999, 47, 630–636. [Google Scholar] [CrossRef]
  39. Cid, R.; Pecchi, G. Potentiometric Method for Determining the Number and Relative Strength of Acid Sites in Colored Catalysts. Appl. Catal. A Gen. 1985, 14, 15–21. [Google Scholar] [CrossRef]
  40. Liu, D.; Yuan, P.; Liu, H.; Cai, J.; Tan, D.; He, H.; Zhu, J.; Chen, T. Quantitative Characterization of the Solid Acidity of Montmorillonite Using Combined FTIR and TPD Based on the NH3 Adsorption System. Appl. Clay Sci. 2013, 80–81, 407–412. [Google Scholar] [CrossRef]
  41. Azzouz, A.; Nistor, D.; Miron, D.; Ursu, A.V.; Sajin, T.; Monette, F.; Niquette, P.; Hausler, R. Assessment of Acid-Base Strength Distribution of Ion-Exchanged Montmorillonites through NH3 and CO2-TPD Measurements. Thermochim. Acta 2006, 449, 27–34. [Google Scholar] [CrossRef]
  42. Tong, D.S.; Zheng, Y.M.; Yu, W.H.; Wu, L.M.; Zhou, C.H. Catalytic Cracking of Rosin over Acid-Activated Montmorillonite Catalysts. Appl. Clay Sci. 2014, 100, 123–128. [Google Scholar] [CrossRef]
  43. da Silva, C.X.A.; Gonçalves, V.L.C.; Mota, C.J.A. Water-Tolerant Zeolite Catalyst for the Acetalisation of Glycerol. Green Chem. 2009, 11, 38–41. [Google Scholar] [CrossRef]
  44. Manjunathan, P.; Maradur, S.P.; Halgeri, A.B.; Shanbhag, G.V. Room Temperature Synthesis of Solketal from Acetalization of Glycerol with Acetone: Effect of Crystallite Size and the Role of Acidity of Beta Zeolite. J. Mol. Catal. A Chem. 2015, 396, 47–54. [Google Scholar] [CrossRef]
  45. Sandesh, S.; Halgeri, A.B.; Shanbhag, G.V. Utilization of Renewable Resources: Condensation of Glycerol with Acetone at Room Temperature Catalyzed by Organic-Inorganic Hybrid Catalyst. J. Mol. Catal. A Chem. 2015, 401, 73–80. [Google Scholar] [CrossRef]
  46. Vannucci, J.A.; Nichio, N.N.; Pompeo, F. Solketal Synthesis from Ketalization of Glycerol with Acetone: A Kinetic Study over a Sulfated Zirconia Catalyst. Catal. Today 2020, 372, 238–245. [Google Scholar] [CrossRef]
  47. Esteban, J.; Ladero, M.; García-Ochoa, F. Kinetic Modelling of the Solventless Synthesis of Solketal with a Sulphonic Ion Exchange Resin. Chem. Eng. J. 2015, 269, 194–202. [Google Scholar] [CrossRef]
  48. Faria, R.P.V.; Pereira, C.S.M.; Silva, V.M.T.M.; Loureiro, J.M.; Rodrigues, A.E. Glycerol Valorisation as Biofuels: Selection of a Suitable Solvent for an Innovative Process for the Synthesis of GEA. Chem. Eng. J. 2013, 233, 159–167. [Google Scholar] [CrossRef] [Green Version]
  49. Faria, R.P.V.; Pereira, C.S.M.; Silva, V.M.T.M.; Loureiro, J.M.; Rodrigues, A.E. Glycerol Valorization as Biofuel: Thermodynamic and Kinetic Study of the Acetalization of Glycerol with Acetaldehyde. Ind. Eng. Chem. Res. 2013, 52, 1538–1547. [Google Scholar] [CrossRef]
  50. Rossa, V.; Pessanha, Y.D.S.P.; Díaz, G.C.; Câmara, L.D.T.; Pergher, S.B.C.; Aranda, D.A.G. Reaction Kinetic Study of Solketal Production from Glycerol Ketalization with Acetone. Ind. Eng. Chem. Res. 2017, 56, 479–488. [Google Scholar] [CrossRef]
  51. Perez, F.M.; Nichio, N.; Pompeo, F. Thermodynamic Assessment of Chemical Equilibrium for the Synthesis of Solketal in the Liquid Phase. Chem. Eng. Technol. 2021, 44, 1356–1363. [Google Scholar] [CrossRef]
  52. Lombardi, B.; Baschini, M.; Torres Sánchez, R.M. Bentonite Deposits of Northern Patagonia. Appl. Clay Sci. 2003, 22, 309–312. [Google Scholar] [CrossRef]
  53. Carr, D.S.; Harris, B.L. Solutions for Maintaining Constant Relative Humidity Solubilities of Aliphatic Dicarboxylic Acids in Water. Ind. Eng. Chem. 1949, 41, 2014–2015. [Google Scholar] [CrossRef]
Scheme 1. Ketalization reaction between glycerol and acetone.
Catalysts 12 00673 sch001
Scheme 2. Reaction mechanism of solketal formation, adapted from [23].
Catalysts 12 00673 sch002
Figure 1. SEM images of: (a) natural bentonite B; (b) bentonite nanocomposite CB; (c) activated bentonite nanocomposite CBA.
Catalysts 12 00673 g001
Figure 2. FTIR spectra of solids B, CB, and CBA.
Catalysts 12 00673 g002
Figure 3. Diffractograms of natural bentonite (B), bentonite composite (CB), activated bentonite (BA), and activated bentonite composite (CBA). Mt: montmorillonite; q: quartz; f: feldspar; and g: gypsum. The inserted figure shows the extended zone of 2θ = 3–10° for solids B and BA.
Catalysts 12 00673 g003
Figure 4. Ammonia desorption as a function of temperature for materials CB and CBA (solid lines) and individual components after deconvolution (dotted lines).
Catalysts 12 00673 g004
Figure 5. Catalyst reuse. Reaction conditions: Time = 240 min; A/G = 6; and mcat = 0.25% wt.
Catalysts 12 00673 g005
Figure 6. Glycerol conversion vs. time at different temperatures. Reaction conditions: A/G = 6, mcat = 0.25% wt. The bars indicate the standard deviation of each point.
Catalysts 12 00673 g006
Table 1. EDS analysis of solids B, CB, and CBA. Compositions are expressed in Wt.%.
SolidSiAlNaMg
B75.418.93.02.7
CB83.412.22.61.8
CBA84.413.002.6
Table 2. Total and external specific surface area of the solids and results of potentiometric titration.
SolidESSA (m2 g−1)TSSA (m2 g−1)TSSA–ESSA *
(m2 g−1)
Ei (mV)
B11011871077−62.7
BA90900810487.6
CB95464369−62.7
CBA92450358496.3
* TSSA–ESSA represents the internal surface.
Table 3. Reaction tests for solids B, CB, BA, and CBA. Reaction conditions: T = 60 °C, p = 2 MPa, t = 30 min, and acetone/glycerol molar ratio = 6:1 (A/G = 6).
SolidCatalyst Amount (mg)Converted Moles of Glycerol Per Gram of BentoniteSolketal Selectivity (%)
B5000
BA10000
CB101.30496
CBA201.34897
Table 4. Reaction tests for solid CBA at different temperatures. Reaction conditions: p = 2 MPa, Catalyst amount: 0.25%, and acetone/glycerol molar ratio = 6:1 (A/G = 6).
Temperature (°C)Reaction Rate at 15 min (mol L−1 g−1 min−1)Glycerol Conversion at 240 minSolketal Selectivity at 240 min (%)
400.0483094
600.1658098
800.2567197
1000.9016596
Table 5. Comparison of the experimental results obtained by different authors.
CatalystTimeInitial Moles of GlycerolT (°C)A/GCatalyst Amount (% Wt.)Glycerol ConversionRef.
K-10300.0543701.26085[43]
K-10300.0270Room2525[44]
K-1030NR306375[45]
B0.5300.0115502.5354[21]
CBA300.02176060.2521This work
CBA1600.02176060.2574This work
Table 6. Steps involved in the kinetic model proposed.
StepReaction
1 Ac + *     Ac *
2 Gly + *     Gly *
3 Ac * + Gly *   HA * + *
4 HA * + *     C * + W *
5 C *     Solk *
6 Solk *   Solk + *
7 W * W + *
Table 7. Kinetic parameters.
Parameter60 °C80 °C100 °C
k [mol g−1 L−1 sec−1]0.0905 ± 0.05380.122 ± 0.04340.507 ± 0.161
K e q 0.626 ± 0.08890.302 ± 0.01360.198 ± 0.00424
K G l y 1.271 ± 0.6301.157 ± 0.3491.100 ± 0.3078
Table 8. Comparison of the activation energy values obtained by different authors.
Ea (kJ mol−1)ModelCatalystReference
50.3 ± 3.6LHHWCBAThis Work
124.0 ± 12.9Eley-RidealSulphonic ion Exchange resin[47]
55.6 ± 3.1LHHWAmberlyst -35[23]
69.0 ± 6.6LHHWAmberlyst -35[22]
44.8 ± 1.2Pseudo-homogeneousH-BEA[50]
88.1 ± 8.9Pseudo-homogeneousSulfated zirconia[46]
Publisher’s Note: MDPI stays neutral with regard to jurisdictional claims in published maps and institutional affiliations.

