Article

Study of Intermolecular Interaction between Small Molecules and Carbon Nanobelt: Electrostatic, Exchange, Dispersive and Inductive Forces

1
College of Sciences, Liaoning Petrochemical University, Fushun 113001, China
2
College of Petroleum Engineering, Liaoning Petrochemical University, Fushun 113001, China
*
Authors to whom correspondence should be addressed.
Catalysts 2022, 12(5), 561; https://doi.org/10.3390/catal12050561
Submission received: 18 April 2022 / Revised: 14 May 2022 / Accepted: 18 May 2022 / Published: 19 May 2022
(This article belongs to the Special Issue Functional Materials for Application in Adsorption & Catalysis)

Abstract

:
The conjugated structure of carbon is used in chemical sensing and small molecule catalysis because of its high charge transfer ability, and the interaction between carbon materials and small molecules is the main factor determining the performance of sensing and catalytic reactions. In this work, Reduced Density Gradient (RDG) and Symmetry-Adapted Perturbation Theory (SAPT) energy decomposition methods were used in combination to investigate the heterogeneity of catalytic substrates commonly used in energy chemistry with [6, 6] the carbon nanobelt ([6, 6] CNB, the interaction properties and mechanisms inside and outside the system). The results show that most of the attractive forces between dimers are provided by dispersive interactions, but electrostatic interactions cannot be ignored either. The total energy of the internal adsorption of [6, 6] CNB was significantly smaller than that of external adsorption, which led to the small molecules being more inclined to adsorb in the inner region of [6, 6] CNB. The dispersive interactions of small molecules adsorbed on [6, 6] CNB were also found to be very high. Furthermore, the dispersive interactions of the same small molecules adsorbed inside [6, 6] CNB were significantly stronger than those adsorbed outside. In [6, 6] CNB dimers, dispersion played a major role in the mutual attraction of molecules, accounting for 70% of the total attraction.

1. Introduction

Heterogeneous catalysis refers to a catalytic reaction that occurs at a two-phase interface, and most of the catalytic reactions used in industry are heterogeneous catalysis reactions. The development of materials with a high specific surface area is extremely important for the development of the field of heterogeneous catalysis [1,2], because heterogeneous catalysis reactions involve processes such as the diffusion of reactant molecules within the catalyst pores and the adsorption on the surface. Carbon is one of the most closely related and important elements that exist in nature. Carbon-based nanomaterials have considerable applications in many fields [3,4,5,6,7,8,9,10], among which catalysis is a very important application field of carbon nanomaterials. Carbon nanomaterials are excellent catalytic materials due to their large specific surface area and many surface-active centers. Carbon nanomaterials have great application prospects in research activities in the fields of fine chemicals [11,12], renewable energy [13,14] and biotransformation [15,16]. Reactions using carbon materials as catalysts are called carbon catalysis reactions [17]. Nearly a hundred years ago, the catalytic activity of carbon materials was discovered, which is almost the earliest report on carbon catalysis [18]. Fullerenes, graphene, carbon nanotubes and carbon nanodots have also been investigated as efficient carbon catalysts or metal/oxide supports in catalytic applications [19]. In 2017, the carbon nano family ushered in a new member: [6, 6] the carbon nanobelt ([6, 6] CNB, Figure 1) [20]. Guillaume Povie et al. successfully synthesized [6, 6] CNB through iterative Wittig reactions and nickel-mediated aryl–aryl coupling reactions. Carbon nanotubes have excellent applications in the field of catalysis. Carbon nanobelts are the smallest unit of carbon nanotubes, and they also have good application prospects. Therefore, we selected [6, 6] CNB as the research object.
At present, energy and environmental issues are a very serious challenge for the world. The development of green chemical science is of great significance to the sustainable development of energy and the environment. Heterogeneous catalysis is a central pillar of the modern chemical and energy industries. Compared with homogeneous catalysis, heterogeneous catalysis has the advantages of easy separation and convenient recovery [21,22]. In energy chemistry, some small molecular heterogeneous catalytic substrates are often used to convert harmful gases such as CO2 into usable energy such as CH4 [23,24,25]. These are manifested in photocatalysis, electrocatalysis and photothermal catalysis derived from photocatalysis and thermocatalysis [26,27,28]. In the field of perovskite solar cells, Cao et al. demonstrated that molecularly localized electric field (electrostatic interaction)-induced electron transport is very important for improving perovskite solar cell performance [29,30,31]. Yang et al. also proved that the electrostatic and dispersion effects of conjugated carbon materials on other materials are crucial for the performance of photovoltaic devices [32,33,34].
Based on these, we designed a series of dimers of [6, 6] CNB combined with heterogeneous catalytic substrates (N2, CH4, CO, CO2, H2, H2O, H2O2 and O2) commonly used in the field of energy chemistry. We designed the catalytic substrate adsorption with two binding modes inside and outside the [6, 6] CNB. The interactions between catalysts and supports are of great significance for regulating catalytic performance and active sites. Finally, we calculated the nature of the interaction between [6, 6] CNB dimers.

2. Results and Discussion

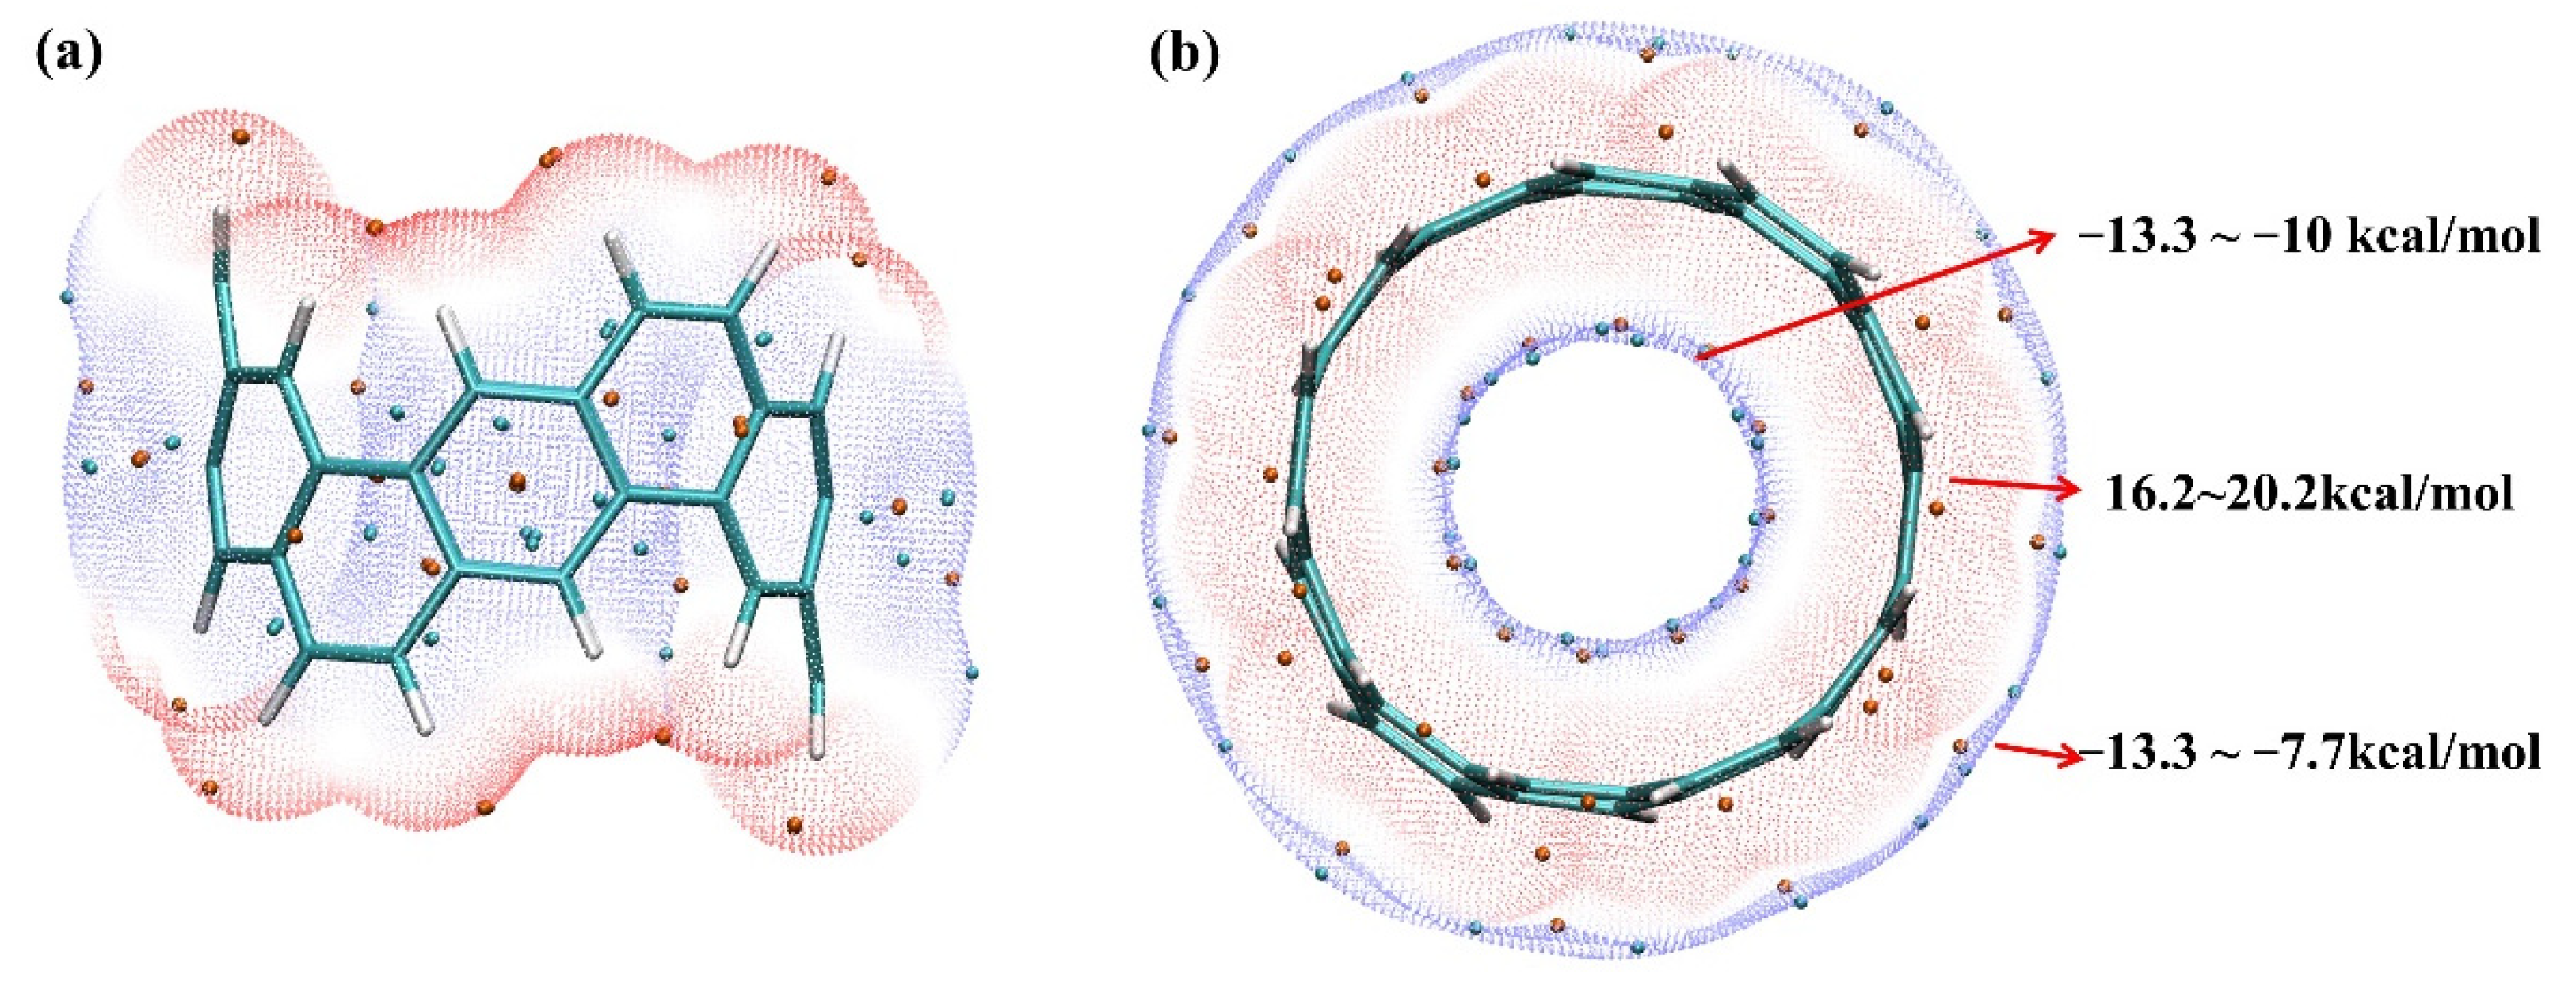
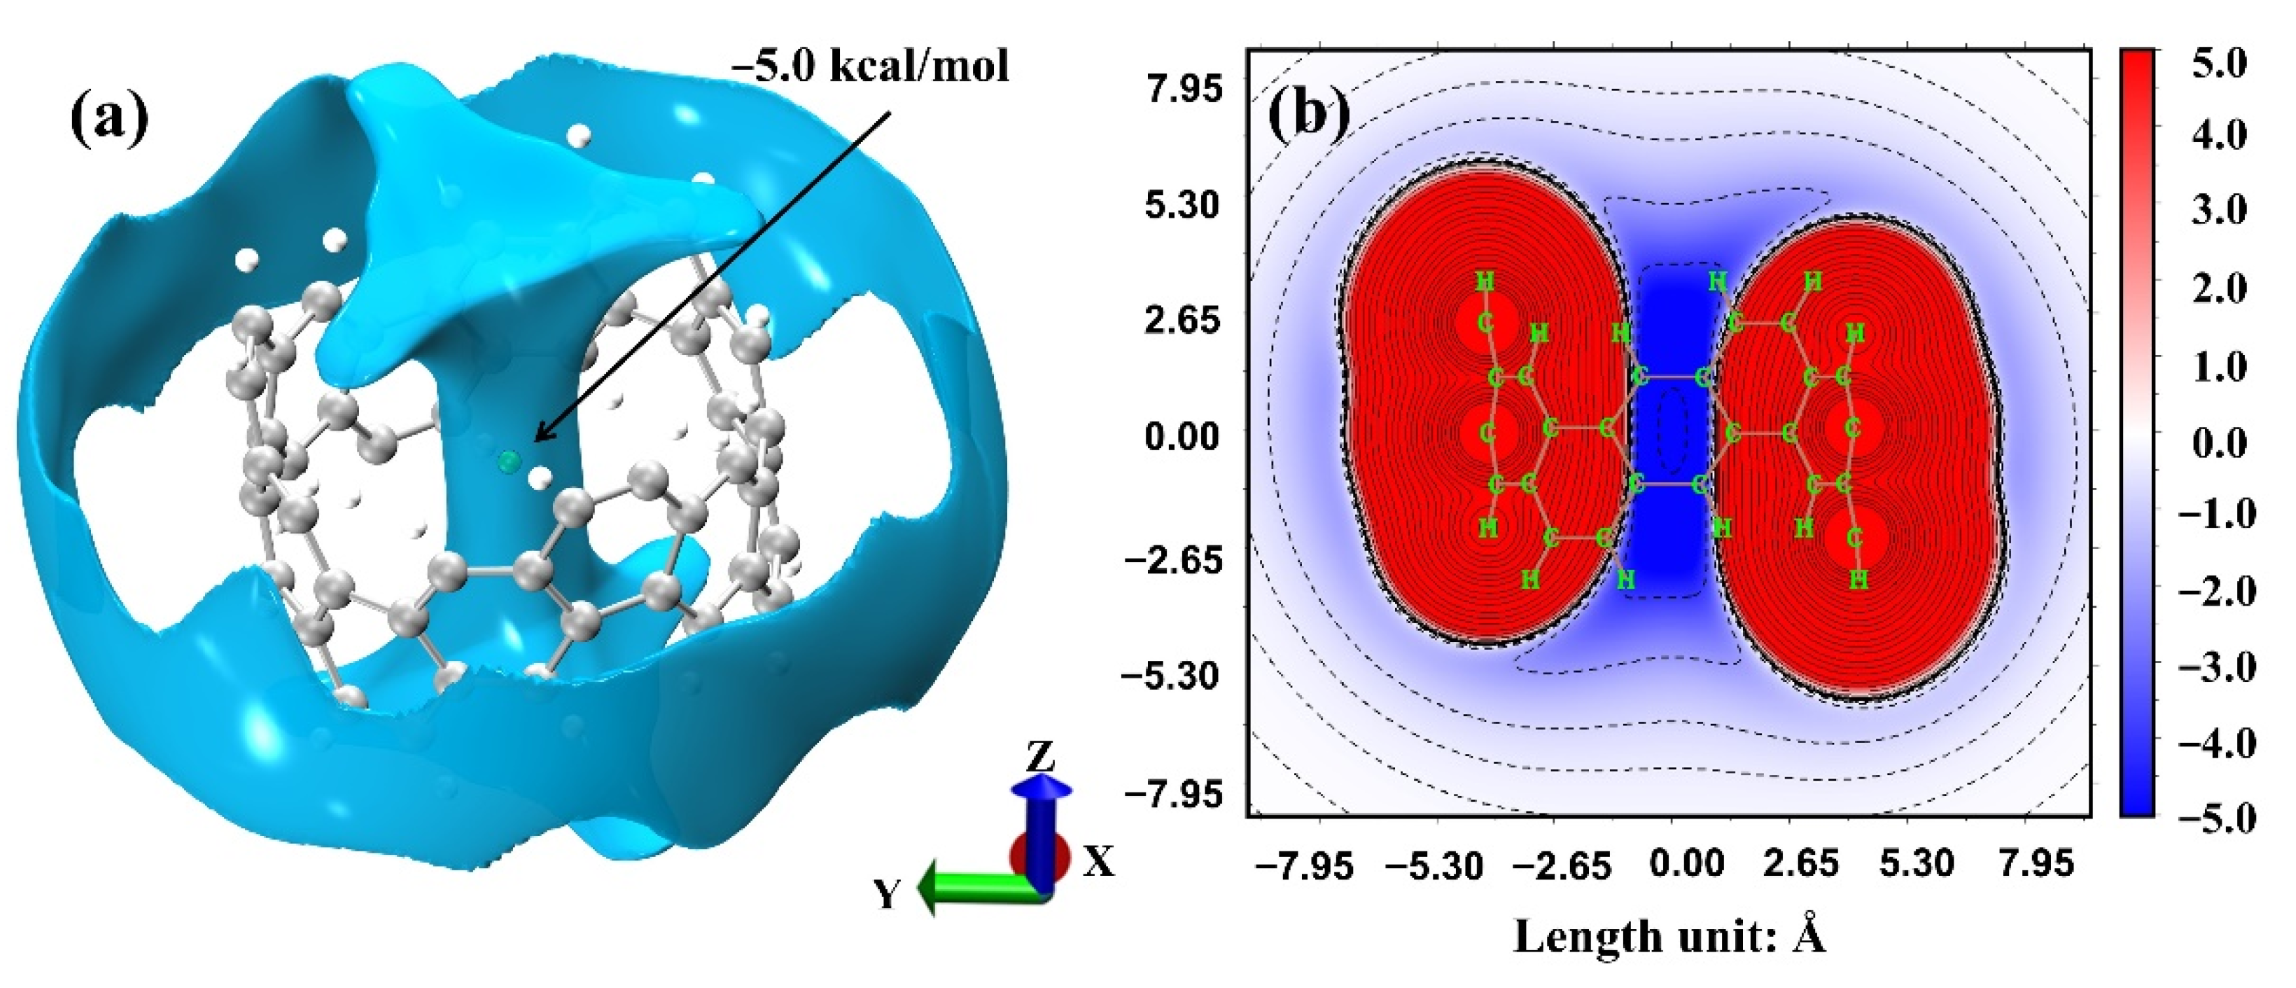
2.1. Electrostatic Potential and Van Der Waals Potential

Intermolecular interaction comes from four physical components: electrostatic interaction, dispersion interaction, exchange interaction and induction interaction. Among them, electrostatic interaction and dispersion interaction are the main sources of contribution to intermolecular adsorption. In the following section, the interaction of [6, 6] CNB with the external environment was analyzed based on electrostatic potential [35] and van der Waals potential [36].
Since [6, 6] CNB has high symmetry, the dipole moment is zero, but we cannot simply consider [6, 6] CNB as a non-polar molecule. This is because the local polarity cannot be ignored. The electrostatic potential is directly determined by the charge distribution of the system, so the electrostatic potential can characterize the polarity of the system, which is of great significance for investigating the electrostatic interactions between molecules. We chose the van der Waals surface with an electron density of 0.001 a.u. for research, because this surface can describe the electrostatic interactions between molecules very well. As shown in Figure 2, the internal and external electrostatic potential distributions of [6, 6] CNB were −13.3~−10.0 kcal/mol and −13.3~−7.7 kcal/mol (the lowest internal and external electrostatic potentials are equal), while the electrostatic potential near the hydrogen atom was 16.0~21.0 kcal /mol. We speculate that the electrostatic interaction had little effect on the interaction between the internal and external parts of the [6, 6] CNB. The molecular polarity index (MPI) is a quantity that can reflect polarity through the distribution of electrostatic potential [37]. MPI is defined as
M P I   =   1 / A S V r d S
where V is the electrostatic potential of the system, S is the surface, and A is the surface area. MPI can quantify the polarity of the system surface; the larger the value, the stronger the polarity. Through calculation, we found that the MPI of [6, 6] CNB was 9.3 kcal/mol. The MPI values of benzene and ethylamine were 8.4 and 9.3 kcal/mol, respectively. Obviously, [6, 6] CNB had a certain polarity. This also means that the electrostatic interaction had a certain importance in the process of [6, 6] CNB and small molecules adsorption.
Dispersion interaction is also extremely important in intermolecular interactions. In 2020, a new method of describing interactions was proposed: van der Waals potential [36]. Van der Waals potential is composed of dispersion potential and exchange potential. It is defined as:
V v d W r   =   V r e p u l r   +   V d i s p r   =   A ε A B R A B 0 R A     r 12   +   A 2 ε A B R A B 0 R A     r 6
where V r e p u l and V d i s p are the exchange potential and dispersion potential in van der Waals potential, respectively. A represents all atoms circulating, ε   and R 0 are the LJ potential well depth and equilibrium distance between atoms, and R A represents the nuclear coordinates of the A atom.
Here, we used the Xr atom as a probe to study the van der Waals potential of [6, 6] CNB, and the results have been drawn as isosurface and plane diagrams. This is because the electrostatic interaction is negligible when noble gas is used as the probe atom. When studying the van der Waals potential, usually only the regions where the dispersion action is stronger than the exchange action has chemical significance. So, in the isosurface diagram, we only show the regions where the van der Waals potential was negative.
As shown in Figure 3a, the van der Waals potential was distributed both inside and outside [6, 6] CNB, where the inside was dumbbell-shaped and the outside was barrel-shaped. The probe atom was located at the exact center of [6, 6] CNB, which also shows that the van der Waals potential at the center was the lowest (−5.0 kcal/mol), while the outer van der Waals potential was −1.4~−1.2 kcal/mol. Additionally, from Figure 3b, we can clearly see the huge difference between the internal and external van der Waals potential of [6, 6] CNB. The difference comes from the change of dispersion interaction. When the probe atom is inside the [6, 6] CNB, the probe atom will be attracted by all the surrounding atoms, and when the probe atom is outside the [6, 6] CNB, it will only be attracted by a part of the atoms. So, the internal dispersion interaction of [6, 6] CNB was much stronger than the external dispersion interaction. Based on the analysis of electrostatic potential and van der Waals potential, we predict that small molecules are more likely to be adsorbed inside [6, 6] CNB. Additionally, because of the difference between the minimum value of the inner and outer regions of the electrostatic potential and the van der Waals potential, it can be inferred that the internal adsorption and the external adsorption have less influence on the electrostatic interaction, but have a greater influence on the van der Waals interaction. We will now verify this conjecture.

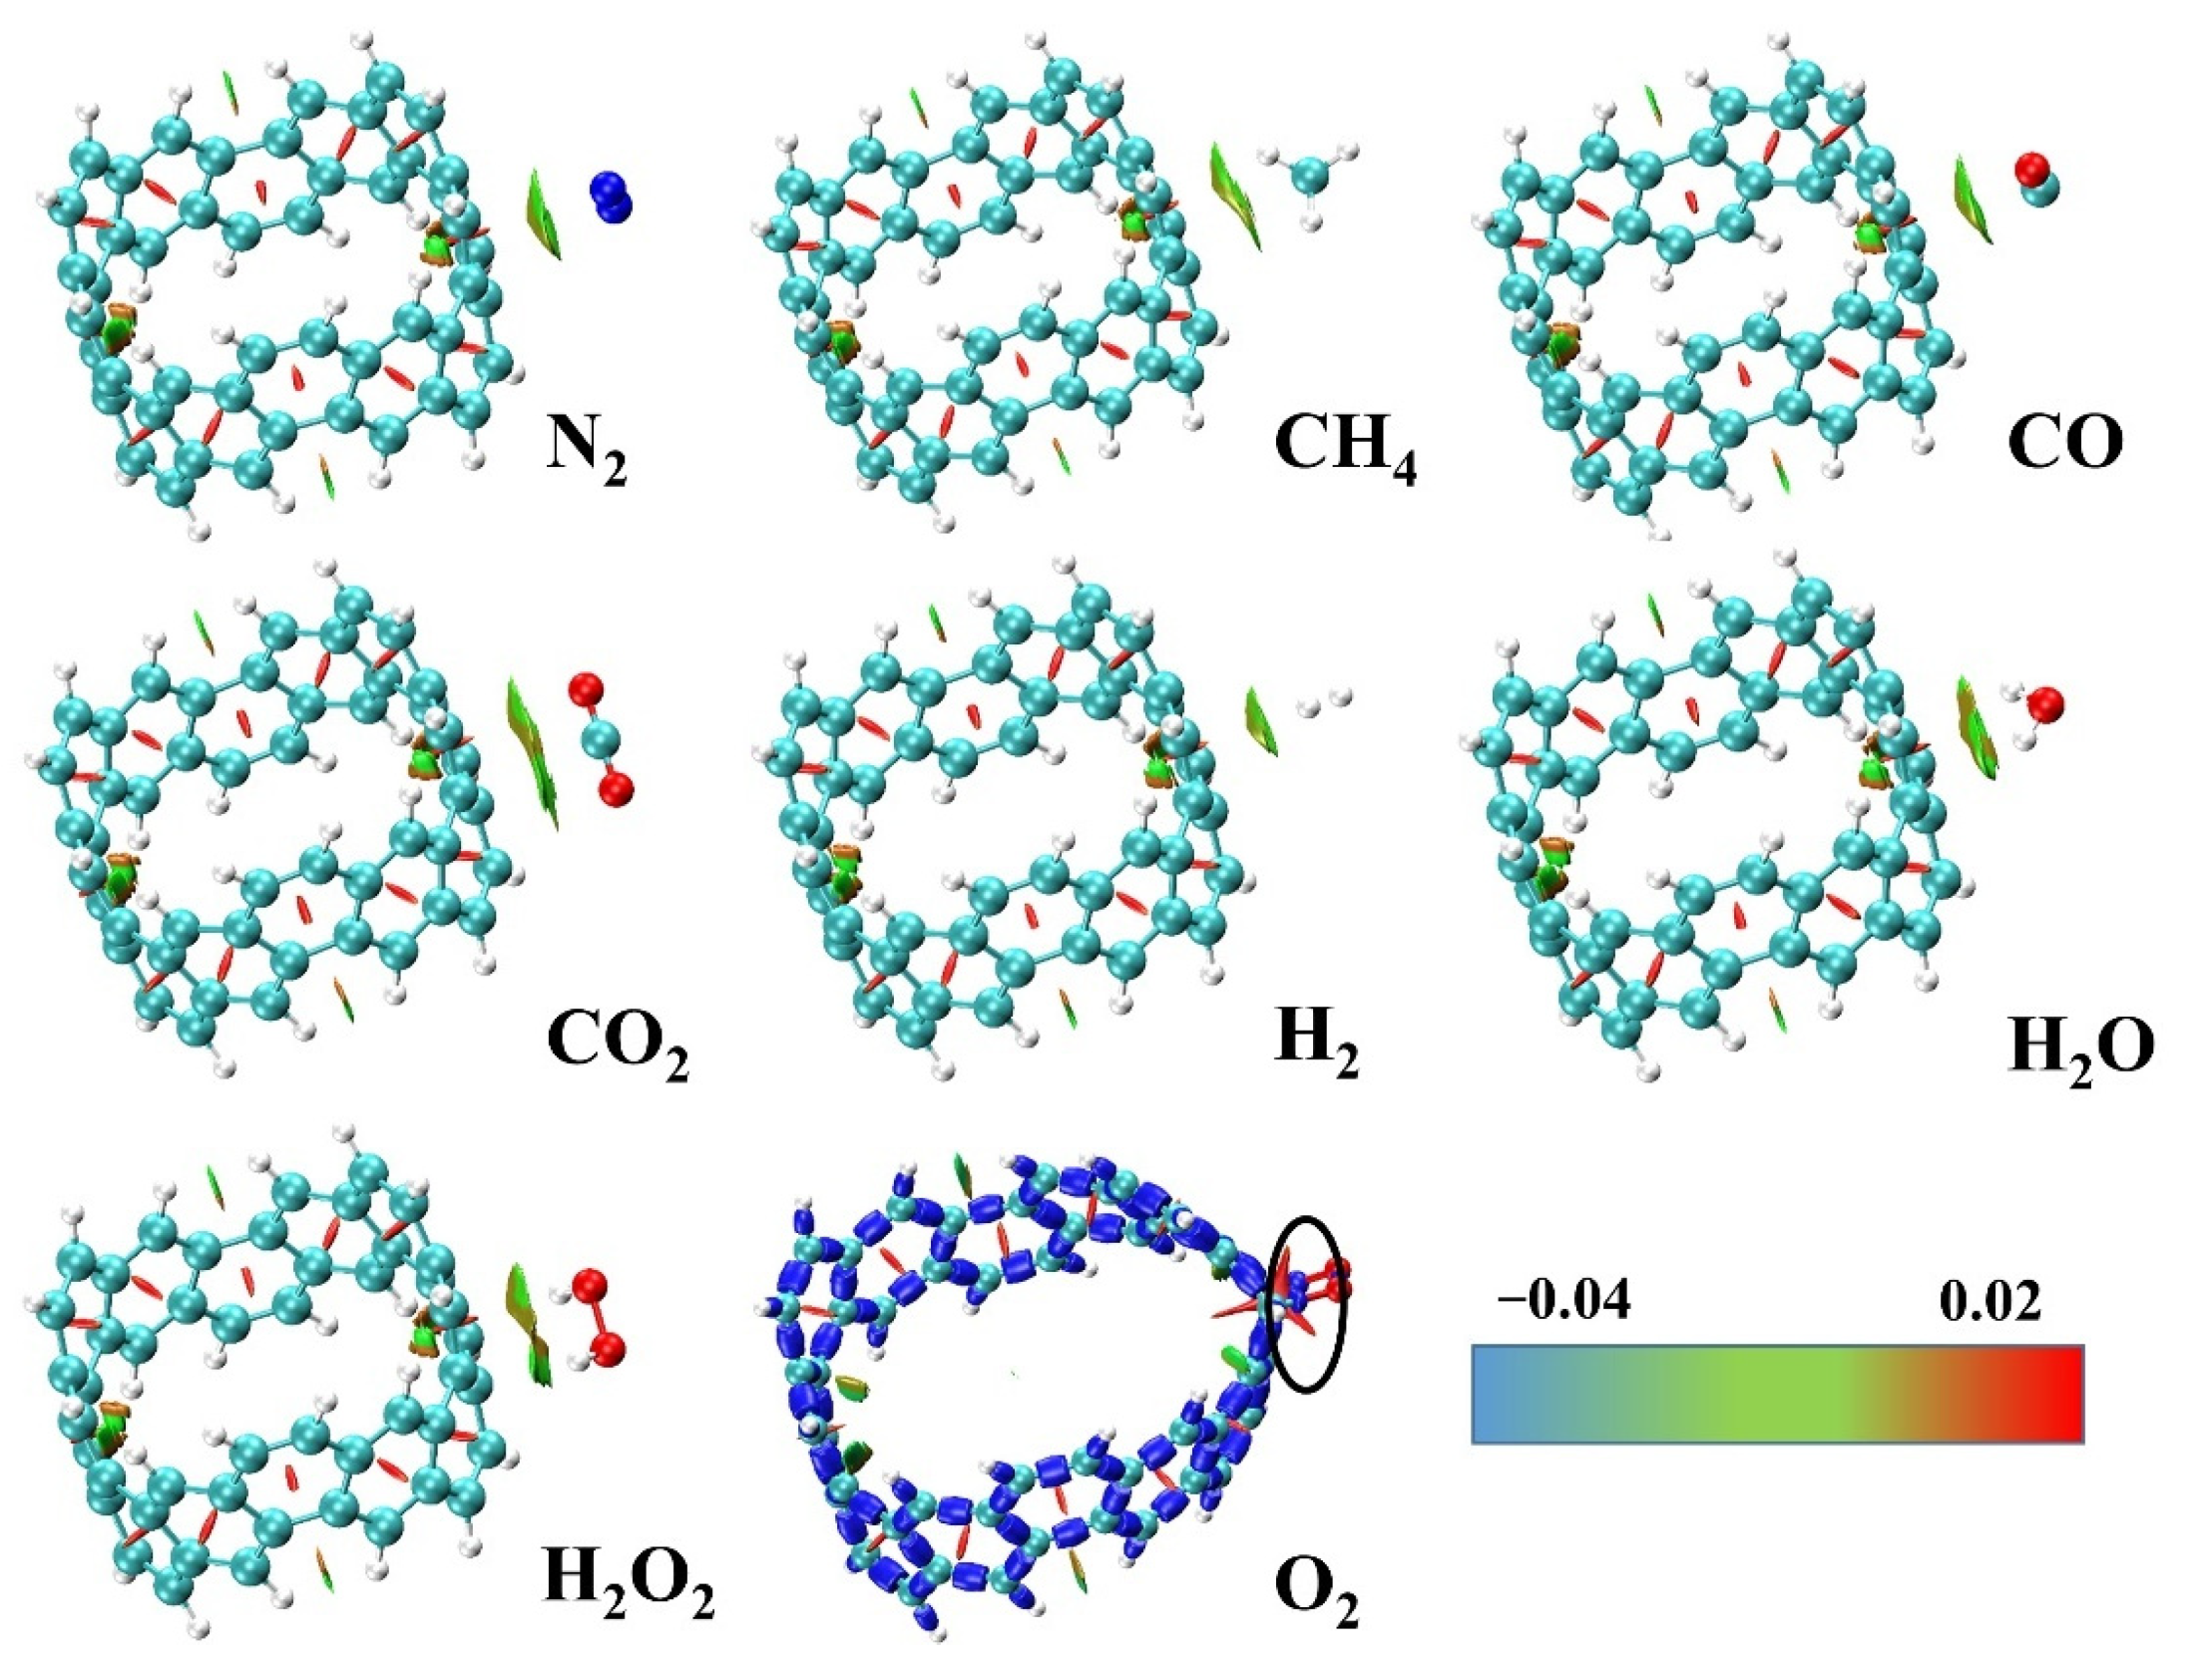
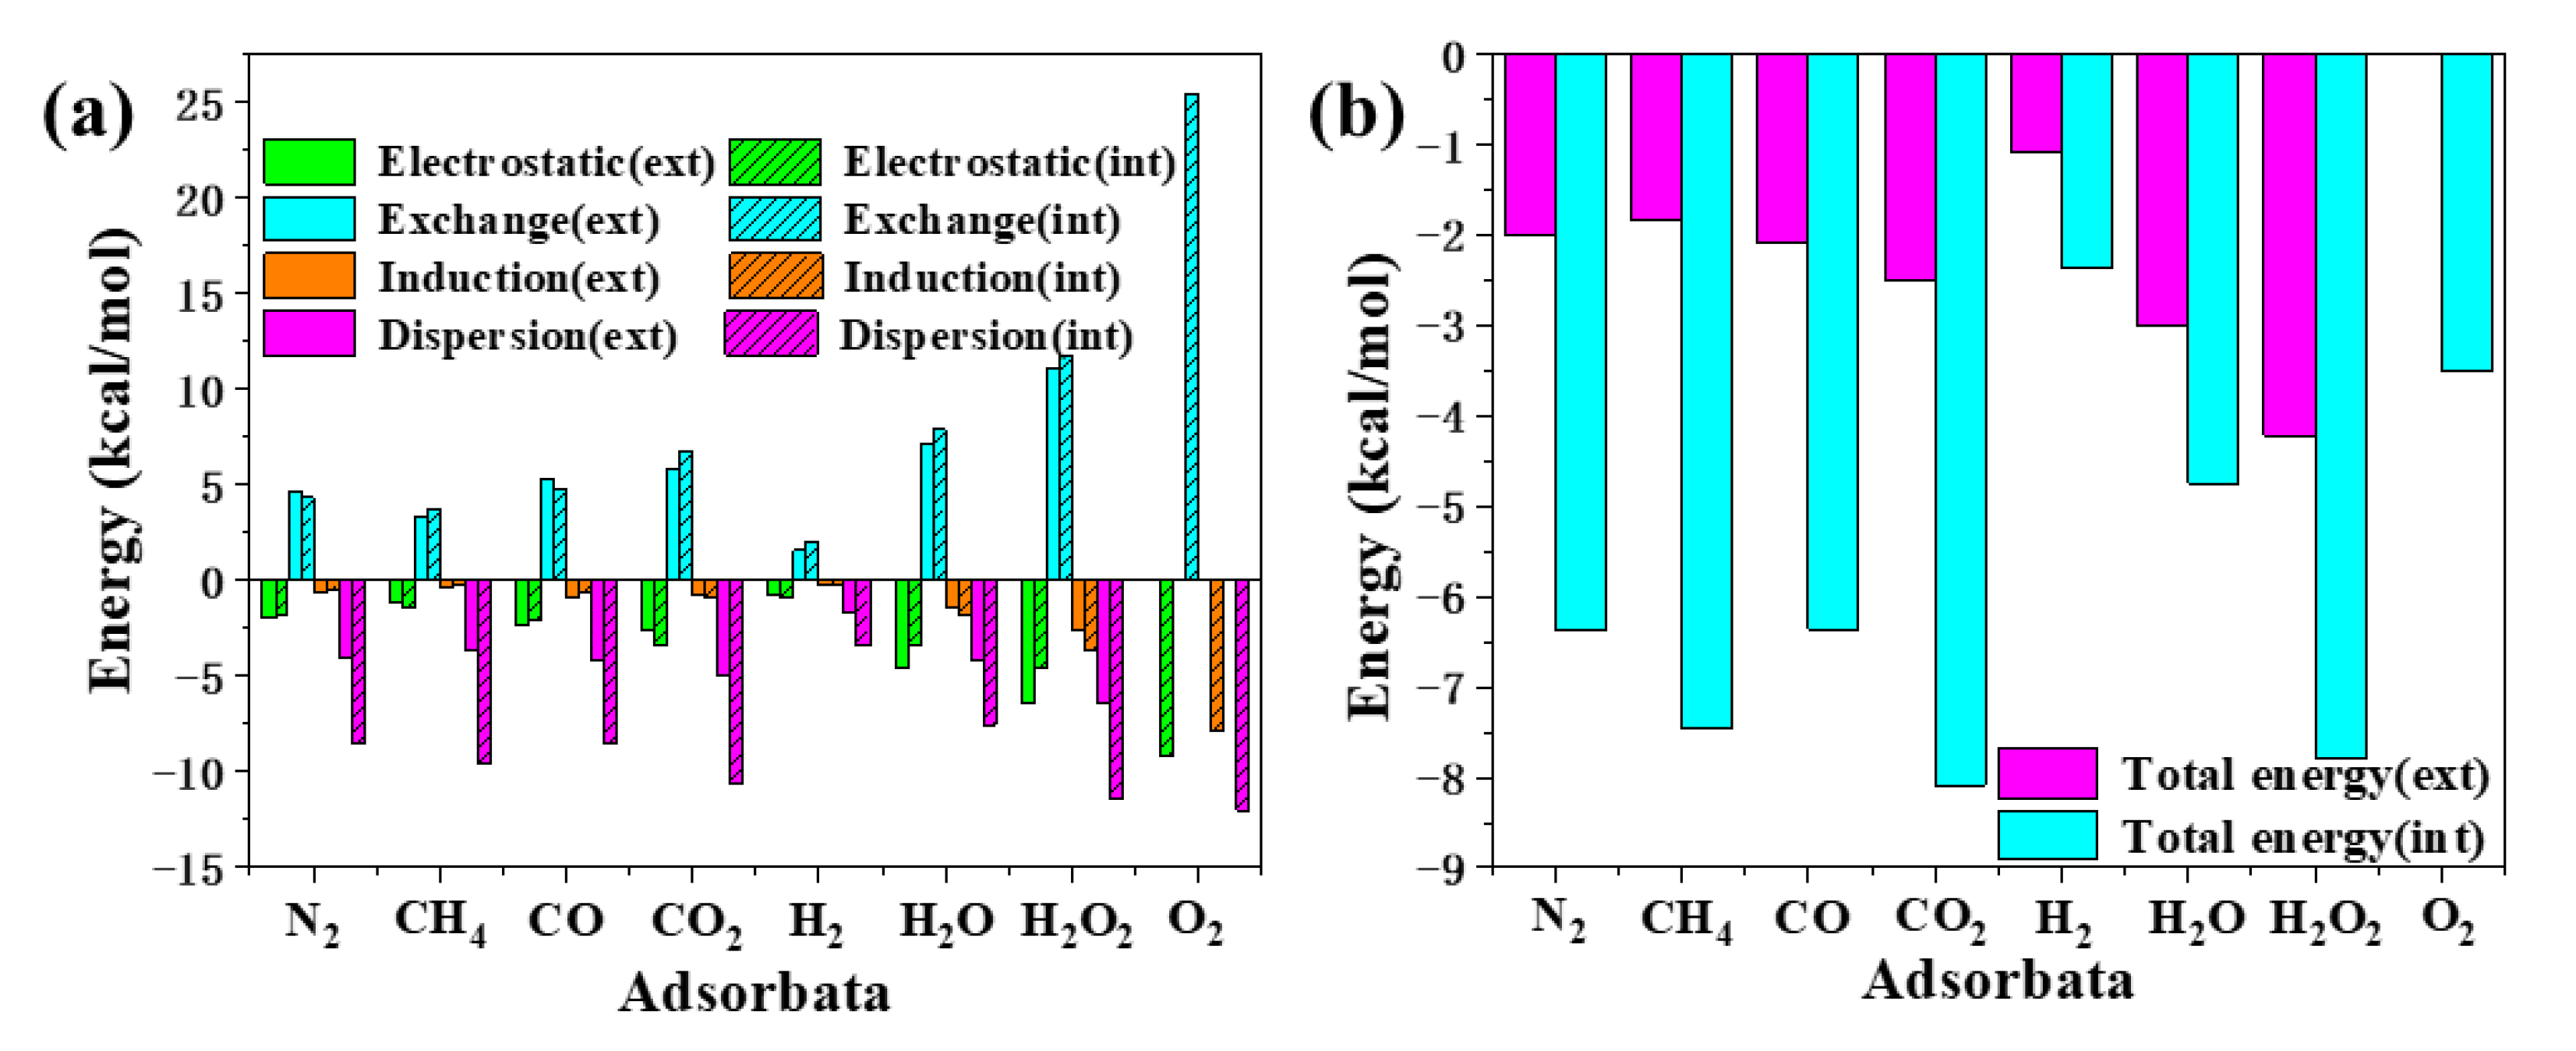
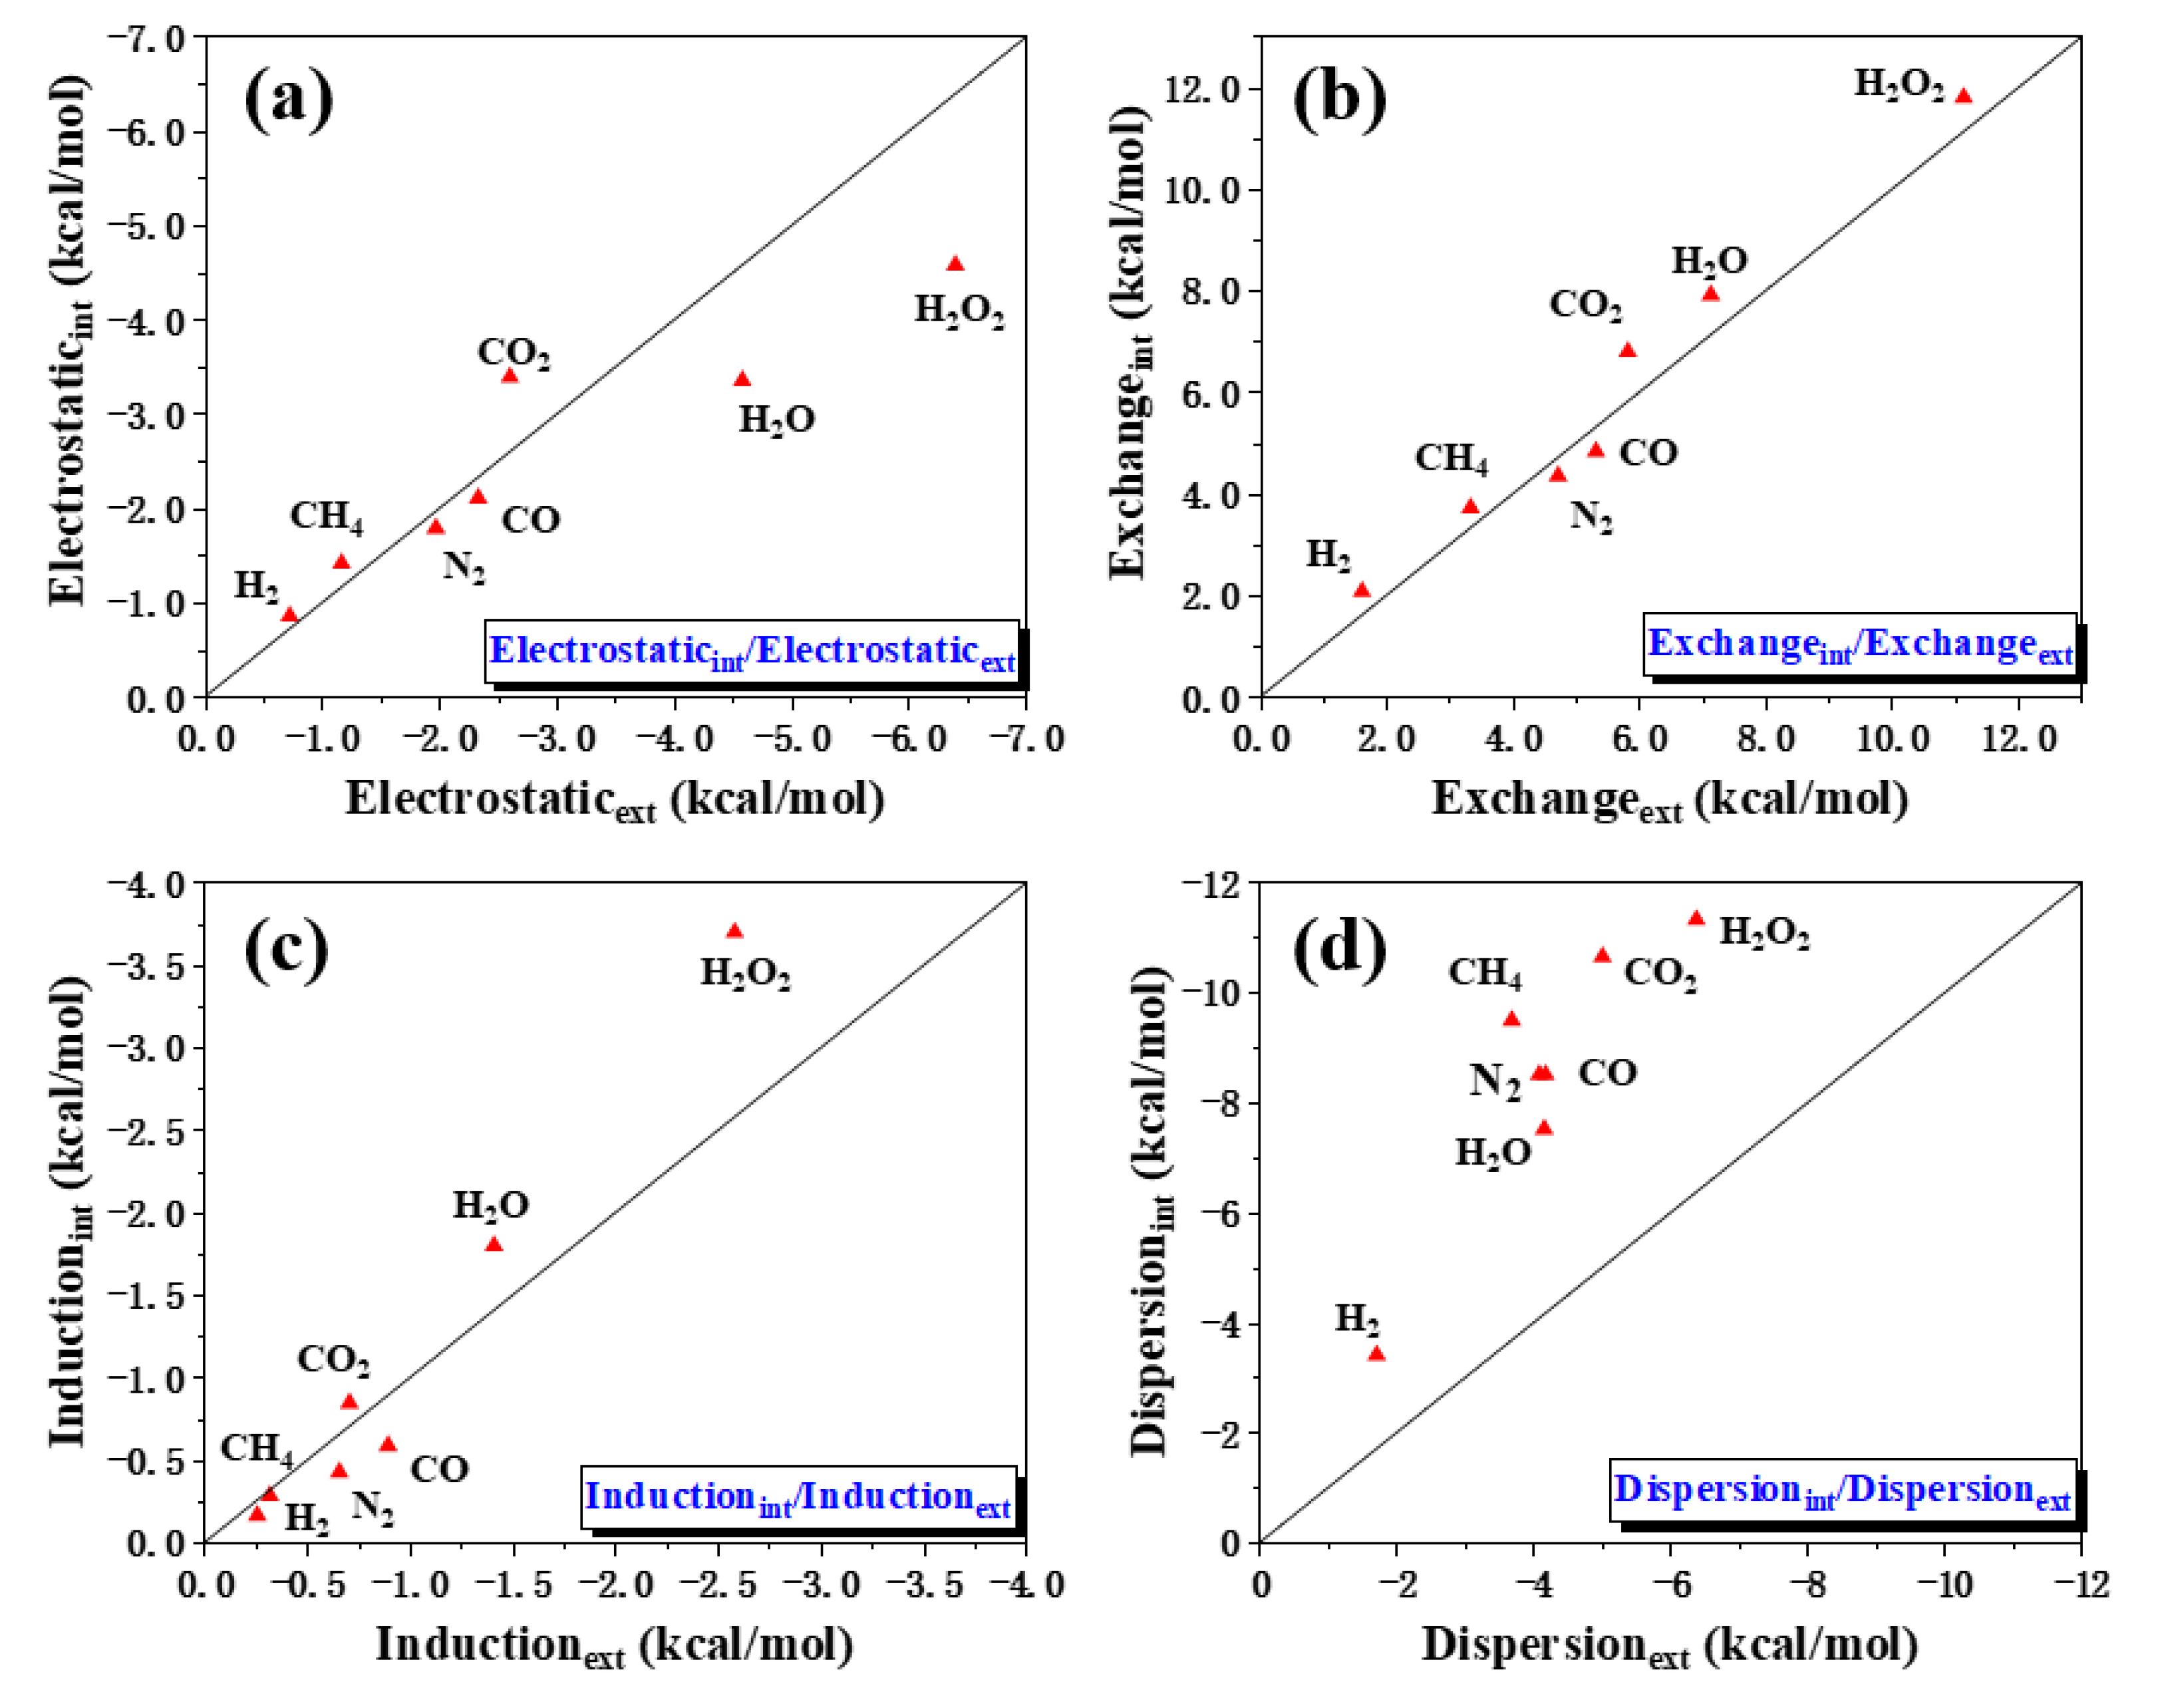
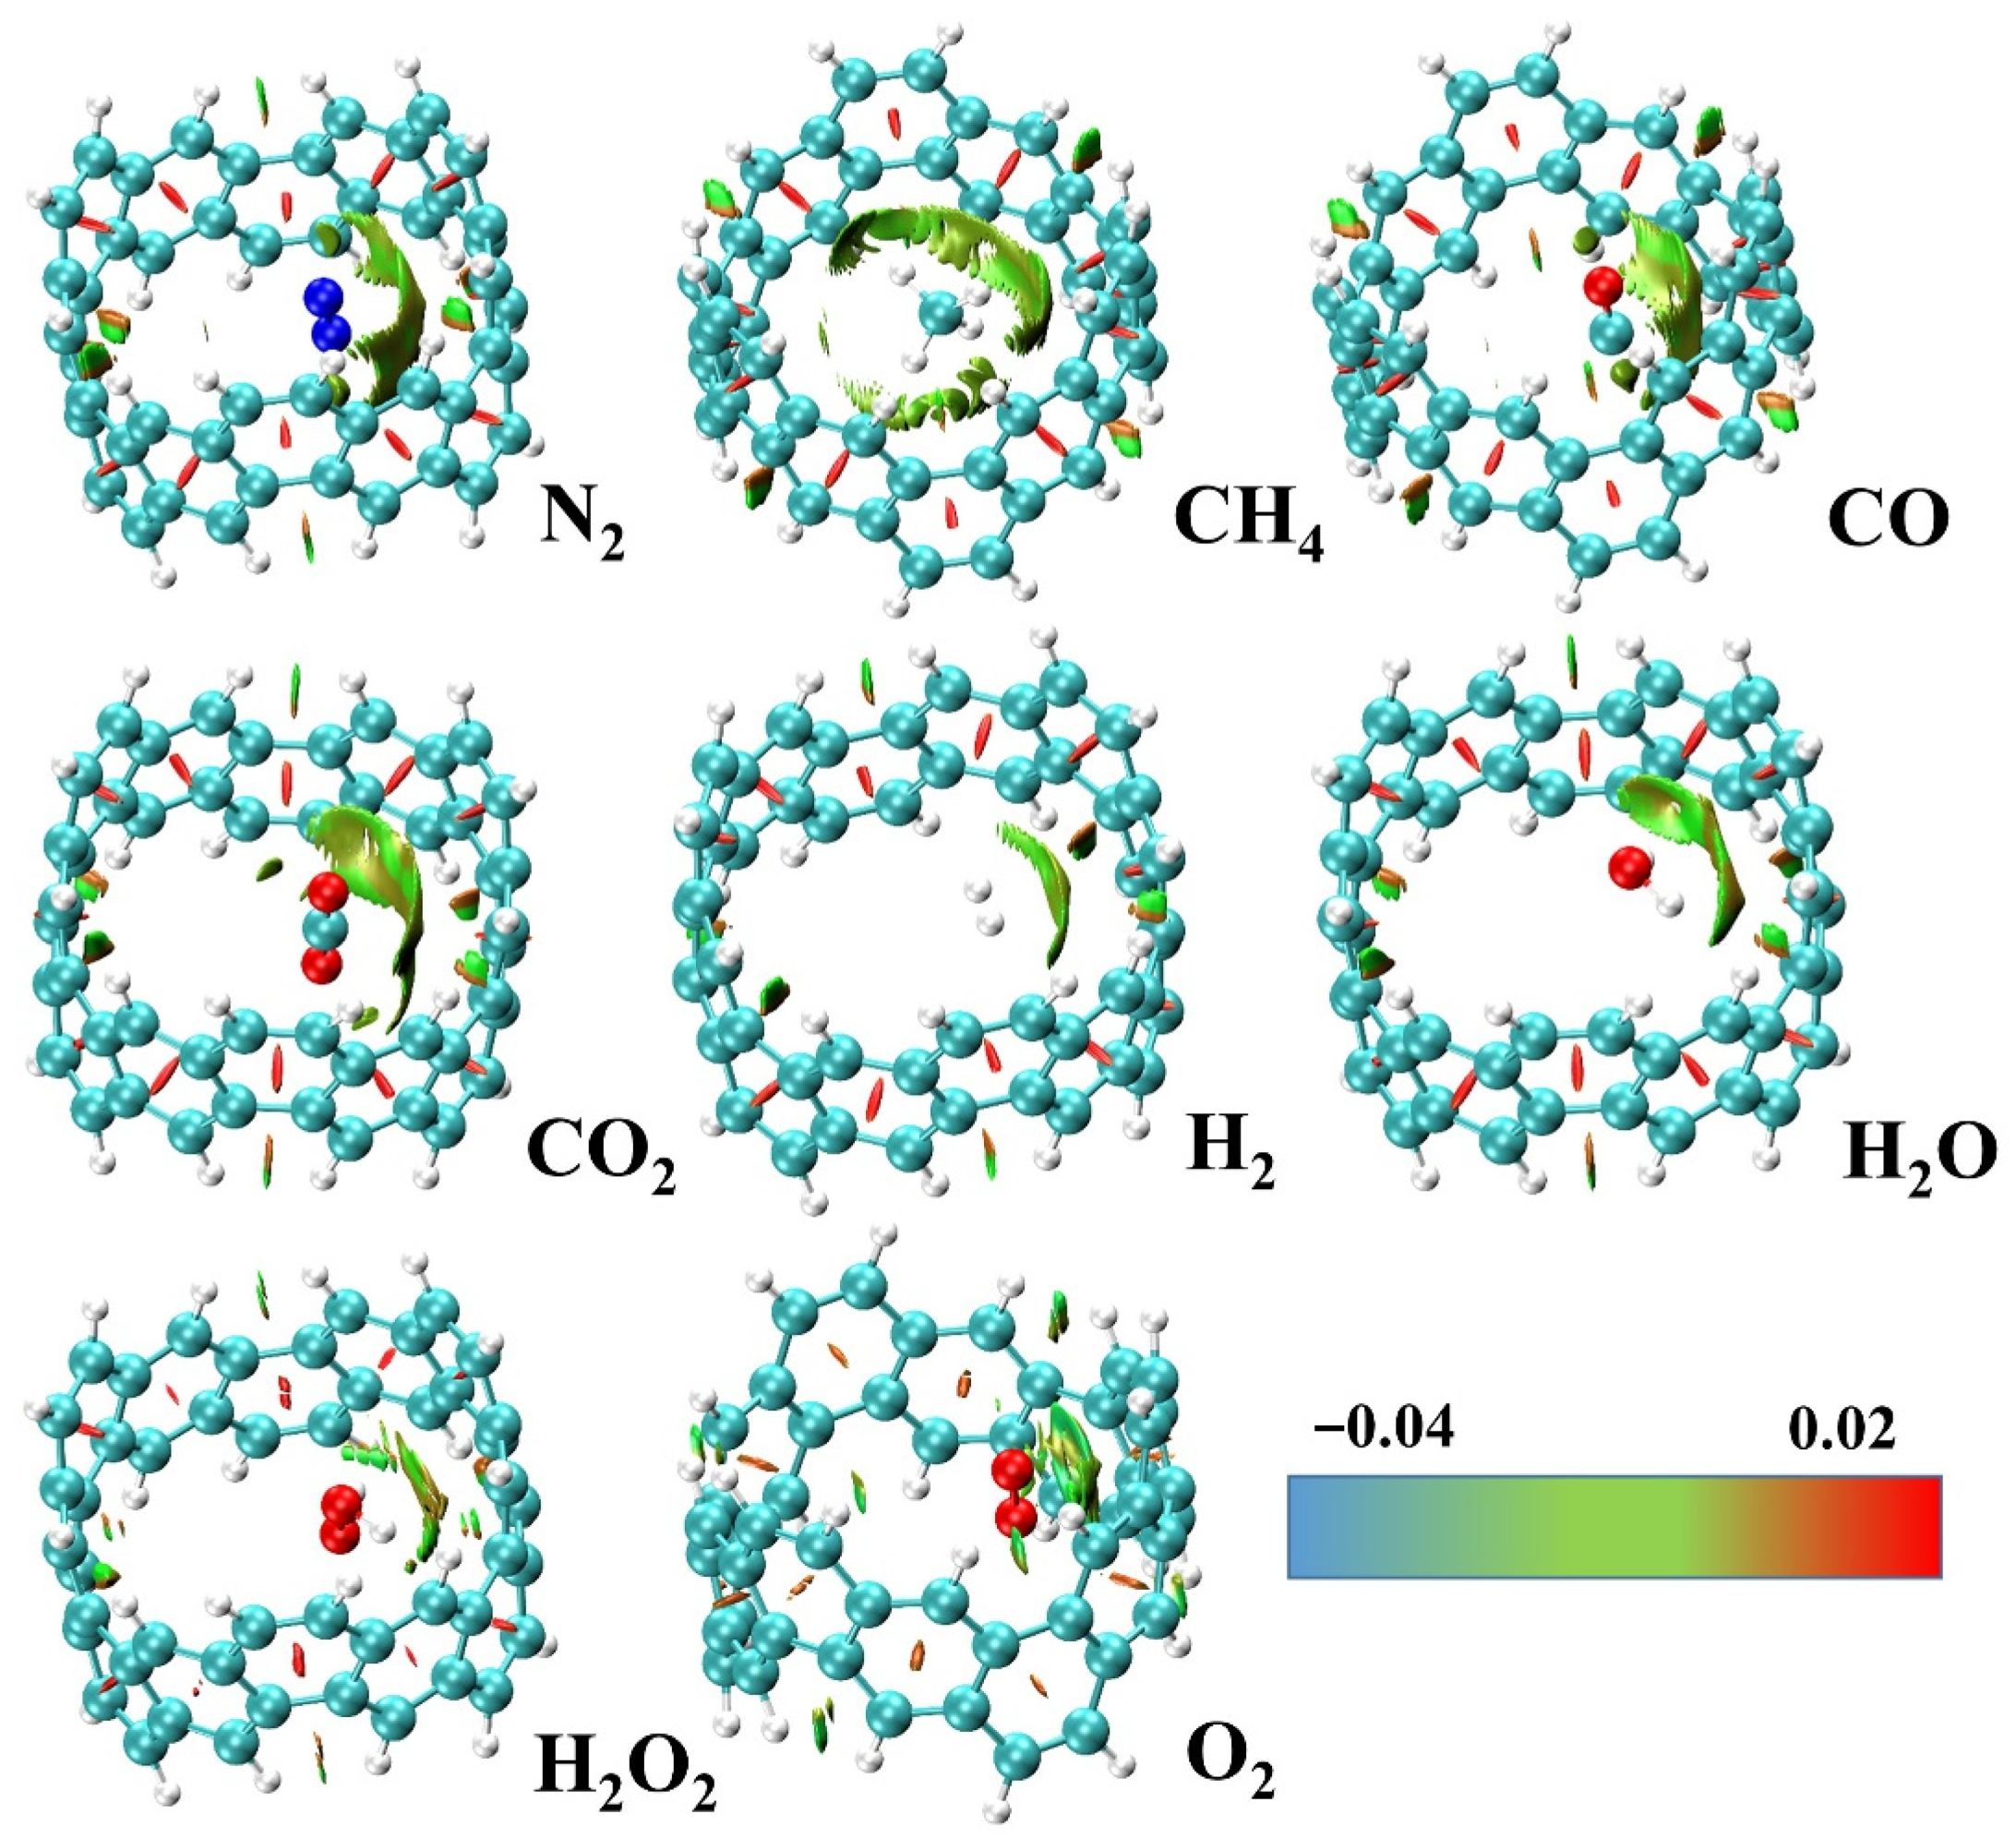
2.2. Adsorption and Energy Decomposition between [6, 6] CNB and Small Molecules

In order to study the nature of the adsorption configuration and interaction between [6, 6] CNB and different small molecules (The following is written as [6, 6] CNB&X, [6, 6] CNB&X(ext) and [6, 6] CNB&X(int), X is a small molecule), we optimized a series of configurations for small molecules adsorbed inside and outside [6, 6] CNB (Figure 4 and Figure 5). These small molecules include N2, CH4, CO, CO2, H2, H2O, H2O2 and O2.
Reduced Density Gradient (RDG) [38,39] is a widely used method for visualizing weak interactions. RDG is defined as:
R D G r   =   1 2 3 π 2 1 / 3 ρ r ρ r 4 / 3
where is the gradient operator, and ρ r is the modulus of the electron density gradient. Then, we projected the s i g n λ _ 2 ρ function, which was obtained by multiplying the ρ r and s i g n λ _ 2 functions, onto the RDG isosurface, and we could obtain the position, intensity and type of weak interaction. The principle is to map the s i g n λ _ 2 ρ function to the interaction isosurface to display different colors. The blue part represents the strong attraction, the green part represents the van der Waals action, and the red part represents the strong mutual repulsion. Because of the formation of covalent bonds between [6, 6] CNB&O2(ext) dimers, we used the IRI method [40] to show the chemical bond interaction. IRI is defined as:
I R I r = ρ r ρ r a
where is the gradient operator, and ρ r is the modulus of the electron density gradient. The parameter value a was 1.1, because at this time, it was ideal to exhibit chemical bonds and weak interactions at the same time. After that, we also projected the s i g n λ _ 2 ρ function onto the IRI isosurface to display color.
Symmetry-Adapted Perturbation Theory (SAPT) is currently a very widely used energy decomposition method for weak interactions [41,42,43]. It can decompose the interaction between fragments into different physical components (electrostatic, dispersion, exchange and induction). We combined the two methods to better study the nature of the interaction between [6, 6] CNB and small molecules.
It can be seen from Figure 4 and Figure 5 that the type of interaction between [6, 6] CNB&O2(ext) and other systems was obviously different. [6, 6] CNB&O2(ext) had a clear blue isosurface on the C–O bonds (in the black circle); this shows that the system had formed a C-O covalent bonds, and [6, 6] CNB was significantly deformed. In other systems, in addition to green, the isosurface of the interaction also presented a certain kind of red, which shows that there was a certain steric effect in addition to the van der Waals interaction. The interaction isosurfaces of systems were mainly green, which indicates that the electron density in this region was relatively low. It can be preliminarily concluded that the intermolecular interaction was mainly provided by dispersion because the electron density of the interaction dominated by electrostatic interaction was usually higher. In order to verify this conclusion, we used the psi4 program to perform energy decomposition calculations for all structures (except [6, 6] CNB&O2(ext)) based on the jun-cc-pVDZ basis set under the sSAPT0 level. Since this method is only suitable for weak interactions, we did not perform energy decomposition calculations for [6, 6] CNB&O2(ext). sSAPT0 is an empirically corrected version of SAPT0. Due to the better error offset when sSAPT0 is combined with jun-cc-pVDZ basis set, the accuracy of the result is significantly higher. For the system we studied, this combination can not only ensure the accuracy of the calculation, but also save as much time as possible.
The SAPT energy decomposition result is shown in Figure 6a. The abscissa was different small molecules, and the ordinate was the energy of different physical components of the interaction. Components with positive energy played a repulsive role in the adsorption process, while components with negative energy played an attractive role. It can be seen that the repulsive force in the adsorption of small molecules in all systems studied was dominated by exchange interaction. The intermolecular attraction was provided by electrostatic, dispersion and induction interaction. Among them, the induction interaction was relatively small, and the dispersion interaction was stronger than the electrostatic in most systems. This also confirms the conclusion drawn in the previous RGD analysis that the dispersion interaction is dominant in the adsorption process. Next, we will analyze the energy absorbed by [6, 6] CNB and small molecules in detail.
First of all, it was necessary to analyze the total energy of the interaction. The total energy can directly reflect the strength of adsorption between [6, 6] CNB and small molecules. As shown in Figure 6b, it can be seen that [6, 6] CNB&X(ext) and [6, 6] CNB&X(int) had a huge difference in total energy. The total energy of [6, 6] CNB&X(ext) was significantly greater than the total energy of [6, 6] CNB&X(int), and the biggest difference was seen for [6, 6] CNB&CH4, whose total energy of [6, 6] CNB&CH4(int) was 4.1 times that of [6, 6] CNB&CH4(ext). For [6, 6] CNB&N2, [6, 6] CNB&CO, [6, 6] CNB&CO2, [6, 6] CNB&H and [6, 6] CNB&H2O2, the ratio of the total energy absorbed inside and outside was 3.2, 3.1, 3.2, 2.2 and 1.6, respectively. It can be seen that the adsorption of small molecules at different positions of [6, 6] CNB had a great influence on the total energy of the interaction. This also shows that small molecules tend to be adsorbed inside [6, 6] CNB.
The position of small molecules in the adsorption process has such a great influence on the total energy of the interaction. In order to understand which composition the difference comes from, we processed the data of the different physical components of all systems. We drew a scatter diagram of the four physical components with the energy absorbed inside as the ordinate and the energy absorbed outside as the abscissa and show the y = x curve. These graphs proficiently express the degree of changes in the energy of small molecules adsorbed inside and outside the [6, 6] CNB. It can be clearly seen from Figure 7 that the points of electrostatic (Figure 3a), exchange (Figure 3b) and induction (Figure 3c) are evenly distributed on both sides of the y = x curve, while the points of dispersion (Figure 3d) are all above the y = x curve. This shows that the different adsorption positions of small molecules had less influence on the electrostatic, exchange and induction interactions in the intermolecular interaction, but had a greater influence on the dispersion interaction. It is not difficult to see that the dispersion interaction of [6, 6] CNB&X(int) was significantly stronger than [6, 6] CNB&X(ext), which was also the main source of the huge difference in total energy.
In order to clearly understand the importance of dispersion interaction in [6, 6] CNB&X, we calculated the value of a t t r d i s / a t t r t o t in all systems (Table 1). In this way, we could intuitively come to understand the contribution of the dispersion interaction in the intermolecular adsorption. The value of a t t r d i s / a t t r t o t in [6, 6] CNB&X(ext) was 41~71%, and the value of a t t r d i s / a t t r t o t in [6, 6] CNB&X(int) was significantly increased at 41~85%. Additionally, for the same small molecule, the proportion of dispersion interaction of [6, 6] CNB&X(int) was always higher than that of [6, 6] CNB&X(ext).

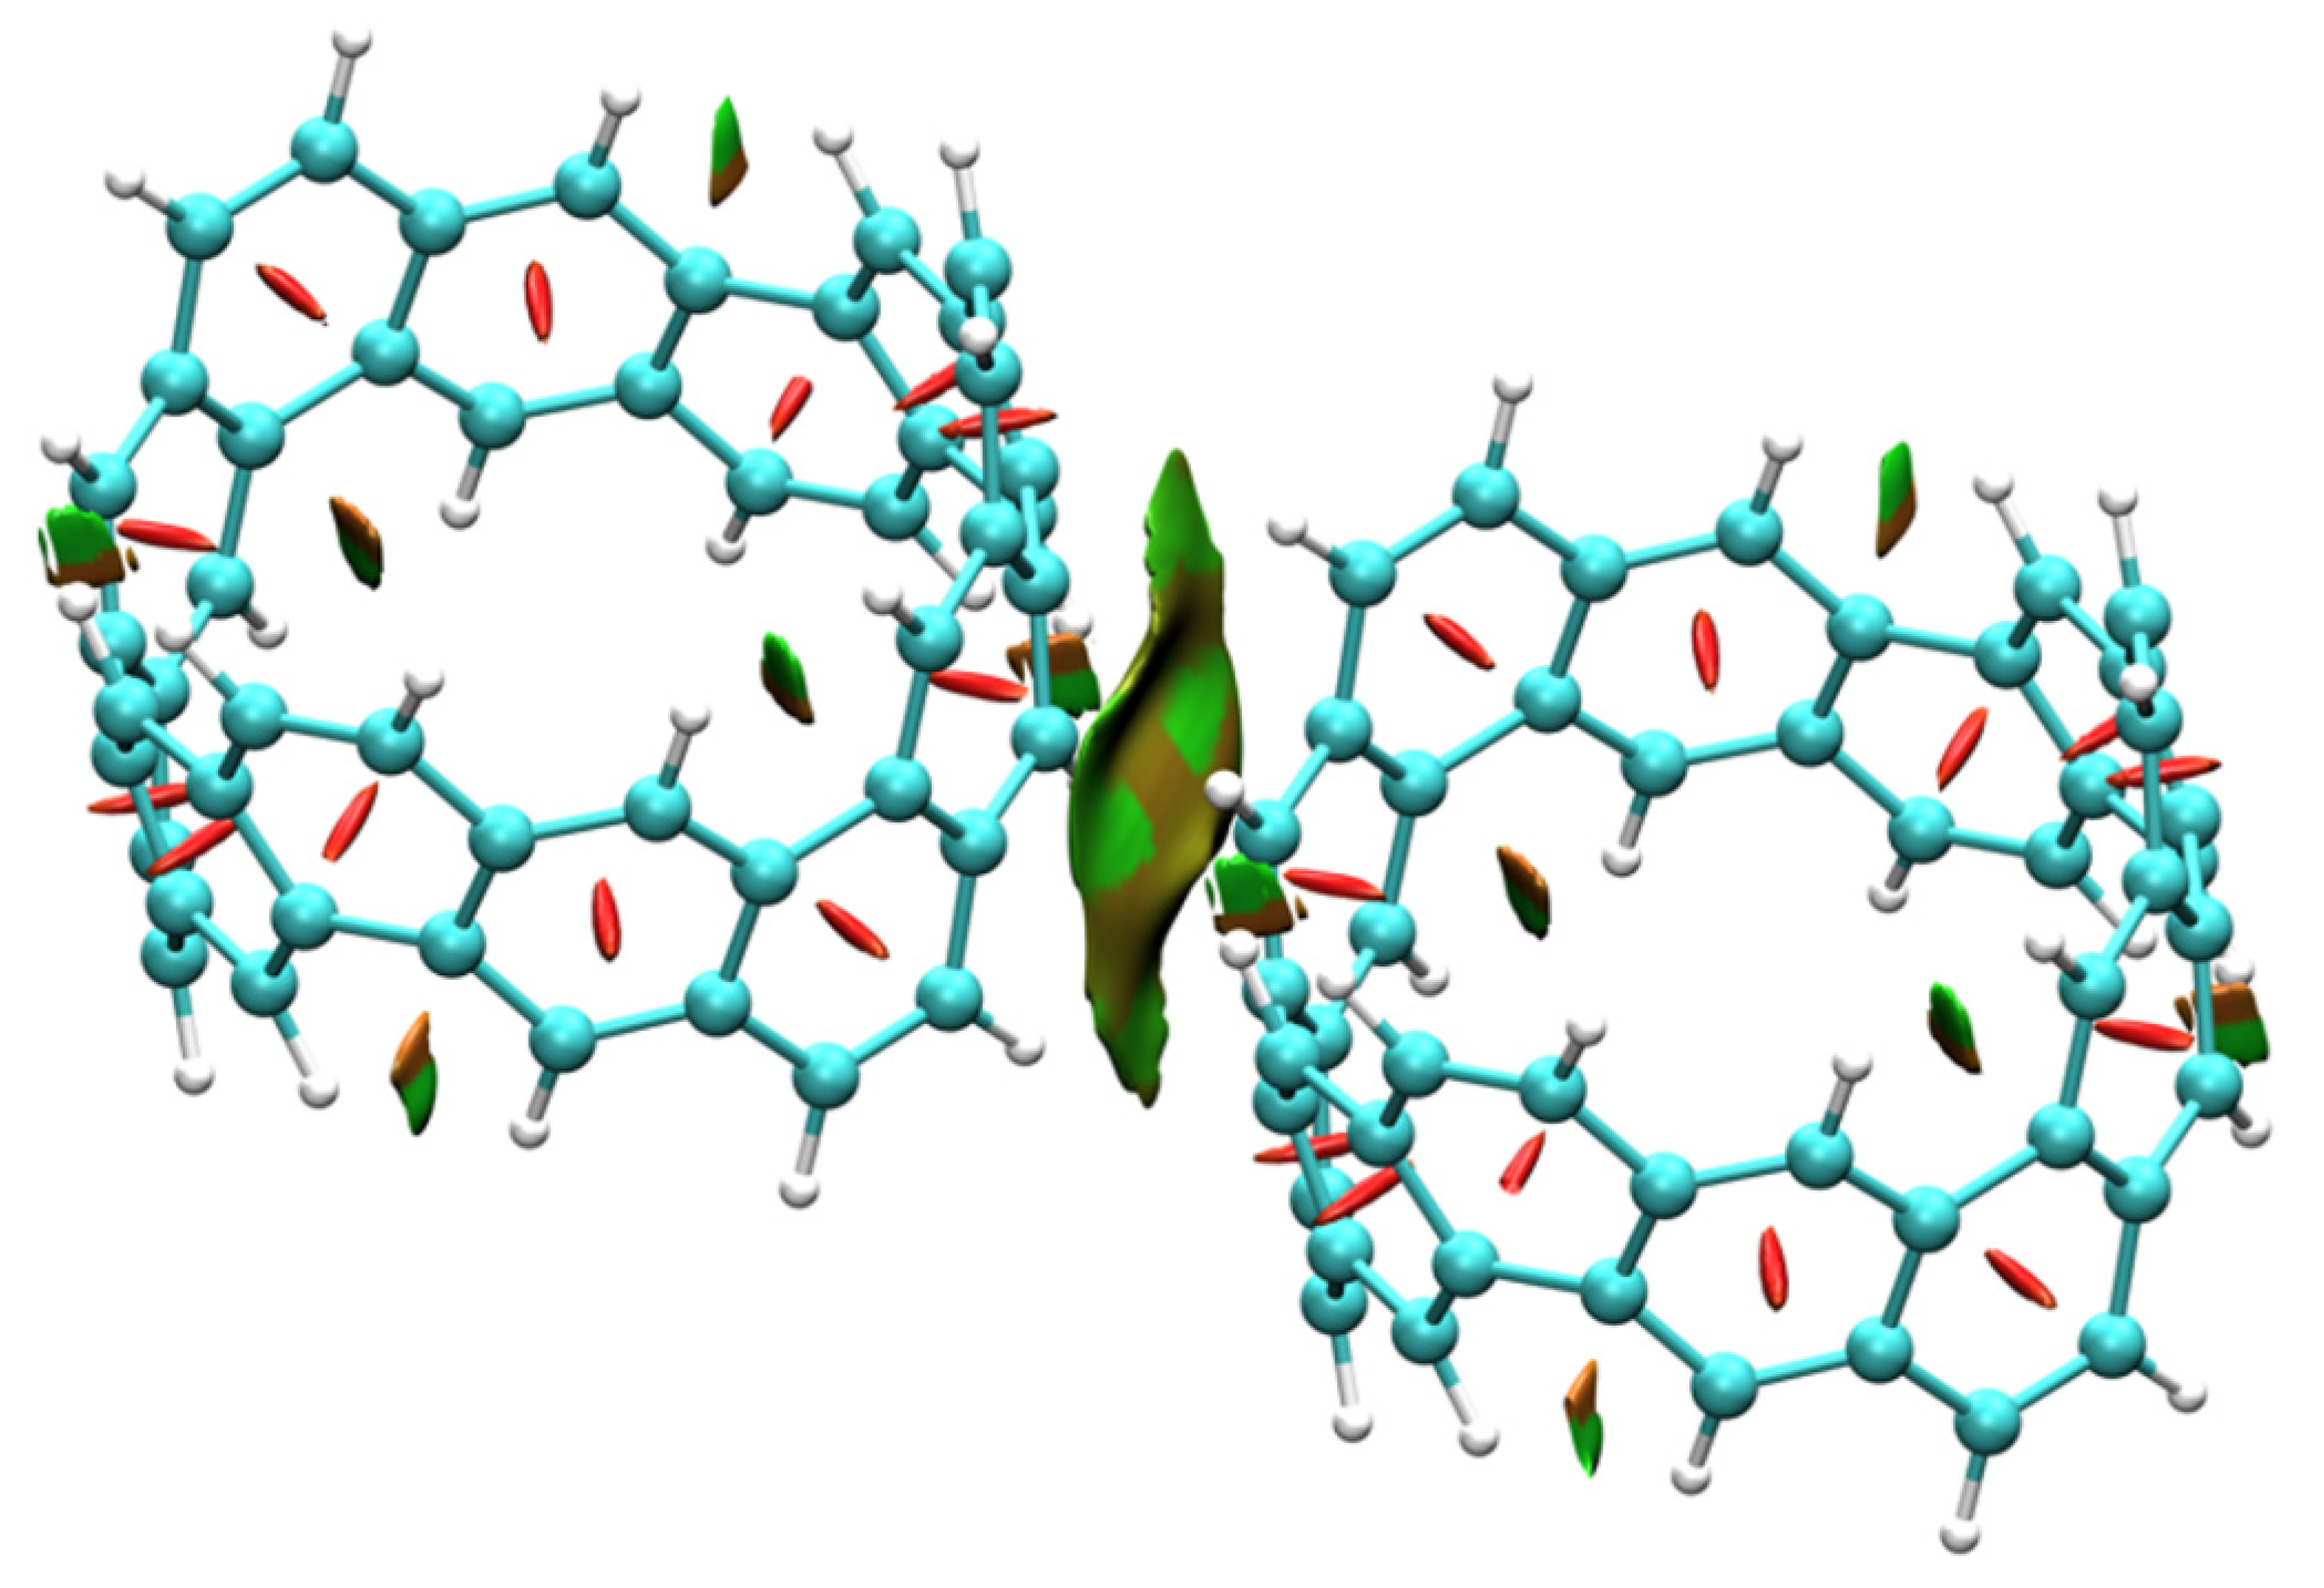
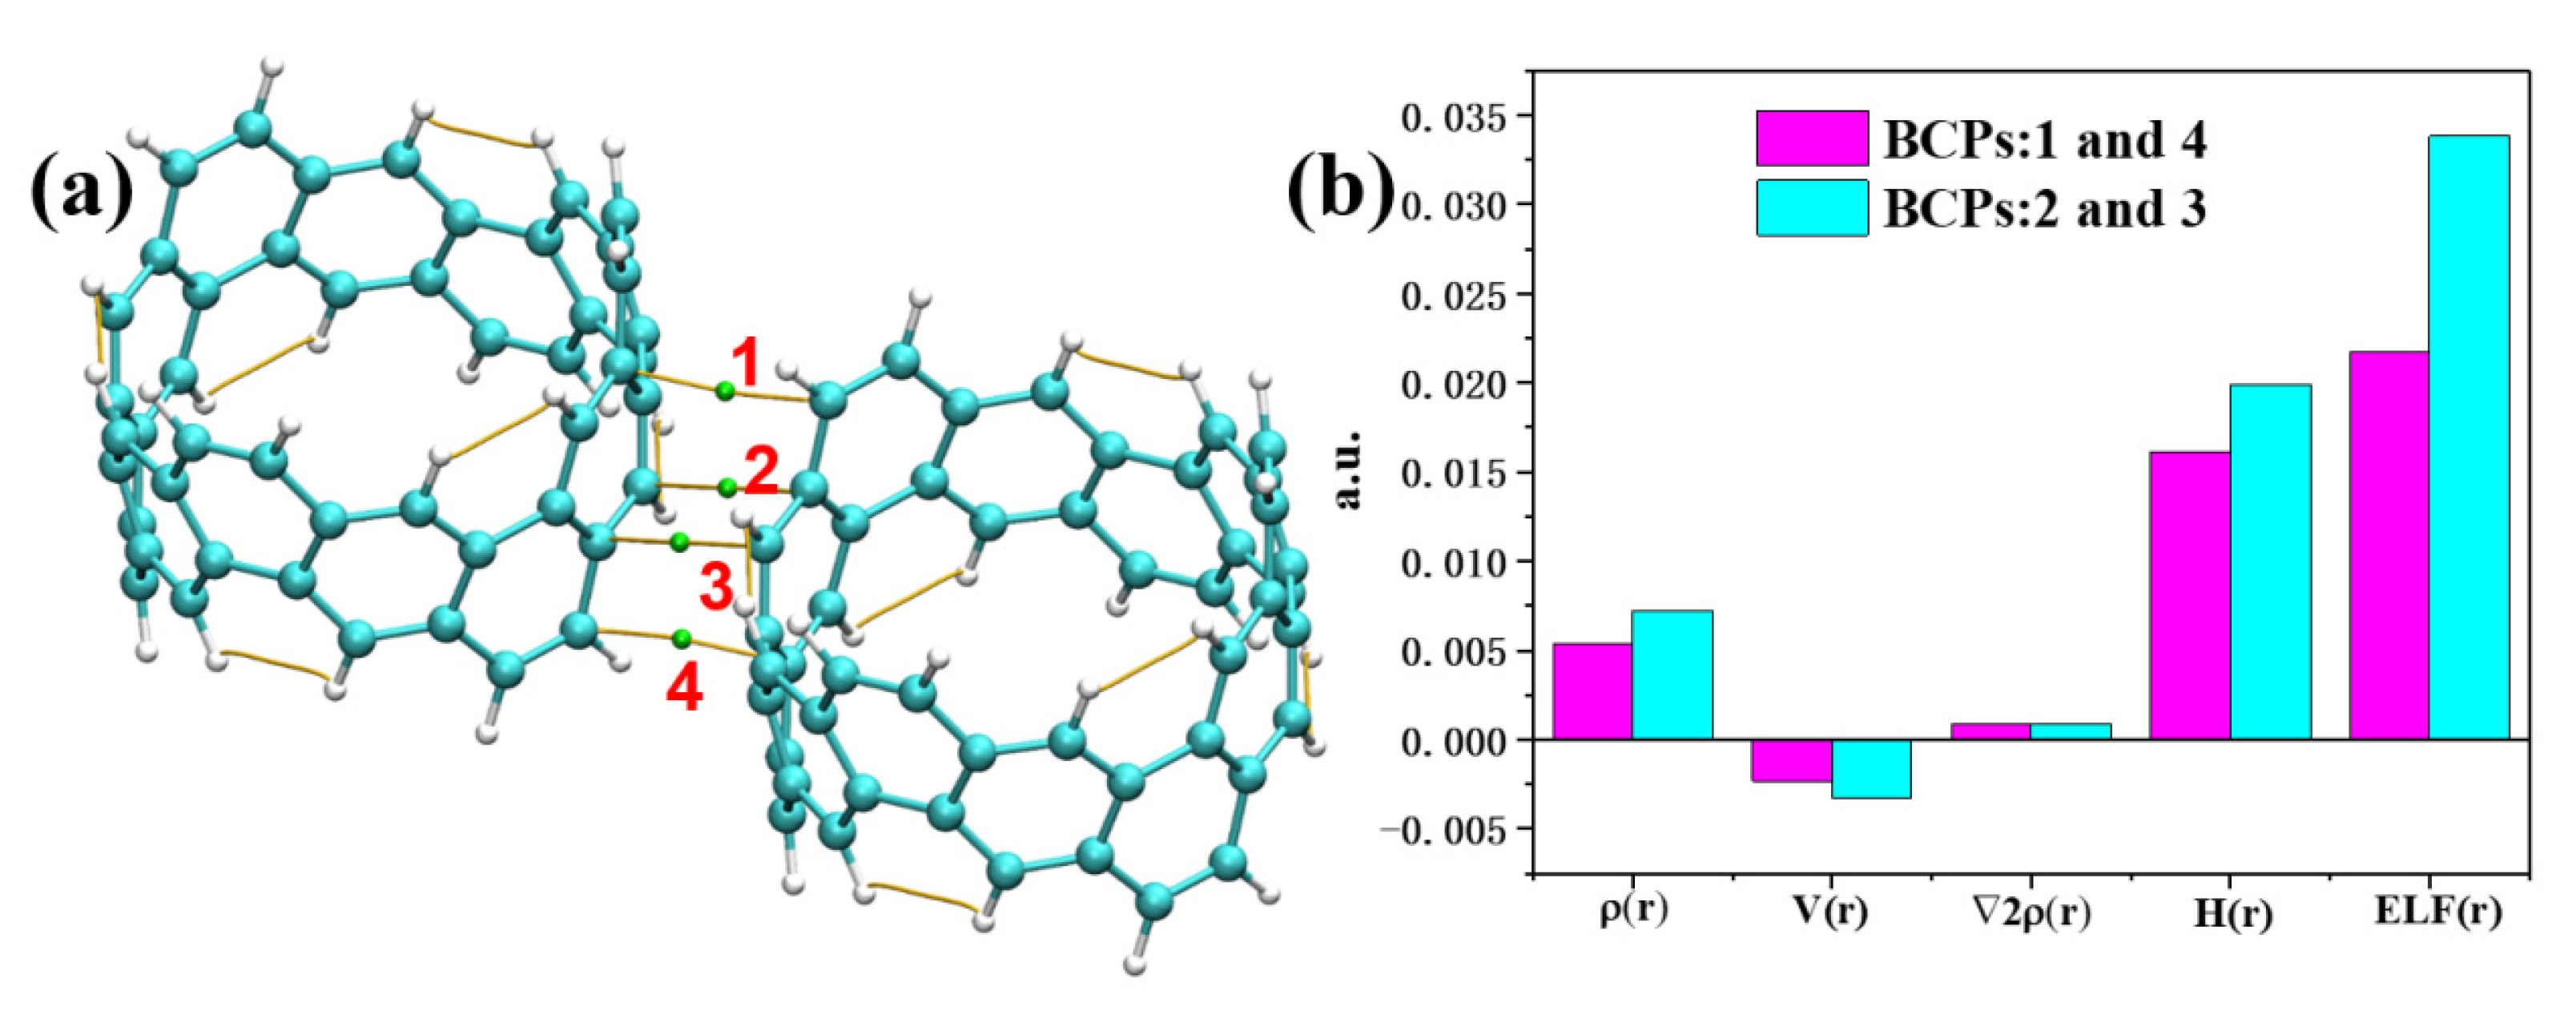
2.3. Intermolecular Interactions of [6, 6] CNB Dimer

In a high-concentration environment, the main form of [6, 6] CNB is likely to be a dimer system. Therefore, it was very important to study the interaction between [6, 6] CNB dimers. In this section, we present the results for the intermolecular interactions of [6, 6] CNB dimers and real-space functions such as electron density at bond critical points.
The optimized [6, 6] CNB dimer exhibited a staggered and juxtaposed structure, and the vertical distance between molecules was 3.10 Å. Since the stacking interactions between dimers were weak interactions, the intermolecular interactions had no obvious effect on the electronic structure of monomers. Next, we decomposed the interaction energies of [6, 6] CNB dimers again using RDG and SAPT energy decomposition methods to investigate the nature of intermolecular interactions. As shown in Figure 8, the isosurface of the intermolecular interaction of the dimer was green and accompanied by red, which indicates that the intermolecular interaction was dominated by the dispersion interaction, accompanied by a certain steric effect. The energy decomposition results are shown in Table 2. The dispersive interaction was the main source of the attraction between dimers, accounting for 70%, followed by the electrostatic interaction (23%), and the smallest contribution to the mutual attraction was the induction interaction at only 7%. Quantum theory of atoms in molecules (QTAIM) is another very popular method for analyzing weak interactions. QTAIM is a method to quantitatively study weak intermolecular interactions by analyzing intermolecular bond critical points (BCPs). The QTAIM theory also defines the intermolecular interaction pathways (yellow lines in Figure 9). Since we only focused on intermolecular interactions, we only provided four BCPs between molecules. The BCP 1 and BCP 4 were equivalent, and the BCP 2 and BCP 3 were equivalent. We calculated the electron density ( ρ ), the potential energy density (V), the laplacian of the electron density ( 2 ρ ), the energy density (H) and the electron localization function (ELF) at the BCPs. The electron density and potential energy density at the BCPs were closely related to the strength of the interaction between atoms. The potential energy density reflected the external potential felt by the electron and was negative. It is generally believed that the greater the electron density and the more negative the potential energy density, the stronger the chemical bond strength between atoms. So, the bond strength of BCP 2 was significantly stronger than that of BCP 1. The 2 ρ is usually used to determine the type of chemical bonds. A positive value of 2 ρ indicates that a non-covalent bond is formed between atoms, and a negative value of 2 ρ indicates that a covalent bond is formed. It was obvious that the 2 ρ at the BCPs were all negative, which indicates that non-covalent bonds were formed between atoms. Energy density reflects the energy of electrons, and the positive and negative energy density can also be used to determine the type of chemical bond. A positive H is believed to form a non-covalent bond, and a negative H represents the formation of a covalent bond. The analysis results are the same as the conclusions drawn by 2 ρ . The ELF reflects the degree of electron localization at the BCPs. It can be seen that the localization degree of BCP 2 was significantly stronger than that of BCP 1.

3. Calculation Method

In this work, through density functional theory (DFT) [44], we used the Gaussian 16 program [45] to optimize all dimers based on B3LYP functional [46] and a def2-SVP basis set [47] combined with DFT-D3 dispersion correction [48]. We performed structural optimization through different initial structures. The most stable structures for internal adsorption and external adsorption were selected, respectively. The calculation of electrostatic potential, van der Waals potential, RDG and IRI was completed by the wave function analysis program Multiwfn [49]. The SAPT energy decomposition adopts the psi4 program [50], which was calculated based on the sSAPT0 level combined with the jun-cc-pVDZ basis set. sSAPT0 is a corrected version of SAPT0. It can be used with the jun-cc-pVDZ basis set to offset errors and obtain higher accuracy, and it is called copper level [51]. All the structural diagrams in this work were drawn by the Visual Molecular Dynamics (VMD) program [52]. Since our focus did not involve solvent effects, all calculations were performed under vacuum conditions.

4. Conclusions

In this work, we investigated the interaction of [6, 6] CNB with the external environment from a theoretical level. The molecular polarity index was proposed to describe the polarity of [6, 6] CNB and to explore the interaction between the molecular local electric field and the external environment. On the other hand, we investigated the interaction of a series of small molecules commonly used in the field of energy catalysis adsorbed on different sites (inside and outside the system) of [6, 6] CNB. We used RDG and SAPT energy decomposition methods to deeply investigate the nature of the interactions between [6, 6] CNBs and small molecules. Electrostatic potential and MPI index analysis showed that [6, 6] CNB had a certain polarity, and the interaction of the molecular local electric field could be ignored during the adsorption process. Furthermore, the van der Waals potential showed huge differences in van der Waals roles inside and outside the [6, 6] CNB. Therefore, the two adsorption modes (internal and external) had little effect on the contribution of electrostatic interactions in adsorption, but a greater effect on dispersive interactions. Among the dimers of [6, 6] CNB and small molecules, [6, 6] CNB&O2(ext) is special. When O2 was adsorbed on the outside of [6, 6] CNB, a covalent bond was formed between the two, and the [6, 6] CNB was obviously deformed. Theoretical analysis shows that small molecules tend to adsorb inside [6, 6] CNB, which is mainly due to the significantly stronger dispersion interaction of adsorption inside [6, 6] CNB than outside. Weak interactions are ubiquitous and are necessary to describe many physical, chemical and biochemical phenomena. Clarifying the physical components of weak intermolecular interactions is crucial for the performance and selectivity of molecular catalysts. The theoretical analysis of this work established the structure–activity relationship between the structure and interaction properties of [6, 6] CNB, which provides theoretical guidance for practical applications in molecular sensing, catalysis and energy fields, and helps to promote the design and application of CNB materials.

Author Contributions

Conceptualization, J.W. and C.L. (Cunlei Li); methodology, J.W.; software, C.L. (Chen Lu); validation, P.C.; formal analysis, P.C.; investigation, P.C.; resources, C.L. (Chen Lu); data curation, C.L. (Chen Lu); writing—original draft preparation, C.L. (Chen Lu); writing—review and editing, C.L. (Chen Lu); visualization, J.W. All authors have read and agreed to the published version of the manuscript.

Funding

This research was funded by the scientific research project of the Education Department of Liaoning Province, grant number L2020008.

Data Availability Statement

Not applicable.

Conflicts of Interest

The authors declare no conflict of interest.

References

  1. Dahl, J.A.; Maddux, B.L.S.; Hutchison, J.E. Toward greener nanosynthesis. Chem. Rev. 2007, 107, 2228–2269. [Google Scholar] [CrossRef] [PubMed] [Green Version]
  2. Song, H.; Wang, Y.; Liu, Y.; Chen, L.; Feng, B.; Jin, X.; Zhou, Y.; Huang, T.; Xiao, M.; Huang, F.; et al. Conferring poly (ionic liquid) s with high surface areas for enhanced catalytic activity. ACS Sustain. Chem. Eng. 2021, 9, 2115–2128. [Google Scholar] [CrossRef]
  3. Scida, K.; Stege, P.W.; Haby, G.; Messina, G.A.; García, C.D. Recent applications of carbon-based nanomaterials in analytical chemistry: Critical review. Anal. Chim. Acta 2011, 691, 6–17. [Google Scholar] [CrossRef] [Green Version]
  4. Miao, W.; Wang, L.; Mu, X.; Wang, J. The magical photoelectric and optoelectronic properties of graphene nanoribbons and their applications. J. Mater. Chem. C 2021, 9, 13600–13616. [Google Scholar] [CrossRef]
  5. Wang, J.; Mu, X.; Sun, M.; Mu, T. Optoelectronic properties and applications of graphene-based hybrid nanomaterials and van der waals heterostructures. Appl. Mater. Today 2019, 16, 1–20. [Google Scholar] [CrossRef]
  6. Wang, J.; Song, J.; Mu, X.; Sun, M. Optoelectronic and photoelectric properties and applications of graphene-based nanostructures. Mater. Today Phys. 2020, 13, 100196. [Google Scholar] [CrossRef]
  7. Wang, J.; Mu, X.; Wang, L.; Sun, M. Properties and applications of new superlattice: Twisted bilayer graphene. Mater. Today Phys. 2019, 9, 100099. [Google Scholar] [CrossRef]
  8. Song, J.; Zhang, Z.; Feng, N.; Wang, J. Electric field induced twisted bilayer graphene infrared plasmon spectrum. Nanomaterials 2021, 11, 2433. [Google Scholar] [CrossRef]
  9. Wang, J.; Bo, W.; Ding, Y.; Wang, X.; Mu, X. Optical, optoelectronic, and photoelectric properties in moire superlattices of twist bilayer graphene. Mater. Today Phys. 2020, 14, 100238. [Google Scholar] [CrossRef]
  10. Chen, X.; Lu, C.; Wang, L.; Wang, J.; Spectroscopy, B. Angle-resolved one and two-photon absorption spectrum in twisted bilayer graphene quantum dots. Spectrochim. Acta Part A Mol. Biomol. Spectrosc. 2022, 271, 120894. [Google Scholar] [CrossRef]
  11. Kong, W.; Liu, F.; Liu, Y. Design of nitrogen-doped graphitized 2d hierarchical porous carbons as efficient solid base catalysts for transesterification to biodiesel. Green Chem. 2020, 22, 903–912. [Google Scholar] [CrossRef]
  12. Peyvandi, A.; Soroushian, P.; Abdol, N.; Balachandra, A.M. Surface-modified graphite nanomaterials for improved reinforcement efficiency in cementitious paste. Carbon 2013, 63, 175–186. [Google Scholar] [CrossRef]
  13. Mauter, M.S.; Elimelech, M. Environmental applications of carbon-based nanomaterials. Environ. Sci. Technol. 2008, 42, 5843–5859. [Google Scholar] [CrossRef] [PubMed]
  14. Qin, X.; Huang, Y.; Wang, K.; Xu, T.; Li, S.; Zhao, M.; Wang, Y.; Chen, Q. Novel hexagonal Bi2O2CO3 porous nanoplate/nitrogen-doped graphene nanomaterials with enhanced electrochemical properties for oxygen reduction reaction in acidic media for fuel cells. Carbon 2019, 152, 459–473. [Google Scholar] [CrossRef]
  15. Li, D.; Hu, X.; Zhang, S. Biodegradation of graphene-based nanomaterials in blood plasma affects their biocompatibility, drug delivery, targeted organs and antitumor ability. Biomaterials 2019, 202, 12–25. [Google Scholar] [CrossRef]
  16. Zhang, C.; Chen, W.; Alvarez, P.J.J. Manganese peroxidase degrades pristine but not surface-oxidized (carboxylated) single-walled carbon nanotubes. Environ. Sci. Technol. 2014, 48, 7918–7923. [Google Scholar] [CrossRef]
  17. Rodriguez-Reinoso, F. The role of carbon materials in heterogeneous catalysis. Carbon 1998, 36, 159–175. [Google Scholar] [CrossRef]
  18. Rideal, E.K.; Wright, W.M. Clxxxiv.—Low temperature oxidation at charcoal surfaces. Part I. The behaviour of charcoal in the absence of promoters. J. Chem. Soc. Trans. 1925, 127, 1347–1357. [Google Scholar] [CrossRef]
  19. Fan, F.R.; Wang, R.; Zhang, H.; Wu, W. Emerging beyond-graphene elemental 2d materials for energy and catalysis applications. Chem. Soc. Rev. 2021, 50, 10983–11031. [Google Scholar] [CrossRef]
  20. Povie, G.; Segawa, Y.; Nishihara, T.; Miyauchi, Y.; Itami, K. Synthesis of a carbon nanobelt. Science 2017, 356, 172–175. [Google Scholar] [CrossRef]
  21. Abd El Sater, M.; Jaber, N.; Schulz, E. Chiral salen complexes for asymmetric heterogeneous catalysis: Recent examples for recycling and cooperativity. ChemCatChem 2019, 11, 3662–3687. [Google Scholar] [CrossRef] [Green Version]
  22. Machado, I.V.; Dos Santos, J.R.N.; Januario, M.A.P.; Corrêa, A.G. Greener organic synthetic methods: Sonochemistry and heterogeneous catalysis promoted multicomponent reactions. Ultrason. Sonochemistry 2021, 78, 105704. [Google Scholar] [CrossRef] [PubMed]
  23. Tahir, M.; Amin, N.S. Advances in visible light responsive titanium oxide-based photocatalysts for co2 conversion to hydrocarbon fuels. Energy Convers. Manag. 2013, 76, 194–214. [Google Scholar] [CrossRef]
  24. Kondratenko, E.V.; Mul, G.; Baltrusaitis, J.; Larrazábal, G.O.; Pérez-Ramírez, J. Status and perspectives of co 2 conversion into fuels and chemicals by catalytic, photocatalytic and electrocatalytic processes. Energy Environ. Sci. 2013, 6, 3112–3135. [Google Scholar] [CrossRef] [Green Version]
  25. Li, K.; Peng, B.; Peng, T. Recent advances in heterogeneous photocatalytic CO2 conversion to solar fuels. ACS Catal. 2016, 6, 7485–7527. [Google Scholar] [CrossRef]
  26. Wu, D.; Deng, K.; Hu, B.; Lu, Q.; Liu, G.; Hong, X. Plasmon-assisted photothermal catalysis of low-pressure CO2 hydrogenation to methanol over Pd/ZnO catalyst. ChemCatChem 2019, 11, 1598–1601. [Google Scholar] [CrossRef]
  27. Hou, W.; Hung, W.H.; Pavaskar, P.; Goeppert, A.; Aykol, M.; Cronin, S.B. Photocatalytic conversion of co2 to hydrocarbon fuels via plasmon-enhanced absorption and metallic interband transitions. ACS Catal. 2011, 1, 929–936. [Google Scholar] [CrossRef]
  28. Koshy, D.M.; Nathan, S.S.; Asundi, A.S.; Abdellah, A.M.; Dull, S.M.; Cullen, D.A.; Higgins, D.; Bao, Z.; Bent, S.F.; Jaramillo, T.F. Bridging thermal catalysis and electrocatalysis: Catalyzing co2 conversion with carbon-based materials. Angew. Chem. Int. Ed. 2021, 60, 17472–17480. [Google Scholar] [CrossRef]
  29. Xiao, G.; Wang, L.; Mu, X.; Zou, X.; Wu, Y.; Cao, J. Lead and iodide fixation by thiol copper (II) porphyrin for stable and environmental-friendly perovskite solar cells. CCS Chem. 2021, 3, 25–36. [Google Scholar] [CrossRef]
  30. Fang, Z.; Wang, L.; Mu, X.; Chen, B.; Xiong, Q.; Wang, W.D.; Ding, J.; Gao, P.; Wu, Y.; Cao, J. Grain boundary engineering with self-assembled porphyrin supramolecules for highly efficient large-area perovskite photovoltaics. J. Am. Chem. Soc. 2021, 143, 18989–18996. [Google Scholar] [CrossRef]
  31. Yu, Z.; Wang, L.; Mu, X.; Chen, C.C.; Wu, Y.; Cao, J.; Tang, Y. Intramolecular electric field construction in metal phthalocyanine as dopant-free hole transporting material for stable perovskite solar cells with> 21% efficiency. Angew. Chem. Int. Ed. 2021, 60, 6294–6299. [Google Scholar] [CrossRef] [PubMed]
  32. Chen, H.Y.; Hou, J.; Zhang, S.; Liang, Y.; Yang, G.; Yang, Y.; Yu, L.; Yue, W.; Gang, L. Polymer solar cells with enhanced open-circuit voltage and efficiency. Nat. Photonics 2009, 3, 649–653. [Google Scholar] [CrossRef]
  33. Zhou, H.; Chen, Q.; Li, G.; Luo, S.; Song, T.-B.; Duan, H.-S.; Hong, Z.; You, J.; Liu, Y.; Yang, Y. Interface engineering of highly efficient perovskite solar cells. Science 2014, 345, 542–546. [Google Scholar] [CrossRef] [PubMed]
  34. You, J.; Chen, C.C.; Dou, L.; Murase, S.; Duan, H.S.; Hawks, S.A.; Xu, T.; Son, H.J.; Yu, L.; Li, G. Metal oxide nanoparticles as an electron-transport layer in high-performance and stable inverted polymer solar cells. Adv. Mater. 2012, 24, 5267–5272. [Google Scholar] [CrossRef]
  35. Zhang, J.; Lu, T. Efficient evaluation of electrostatic potential with computerized optimized code. Phys. Chem. Chem. Phys. 2021, 23, 20323–20328. [Google Scholar] [CrossRef]
  36. Lu, T.; Chen, Q. Van der waals potential: An important complement to molecular electrostatic potential in studying intermolecular interactions. J. Mol. Modeling 2020, 26, 1–9. [Google Scholar] [CrossRef]
  37. Liu, Z.; Lu, T.; Chen, Q. Intermolecular interaction characteristics of the all-carboatomic ring, cyclo [18] carbon: Focusing on molecular adsorption and stacking. Carbon 2021, 171, 514–523. [Google Scholar] [CrossRef]
  38. Lefebvre, C.; Rubez, G.; Khartabil, H.; Boisson, J.-C.; Contreras-García, J.; Henon, E. Accurately extracting the signature of intermolecular interactions present in the NCI plot of the reduced density gradient versus electron density. Phys. Chem. Chem. Phys. 2017, 19, 17928–17936. [Google Scholar] [CrossRef]
  39. Lu, T.; Chen, Q. Independent gradient model based on hirshfeld partition: A new method for visual study of interactions in chemical systems. J. Comput. Chem. 2022, 43, 539–555. [Google Scholar] [CrossRef]
  40. Lu, T.; Chen, Q. Interaction region indicator: A simple real space function clearly revealing both chemical bonds and weak interactions. Chem. -Methods 2021, 1, 231–239. [Google Scholar] [CrossRef]
  41. Patkowski, K. Recent developments in symmetry-adapted perturbation theory. Wiley Interdiscip. Rev. Comput. Mol. Sci. 2020, 10, e1452. [Google Scholar] [CrossRef]
  42. Hohenstein, E.G.; Sherrill, C.D. Wavefunction methods for noncovalent interactions. Wiley Interdiscip. Rev. Comput. Mol. Sci. 2012, 2, 304–326. [Google Scholar] [CrossRef]
  43. Szalewicz, K. Symmetry-adapted perturbation theory of intermolecular forces. Wiley Interdiscip. Rev. Comput. Mol. Sci. 2012, 2, 254–272. [Google Scholar] [CrossRef]
  44. Kohn, W.; Sham, L.J. Self-consistent equations including exchange and correlation effects. Phys. Rev. 1965, 140, A1133. [Google Scholar] [CrossRef] [Green Version]
  45. Frisch, M.; Trucks, G.; Schlegel, H.; Scuseria, G.; Robb, M.; Cheeseman, J.; Scalmani, G.; Barone, V.; Petersson, G.; Nakatsuji, H. Gaussian 16, Revision c. 01; Gaussian, Inc.: Wallingford, CT, USA, 2016. [Google Scholar]
  46. Becke, A.D. Density-functional thermochemistry. Iv. A new dynamical correlation functional and implications for exact-exchange mixing. J. Chem. Phys. 1996, 104, 1040–1046. [Google Scholar] [CrossRef]
  47. Weigend, F.; Ahlrichs, R. Balanced basis sets of split valence, triple zeta valence and quadruple zeta valence quality for h to rn: Design and assessment of accuracy. Phys. Chem. Chem. Phys. 2005, 7, 3297–3305. [Google Scholar] [CrossRef]
  48. Grimme, S. Density functional theory with london dispersion corrections. Wiley Interdiscip. Rev. Comput. Mol. Sci. 2011, 1, 211–228. [Google Scholar] [CrossRef]
  49. Lu, T.; Chen, F. Multiwfn: A multifunctional wavefunction analyzer. J. Comput. Chem. 2012, 33, 580–592. [Google Scholar] [CrossRef]
  50. Parrish, R.M.; Burns, L.A.; Smith, D.G.; Simmonett, A.C.; DePrince III, A.E.; Hohenstein, E.G.; Bozkaya, U.; Sokolov, A.Y.; Di Remigio, R.; Richard, R.M. Psi4 1.1: An open-source electronic structure program emphasizing automation, advanced libraries, and interoperability. J. Chem. Theory Comput. 2017, 13, 3185–3197. [Google Scholar] [CrossRef]
  51. Burns, L.A.; Marshall, M.S.; Sherrill, C.D. Appointing silver and bronze standards for noncovalent interactions: A comparison of spin-component-scaled (SCS), explicitly correlated (F12), and specialized wavefunction approaches. J. Chem. Phys. 2014, 141, 234111. [Google Scholar] [CrossRef]
  52. Humphrey, W.; Dalke, A.; Schulten, K. Vmd: Visual molecular dynamics. J. Mol. Graph. 1996, 14, 33–38. [Google Scholar] [CrossRef]
Figure 1. Top view (a), front view (b) and oblique view (c) of [6, 6] CNB. The golden balls represent carbon atoms, and the white balls represent hydrogen atoms.
Catalysts 12 00561 g001
Figure 2. The front view (a) and top view (b) of the isosurface (isovalue = 0.01 a.u.) of [6, 6] CNB’s electrostatic potential distribution. The red (blue) isosurface represents the area where the electrostatic potential is positive (negative), and the red (blue) balls represent the maximum (minimum) value of the electrostatic potential.
Catalysts 12 00561 g002
Figure 3. (a) The van der Waals potential of [6, 6] CNB (isovalue = −1.0 kcal/mol); the green ball is the Xe atom probe, and it is at the lowest point of the van der Waals potential. (b) Van der Waals potential projection on the yz plane when x = 0, in kcal/mol.
Catalysts 12 00561 g003
Figure 4. The optimized structure and RDG diagram (isovalue = 0.5) of small molecules adsorbed on the outside of [6, 6] CNB. Only [6, 6] CNB&O2(ext) use the Interaction Region Indicator (IRI) method. The surfaces between the [6, 6] CNB and the adsorbates correspond to the isosurface of RDG mapped by s i g n λ _ 2 ρ function, in a.u.
Catalysts 12 00561 g004
Figure 5. The optimized structure and RDG diagram (isovalue = 0.5) of small molecules adsorbed on the inside of [6, 6] CNB. The surfaces between the [6, 6] CNB and the adsorbates correspond to the isosurface of RDG mapped by s i g n λ _ 2 ρ   function, in a.u.
Catalysts 12 00561 g005
Figure 6. The energy of different physical components (a) and total energy (b) of the interaction between [6, 6] CNB and small molecules based on SAPT energy decomposition, in kcal/mol.
Catalysts 12 00561 g006
Figure 7. The ratio of different physical components of small molecules adsorbed on the inner and outer regions of [6, 6] CNB. Electrostatic (a), exchange (b), induction (c) and dispersion (d).
Catalysts 12 00561 g007
Figure 8. The optimized structure and RDG diagram (isovalue = 0.5) of [6, 6] CNB dimer. The adsorption surface corresponds to the value surface of the s i g n λ 2 ρ function mapped to the interaction, in a.u.
Catalysts 12 00561 g008
Figure 9. (a) BCPs (green ball) for intermolecular interactions. (b) The value of the real-space function at the BCPs.
Catalysts 12 00561 g009
Table 1. The ratio of the dispersion attraction to the total attraction of small molecules adsorbed on [6, 6] CNB.
attrdis/attrtotN2CH4COCO2H2H2OH2O2O2
ext0.610.710.560.600.640.410.42--
int0.790.850.760.720.770.590.580.41
Table 2. The energy of different physical components and total energy of the interaction between [6, 6] CNB dimer based on SAPT energy decomposition, in kcal/mol.
ComponentValue (kcal/mol)
Electrostatics−6.28 (23%)
Exchange17.95
Induction−1.98 (7%)
Dispersion−19.30 (70%)
Total−9.61
Publisher’s Note: MDPI stays neutral with regard to jurisdictional claims in published maps and institutional affiliations.

