Abstract
This paper presents results related to the development of a carbon composite intended for water purification. The aim was to develop an adsorbent that could be regenerated using light leading to complete degradation of pollutants and avoiding the secondary pollution caused by regeneration. The composites were prepared by hydrothermal carbonization of palm kernel shells, TiO2, and W followed by activation at 400 °C under N2 flow. To evaluate the regeneration using light, photocatalytic experiments were carried out under UV-A, UV-B, and visible lights. The materials were thoroughly characterized, and their performance was evaluated for diclofenac removal. A maximum of 74% removal was observed with the composite containing TiO2, carbon, and W (HCP25W) under UV-B irradiation and non-adjusted pH (~5). Almost similar results were observed for the material that did not contain tungsten. The best results using visible light were achieved with HCP25W providing 24% removal of diclofenac, demonstrating the effect of W in the composite. Both the composites had significant amounts of oxygen-containing functional groups. The specific surface area of HCP25W was about 3 m2g−1, while for HCP25, it was 160 m2g−1. Increasing the specific surface area using a higher activation temperature (600 °C) adversely affected diclofenac removal due to the loss of the surface functional groups. Regeneration of the composite under UV-B light led to a complete recovery of the adsorption capacity. These results show that TiO2- and W-containing carbon composites are interesting materials for water treatment and they could be regenerated using photocatalysis.
1. Introduction
The appearance of emerging contaminants in the environment, such as pharmaceuticals and hormones, has become a point of focus of research since the mid-1990s. The active pharmaceutical ingredients of over-the-counter drugs have a greater tendency of being found in the environment. Due to their use, they end up in water bodies and finally, even in drinking water [1]. A large number of pharmaceuticals are used to cure and care for human and animal health. Worldwide average per capita consumption of pharmaceuticals is 15 g, and it goes as high as 50 to 150 g in industrialized countries [2].
Diclofenac, a non-steroidal anti-inflammatory drug, is among the most frequently detected pharmaceuticals (detection probability greater than 50%) in the effluents of municipal wastewater treatment plants. Diclofenac is stable and hydrophilic and tends to persist in water bodies [3,4]. Eco-toxicological reports have shown that diclofenac can cause adverse effects in mammals and other aquatic organisms. Neurological and oxidative stress induced by diclofenac in many aquatic animals have been found to be the source of several diseases. Global warming leads to drought and coastal flooding, thus contributing to the progressive increase in the occurrence of diclofenac and its transformation products in water bodies [5]. In the greater part of Europe, a maximum of about 0.15 μgL−1 is detected in the effluents of wastewater plants, while diclofenac concentrations range between 1.4 and 5.5 μgL−1 in influents. A maximum of about 0.64 μgL−1 has been detected in the influents of sewage treatment plants in Finland and about 0.62 μgL−1 in the effluents [3,6]. Studies carried out in a watershed in Cameroon indicated diclofenac concentration of about 0.42 µgL−1 [7]. An amount of 0.36 µgL−1 was observed in the Jundiai River in Brazil [8]. These values show that current wastewater treatment is not efficient enough for diclofenac removal. Diclofenac is classified as one of the emerging pollutants.
Over the years, carbon materials have been used as adsorbents for the removal of contaminants in water due to their high adsorption capacity that comes mainly from their large surface area and high porosity [9]. Different biomass resources, such as wood biomass, agricultural crops and their waste by-products, municipal solid wastes, animal wastes, wastes from food processing, aquatic plants and algae, commercial wastes, and industrial and silvicultural residues [10,11], have been used to produce carbon adsorbents. Previous studies have also been carried out on the use of palm kernel shells as a biomass source to produce carbon adsorbents in several applications. They have been used, for example, as gas separation adsorbents [12,13,14], adsorbents for dyes [15,16], and adsorbents for heavy metals [17]. In the current work, we will concentrate for the first time on the removal of diclofenac sodium using photocatalytically active carbon-based composites prepared from palm kernel shells.
Adsorbents lose their capacity with time since their adsorption sites become gradually saturated, and thus they need to be regenerated. Typical adsorbent regeneration methods are oxidation [18], biological [19], microwave, and thermal treatments [20,21]. During some of these regeneration processes, the pollutants are desorbed from the adsorbent surface, which leads to a secondary pollution problem. In our approach, we propose a novel alternative method for regeneration that does not lead to secondary pollution. Our idea is to prepare photocatalytically active carbon composites from palm kernel shells and TiO2-P25 that could be regenerated with light irradiation, leading to degradation of the pollutants during the regeneration procedure. A photocatalytic process employing a semiconductor catalyst has proven its intrinsic potential of being an environmentally friendly process for the treatment of contaminants in water [22], and P25 is the most widely used photocatalyst [23]. However, P25 has a rather high band gap of 3.2 eV, leading to a requirement of using UV-light as the energy source for activation of the photocatalytic reactions [24]. To be able to regenerate the carbon composites under visible light, doping the material further becomes necessary. It has been found that tungsten (W) can be used to reduce the band gap of P25 [25]. Thus, we decided to also add W in the composite.
The novel carbon composites were prepared by hydrothermal carbonization (HTC). HTC is a thermochemical process that uses subcritical water as a reaction medium for converting feedstocks into value-added products. HTC treatment produces a carbonaceous solid named hydrochar with attractive characteristics in a variety of applications such as water treatment [26]. The morphology of the composites produced can be easily controlled. This method also entails the use of mild reaction conditions and leads to a high purity level of products [27]. During the HTC process, the material retains most of its oxygen and surface functional groups. In addition to significant surface area, surface functional groups have a vital role in the adsorption of organic and inorganic contaminants from water [28,29]. One pot synthesis of materials is possible with the HTC process [30,31]. After the HTC, depending on the use of the product, it might be necessary to increase the specific surface area of the material further. This can be performed by activating the material at higher temperatures. The drawback of high temperature treatment is the removal of oxygen-containing functional groups [32]. In optimized conditions, part of the oxygen functional groups can be retained [33]. In summary, the aim of the work was to prepare a novel carbon composite efficient in diclofenac removal and that could be regenerated via photocatalytic treatment. This type of material should have both the characteristics of good adsorption capacity and photocatalytic activity. The prepared composite was thoroughly characterized to explain its performance.
2. Results and Discussion
2.1. Characterization
The specific surface areas were 160 m2g−1 for HCP25 and only ~3 m2g−1 for HCP25W. The total pore volumes and median pore widths of HCP25 were 0.05 cm3g−1 and 0.91 nm and for HCP25W, they were 0.004 cm3g−1 and 1.42 nm. A higher specific surface area typically leads to a higher adsorption capacity and a higher number of active sites for photocatalytic reactions to take place [34].
As a comparison, the specific surface area of the activated hydrochar (without W or P25) was determined to be 131 m2g−1. The specific surface area of P25 was about 53 m2g−1 [35]. A 22% higher specific surface area compared to the one of hydrochar in the case of HCP25 and about 98% lower in the case of HCP25W was observed. The effect of specific surface area on the performance of the composite was evaluated with HCP25600 that was carbonized at a higher temperature. The higher carbonization temperature led to a specific surface area of 330 m2g−1 in accordance with a previous work [32].
The structure of the prepared materials is visualized in the FESEM-EDS images (Figure 1a,b). In the case of HCP25, the elements are quite evenly distributed. The surface of HCP25 is rough, and TiO2 seems to be spread across the material. The rough surface ties with the higher surface area observed by nitrogen physisorption. In HCP25W (Figure 1b), the elements are less evenly distributed, as spots of Ti and W can be observed. The surface of the material is smoother than in the case of HCP25, which is consistent with the lower specific surface area. Addition of W in the preparation seems to lead to larger particle size and somewhat less homogenous distribution of the elements. W is located in similar positions with TiO2, while carbon is observed in separate areas. In both composites, oxygen is located closer to Ti and W, indicating the presence of oxide forms. Based on XRF analysis, the amount of Ti is about 25% and 24% in HCP25 and HCP25W, respectively, and the amount of W is about 4.6%. The carbon contents of the HCP25 and HCP25W are 57% and 53%.
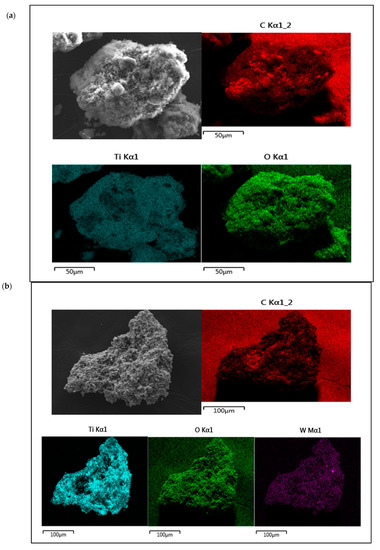
Figure 1.
Field emission scanning electron microscopy and EDS images for (a) HCP25 (5000×) and (b) HCP25W (5000×). The first microscopic image is in the same scale with the EDS images.
Raman spectroscopy was used to provide chemical information on the composite materials. In Figure 2a,b, the Raman spectra of the composites and the spectrum of P25 and hydrochar are shown. TiO2 anatase-related Raman peaks were observed in both cases at 150 cm−1 (Eg), 400 cm−1 (B1g), and 638 cm−1 (Eg). In HCP25W, anatase peaks were also observed at 202 cm−1 (Eg) and 522 cm−1 (B1g). These peaks are red-shifted compared to the peak positions of pure anatase [36,37,38]. Raman vibration was also observed at 248 cm−1, which could indicate the presence of a rutile phase of TiO2; however, two more intense peaks of rutile at around 440 cm−1 (Eg) and around 610 cm−1 (Ag) seem to be covered by the more intense anatase peaks [38,39,40]. This result gives an indication that the P25 retains both the phases during HTC processing. A small peak was also observed at 719 cm−1 in the Raman spectrum of HCP25W, which could be indicative of the presence of tungsten oxide [41,42]. However, this peak could appear as a shoulder in the HCP25 648 cm−1 peak. When the spectrum of HCP25W is zoomed, very small vibration at 811 cm−1 is observed that could also be indicative of the presence of tungsten oxide. While the spectrum of HCP25 is clearly modified after the addition of W, the tungsten species cannot be reliably identified from the measured Raman spectra.
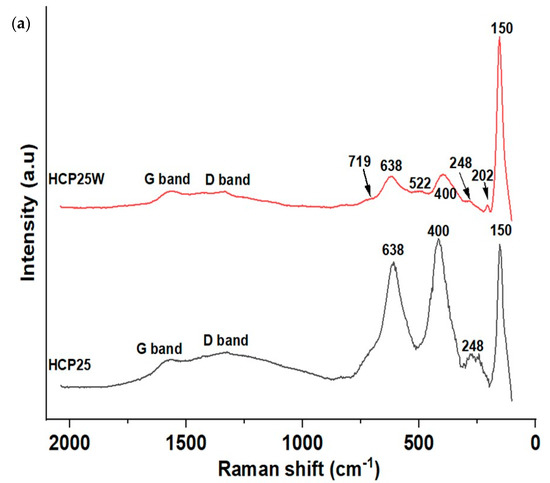
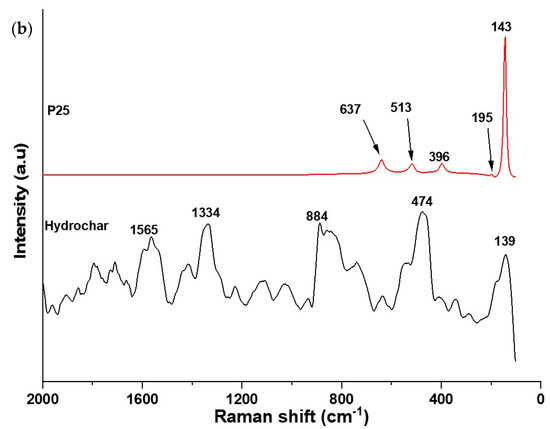
Figure 2.
(a) Raman spectra HCP25 and HCP25W and (b) Raman spectrum for P25 and hydrochar. The spectra of P25 and hydrochar are given with different y-axis scale.
Raman spectra of both composites also show the vibrations present at the positions of D and G bands of carbon. The G band is related to the graphite or graphene structure observed typically for both at 1582 cm−1. The D band indicates the disorder present in the graphene structure. Amorphous carbon gives rise to the background around 500 cm−1. This could be visible especially in the case of HCP25 [43]. The ratio of the D band intensity to the G band intensity (ID/IG) is associated with the structural defects within the sp2 carbon network that arise upon the reduction of graphene oxide. The higher the ratio, the higher the number of defects and the better its performance in surface reactions [44,45]. The Raman spectral data were normalized, and Gaussian fit of the G and D bands was performed for HCP25 and HCP25W. The integrated areas of the modeled peaks were used in calculation of the ID/IG ratio. More details on the procedure can be found from the “Supplementary Information”. The higher ID/IG ratio of HCP25 (about 9.60) indicates that it has more defects in the structure than HCP25W, which has the ratio of about 2.44. This would mean that HCP25 is potentially better in surface reactions. The Raman spectrum of the hydrochar (Figure 2b) shows an indication of graphitic structures; however, the peaks at the G and D band positions are not very well-resolved. Due to the low signal-to-noise ratio of the spectrum, Gaussian fit was not performed for the hydrochar.
The XPS spectra of C1S, O1S, and Ti2p for HCP25 and HCP25W are similar. In the C1S XPS spectra (Figure 3a), three peaks were identified: one at 284.6 eV corresponding to the aromatic/aliphatic C-group (C=C, CHx, and C–C), 285.5 eV related to the sp3 hybridized carbon atoms C–C, and 288.9 eV indicating the carbon in the COO– group. The XPS spectra (Figure 3b) for O1S exhibited major peaks at 531.09 and 533.4 eV corresponding to the C–OH, C–O–C, or COO– and C=O functional groups, respectively. The peak at 529.97 eV is attributed to oxygen in TiO2 [46]. In the Ti2p spectrum, two forms of Ti were present. Their binding energies were 458.8 and 464.5 eV, corresponding to the Ti2p3/2 and Ti2p1/2 core levels in TiO2, respectively [47,48,49,50,51].
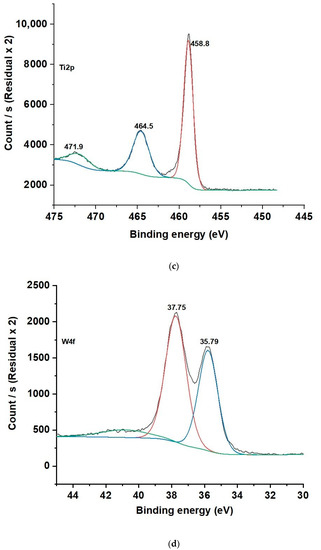
Figure 3.
(a) C1s, (b) O1s, and (c) Ti2p XPS spectra for HCP25 and (d) W4f spectrum for HCP25W.
In HCP25W, W4f can be deconvoluted into two peaks at binding energies of 35.79 and 37.75 eV. These correspond to the W4f7/2 and W4f5/2 core levels, which belong to tungsten with an oxidation state of six (W6+) related to the oxide form of WO3 [52]. This is consistent with the 719 cm−1 Raman peak indicating the WO3 in HCP25W.
The FTIR-ATR spectra of the prepared composites are presented in Figure 4. For HCP25, a wide spectral feature is observed at around 641 cm−1 related to Ti–O stretching. A similar feature is not observed in the spectrum of HCP25W. A small peak is observed in HCP25W around 790 cm−1 corresponding to the C–H bending for aromatic out of plane deformation. In HCP25, possible C–H bending is covered by Ti–O stretching [33,44,53]. A feature around 1450 cm−1 can be attributed to the C–O carboxyl group, which is especially visible for HCP25 [54]. The peak at 1620 cm−1 for both the materials is related to the skeletal vibration of the unoxidized graphitic domains. The peaks obtained at 2341 and 2360 cm−1 are attributed to the vibration band positions of gaseous carbon dioxide from air [55]. The two peaks at 2909 and 2940 cm−1 correspond to the C–H alkane groups and aliphatic chain –CH2 and –CH3 stretching vibrations [56,57]. The peaks at around 3700 cm−1 are the O–H stretching vibrations of both hydroxyl and carbonyl groups [33]. The FTIR analysis shows that the composite materials produced contain oxygen-containing functional groups. It seems that the addition of tungsten decreases the amount of surface titania visible by absence of the 641 cm−1 Ti–O stretching bond. The vibrations indicating the presence of a carboxyl group (1450 cm−1) are almost absent for HCP25W, while graphitic domains remain. Somewhat less oxygenated groups are visible on HCP25W than on HCP25. The results of ATR-FTIR are consistent with Raman analysis, where TiO2, WO3 and G and D bands of carbon were observed.

Figure 4.
FTIR-ATR spectra of HCP25 and HCP25W.
Figure 5a,b show the TGA-DSC analysis results of the materials within the temperature range from 20 to 900 °C. The TGA-DSC analysis was carried out under N2 flow for the materials after HTC processing to find out information on the changes occurring during the activation step.
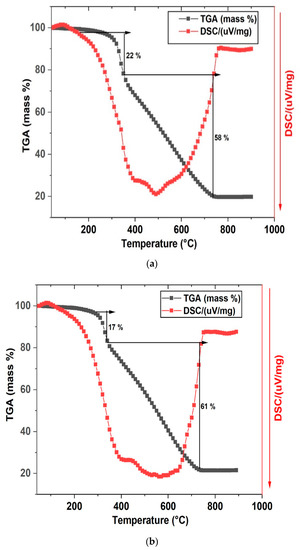
Figure 5.
TGA/DSC for (a) HCP25 and (b) HCP25W.
We observed two thermal degradation stages in the TGA thermogram of the composite materials. The evaporation of residual water is visible also as a small endothermic peak at around 100 °C. When temperature is increased, the phenomena related to mass loss are exothermic in their nature. About 22% and 17% of mass are lost between 320 and 380 °C in HCP25 and HCP25W, respectively. This could be attributed to the loss of cellulose fractions and possible residual moisture in the materials at a lower temperature region. The loss of 58% and 61% of mass is observed between 380 and 730 °C for HCP25 and HCP25W. These could correspond to the loss of more stable compounds such as lignin and some skeletal carbon [28,44,56,57,58]. The activation of the composites was decided to be performed at 400 °C under nitrogen flow to increase the specific surface area, but still keeping some of the characteristics appearing during the HTC processing. HTC processing modifies the original material in such a way that the number of functional groups important in adsorption is high. In the high temperature activation phase, it is possible to lose these functional groups while increasing the specific surface area. Therefore, careful selection of activation conditions is important [32].
Figure 6 shows the XRD diffraction peaks visible at 2Ɵ = 25.4°, 48.02°, and 55.1° for both materials corresponding to (101), (200), and (105) reflections of the anatase phase of TiO2. Peaks at 27.8°, 38.2°, and 54.8° were also observed that correspond to (001), (021), and (211) reflections of the rutile phase [59,60]. The diffraction peak (101) of TiO2 and that of graphene (002) occur at a similar value of 2Ɵ. Hence, it is challenging to distinguish a graphene peak from an intense TiO2 peak [61]. Based on the results, HCP25 and HCP25W contain about 65% anatase and 35% rutile. This shows that both the phases are retained during the processing; however, the phase composition seems to be different than in the commercial P25 (TiO2) used in the preparation of the composites. The commercial P25 contains about 80% anatase and 20% rutile [62]. A possible amorphous part was not visible in the XRD diffractograms.
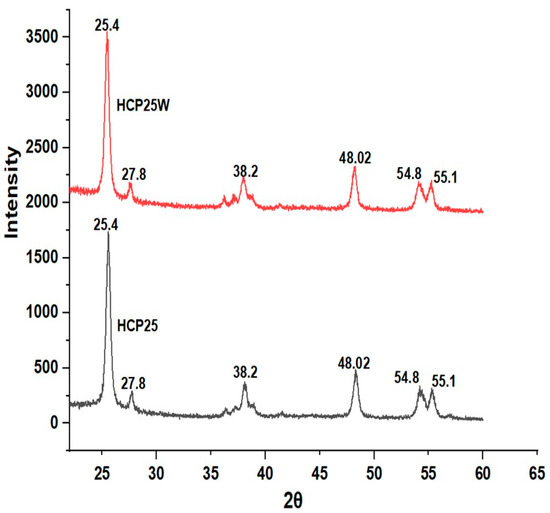
Figure 6.
XRD diffractograms of HCP25 and HCP25W.
To obtain better insight into the change in phase composition, an in situ XRD was performed for the HTC-processed samples. The in situ experiments were run under N2 flow simulating the conditions of activation (Figure 7). The in situ XRD measurements were started at 200 °C, which was the HTC temperature, and the first results showed that the anatase/rutile ratio of P25 was not changing markedly during the HTC process. Further changes in the phase composition of titanium dioxide occurred during activation under nitrogen atmosphere starting from a temperature of 250 °C (see also the Supplementary Information and values reported in Table 1).
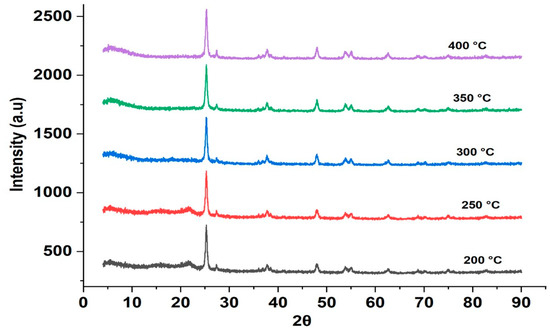
Figure 7.
In situ XRD diffractograms of HCP25 at different temperatures.

Table 1.
Anatase and rutile percentage at different temperatures during in situ XRD of HCP25.
As shown in Table 1, a decrease in the percentage of the anatase phase of P25 was observed. This is in accordance with previous works where this change occurs between 400 and 1200 °C [63]. The exact phase change temperature is affected by the other elements present in the material. For example, carbon is expected to enhance the transformation to rutile. [63]. In our case, the change is significant already at 300 °C, leading to a 65/35 anatase-rutile ratio at 400 °C.
2.2. Photocatalytic Experiments
Since the aim of this work was to prepare a carbon adsorbent with the ability to be regenerated using a photocatalytic process, the photocatalytic degradation experiments were carried out under UV-A, UV-B, and visible light irradiations. Diclofenac sodium was used as the target pollutant. In the beginning, photolysis experiments without the presence of a composite were carried out. These experiments showed that under UV-A and UV-B irradiation, the removal of diclofenac sodium is about 23% and 18%. No photodegradation of diclofenac was observed under visible light irradiation during the first 60 min, and thus the experiment was stopped at that moment of time.
In the beginning of the photocatalytic experiments in non-adjusted pH (~5) with the composites, the suspension was first kept in the dark for 30 min to realize the adsorption of diclofenac on the composites. During the adsorption period, about 15% of diclofenac was removed by HCP25 and about 10% by HCP25W, which had a smaller specific surface area. The activation of HCP25 at 600 °C resulted in a specific surface area of 320 m2g−1. However, the adsorption achieved in 30 min was only 16%. Even though the specific surface area was significantly higher for the high temperature activated composite, it suffered from a loss of surface functional groups leading to a low amount of diclofenac adsorbed. The FTIR-ATR spectrum of HCP25600 (Figure 8b) shows the decrease in the intensity of the Ti–O peak at 641 cm−1. A decrease in the intensity of –OH vibrations around 3700 cm−1 is also observed. A loss of the carbonyl groups is evident by the disappearance of the peaks at around 1450 cm−1. The C–H alkane group and –CH2 stretching vibrations around 2909 and 2940 cm−1 that were equally observed in HCP25 are not detected in HCP25600. These results indicate, in general, a significant loss in the functional groups of the material.
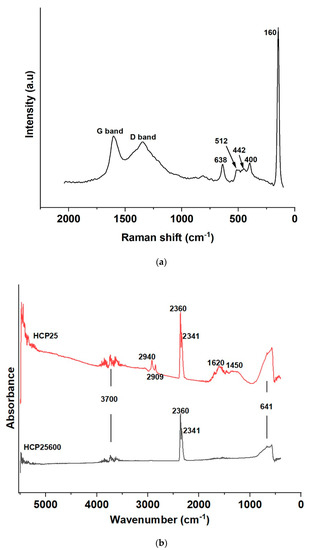
Figure 8.
(a) Raman spectrum of HCP25600 (G band position: 1607 cm−1 and D band position: 1352 cm−1) and (b) FTIR-ATR spectrum of HCP25600.
In the Raman spectrum of HCP25600 (Figure 8a), the anatase and rutile peaks of titanium dioxide are shown, confirming its biphasic nature in this composite as in the case of HCP25 and HCP25W. We observe anatase and rutile peaks at 512 and 442 cm−1, which were not seen in the Raman spectrum of HCP25 [36,37,38,39,40,64]. The signals of the D (1352 cm−1) and G bands are more intense in HCP25600 compared to HCP25 and HCP25W with a shift in the G band to a higher wave number of 1607 cm−1. This high intensity of the D band could be attributed to defects caused by the removal of surface functional groups in accordance with the FTIR results described earlier [65]. This is also supported by the ID/IG ratio of about 4.06. Increases in band intensities are related to the longer carbonization of the material and higher amount of graphitic structures.
The absorption spectrum of diclofenac is shown in Figure 9a together with light emission ranges. The photolysis results (without a composite) are shown in Figure 9b for UV-A and UV-B light irradiation. Degradation of diclofenac was 0% under visible light irradiation and therefore, the results are not shown; 0% removal was expected during the visible light photolysis since diclofenac does not absorb light in that range. Photolysis results using UV-A reached 23% and UV-B 18% in 360 min. The lower degradation of diclofenac under the UV-B light than when using UV-A light can be explained by a significant difference in the irradiance of the used lamps. The irradiance of the UV-A lamp was about a double the irradiance of the UV-B lamp. The emission spectra of the two lamps are presented in the Supplementary Material.
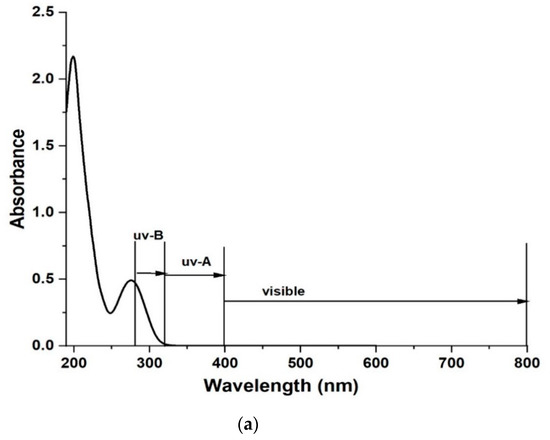
Figure 9.
(a) Absorption spectra of diclofenac sodium and (b) diclofenac removal using different light sources and prepared composites. The deviation of the mean of measurement points based on the repeated experiments is ~1%. Relative error of analysis is 0.2% and standard error of calibration of the UV–VIS device is 0.9%.
The diclofenac removal results shown in Figure 9b for the composites under light irradiation are calculated based on the analysis of the samples taken after the 30 min adsorption period. After 6 h of irradiation with UV-A, diclofenac removal rates of 52% and 43% with HCP25 and HCP25W were observed, respectively. The degradation was highest under UV-B irradiation, where removal of 73% and 74% with HCP25 and HCP25W were reached. The better removal under UV-B irradiation was expected based on the band gap of P25, which is 3.2 eV [25]. HCP25W was equally effective with HCP25, despite its low specific surface area. The HCP25600 showed 69% removal under UV-B irradiation. Thus, the specific surface area seems not to have a very significant role in diclofenac photocatalytic removal in the case of these materials.
Under visible light irradiation, 16% (HCP25) and 24% (HCP25W) diclofenac removal were achieved. This was significantly higher than the 0% removal observed for visible light photolysis. It seems that W increases diclofenac removal under visible light irradiation (see Figure 9b at 360 min). Previous studies show the increased visible light absorbance of material co-doped with W and carbon; however, this does not necessarily directly reflect on the photocatalytic activity [66].
The UV–vis analysis of the treated water (see the Supplementary Information) gave an indication that reaction intermediates appear after 5 min of irradiation during photolysis and when both composites were used. Thus, LC-MS analysis was performed to identify the reaction intermediates. The main intermediate formed was found to be colored carbazole dimer. This compound has been found to be the primary photolysis intermediate product of diclofenac under UV light irradiation during the first few minutes. It is stable and not very easily degraded as reports exist where almost no degradation is observed [67,68].
In our case, up to about 58% removal of carbazole dimer with HCP25 under UV-B irradiation was observed at the end of the experiment (see the Supplementary Information). The removal was higher than observed by Iovino et al. [67] and Poirier-Larabie et al. [68].
Based on the photocatalytic experiments, we decided to carry out repeated adsorption experiments using HCP25 (in dark) with regeneration in clean water under UV-B irradiation between the adsorption experiments. The results are shown in Figure 10a,b.
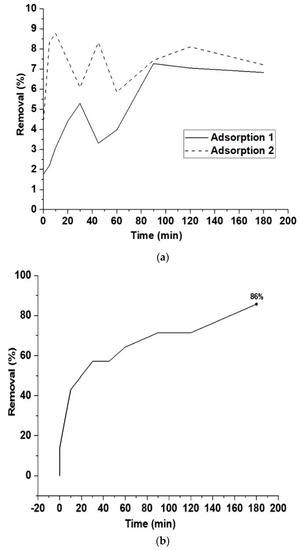
Figure 10.
(a) Adsorption of diclofenac on fresh HCP25 (Adsorption 1) and regenerated material (Adsorption 2). Adsorption time (in dark) 180 min and (b) degradation of desorbed diclofenac during the HCP25 regeneration under UV-B irradiation (180 min).
The results showed that the removal of diclofenac via adsorption for 180 min remained at a rather low level. Less than 10% of the diclofenac was removed from the water. Adsorption of diclofenac can be later improved by optimizing the adsorption pH. Figure 11 shows the FTIR spectrum of the composite after adsorption where we observe peaks of diclofenac appearing around 1597, 1454, and 1199 cm−1 [69]. This result evidences the adsorption of diclofenac on the composite.
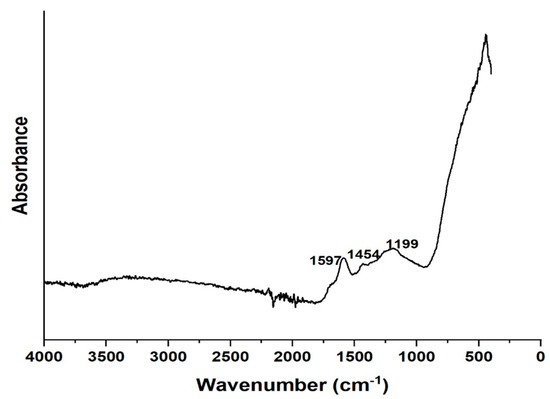
Figure 11.
FTIR of HCP25 after adsorption.
During the photocatalytic regeneration phase, the adsorbent was suspended in distilled water. In distilled water, the adsorption–desorption phenomenon finds a new equilibrium, releasing part of the diclofenac in the liquid phase. When switching on the UV-B light, an 86% removal of diclofenac was observed. During the repeated adsorption after the regeneration step, it was observed that the adsorption capacity of the composite was completely recovered. This means that photocatalysis could be used as the regeneration method of carbon composites in the case of diclofenac removal from water. These are the first results showing the possibility of using composite materials that can be regenerated using light irradiation in diclofenac adsorption. However, further research efforts are needed to optimize the treatment conditions and improve the adsorption.
3. Materials and Methods
Palm kernel shells were collected from the South West (Idenau, Tombel) and North West (Donga-Mantung) regions of Cameroon. The raw material used was a mixture of the shells from these areas. Before HTC processing, the shells were washed to remove the fibers on them and sun-dried in the open air at temperatures of about 30–32 °C. For the preparation of the HCP25 sample, 6 g of palm kernel shells and 0.79 g of TiO2 (Evonik industries, Essen, Germany) were mixed. For the HCP25W sample, 100 mg of tungsten metal (Alpha resources LLC, Stevensville, MI, USA) was dissolved in 5 mL of 35% hydrogen peroxide (Alphatec industries, Rio de Janeiro, Brazil). Then, the solution was heated at 80 °C in a beaker for 4 h. After heating, the solution was poured into a 50 mL round bottom flask and filled up to the mark with distilled water. A volume of 7.9 mL of this solution was then added to the reactor together with palm shells and P25. Molar ratios of Ti/C = 0.3 [70] and W/TiO2 = 0.1 [71] were used. Being a one pot method, the reagents were all mixed in the reactor, and ultrapure water was used to fill up the reactor container, leaving a 30% air space. All the reagents used were of analytical grade. The HTC reactor set up is shown in Figure 12a. The HTC reactor contains a resistant glass container for the raw materials and measurements for temperature and pressure. The reactor was placed on an induction heating plate. After heating the batch with the rate of 10 °C min−1, the temperature was maintained at 200 °C for 4 h with pressure ranging between 15 and 18 bars. After the HTC process, the liquid phase was filtered out while the hydrochars were oven-dried at 105 °C for 6 h.
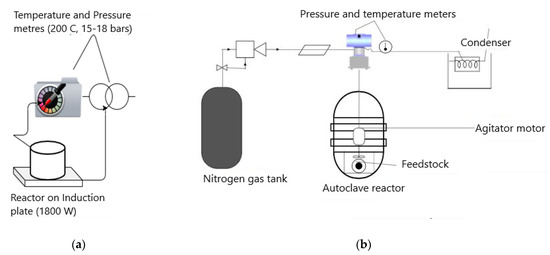
Figure 12.
Schematic of (a) the hydrothermal carbonization (HTC) reactor and (b) the activation set up.
After the HTC preparation, an activation of the hydrochar composites was performed under nitrogen flow (60 mL min−1). A schematic of the activation reactor is shown in Figure 12b. A heating rate of 10 °C min−1 was applied to reach the carbonization temperature of 400 °C, which was kept for 4 h. Part of HCP25 was carbonized at 600 °C (HCP25600) to study the effect of higher activation temperature. Then, the materials were cooled down to room temperature and stored.
The crystallinity patterns and phase composition of the prepared composite materials were obtained using a Lab X 6000 Shimadzu (Kyoto, Japan) X-ray diffractometer using copper K α X-ray radiation and operating at 40 kV voltage and 30 mA. The scanning was performed at 2Ɵ range of 10–90°. To obtain more information on the phase changes during the heat treatment of P25, in situ XRD was performed by a Bruker D8 (Ettlingen, Germany) using copper K α anode operating at 40 kV and 40 mA. Temperature chamber was operated under nitrogen atmosphere with a heating rate of 5 °C min−1 from 200 to 450 °C and the measurement was performed at 2Ɵ range of 4–90°. A Zeiss ultra plus FESEM (Ettlingen, Germany) equipped with an EDS analyzer was used to obtain high resolution images and elemental information on the materials. Prior to analysis, the samples were coated with Pt. A Bruker AXS S4 pioneer XRF (Ettlingen, Germany) with a pressed pellets method was used for more exact elemental analysis. The Micrometrics ASAP 2020 surface analyzer (Norcross, GA, USA) was used to obtain the specific surface areas, average pore sizes, and volumes of the prepared materials via N2-adsorption at −195 °C using the BET–BJH method. In the determination of microporosity, the cold free space and warm free space were determined in separate analyses. Before analysis, the samples were evacuated at 200 °C for 30 min. The FTIR analyses were obtained using the Bruker Hyperion 3000 FTIR microscope (Ettlingen, Germany) equipped with a 20× ATR-objective and compact tabletop Bruker Alpha-P FTIR (Ettlingen, Germany). TGA/DSC analysis was carried out using a Netzsch STA 409 PC Luxx device (Selb, Germany). A heating rate of 10 °C min−1 and nitrogen flow of 60 mL min−1 were used in the analyses. XPS analysis was carried out in a Thermo Fisher Scientific ESCALAB 250Xi X-ray photoelectron spectroscopy system (Waltham, MA, USA) to study the oxidation states of the elements present on the surface of the prepared materials. The time-gated Pico Raman spectrometer from Timegate instruments Ltd. (Oulu, Finland) was used to obtain the Raman spectra of the materials. The Pico Raman uses a 532 nm pulsed laser with a pulse duration of 150 ps and frequency of 40 to 100 kHz. The Raman spectra were measured between a wave number range of 100–2100 cm−1 with ~5 cm−1 spectral resolution. The wet samples were rotated during the measurements. The emission spectra of the lamps used in the photocatalytic experiments were measured using an Ocean Optics Jaz ULM spectrophotometer (Orlando, FL, USA).
The photocatalytic experiments to evaluate the planned regeneration ability were carried out under UV-A (Philips, PL-L, 36W, Cleo Pink), UV-B (Philips, UVB, 36W, Medical), and visible light (Osram, Dulux L, 36W, Cool daylight) irradiation with diclofenac sodium as the target pollutant (Henan Dongtai industries Ltd. (Anyang, China)). The emission spectra of the lamps are presented in the Supplementary Material. The pollutant concentration used was 15 mgL−1 and the amount of composite material was 100 mgL−1. The duration of the experiment was 6 h. During the experiment, air was bubbled through the photocatalytic reactor and the composite-diclofenac solution suspension was stirred continuously using a magnetic stirrer. A schematic representation of the photocatalytic reactor is explained in our previous work in [62]. All the experiments were performed at room temperature (~25 °C). The pH was not adjusted, and it was measured to be about 5. During the test procedure, the suspension was first kept in the dark for 30 min to realize adsorption of the pollutant. Then, the light was switched on and samples were taken at intervals of 10–15 min during the first two hours and then every 30 min until the end of the experiment. These experiments were used to evaluate the photocatalytic activity of the prepared composites. With the selected composite, repeated adsorption cycles were realized with a photocatalytic regeneration step between adsorptions using the same experimental set-up than in the photocatalytic experiments, and the same experimental conditions. The experimental conditions were the same as previously used, except the adsorption was first carried out for 180 min (Adsorption 1). Then, the composite material was recovered from the liquid via centrifugation. The regeneration step was carried out in distilled water under UV-B irradiation for 180 min (Regeneration). After regeneration, the catalyst was again separated from the liquid, and a sample was taken for analysis. Then, the composite was suspended into a new batch of pollutant water (15 mgL−1 of diclofenac-Na), and adsorption was repeated (Adsorption 2). Finally, the composite was separated from the liquid and saved for analysis. The photocatalytic experiments were carried out twice to find out the accuracy of the experiments. The mean of the deviation between the reported experiments was about 1% at maximum (absolute error).
Analysis of most of the samples was performed using a Shimadzu UV-2600 UV VIS spectrophotometer (Kyoto, Japan). A volume of 2 mL sample was measured without dilution using a 3 mL quartz cuvette with a 10 mm light path. The relative error of the analysis based on 10 repeated analyses was about 0.2% and the standard error of calibration for the UV VIS device was about 0.9%. In addition, a Waters Synapt G2 HDMS Q-Tof LC-MS operated in negative ESI mode and mass scanned from m/z 50 to 600 was used to analyze the intermediate products. The LC was equipped with a Waters BEH (2.1 × 100 mm, 1.7 µm) UPLC column and the mobile phase eluents used were (A) 10 mM ammonium acetate and (B) methanol. Flow rate was 0.3 mL min−1 with a hold period of 7 min.
4. Conclusions
Carbon composites containing TiO2 (P25) and W with photocatalytic regeneration ability were produced via hydrothermal carbonization and activation at 400 °C (under N2 flow). We observed that the used preparation conditions led to composites containing oxygen functional groups. The addition of W in the structure led to a drastic loss of surface area. Even high surface area was achieved at 600 °C, a high amount of functional groups were lost. The role of oxygen-containing functional groups was more important than the specific surface area in terms of the performance of the composites. The possibility to regenerate the composites using light irradiation was initially investigated by photocatalytic diclofenac removal experiments. We observed a maximum of 74% removal of diclofenac for the HCP25W composite and 73% removal for HCP25 under UV-B irradiation. Visible light irradiation resulted in 24% diclofenac removal with HCP25W, while removal with HCP25 remained at 16%. The regeneration experiments were performed using HCP25 and UV-B light. The results were successful, and the adsorption capacity was recovered completely. This shows the potential of this method to curb the effects of secondary pollution from end of life carbon adsorbents. Hence, more work is being conducted to increase the performance of the material and efficiency of the process towards solar light regeneration.
Supplementary Materials
The following are available online at https://www.mdpi.com/2073-4344/11/2/173/s1, Determination of ID/IG Ratio (Figures S1–S3); Calculation of Anatase and Rutile Amounts from In Situ XRD Data at Different Temperatures (Figures S4–S8; Tables S1 and S2); C1s, O1s, and Ti2p XPS Spectra for HCP25W (Figure S9); Summary of Peak Positions and Their Assignments for FTIR, XPS, and Raman Spectra (Tables S3–S5); Photocatalytic Degradation of Diclofenac Sodium and Carbazole (Intermediate Compound) by HCP25 (Figure S10); Emission Spectra of the UV-A, UV-B and Visible Lamps Used in the Experiments (Figure S11).
Author Contributions
Conceptualization: S.O., S.B.d.O. and V.B.K.Y. Methodology: V.B.K.Y., H.K., S.B.d.O. and S.O. Investigation: V.B.K.Y., S.O., M.S., T.L., H.Z., R.S. and H.K. Resources: S.O. Writing—original draft preparation: V.B.K.Y. Writing—review and editing: V.B.K.Y., S.O., S.B.d.O., M.S., H.Z. Supervision: S.O. and S.B.d.O. Project administration: S.O. Funding acquisition: S.O. All authors have read and agreed to the published version of the manuscript.
Funding
This work was funded by the I4Future doctoral program, which has received funding from the EU H2020 under the Marie Sklodowska Curie grant agreement No. 713606, and Academy of Finland via the ELECTRA project.
Institutional Review Board Statement
Not applicable.
Informed Consent Statement
Not applicable.
Data Availability Statement
Not applicable.
Acknowledgments
The authors would like to acknowledge the Chemistry unit in the Federal Institute and Federal University of Goiás, Brazil, the VTT Technical Research Center of Finland Ltd., and the Microelectronics research unit and the Center of Material Analysis at the University of Oulu.
Conflicts of Interest
The authors declare no conflict of interest. The funder had no role in the design of the study; in the collection, analyses, or interpretation of data; in the writing of the manuscript, or in the decision to publish the results.
References
- Gogoi, A.; Mazumder, P.; Tyagi, V.; Tushara Chaminda, G.; An, A.; Kumar, M. Occurrence and fate of emerging contaminants in water environment: A review. Groundw. Sustain. Dev. 2018, 6, 169–180. [Google Scholar] [CrossRef]
- Lonappan, L.; Brar, S.K.; Das, R.K.; Verma, M.; Surampalli, R.Y. Diclofenac and its transformation products: Environmental occurrence and toxicity-A review. Environ. Int. 2016, 96, 127–138. [Google Scholar] [CrossRef]
- Schmidt, S.; Hoffmann, H.; Garbe, L.-A.; Schneider, R.J. Liquid chromatography–tandem mass spectrometry detection of diclofenac and related compounds in water samples. J. Chromatogr. A 2018, 1538, 112–116. [Google Scholar] [CrossRef]
- Tiedeken, E.J.; Tahar, A.; McHugh, B.; Rowan, N.J. Monitoring, sources, receptors, and control measures for three European Union watch list substances of emerging concern in receiving waters—A 20 year systematic review. Sci. Total. Environ. 2017, 574, 1140–1163. [Google Scholar] [CrossRef]
- Sathishkumar, P.; Meena, R.A.A.; Palanisami, T.; AshokKumar, V.; Palvannan, T.; Gu, F.L. Occurrence, interactive effects and ecological risk of diclofenac in environmental compartments and biota-a review. Sci. Total. Environ. 2020, 698, 134057. [Google Scholar] [CrossRef]
- Vieno, N. Occurrence of Pharmaceuticals in Finnish Sewage Treatment Plants, Surface Waters, and Their Elimination in Drinking Water Treatment Process. Ph.D. Thesis, Tampere University of Technology, Tampere, Finland, 2007; 117p. [Google Scholar]
- Branchet, P.; Castro, N.A.; Fenet, H.; Gomez, E.; Courant, F.; Sebag, D.; Gardon, J.; Jourdan, C.; Ngatcha, B.N.; Kengne, I.; et al. Anthropic impacts on Sub-Saharan urban water resources through their pharmaceutical contamination (Yaoundé, Center Region, Cameroon). Sci. Total. Environ. 2019, 660, 886–898. [Google Scholar] [CrossRef]
- De Sousa, D.N.R.; Mozeto, A.A.; Carneiro, R.L.; Fadini, P.S. Spatio-temporal evaluation of emerging contaminants and their partitioning along a Brazilian watershed. Environ. Sci. Pollut. Res. 2017, 25, 4607–4620. [Google Scholar] [CrossRef] [PubMed]
- Wong, S.; Ngadi, N.; Inuwa, I.M.; Hassan, O. Recent advances in applications of activated carbon from biowaste for wastewater treatment. J. Clean. Prod. 2018, 175, 361–375. [Google Scholar] [CrossRef]
- Balat, M. Mechanisms of thermochemical biomass conversion processes. Part 1: Reactions of pyrolysis. Energy Sources Part A Recover. Util. Environ. Eff. 2008, 30, 620–635. [Google Scholar] [CrossRef]
- Ramke, H.G.; Lehmann, H.J.; Fettig, J. Hydrothermal Carbonization of organic waste. In Proceedings of the Twelfth International Waste Management and Landfill Symposium, Sardinia, Italy, 5–9 October 2009; Cossu, R., Diaz, L.F., Stegmann, R., Eds.; CISA Publisher: Padova, Italy, 2009. [Google Scholar]
- Sethupathi, S.; Bashir, M.J.; Akbar, Z.A.; Mohamed, A.R. Biomass-based palm shell activated carbon and palm shell carbon molecular sieve as gas separation adsorbents. Waste Manag. Res. 2015, 33, 303–312. [Google Scholar] [CrossRef]
- Hidayu, A.; Muda, N. Preparation and characterization of impregnated activated carbon from palm kernel shell and coconut shell for CO2 capture. Procedia Eng. 2016, 148, 106–113. [Google Scholar] [CrossRef]
- Rashidi, N.A.; Yusup, S. Potential of palm kernel shell as activated carbon precursors through single stage activation technique for carbon dioxide adsorption. J. Clean. Prod. 2017, 168, 474–486. [Google Scholar] [CrossRef]
- Kabashi, N.A.; Muyibi, S.A.; Mirghanii, M.; Dzulkifli, M. Dye removal using activated carbon from palm kernel shell. In Proceedings of the International Conference on Environmental Research and Technology, Penang, Malaysia, 28–30 May 2008. [Google Scholar]
- Ulfah, M.; Raharjo, S.; Hastuti, P.; Purnama, D. The influence of textural and chemical properties of palm kernel shell activated carbon on the adsorption capacity and desorption efficiency of β-carotene in a model system. Int. Food Res. J. 2019, 26, 345–353. [Google Scholar]
- Baby, R.; Saifullah, B.; Hussein, M.Z. Palm Kernel Shell as an effective adsorbent for the treatment of heavy metal contaminated water. Sci. Rep. 2019, 9, 1–11. [Google Scholar] [CrossRef]
- Cabrera-Codony, A.; Gonzalezolmos, R.; Martín, M.J. Regeneration of siloxane-exhausted activated carbon by advanced oxidation processes. J. Hazard. Mater. 2015, 285, 501–508. [Google Scholar] [CrossRef]
- Leong, K.-Y.; Loo, S.-L.; Bashir, M.J.; Oh, W.-D.; Rao, P.V.; Wong, K.C. Bioregeneration of spent activated carbon: Review of key factors and recent mathematical models of kinetics. Chin. J. Chem. Eng. 2018, 26, 893–902. [Google Scholar] [CrossRef]
- Meng, J.; Li, J.; Li, J.; Wang, C.; Deng, K.; Sun, K. Effect of seed sludge on nitrogen removal in a novel upflow microaerobic sludge reactor for treating piggery waste water. Bioresour. Technol. 2016, 216, 19–27. [Google Scholar] [CrossRef] [PubMed]
- Radić, D.B.; Stanojević, M.; Obradovic, M.; Jovovic, A. Thermal analysis of physical and chemical changes occuring during regeneration of activated carbon. Therm. Sci. 2017, 21, 1067–1081. [Google Scholar] [CrossRef]
- Chong, M.N.; Jin, B.; Chow, C.W.; Saint, C. Recent developments in photocatalytic water treatment technology: A review. Water Res. 2010, 44, 2997–3027. [Google Scholar] [CrossRef]
- Ohno, T.; Sarukawa, K.; Tokieda, K.; Matsumura, M. Morphology of a TiO2 photocatalyst (Degussa, P-25) consisting of anatase and rutile crystalline phases. J. Catal. 2001, 203, 82–86. [Google Scholar] [CrossRef]
- Tang, C.; Hu, M.; Fang, M.; Liu, Y.; Wu, X.; Liu, W.; Wang, M.; Huang, Z. Photocatalytic Property of TiO2-Vermiculite Composite Nanofibres via Electrospinning. Nanoscale Res. Lett. 2015, 10, 1–5. [Google Scholar] [CrossRef]
- Cho, I.S.; Lee, C.H.; Feng, Y.; Logar, M.; Rao, P.M.; Cai, L.; Kim, D.R.; Sinclair, R.; Zheng, X. Codoping titanium dioxide nanowires with tungsten and carbon for enhanced photoelectrochemical performance. Nat. Commun. 2013, 4, 1723. [Google Scholar] [CrossRef] [PubMed]
- Puccini, M.; Stefanelli, E.; Hiltz, M.; Seggiani, M. Activated Carbon from hydrochar produced by hydrothermal carbonization of wastes. Chem. Eng. Trans. 2017, 57, 169–174. [Google Scholar]
- Han, W.; Li, Z.; Li, Y.; Fan, X.; Zhang, F.; Zhang, G.; Peng, W. The promoting role of different carbon allotropes cocatalysts for semiconductors in photocatalytic energy generation and pollutants degradation. Front. Chem. 2017, 5, 84. [Google Scholar] [CrossRef] [PubMed]
- Zbair, M.; Bottlinger, M.; Ainassaari, K.; Ojala, S.; Stein, O.; Keiski, R.; Bensitel, M.; Brahmi, R. Hydrothermal carbonization of argan nut shell: Functional mesoporous carbon with excellent performance in the adsorption of bisphenol a and diuron. Waste Biomass Valori. 2020, 11, 1565–1584. [Google Scholar] [CrossRef]
- Mäkelä, M.; Benavente, V.; Fullana, A. Hydrothermal carbonization of lignocellulosic biomass: Effect of process conditions on hydrochar properties. Appl. Energy 2015, 155, 576–584. [Google Scholar] [CrossRef]
- Madhu, M.; Chen, T.-H.; Tseng, W.-L. White-light emission of single carbon dots prepared by hydrothermal carbonization of poly(diallyldimethylammonium chloride): Applications to fabrication of white-light-emitting films. J. Colloid Interface Sci. 2019, 556, 120–127. [Google Scholar] [CrossRef]
- Zou, S.; Guo, F.; Wu, L.; Ju, H.; Sun, M.; Cai, R.; Xu, L.; Gong, Y.; Gong, A.; Zhang, M.; et al. One-pot synthesis of cerium and praseodymium co-doped carbon quantum dots as enhanced antioxidant for hydroxyl radical scavenging. Nanotechnology 2020, 31, 165101. [Google Scholar] [CrossRef]
- Yaah, V.B.K.; Zbair, M.; De Oliveira, S.B.; Ojala, S. Hydrochar-derived adsorbent for the removal of diclofenac from aqueous solution. Nanotechnol. Environ. Eng. 2021, 6, 1–12. [Google Scholar] [CrossRef]
- Zhu, L.; Lei, H.; Wang, L.; Yadavalli, G.; Zhang, X.; Wei, Y.; Liu, Y.; Yan, D.; Chen, S.; Ahring, B.K. Biochar of corn stover: Microwave-assisted pyrolysis condition induced changes in surface functional groups and characteristics. J. Anal. Appl. Pyrolysis 2015, 115, 149–156. [Google Scholar] [CrossRef]
- Morales-Torres, S.; Pastrana-Martinez, L. Nanostructured Carbon-TiO2 Photocatalysts for Water Purification: An Overview. Available online: http://hdl.handle.net/10261/108757 (accessed on 2 December 2018).
- Rathnayake, B.; Heponiemi, A.; Huovinen, M.; Ojala, S.; Pirilä, M.; Loikkanen, J.; Azalim, S.; Saouabe, M.; Brahmi, R.; Vähäkangas, K.; et al. Photocatalysis and catalytic wet air oxidation: Degradation and toxicity of bisphenol A containing wastewaters. Environ. Technol. 2019, 41, 3272–3283. [Google Scholar] [CrossRef] [PubMed]
- Castro-Beltrán, A.; Luque, P.; Garrafa-Gálvez, H.; Vargas-Ortiz, R.; Hurtado-Macías, A.; Olivas, A.; Almaral-Sánchez, J.L.; Alvarado-Beltrán, C. Titanium butoxide molar ratio effect in the TiO2 nanoparticles size and methylene blue degradation. Optik 2018, 157, 890–894. [Google Scholar] [CrossRef]
- Lu, H.; Zhao, B.; Pan, R.; Yao, J.; Qiu, J.; Luo, L.; Liu, Y. Safe and facile hydrogenation of commercial Degussa P25 at room temperature with enhanced photocatalytic activity. RSC Adv. 2014, 4, 1128–1132. [Google Scholar] [CrossRef]
- Challagulla, S.; Tarafder, K.; Ganesan, R.; Sounak, R. Structure sensitive photocatalytic reduction of nitoarenes over TiO2. Sci. Rep. 2017, 7, 8783. [Google Scholar] [CrossRef]
- Alamelu, K.; Raja, V.; Shiamala, L.; Ali, B.J. Biphasic TiO2 nanoparticles decorated graphene nanosheets for visible light driven photocatalytic degradation of organic dyes. Appl. Surf. Sci. 2018, 430, 145–154. [Google Scholar] [CrossRef]
- Qin, X.; Jing, L.; Tian, G.; Qu, Y.; Feng, Y. Enhanced photocatalytic activity for degrading Rhodamine B solution of commercial Degussa P25 TiO2 and its mechanisms. J. Hazard. Mater. 2009, 172, 1168–1174. [Google Scholar] [CrossRef]
- Kumar, P.; Sarswat, P.K.; Free, M.L. Hybridized tungsten oxide nanostructures for food quality assessment: Fabrication and performance evaluational. Sci. Rep. 2018, 8, 1–16. [Google Scholar] [CrossRef]
- Beknalkar, S.; Patil, V.; Harale, N.; Suryawanshi, M.; Patil, A.; Kim, J.H.; Patil, P.S. 2-D to 3-D conversion of WO3 nanostructures using structure directing agent for enhanced NO2 gas sensing performance. Sens. Actuators A Phys. 2020, 304, 111882. [Google Scholar] [CrossRef]
- Hodkiewicz, J. Characterizing Carbon Materials with Raman Spectroscopy. Application Note: 51901. Available online: https://assets.thermofisher.com/TFS-Assets/CAD/Application-Notes/D19504~.pdf (accessed on 31 December 2020).
- Nainani, R.K.; Thakur, P. Facile synthesis of TiO2-RGO composite with enhanced performance for the photocatalytic mineralization of organic pollutants. Water Sci. Technol. 2016, 73, 1927–1936. [Google Scholar] [CrossRef]
- Shen, J.; Yan, B.; Shi, M.; Ma, H.; Li, N.; Ye, M. One step hydrothermal synthesis of TiO2-reduced graphene oxide sheets. J. Mater. Chem. 2011, 21, 3415–3421. [Google Scholar] [CrossRef]
- Donar, Y.O.; Çağlar, E.; Sınağ, A. Preparation and characterization of agricultural waste biomass based hydrochars. Fuel 2016, 183, 366–372. [Google Scholar] [CrossRef]
- Xiao, L.-P.; Shi, Z.-J.; Xu, F.; Sun, R. Hydrothermal carbonization of lignocellulosic biomass. Bioresour. Technol. 2012, 118, 619–623. [Google Scholar] [CrossRef] [PubMed]
- Gao, Y.; Wang, X.; Wang, J.; Li, X.; Cheng, J.; Yang, H.; Chen, H. Effect of residence time on chemical and structural properties of hydrochar obtained by hydrothermal carbonization of water hyacinth. Energy 2013, 58, 376–383. [Google Scholar] [CrossRef]
- Okpalugo, T.I.T.; Papakonstantinou, P.; Murphy, H.; McLaughlin, J.; Brown, N.M.D. High resolution xps characterization of chemical functionalized MWCNTS and SWCNTS. Carbon 2005, 33, 153–161. [Google Scholar] [CrossRef]
- Zhang, K.-X.; Wang, W.; Hou, J.-L.; Zhao, J.-H.; Zhang, Y.; Fang, Y.-C. Oxygen plasma induced hydrophilicity of TiO2 thin films. Vacuum 2011, 85, 990–993. [Google Scholar] [CrossRef]
- Miyake, A.; Komasa, S.; Hashimoto, Y.; Komasa, Y.; Okazaki, J. Adsorption of saliva related protein on denture materials: An X-ray photoelectron spectroscopy and quartz crystal microbalance study. Adv. Mater. Sci. Eng. 2016, 2, 1–9. [Google Scholar] [CrossRef]
- Bhosale, N.Y.; Mali, S.S.; Hong, C.K.; Kadam, A.V. Hydrothermal synthesis of WO3 nanoflowers on etched ITO and their electrochromic properties. Electrochim. Acta 2017, 246, 1112–1120. [Google Scholar] [CrossRef]
- Kharrazi, S.M.; Mirghaffari, N.; Dastgerdi, M.M.; Soleimani, M. A novel post-modification of powdered activated carbon prepared from lignocellulosic waste through thermal tension treatment to enhance the porosity and heavy metals adsorption. Powder Technol. 2020, 366, 358–368. [Google Scholar] [CrossRef]
- Benito, H.E.; Sánchez, T.D.Á.; García-Alamilla, R.; Enríquez, J.M.H.; Robles, G.S.; Delgado, F.P. Synthesis and physicochemical characterization of titanium oxide and sulfated titanium oxide obtained by thermal hydrolysis of titanium tetrachloride. Braz. J. Chem. Eng. 2014, 31, 737–745. [Google Scholar] [CrossRef]
- Oancea, A.; Grasset, O.; Le Menn, E.; Bollengier, O.; Bezacier, L.; Le Mouélic, S.; Tobie, G. Laboratory infrared reflection spectrum of carbon dioxide clathrate hydrates for astrophysical remote sensing applications. Icarus 2012, 221, 900–910. [Google Scholar] [CrossRef]
- Tan, X.; Liu, Y.; Zeng, G.; Wang, X.; Hu, X.; Guangming, Z.; Yang, Z. Application of biochar for the removal of pollutants from aqueous solutions. Chemosphere 2015, 125, 70–85. [Google Scholar] [CrossRef] [PubMed]
- Wang, Y.; Yin, R.; Liu, R. Characterization of biochar from fast pyrolysis and its effect on chemical properties of the tea garden soil. J. Anal. Appl. Pyrolysis 2014, 110, 375–381. [Google Scholar] [CrossRef]
- González-García, P. Activated carbon from lignocellulosics precursors: A review of the synthesis methods, characterization techniques and applications. Renew. Sust. Energ. Rev. 2018, 82, 1393–1414. [Google Scholar] [CrossRef]
- Singh, P.; Singh, R.; Borthakur, A.; Srivastava, P.; Srivastava, N.; Tiwary, D.; Mishra, P. Effect of nanoscale TiO2-activated carbon composite on Solanum lycopersicum (L.) and Vigna radiata (L.) seeds germination. Energy Ecol. Environ. 2016, 1, 131–140. [Google Scholar] [CrossRef]
- Wang, W.; Wang, Z.; Liu, J.; Luo, Z.; Suib, S.; He, P.; Ding, G.; Zhang, Z.; Sun, L. Single-step one-pot synthesis of TiO2 nanosheets doped with sulphur on reduced graphene oxide with enhanced photocatalytic activity. Sci. Rep. 2017, 7, 1–9. [Google Scholar]
- Ullah, K.; Ye, S.; Lei, Z.; Cho, K.-Y.; Oh, W.-C. Synergistic effect of PtSe2 and graphene sheets supported by TiO2 as cocatalysts synthesized via microwave techniques for improved photocatalytic activity. Catal. Sci. Technol. 2015, 5, 184–198. [Google Scholar] [CrossRef]
- Da Silva, F.L.; Laitinen, T.; Pirilä, M.; Keiski, R.L.; Ojala, S. Photocatalytic degradation of perfluorooctanoic acid (Pfoa) From wastewaters by TiO2, In2O3 and Ga2O3 catalysts. Top. Catal. 2017, 60, 1345–1358. [Google Scholar] [CrossRef]
- Dorien, A.H.H.; Charles, C.S. Review of the anatase to rutile phase transformation. J. Mat. Sci. 2011, 46, 855–874. [Google Scholar]
- Stengl, V.; Baka-djieva, S.; Grygar, T.M.; Bludská, J.; Kormunda, M. TiO2-Graphene oxide nanocompositeas advanced photocatalytic materials. Chem. Cent. J. 2013, 7, 41. [Google Scholar] [CrossRef]
- Ruidíaz-Martínez, M.; Álvarez, M.A.; López-Ramón, M.A.; Cruz-Quesada, G.; Rivera-Utrilla, J.; Sánchez-Polo, M. Hydrothermal synthesis of rGO-TiO2 composites as high-performance UV photocatalysts for Ethylparaben degradation. Catalysts 2020, 10, 520. [Google Scholar] [CrossRef]
- Elaine, M.N.; Mattle, M.J.; Loughrey, D.; Rajesh, B.; Rahman, M.; Don Mac Elroy, J.M.; Sullivan, J.A.; Thampi Ravindranathan, K. Carbon-Doped TiO2 Tungsten-Codoped TiO2 through solar-gel processes in the presence of Melamine Borate: Reflections through photocatalysis. J. Phys. Chem. C 2010, 116, 16511–16521. [Google Scholar]
- Iovino, P.; Chianese, S.; Canzano, S.; Prisciandaro, M.; Musmarra, D. Photodegradation of diclofenac in waste waters. Desalination Water Treat. 2017, 61, 293–297. [Google Scholar]
- Poirier-Larabie, S.; Segura, P.; Gagnon, C. Degradation of the pharmaceuticals diclofenac and sulfamethoxazole and their transformation products under controlled environmental conditions. Sci. Total. Environ. 2016, 557–558, 257–267. [Google Scholar] [CrossRef] [PubMed]
- Swain, R.P.; Nagamani, R.; Panda, S. Formulation, invitro characterization and stability studies of fast dispersing tablets of diclofenac sodium. J. Appl. Pharm. Sci. 2015, 5, 094–102. [Google Scholar] [CrossRef]
- Maletic, M.; Vukcevic, M.; Kalijadis, A.; Jankovic-Castvan, I.; Dapcevic, A.; Lausevic, Z.; Lausevic, M. Hydrothermal synthesis of TiO2/carbon composites and their application for removal of organic pollutants. Arab. J. Chem. 2019, 12, 4388–4397. [Google Scholar] [CrossRef]
- Ferjani, W.; Boudali, L.K. Tungsten-titanium pillared clay catalyst: Preparation, characterization and catalytic activity. Jordan J. Chem. 2014, 9, 97–109. [Google Scholar] [CrossRef][Green Version]


Publisher’s Note: MDPI stays neutral with regard to jurisdictional claims in published maps and institutional affiliations. |
© 2021 by the authors. Licensee MDPI, Basel, Switzerland. This article is an open access article distributed under the terms and conditions of the Creative Commons Attribution (CC BY) license (http://creativecommons.org/licenses/by/4.0/).