Article

Novel CNT Supported Molybdenum Catalyst for Detection of L-Cysteine in Its Natural Environment

1
Department of Chemical Engineering, Faculty of Engineering, Van Yüzüncü Yıl University, Van 65000, Turkey
2
Department of Chemical Engineering, Faculty of Engineering and Architectural Sciences, Eskişehir Osmangazi University, Eskisehir 26040, Turkey
3
Translational Medicine Research and Clinical Center, Eskisehir Osmangazi University, Eskisehir 26040, Turkey
4
Department of Chemical Engineering, Faculty of Engineering, Kyrgyz-Turkish Manas University, Bishkek 720038, Kyrgyzstan
*
Author to whom correspondence should be addressed.
Catalysts 2021, 11(12), 1561; https://doi.org/10.3390/catal11121561
Submission received: 29 September 2021 / Revised: 10 December 2021 / Accepted: 15 December 2021 / Published: 20 December 2021

Abstract

:
In this study, novel carbon nanotube-supported Mo (Mo/CNT) catalysts were prepared with the sodium borohydride reduction method for the detection of L-cysteine (L-Cys, L-C). Mo/CNT catalysts were characterized with scanning electron microscopy with elemental dispersion X-ray (EDX-SEM), X-ray diffraction (XRD), UV-vis diffuse reflectance spectrometry (UV-vis), temperature-programmed reduction (TPR), temperature programmed oxidation (TPO), and temperature-programmed desorption (TPD) techniques. The results of these advanced surface characterization techniques revealed that the catalysts were prepared successfully. Electrochemical measurements were employed to construct a voltammetric L-C sensor based on Mo/CNT catalyst by voltammetric techniques such as cyclic voltammetry (CV) and differential pulse voltammetry (DPV). Further measurements were carried out with electrochemical impedance spectroscopy (EIS). Mo/CNT/GCE exhibited excellent performance for L-C detection with a linear response in the range of 0–150 µM, with a current sensitivity of 200 mA/μM cm2 (0.0142 μA/μM), the lowest detection limit of 0.25 μM, and signal-to-noise ratio (S/N = 3). Interference studies showed that the Mo/CNT/GCE electrode was not affected by D-glucose, uric acid, L-tyrosine, and L-trytophane, commonly interfering organic structures. Natural sample analysis was also accomplished with acetyl L-C. Mo/CNT catalyst is a promising material as a sensor for L-C detection.

1. Introduction

L-cysteine (L-Cys, L-C), a semi-essential and proteinogenic amino acid, contains a sulfur-containing thiol group in its side chain. L-C is known by the codes of E910 L-C, E920 L-C hydrochloride, and E921 L-C hydrochloride monohydrate. The human body can synthesize L-C under normal physiological conditions. It exists naturally in many foods such as wheat, broccoli, eggs, chicken, duck, asparagus, garlic, onions, carob, beef, yogurt, cheese, oats, and even red pepper at various amounts. Daily consumption of these high protein-content foods provides a sufficient amount of L-C for the human body [1,2,3,4,5,6,7].
L-C deficiency can reduce the ability of the immune system against free radicals and cause damage. Vegetarians consume insufficient amounts of methionine, vitamins B6 and B12, folic acid, s-adenosyl methionine, and could have L-C deficiency. The employment of L-C is vital for treating growth delay, loss of hair, formation of edema, liver damage, muscle and fat regression, lethargy, skin lesions, and fatigue. Medical materials, biological structures, food sources, and industrial products contain L-C at required amounts for the human body. The detection of L-C is significant for determining the deficiency and treatment of L-C. L-C levels could be sensed with spectrometric-chromatographic separation, colorimetric, and electrochemical methods [8,9].
Electrochemical methods have significant advantages such as (i) electrochemical measurements are often specific for an oxidation or reduction step of an element, (ii) the reaction rate can be controlled, (iii) electrochemical methods give information about the activity of chemical species, (iv) devices used in electrochemical methods are cheaper than others, (v) electrochemical reactions can be carried out under mild conditions, (vi) electrochemical methods are environmentally friendly. For electrochemical L-C determination, there are several studies and their sensitivity, linear range, and limit of detection (LOD) values were tabulated in Table 1. According to the studies carried out on CuFe2O4/rGO-Au [10], copper-electrodeposited screen-printed gold electrode [11], AgNPs/GQDs/GCE [12], Ru(III) Schiff Base Complex [13], and MnO2-CNTs [14] electrodes, one can note that the linear range changes between 0.05 and 1800 μM with good (LOD) values. It is evident that to develop and commercialize the L-C sensor, a broad linear range and low LOD values are required. This could be achieved with the synthesis of novel nano-sized electrodes.
Carbon is an ideal electrode material due to its features such as providing a large anodic potential range, low electrical resistance, low residual current, reproducible surface structure and in aqueous media a wide range in the reduction and oxidation region. Thus, carbon-based or carbon-supported metal electrodes are widely used for the electrochemical determination of glucose [15,16,17,18,19], hydrogen peroxide [20,21,22,23,24,25,26,27,28], and amino acids [29,30]. In our previous studies, carbon nanotube-supported Pd, Pt, and Ru catalysts were employed as L-C sensors [29]. We reported that a Ru/CNT modified L-C sensor showed good performance with 0–200 μM linear response and 0.3058 μA/μM current sensitivity, and with 0.353 μM as the lowest detection limit [29]. In our another study, CNT-supported Ru-Mo-Pd catalyst-modified electrodes were examined for the L-C sensing and we observed that Ru-Mo-Pd/CNT modified sensor had 5–200 μM linear range with high current sensitivity of 0.136 μA/μM and 0.1 μM as the lowest detection limit [30]. The present study showed that the Mo and Pd addition to Ru led to reach the lowest LOD value. Thus, Mo/CNT/GCEs for sensing L-C should be investigated to understand the role Mo addition for L-C detection. In this context, the CNT-supported Mo catalyst is evidently a promising nanocatalyst as an electrode material for the electrochemical detection of L-C. Moreover, before the present study, Mo modified or Mo/CNT/GCEs have not been studied previously.
At present, sodium borohydride reduction method was employed for the synthesis of Mo/CNT catalyst. Mo/CNT was characterized by SEM-EDX, XRD, UV-Vis, TPR, TPO, and TPD to determine the surface properties of Mo/CNT catalyst by using Mo/CNT catalyst and an electrode constructed on a glassy carbon electrode (GCE). Electrochemical measurements to determine sensitivity, limit of detection, limit quantification CV and DPV measurements were performed. EIS measurements were performed to understand the charge transfer properties of this Mo/CNT-modified GCE electrode.

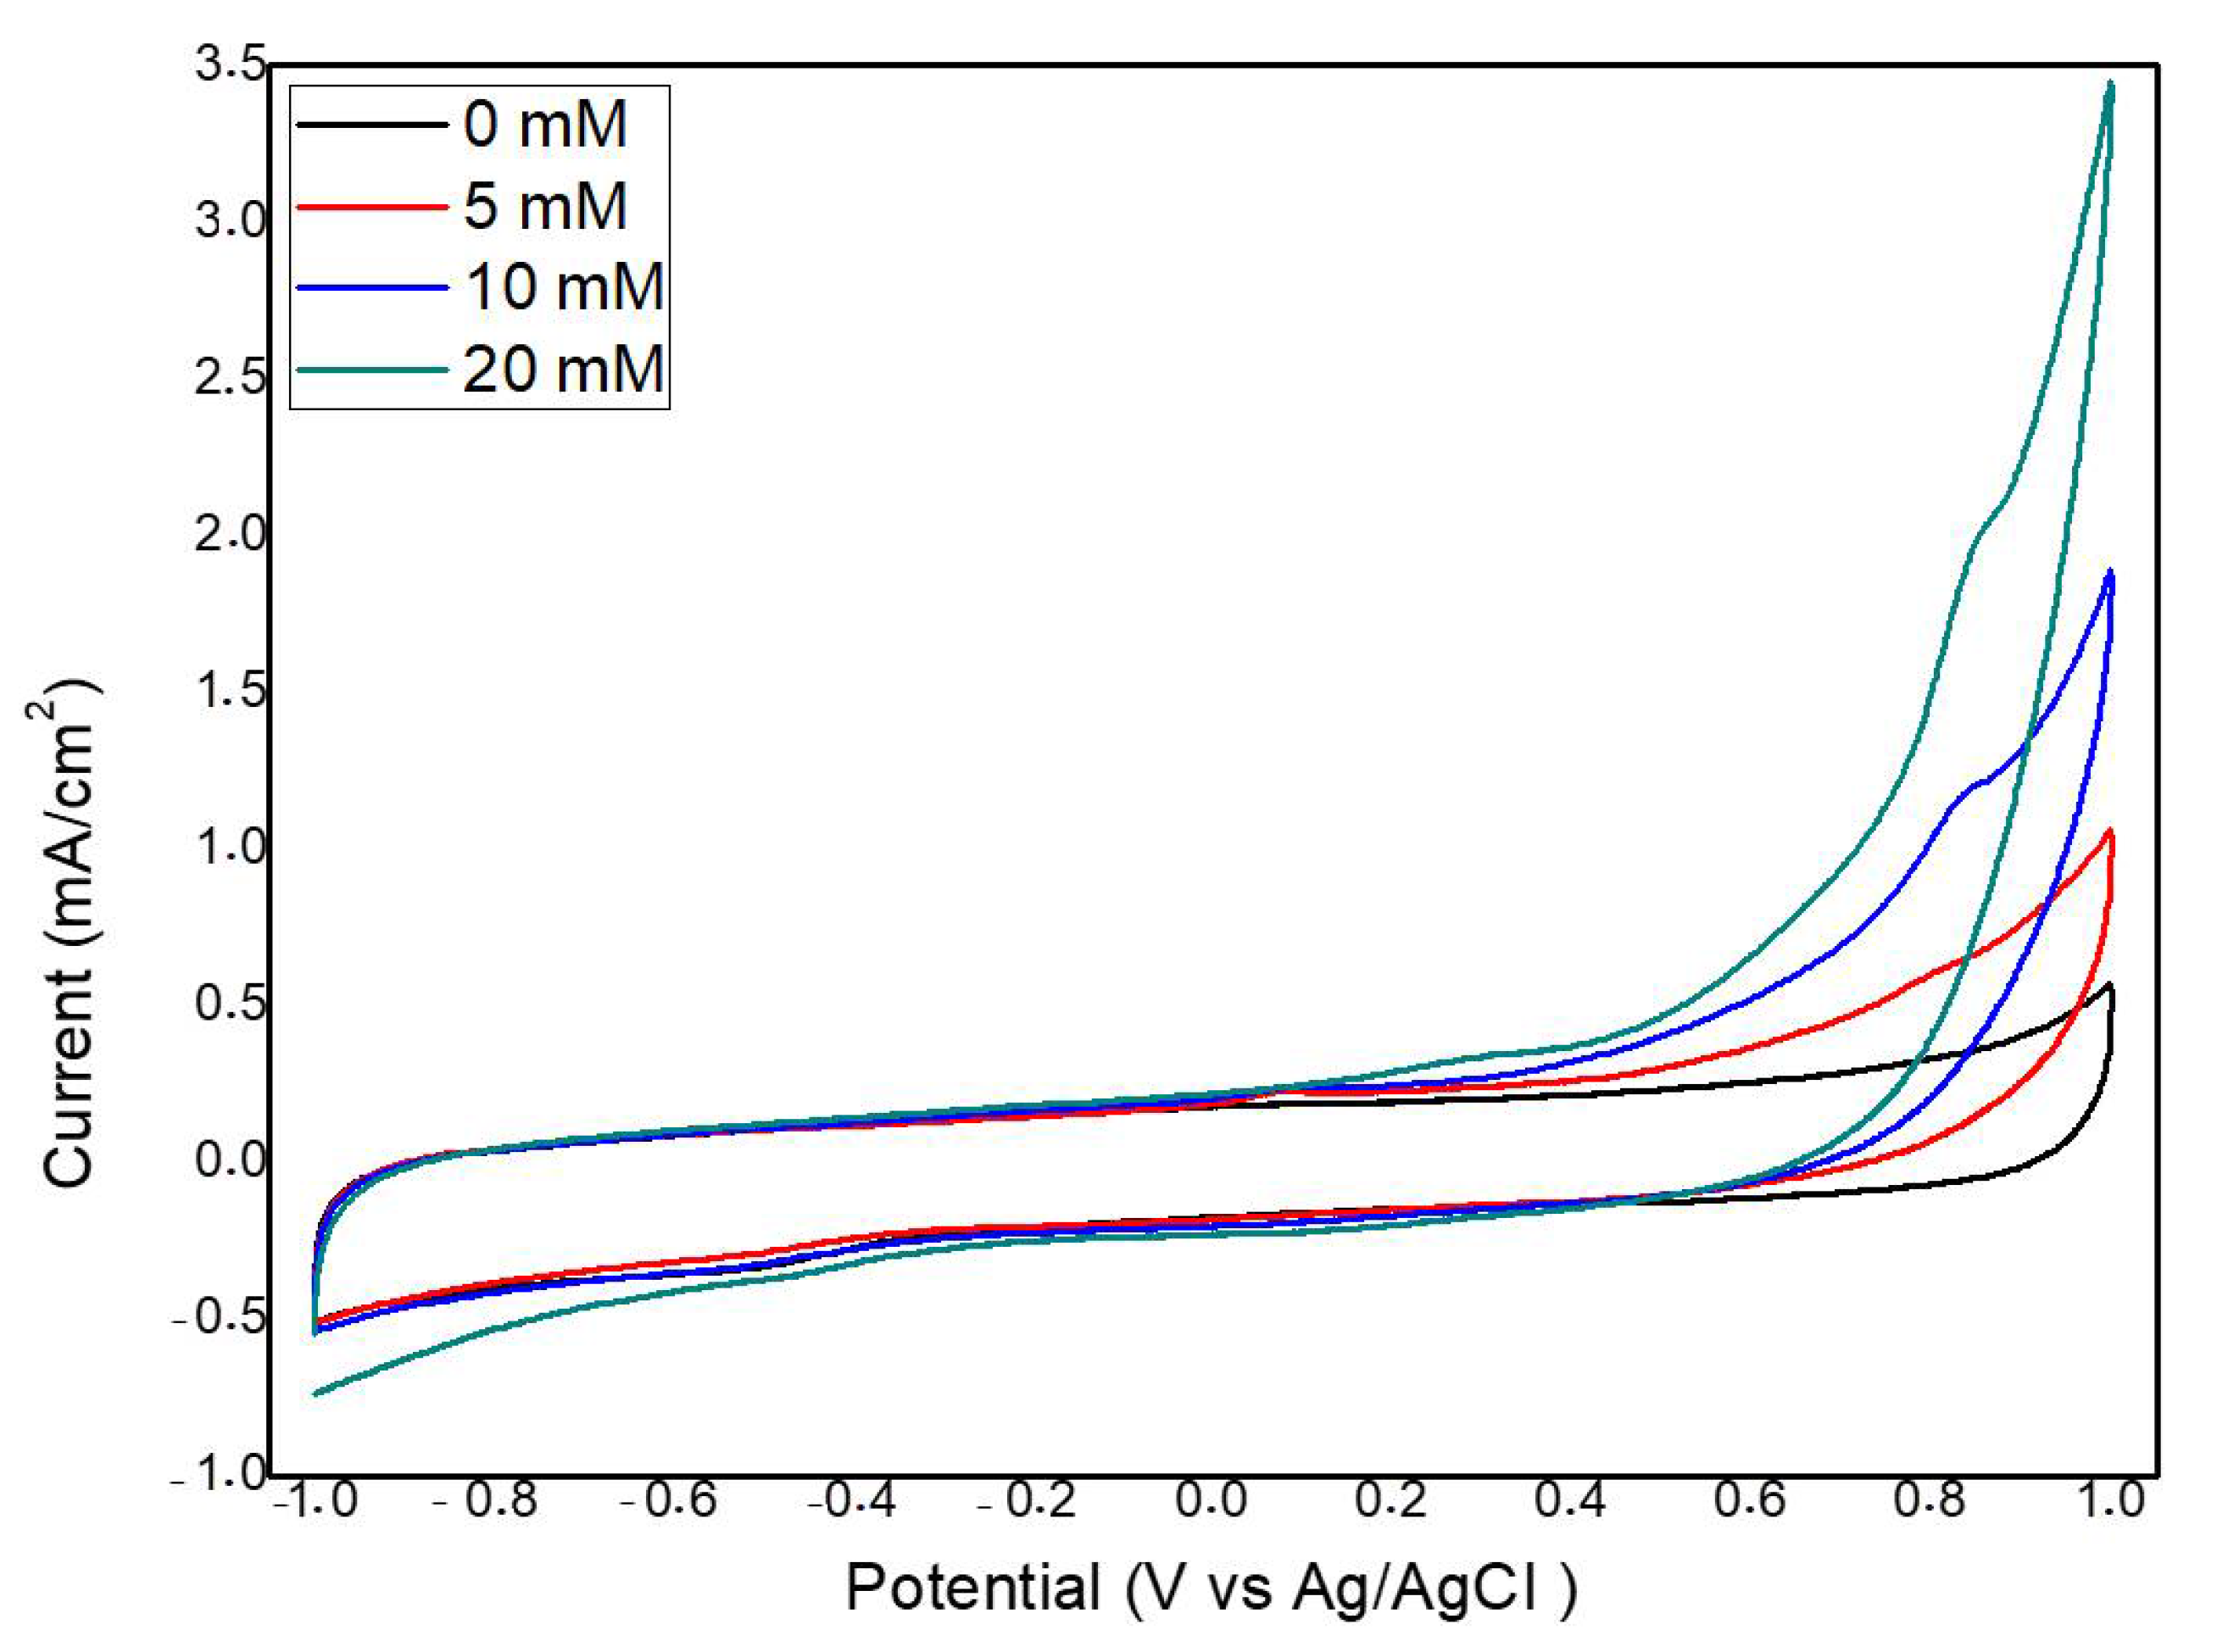
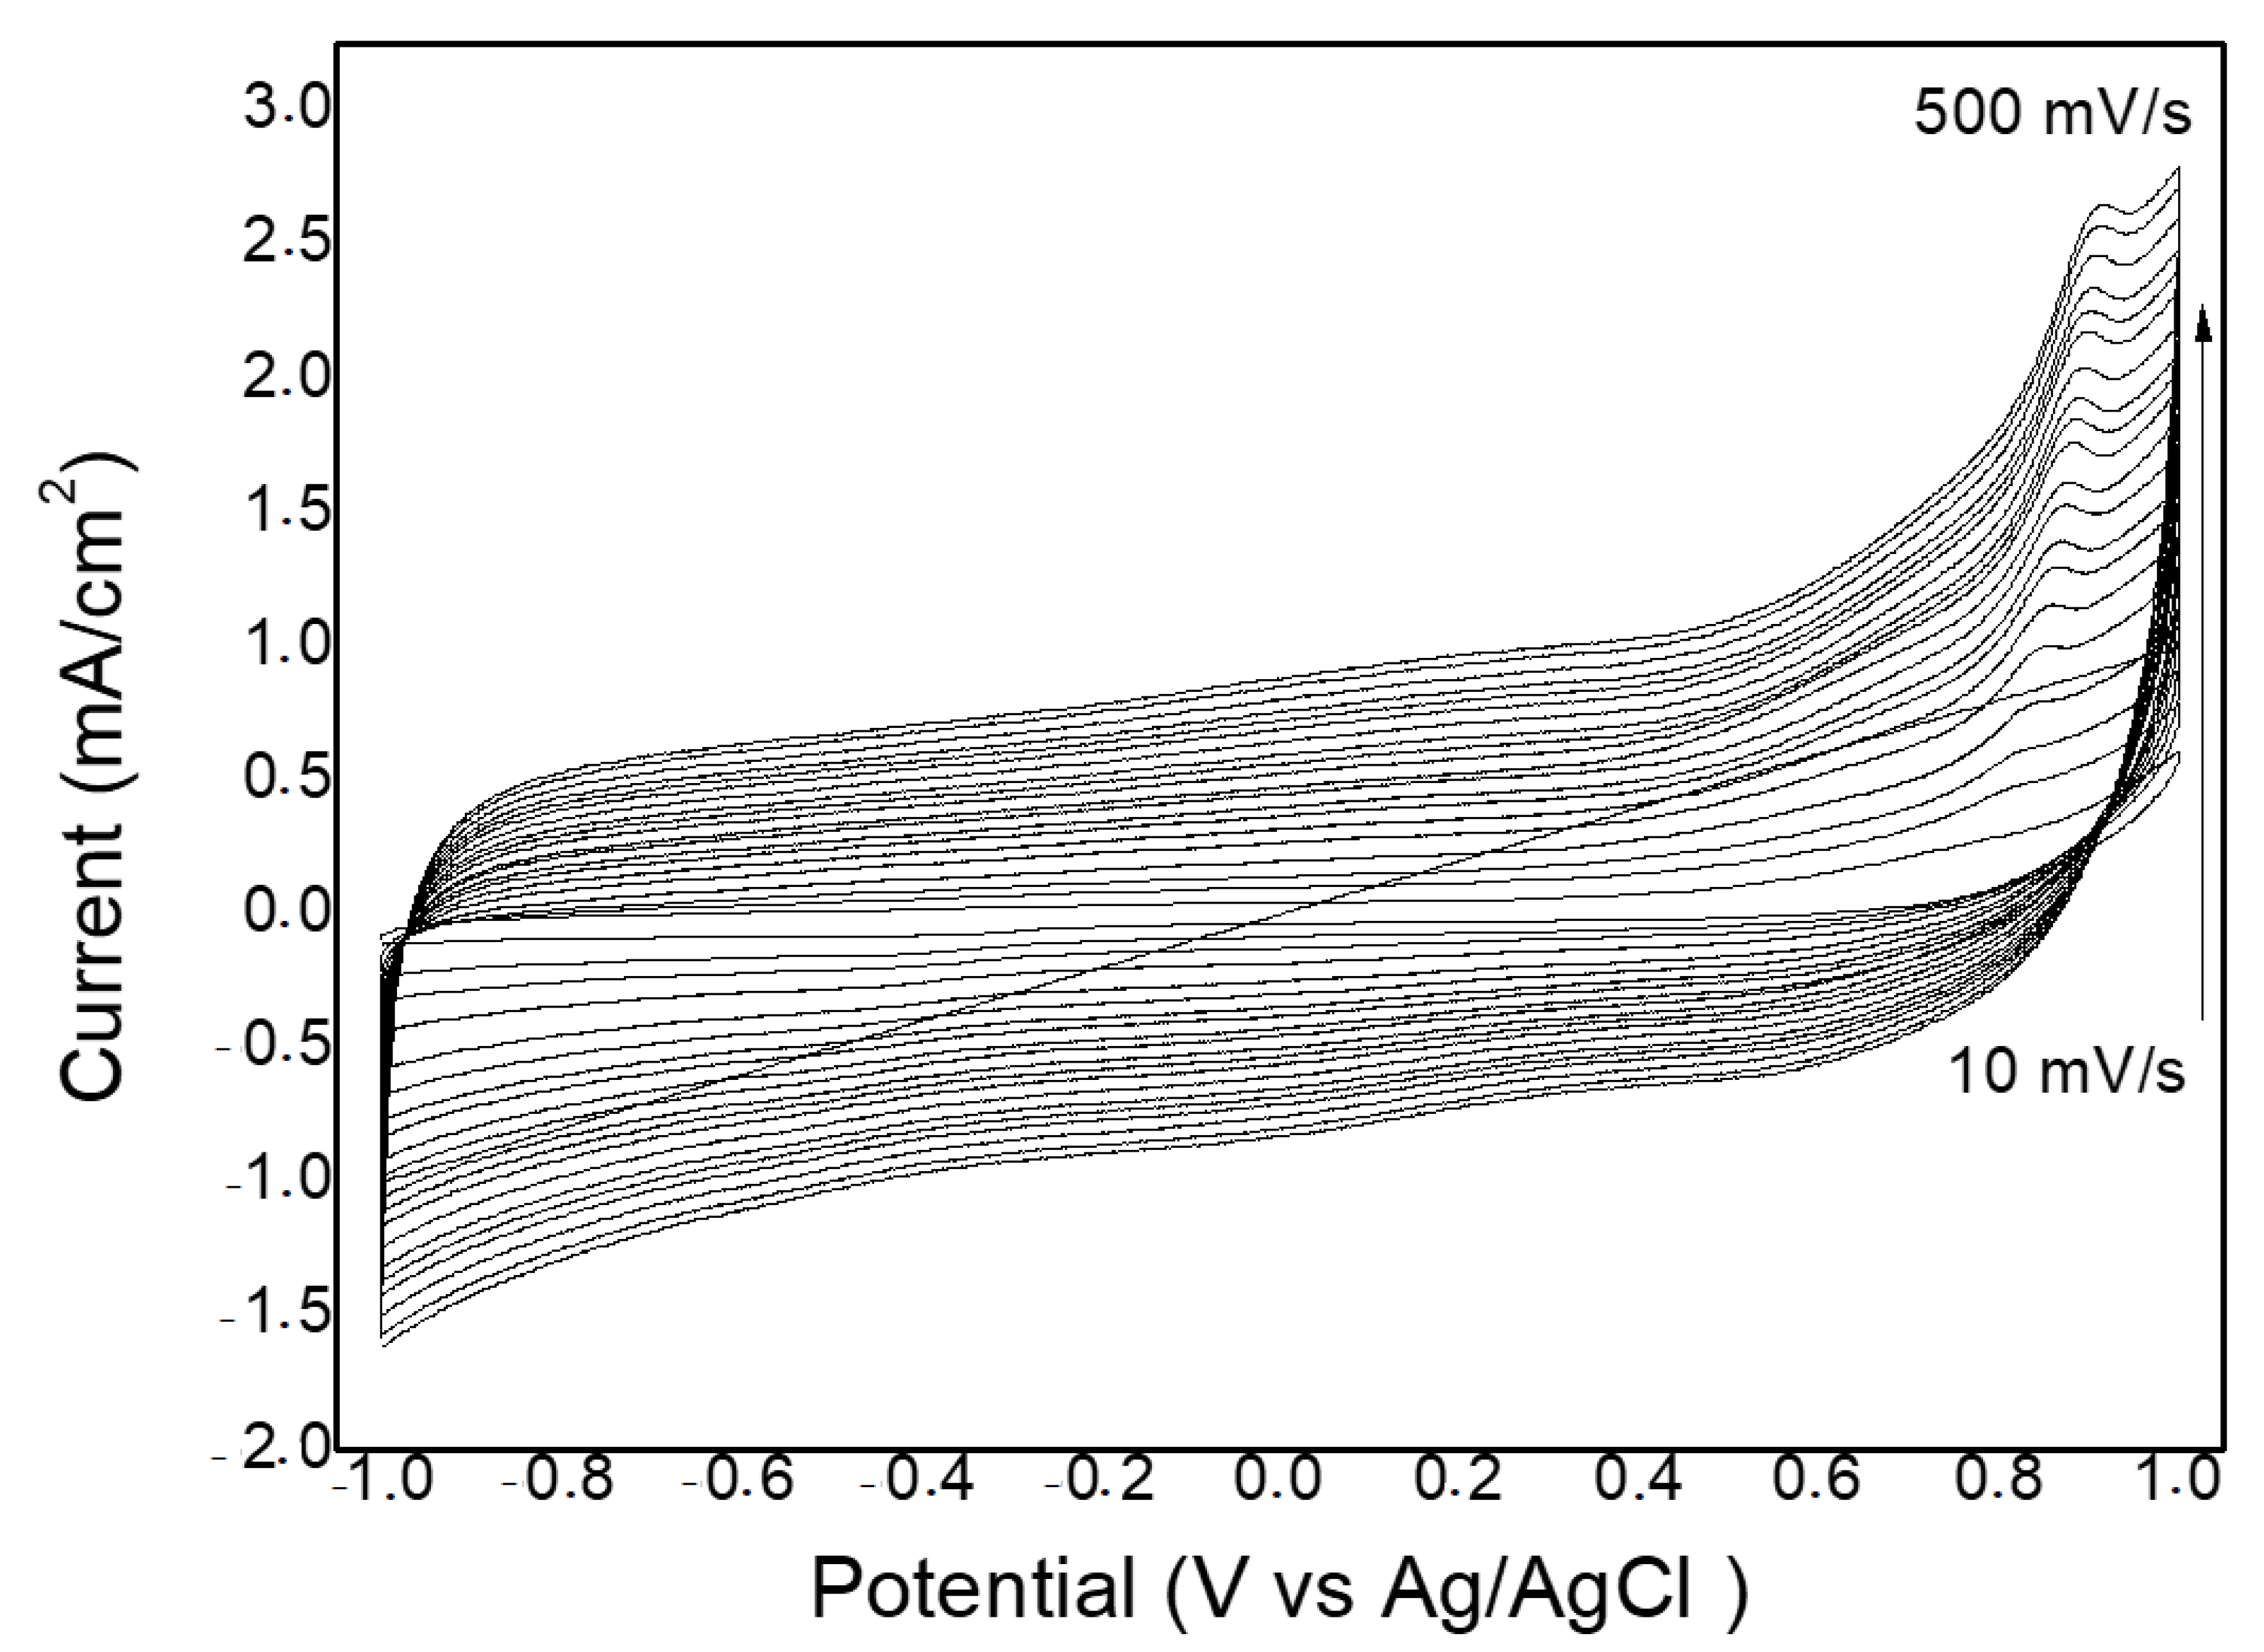
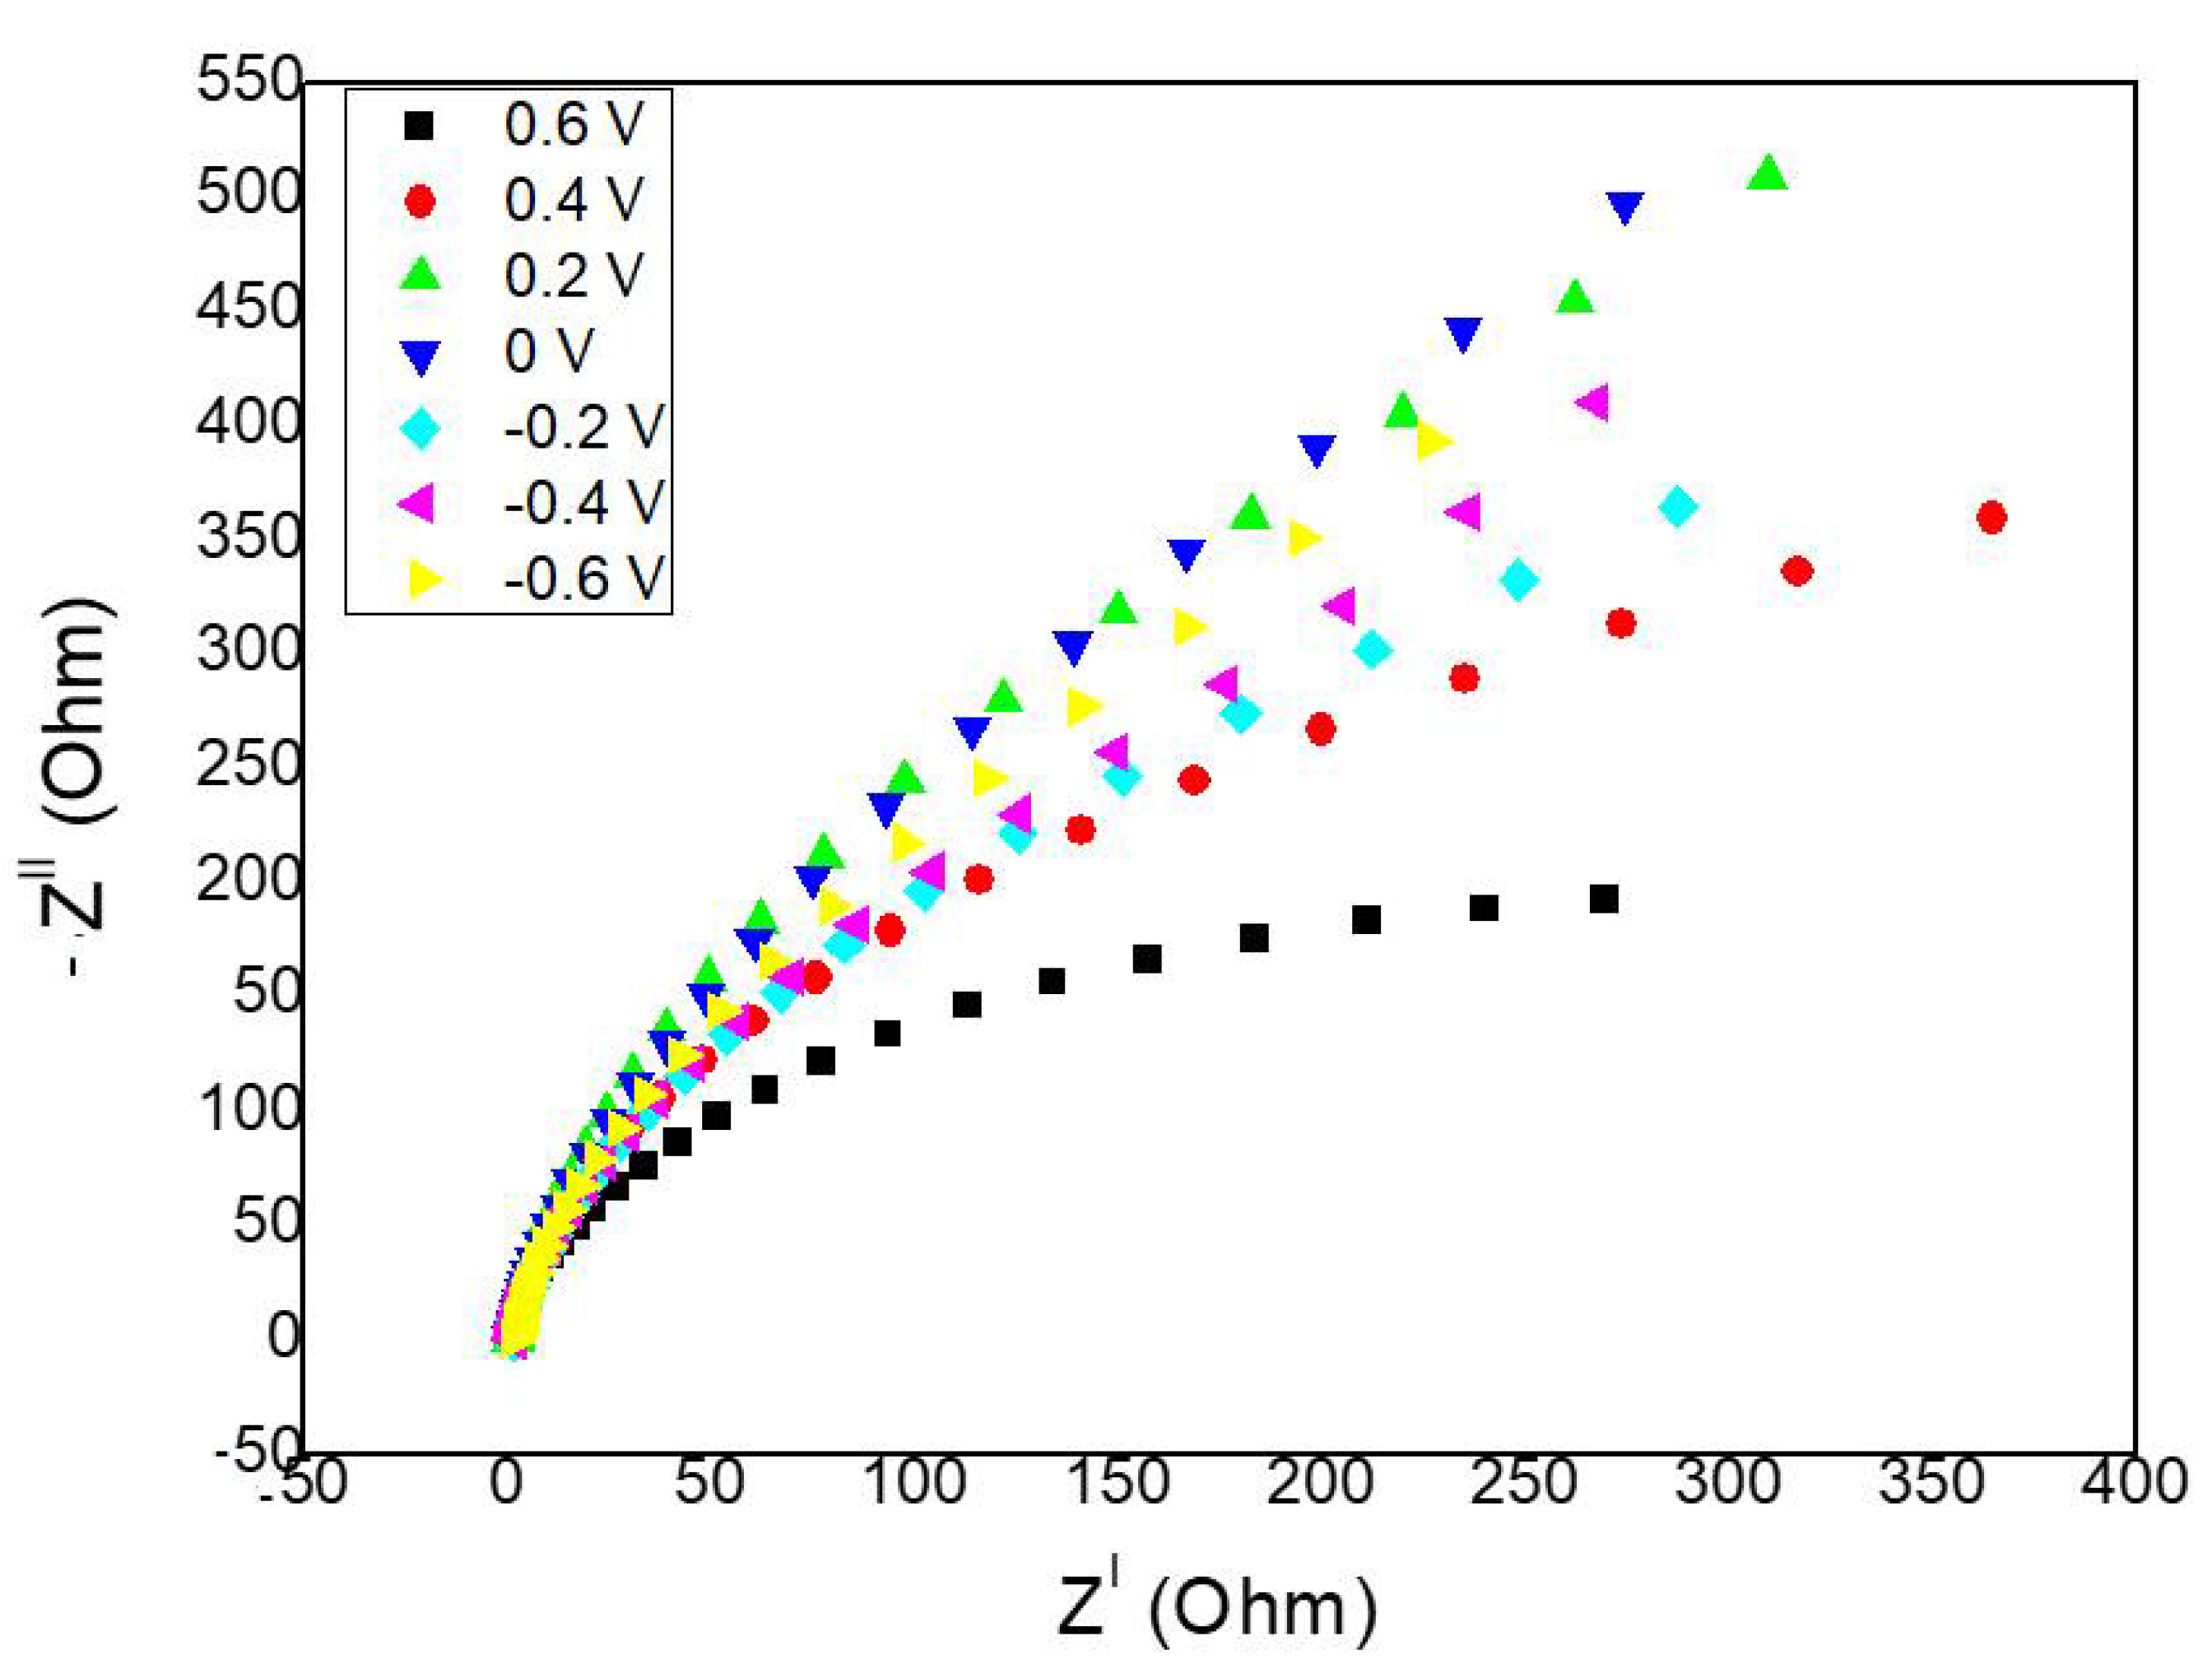
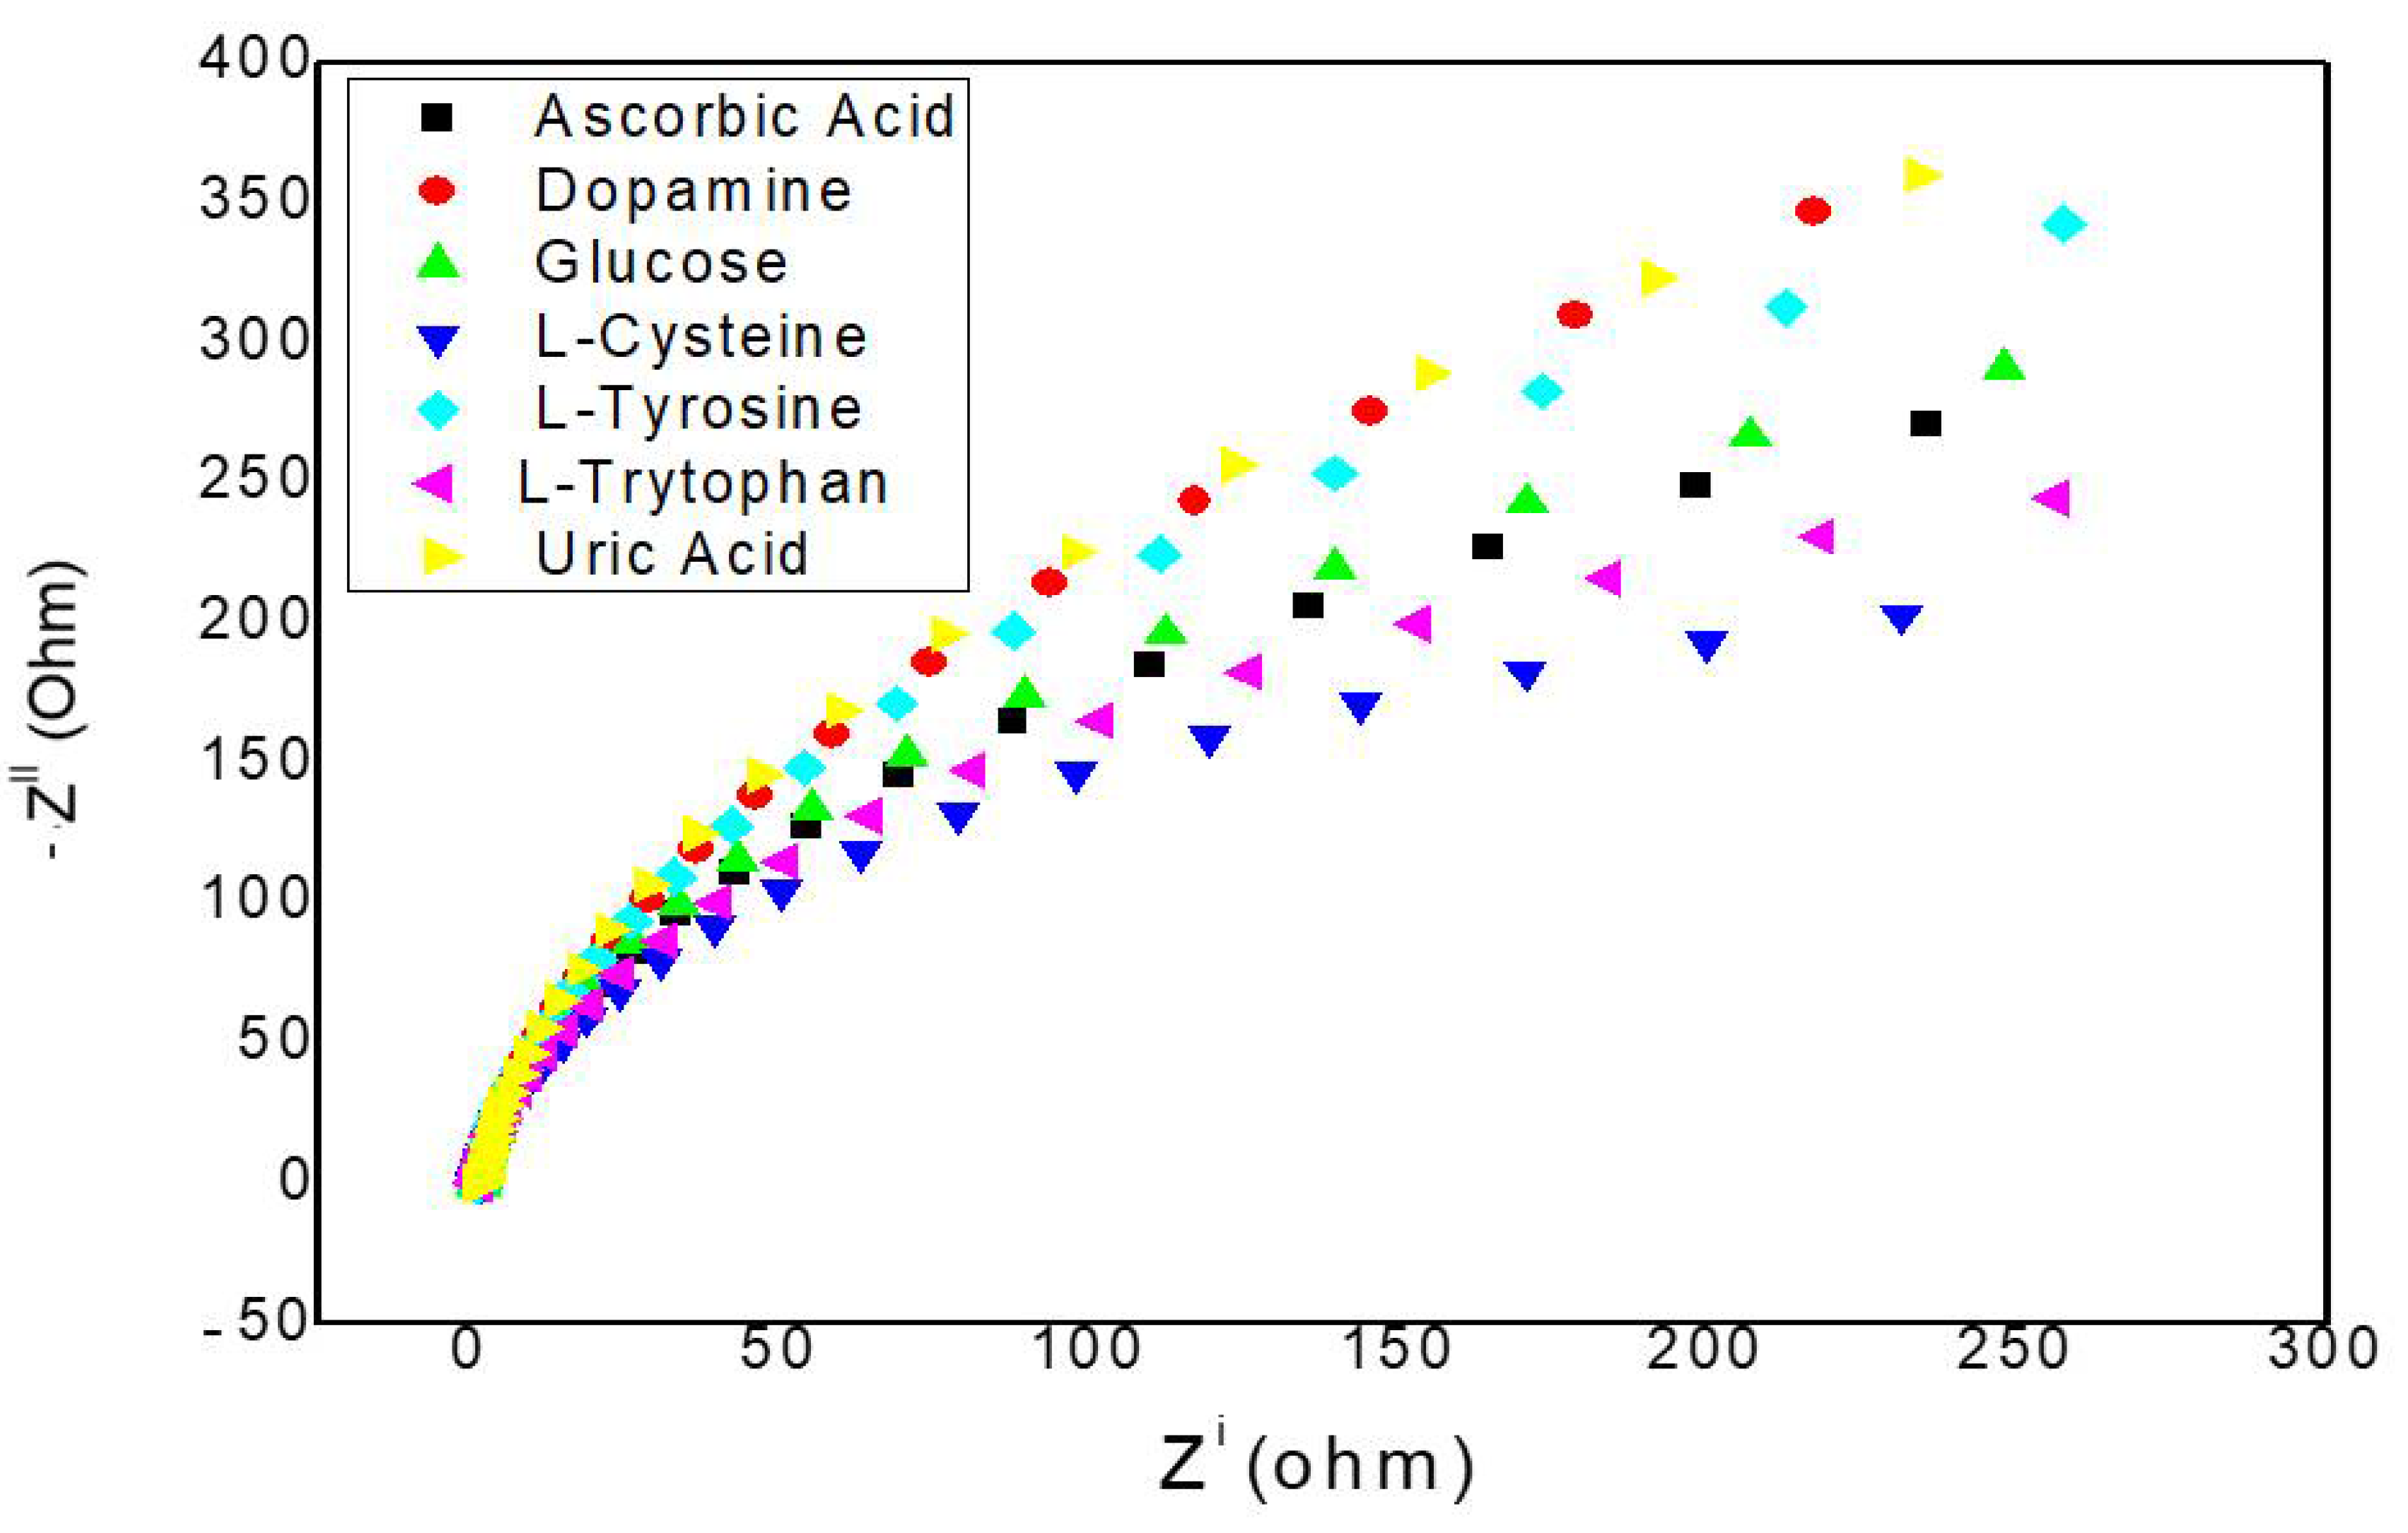
2. Results and Discussion

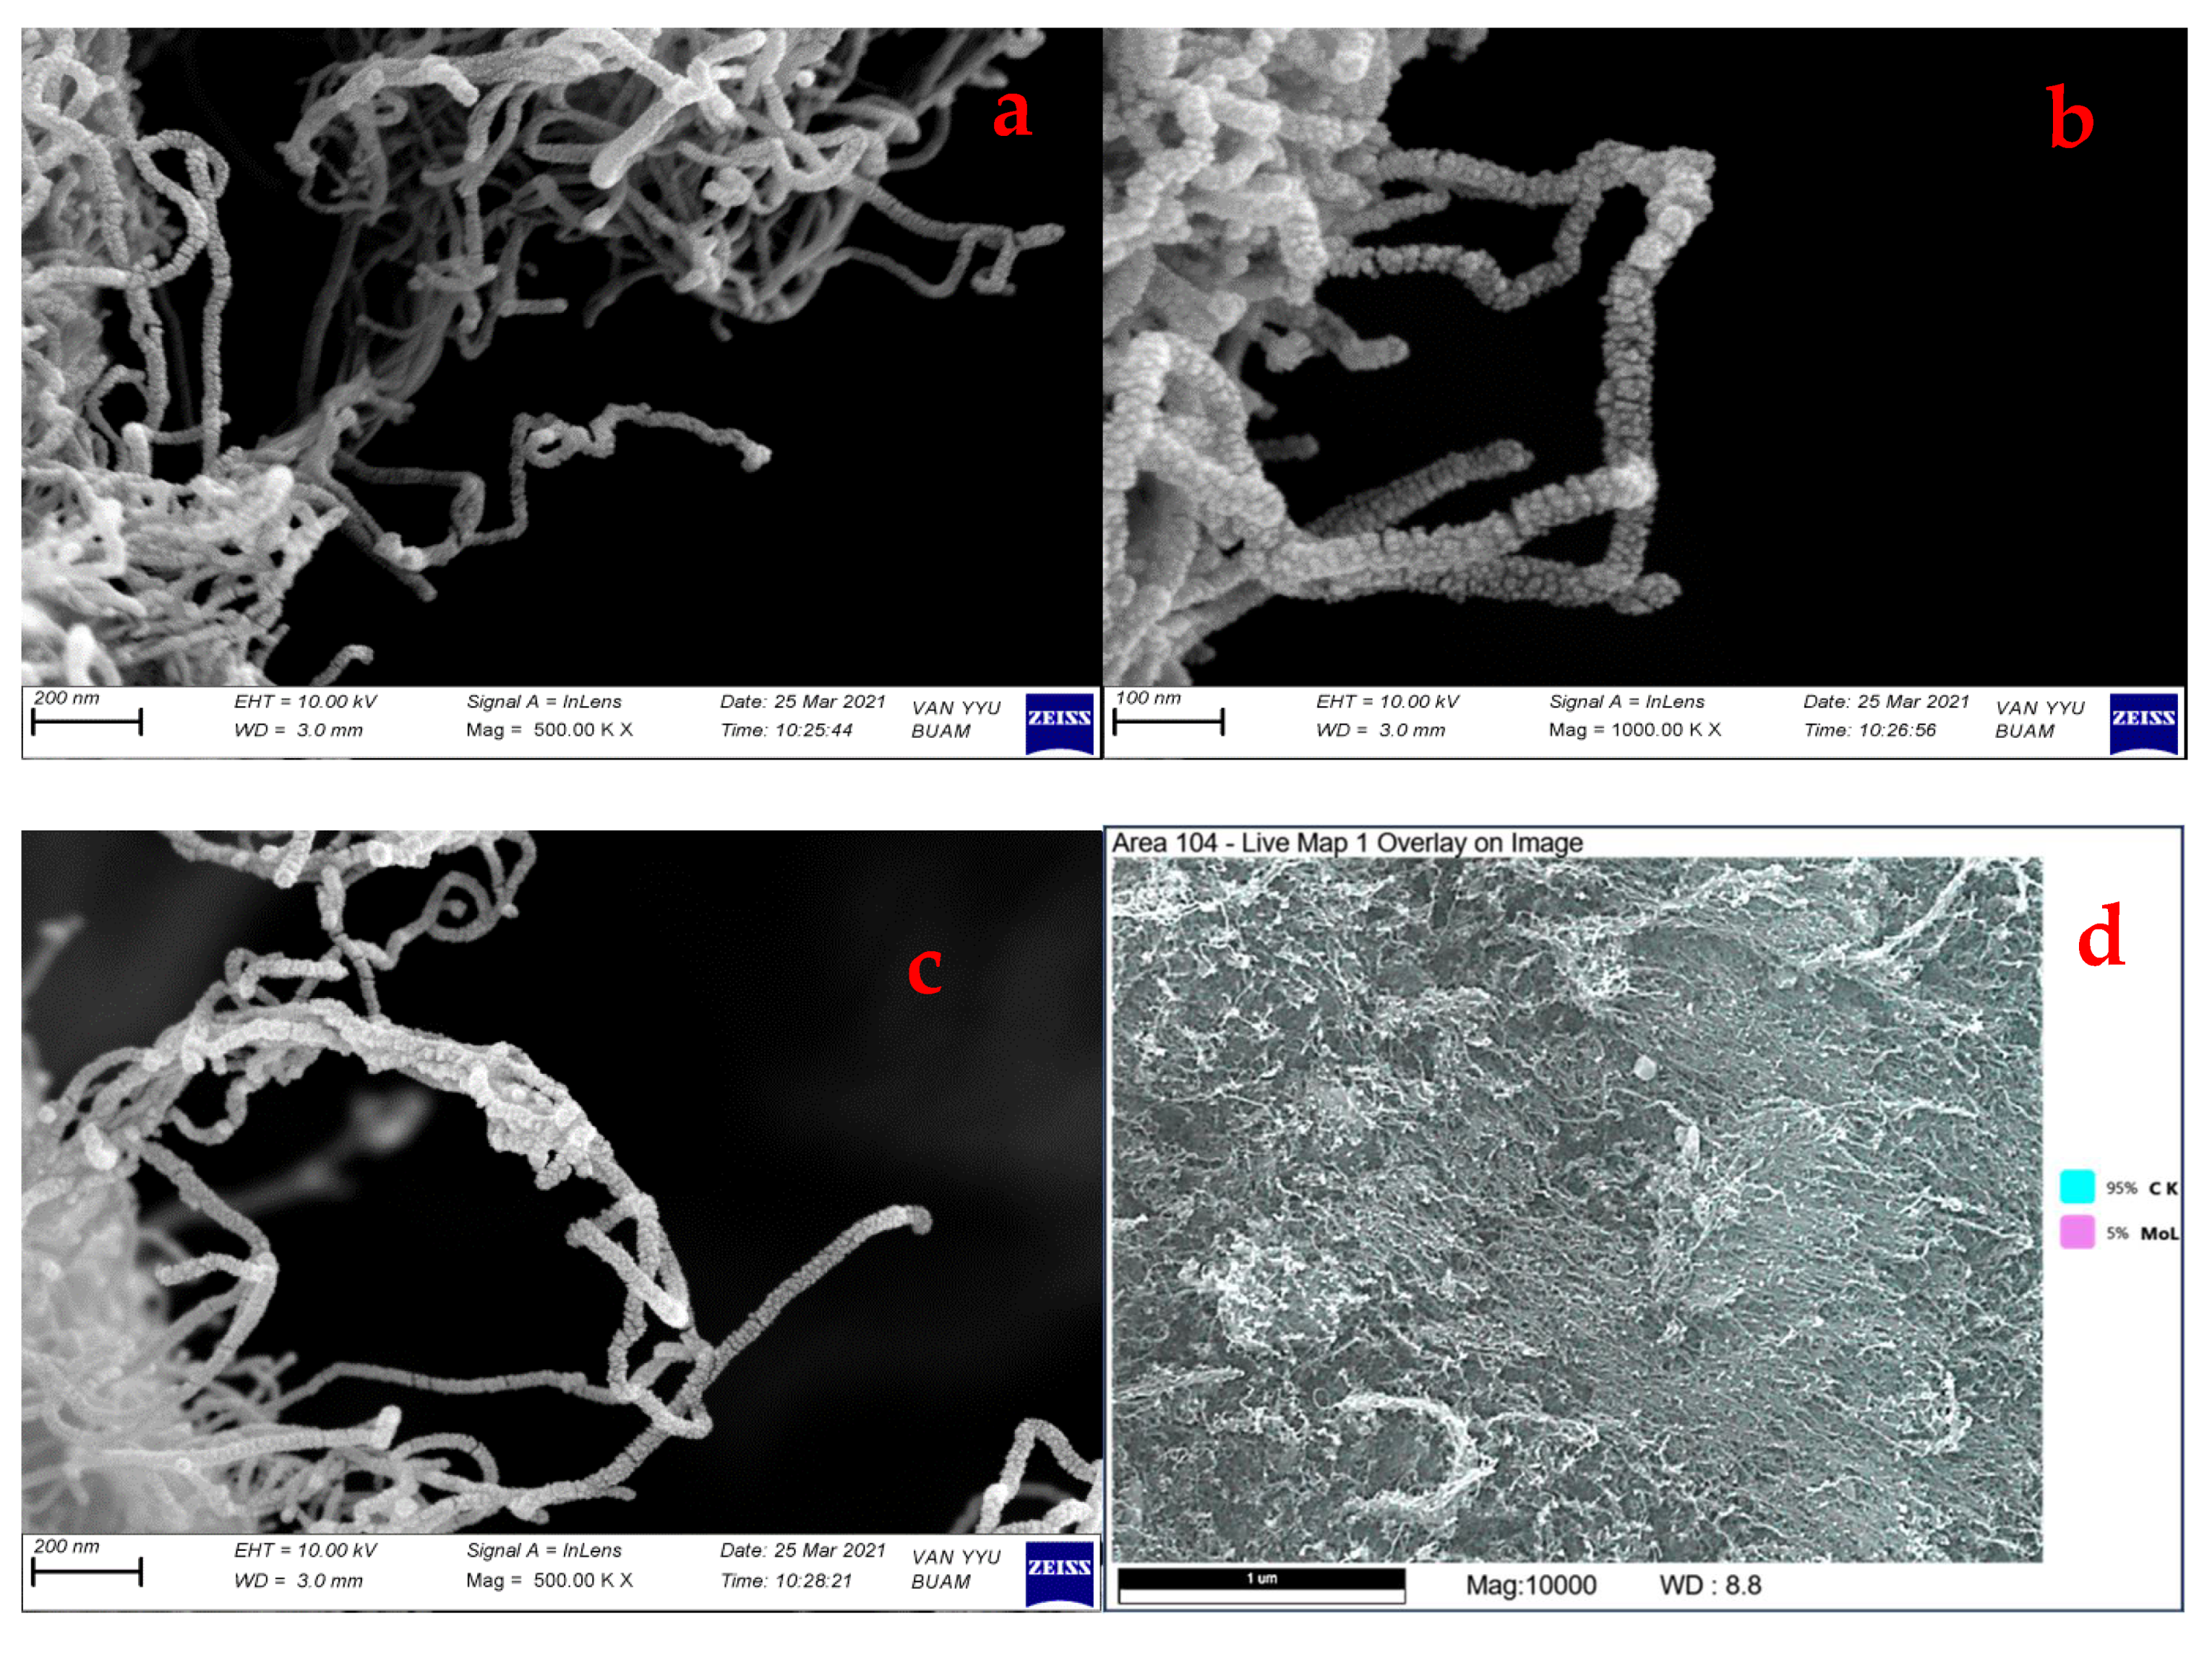
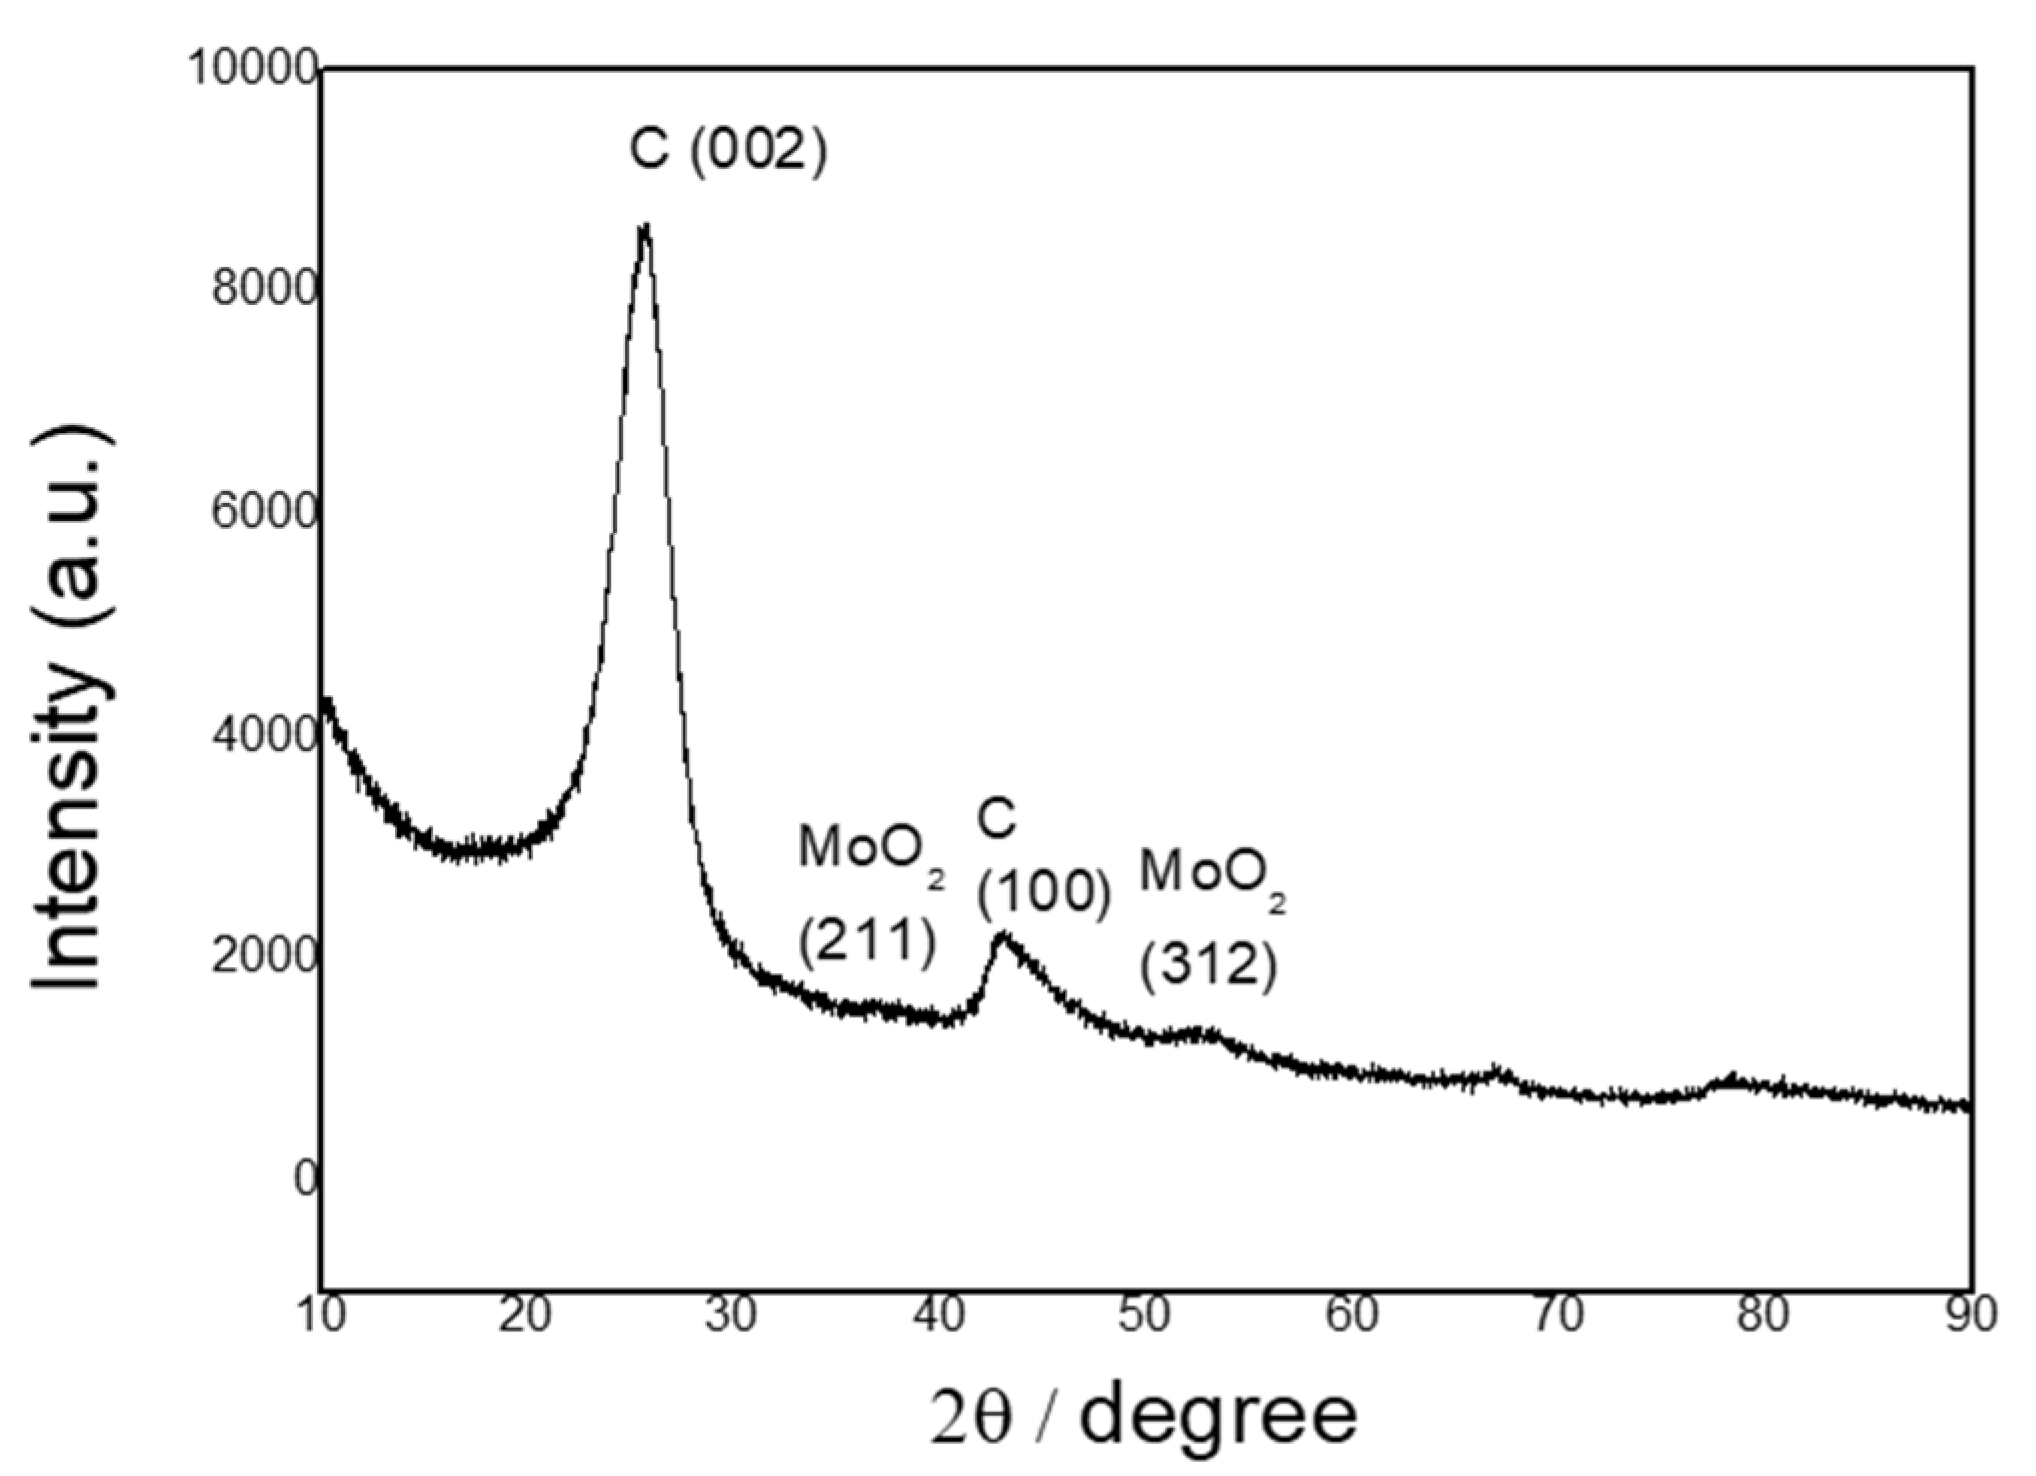
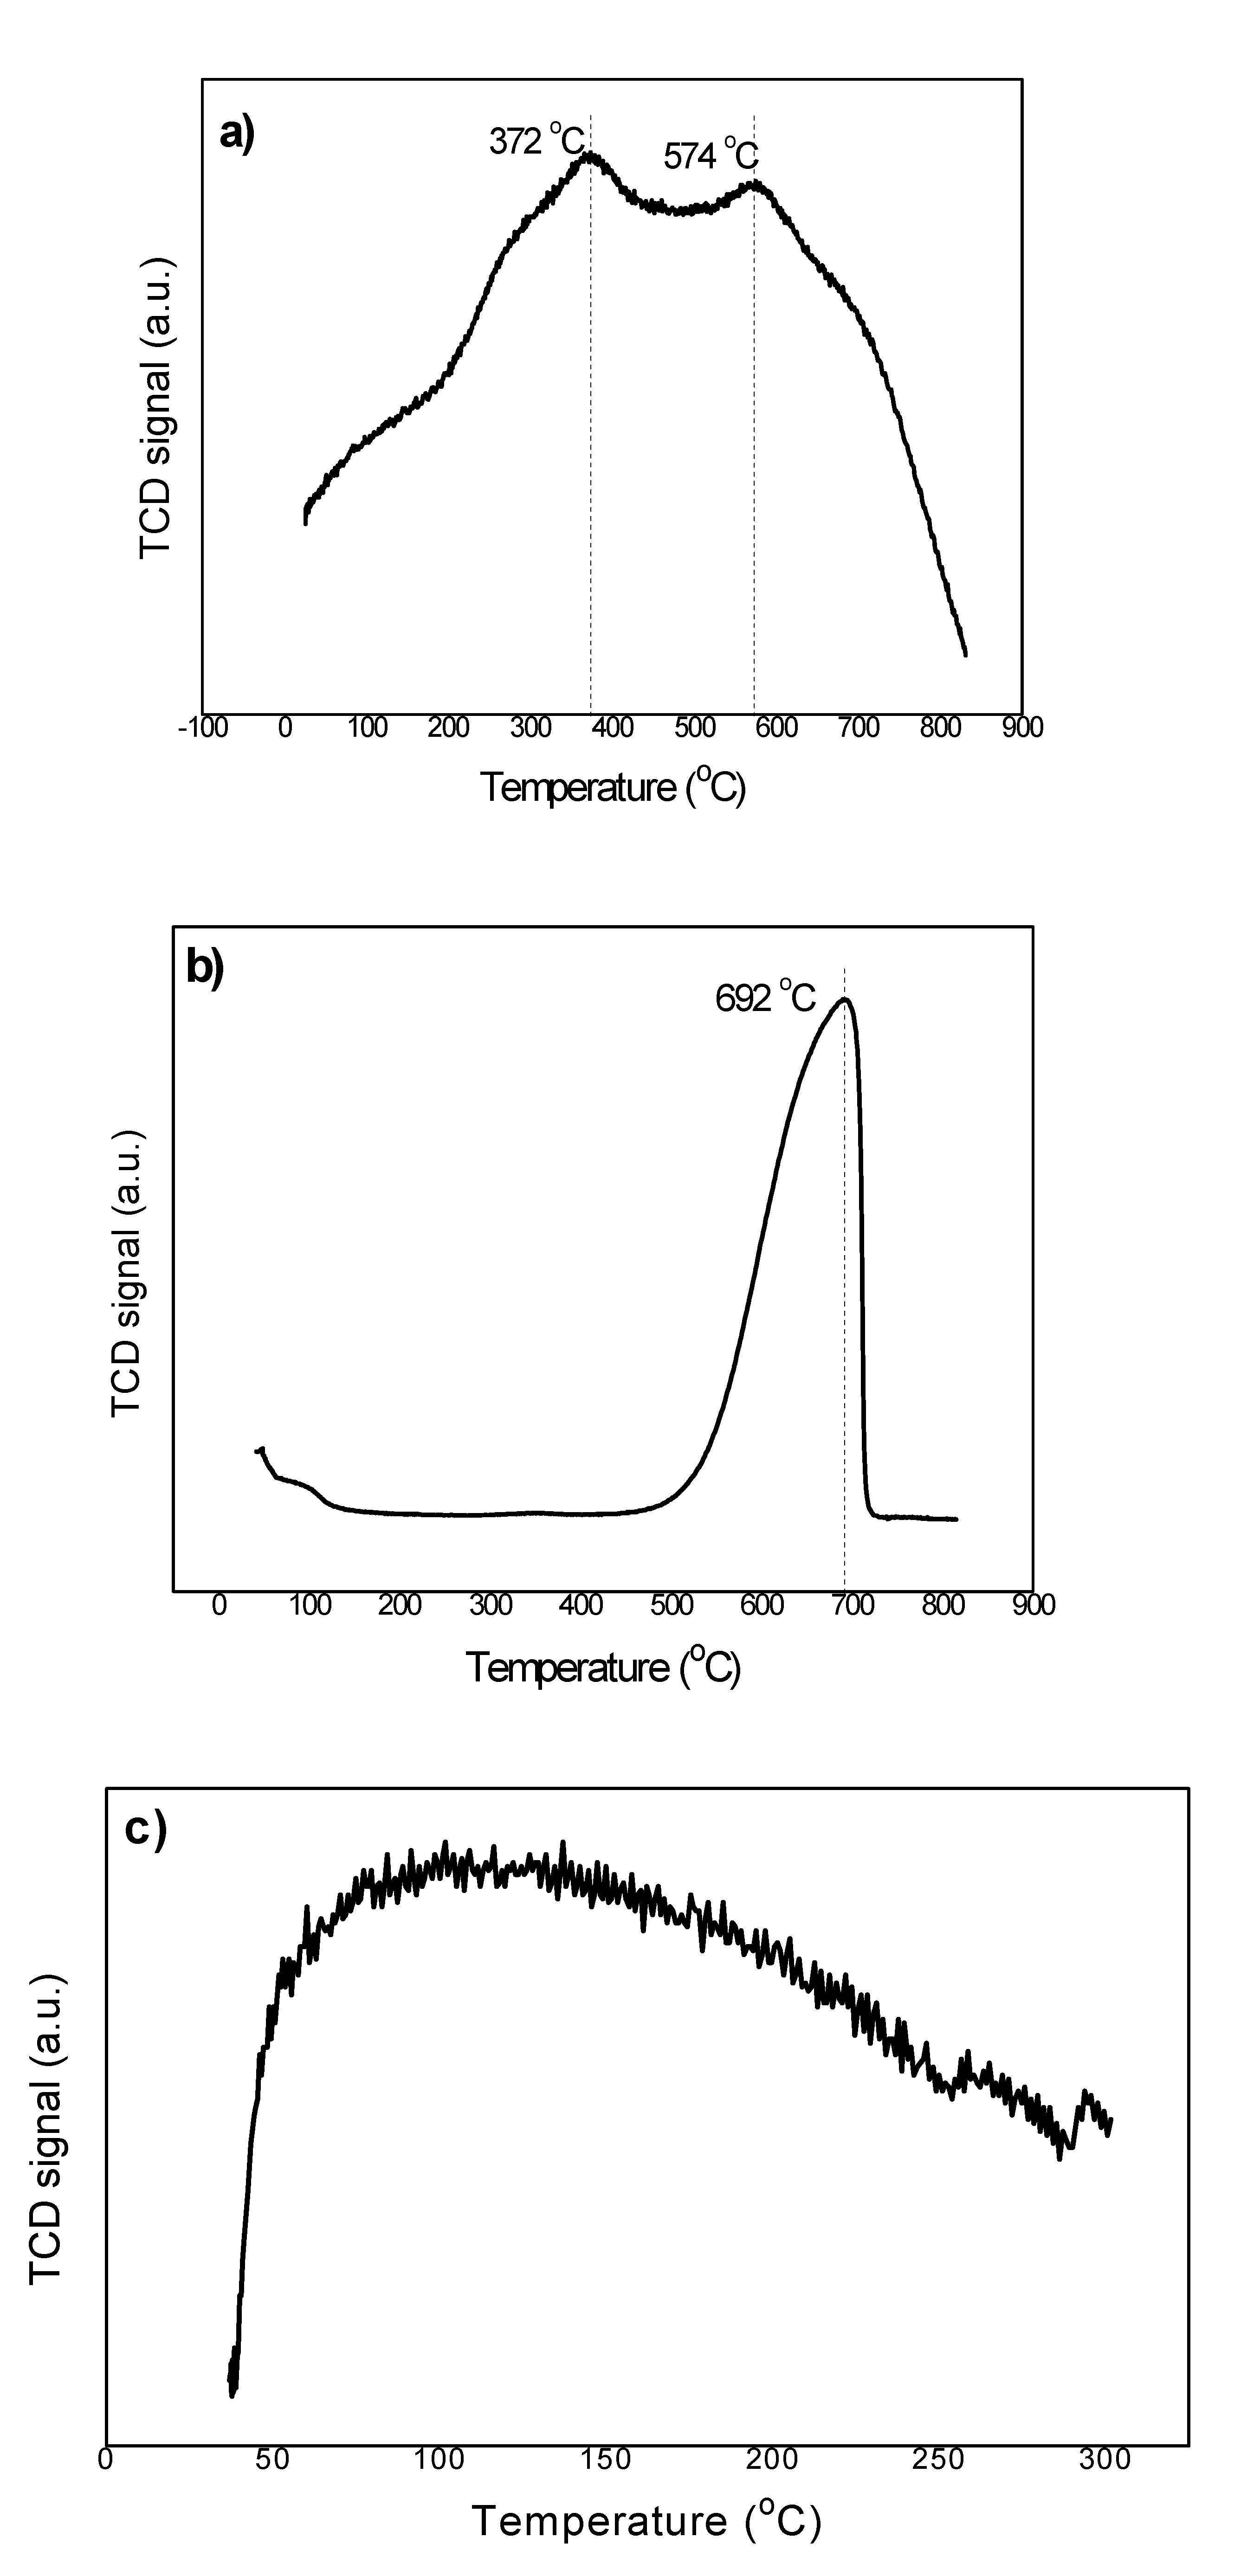
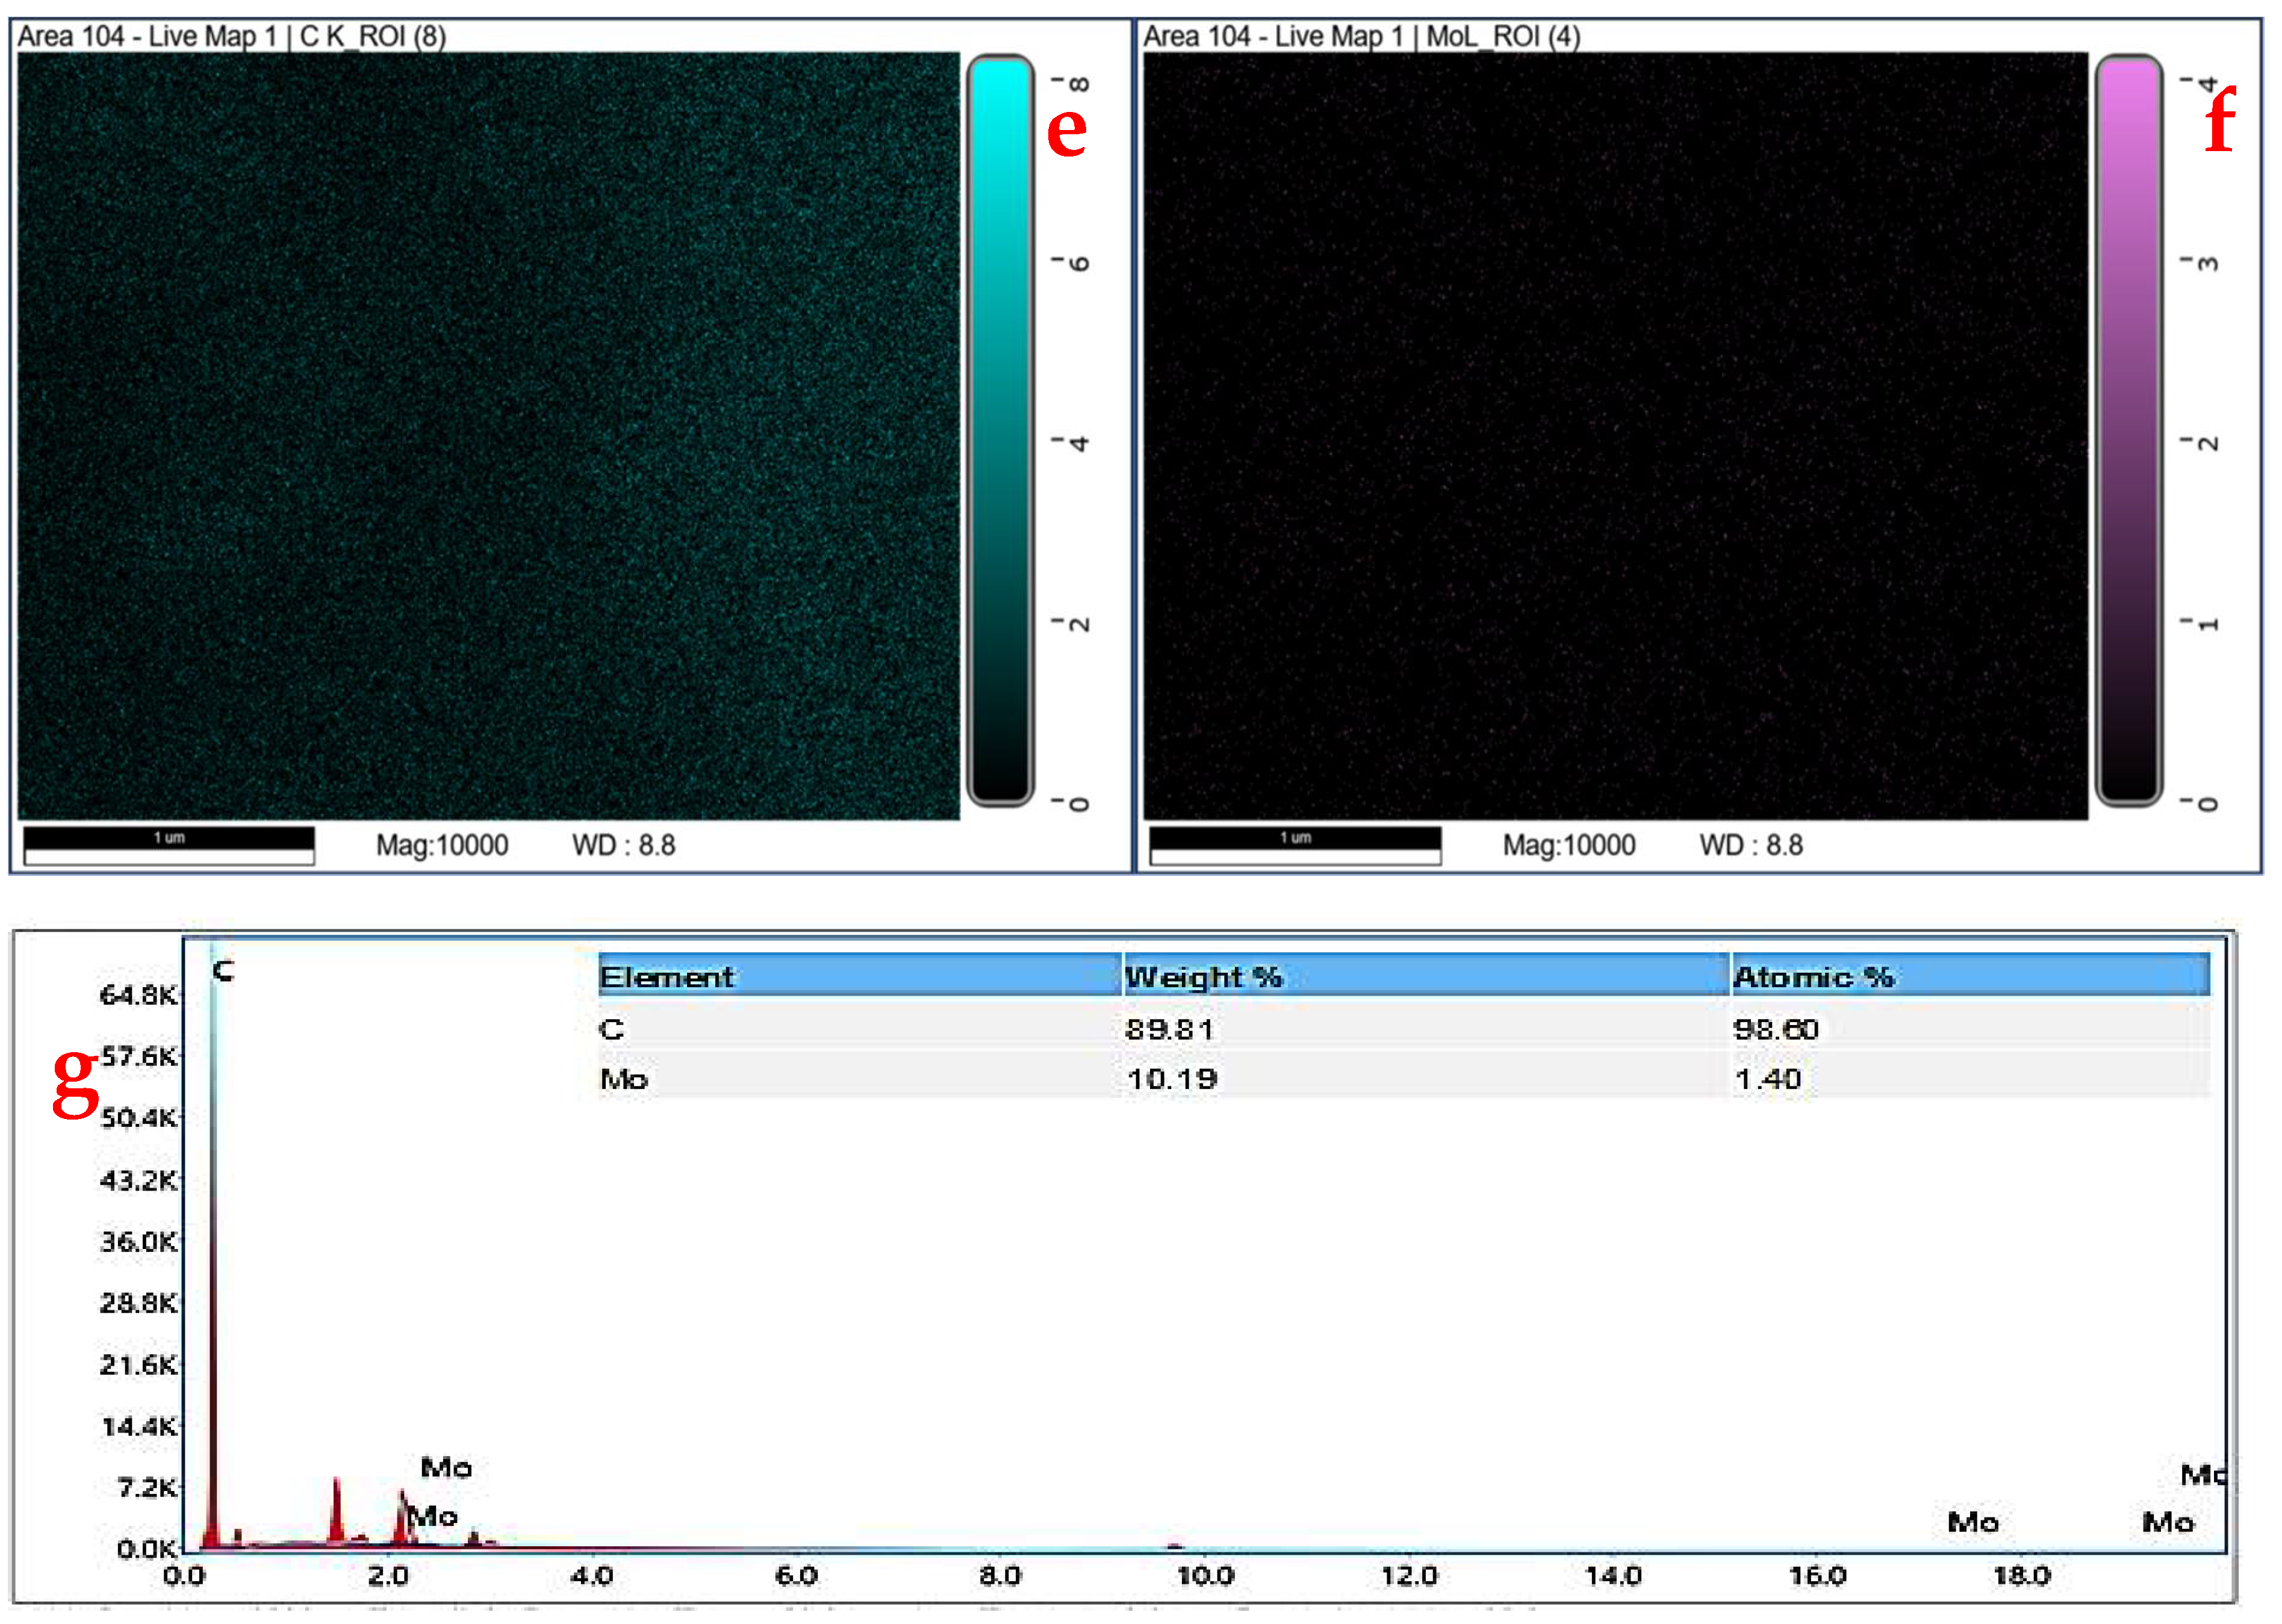
2.1. Physical Characterization

SEM-EDX mapping analysis was carried out to examine the surface morphology of the Mo/CNT catalyst. Figure 1a–g illustrates the SEM-EDX and mapping analysis results of the Mo/CNT catalyst. As shown in Figure 1a–c, it was observed that CNT networks were formed. Mo particles were homogeneously distributed in these networks. According to the mapping and EDX analysis of the Mo/CNT catalyst, CNT turquoise and Mo atoms purple color were presented in Figure 1e,f, respectively. The weight percentage and atomic ratios of Mo atoms from EDX results of CNT and Mo were shown in Figure 1g, the weight percentages of CNT and Mo were 89.81% and 10.19%, respectively. One Note that nominal atomic percentage values of CNT were 98.60% and 1.40% for Mo. The weight percentage value of Mo/CNT catalyst was close to the nominal percentage of 10% Mo. This result showed that Mo/CNT catalyst was successfully prepared. The results of SEM-EDX and mapping analysis demonstrated that the desired structure was obtained, The carbon nanotube structures were clearly observed from Figure 1a–d. On the other hand, as can be seen from Figure 1b,c, more bright points were observed that are located inside the tubes. These points can be ascribed to the existence of Mo particles in CNT.
The XRD pattern of 10% Mo/CNT catalyst is given in Figure 2. The characteristic peaks of the CNTs appear at 2θ values of 25.00° and 43.5°. The existence of strong and sharp diffraction peaks at 2θ = 25.70 was indexed to the (002) reflection of graphite. Furthermore, the peak observed at 43.5° was indexed to C (100) crystal plane. Other broad peaks at 36.8° and 53.7° were assigned to the MoO2 (211) and MoO2 (312) facets of typical monoclinic MoO2 (JCPDS card 32-0671). Only two broad and weak diffraction peaks located at about at 36.8° and 53.7° indicated a good dispersion of MoO2 nanoparticles on the CNTs [31,32,33,34].
The electronic structure and the surface coordination geometry of the Mo species formed during synthesis were determined by diffuse reflectance UV-Vis spectroscopy. The relationships between UV-Vis spectral features and the molybdenum surface state have been widely debated in the literature. We can note that the Mo6+/CNT system at 218 nm from the analysis of the spectra reported in Figure 3 [35,36,37].
The H2-TPR (a), O2-TPO (b), and NH3-TPD (c) profiles of the 10% Mo/CNT catalyst were illustrated in Figure 4a–c. H2-TPR analysis was employed to investigate the behavior of the samples during the reduction with hydrogen between 25 °C and 830 °C. For Mo/CNT, two reduction peak formed during H2-TPR analysis up to 830 °C. Figure 4a illustrates these reduction peaks located at 372 °C and 574 °C. The first peak at 372 °C could be possibly attributable to the metal-support interaction reduction of MoO3 [38,39]. The second peak that was around 574 °C was ascribed to the reduction of the MoO2 [40]. The O2-TPO analysis of the Mo/CNT catalyst is given in Figure 4b. The TPO measurement is the process of heating a material at a certain temperature by passing an oxidizing gas mixture containing oxygen. As given in Figure 4b, the Mo/CNT catalyst showed a sharp-peaked TPO profile at about 692 °C. This peak could be attributed to the formation of MoO2 and MoO3 forms of Mo [41]. Wang and their coworkers studied the oxidation mechanism and kinetics of MoO2 to MoO3 in the atmosphere at 476–628 °C. It was reported that temperature had significant effects on the oxidation process and MoO3 formation at 628 °C. MoO3 formed at 476 °C had rough and disordered surfaces. Furthermore, Mo4O11 as an intermediate product was formed at above 810 K. According to this study, the oxidation reaction (one-step reaction, from MoO2 to MoO3 directly) was controlled by the diffusion model [41]. NH3-TPD was utilized to determine the adsorption sites on the sample [42]. Figure 4c indicates the NH3-TPD curve of the Mo/CNT catalyst. On the surface, weak acid, medium acid, and strong acid sites could be observed and could be detected from NH3-TPD peaks. However, Mo/CNT catalyst had a broad NH3 desorption peak at 50–250 °C, showing the presence of weak acid regions in the catalyst [43].

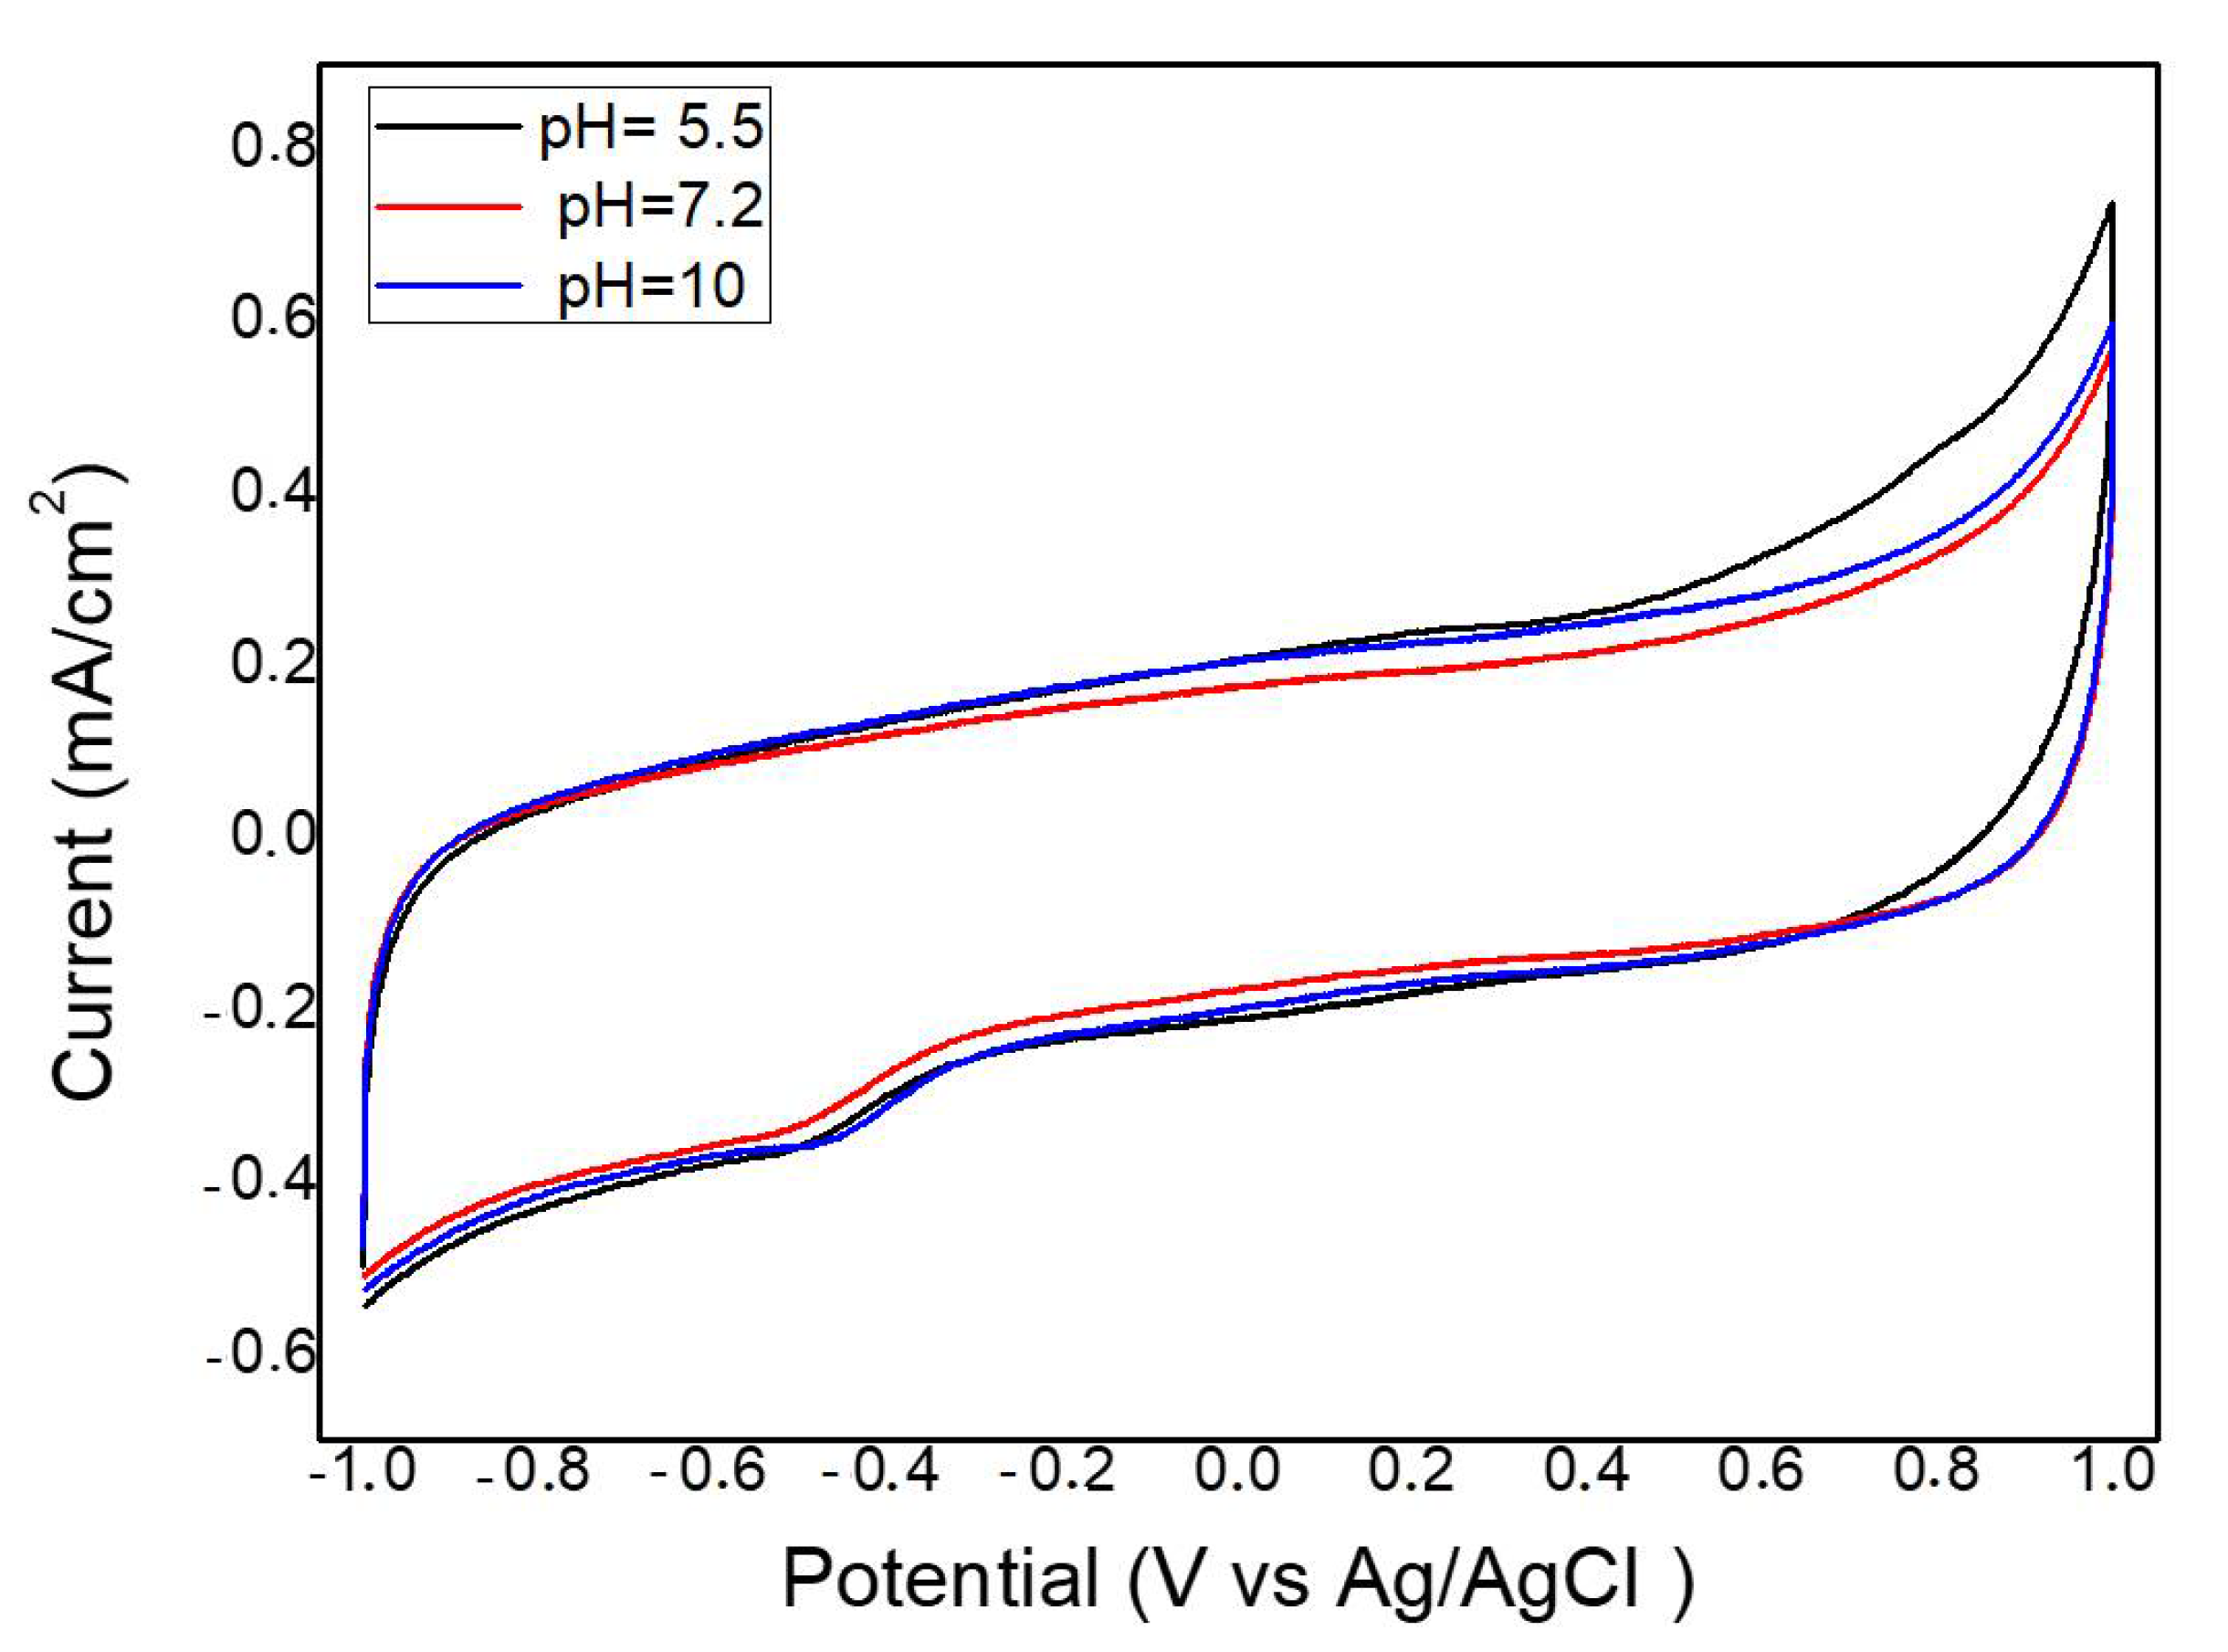
2.2. Electrochemical Measurements

CV measurements were conducted to detect the electrooxidation of L-C on Mo/CNT-modified GCE electrode at three different pH values with CV in 0.1 M pH 7.2 phosphate buffer solution. These measurements were presented in Figure 5. According to the results of these studies, it was observed that current densities of Mo/CNT catalysts at different pHs were close to each other. Thus, we decided to conduct the L-C electrooxidation activities at pH = 7.2, resembling the body fluid pHs.
CV measurements were conducted to observe the effect of the L-C concentration on its electrooxidation at four different L-C concentrations of 0, 5, 10 and 20 mM. Additionally, those measurements were carried out to examine the L-C electrooxidation activity on Mo/CNT/GCEs. The measurements are given in Figure 6. It was observed that the increase in concentration led to the increase in the current density [13,44].
The effect of scan rate (sr) through the L-C electrooxidation activity was also examined by CV at varying sr of 10, 30, 50, 100, 120, 150, 180, 200, 230, 250 300, 320, 350, 380, 400, 420, 450, 480, 500 mV·s−1 in 5 mM L-C solution on Mo/CNT/GCE. The obtained results are given in Figure 7. As the sr increased, the electrochemical oxidation current of L-C increased and showed a positive linear relationship. This behavior can be attributed to the fact that a diffusion-controlled formation took place.
DPV measurements were carried out on Mo/CNT/GCE at varying concentrations (0–1000 µM L-C) in 0.1M PBS to determine the selectivity of the catalyst. Results are presented in Figure 8a. According to the DPV measurements, the current density increased up to 0.135 mA/cm2 when 5 μM of L-C concentration was reached. It was observed that current density increased by increasing L-C concentration. Maximum current densities versus L-C concentration were plotted and are presented in Figure 8b. The slope of this line gives the sensitivity value of this Mo/CNT/GCE electrode as 0.0002 mA/μM cm2 (200 mA/μM cm2; 0.0142 μA/μM). DPV current densities versus L-C concentration plot exhibited a linear relationship within the range of 5–150 μM.
Following, sensitivity measurements by DPV, limit of blank (LOB), the lowest detection limit (LOD) and limit of quantification (LOQ) were determined for the Mo/CNT/GCE L-C electrochemical sensor. First of all, LOB was determined by measuring the blank electrode’s response and standard deviation of 10 blank electrode responses. LOD was found as 0.25 μM and LOQ was also found as 0.75 μM with S/N = 3 signal to noise ratio.
The EIS method is the most widely used method in order to determine diffusion properties, electrode capacitance, and charge transfer kinetics. EIS graphs were taken for Mo/CNT/GCE obtained at different electrode potentials in 0.1 M PBS + 5 mM. These EIS measurements are presented in Figure 9. Altering potentials, it was observed that the semicircular diameter of electron transfer resistance (Rct) changes and the lowest arc diameter were obtained at 0.6 V. As has been mentioned above, a small arc radius is explained to have the lowest electron charge transfer resistance and faster L-C electrooxidation kinetics. Thus, one could note that faster kinetics was obtained at 0.6 V, clearly observed in Figure 9.
In interference studies, the effects of some species such as ascorbic acid, D-glucose, uric acid, L-tyrosine, L-tryptophane, and dopamine, commonly found in blood, were examined in the presence of the L-C to determine the interference of these species.
Interference measurements were examined by EIS and the results are presented in Figure 10. The EIS results revealed that L-C had the lowest charge transfer and the lowest arc diameter, showing that these species did not interfere with L-C (Figure 10). In this regard, it is clear that the current and impedance responses of the interfering species are small indicating that the Mo/CNT/GCE has very good selectivity for L-C determination.
For the real sample measurements, acetylcysteine tablets purchased from the pharmacy were employed. We pulverized 600 mg samples of these acetylcysteine tablets and used them in powder form. From these powder samples, a stock solution was prepared by taking 1 mg of acetylcysteine into a 50 mL measuring flask containing 0.1 M PBS solution at pH = 7.2. This stock solution was diluted to obtain 1.5 mM acetylcysteine solution. For this real sample solution at 1.5 mM acetylcysteine concentration, Mo/CNT/GCE sensor response was taken and recorded. Following this, recovery values were calculated and presented in Table 2. A similar procedure was also applied for 3 mM and 6 mM additions. It was clear that recovery values were acceptable and the relative standard deviation of the sample for 10 consecutive determinations was less than 3%. This result showed that the Mo/CNT/GCE performed well for the real sample.

3. Experimental

We prepared 10% Mo/CNT catalysts by the NaBH4 reduction method and characterized them by SEM-EDX, XRD and UV-Vis spectroscopy, H2-TPR, O2-TPO, and NH3-TPD methods. Details of the synthesis and characterization methods are presented in Supplementary Files S1–S4. Electrochemical studies were performed on Mo/CNT/GCE electrode by CV, DPV, and EIS techniques. Details of electrochemical measurements are given in S4.

4. Conclusions

In the present study, 10% Mo/CNT catalysts were prepared by the NaBH4 reduction method. The surface and chemical properties of this catalyst were determined by SEM-EDX, XRD, UV-Vis, H2-TPR, O2-TPO, and NH3-TPD methods. SEM-EDX results revealed that the weight percentage of Mo/CNT catalyst was close to the nominal percentage of 10% Mo. One could note that Mo/CNT catalyst was successfully prepared. SEM-EDX results revealed that Mo particles were located inside the tubes. XRD and UV-Vis results revealed that Mo was formed in oxide phase, which was in agreement with the chemisorption studies. The surface chemical properties were characterized with H2-TPR, O2-TPO, and NH3-TPD methods. H2-TPR and O2-TPO results showed that reduction and oxidation of Mo were realized at high temperatures. On the other hand, NH3-TPD analysis helped us to investigate the adsorption sites on the sample. Mo/CNT catalyst exhibited a broad NH3 desorption peak starting from about 50 °C to about 250 °C, which was attributed to the presence of weak acid regions in the catalyst. Electrochemical measurements such as CV, DPV, and EIS were also conducted on Mo/CNT catalyst. Mo/CNT showed good electro-catalytic responses to L-C with high sensitivity, stability and selectivity, which was ascribed to the existence of weak acid sites on Mo catalyst enhancing the L-C electrooxidation. Interference studies of D-glucose, uric acid, L-tyrosine, L-trytophane, dopamine, and ascorbic acid revealed that this Mo/CNT catalyst effectively resisted interfering substances. As a result, Mo/CNT catalyst is a promising catalyst with weak acid sites on its surfaces enhancing the L-C electrooxidation.

Supplementary Materials

The following are available online at https://www.mdpi.com/article/10.3390/catal11121561/s1, Supplementary S1: Materials; Supplementary S2: Preparation of nanocatalysts; Supplementary S3: Characterization of nanocatalyst; Supplementary S4: Electrochemical measurements.

Author Contributions

Conceptualization, H.K. and N.A.; methodology, H.K. and N.A.; validation, K.S., H.K. and N.A.; formal analysis, K.S., H.K. and N.A. investigation, K.S.; resources, K.S., data curation, K.S., H.K. and N.A.; writing—original draft preparation, H.K.; writing—review and editing, H.K. and N.A.; visualization, K.S., H.K. and N.A.; supervision, N.A.; funding acquisition, N.A. All authors have read and agreed to the published version of the manuscript.

Funding

Financial support form Kyrgyz-Turkish Manas Univerisy with Grant #KTMU-BAP-2019.FBE.05 is gratefully acknowledged.

Data Availability Statement

Data availability sets could be obtained by contacting authors.

Conflicts of Interest

The authors declare that they have no known competing financial interests or personal relationships that could influence the work reported in this paper.

References

  1. Crawhall, J.C. Areview of the clinical presentation and laboratory findings in 2 uncommon herediatry disorders of sulfur aminoacid metabolism amd beta mercaplolactate cysteine disulfideureia and sulfite oxidase deficiency. Clin. Biochem. 1985, 18, 139–142. [Google Scholar] [CrossRef]
  2. Kos, J.; Lah, T.T. Cysteine proteinases and their endogenous inhibitors, Target proteins for prognosis, diagnosis and therapy in cancer (Review). Oncol. Rep. 1998, 5, 1349–1361. [Google Scholar] [CrossRef] [PubMed]
  3. Marshall, A.D.; Derbyshire, J.F.; McPhie, P.; Jakoby, W.B. A review of the effects of manipulation of the cysteine residues of rat aryl sulfotransferase IV. Chem. Biol. Interact. 1998, 109, 107–116. [Google Scholar] [CrossRef]
  4. Stipanuk, M.H. Role of the liver in regulation of body cysteine and taurine levels, A brief review. Neurochem. Res. 2004, 29, 105–110. [Google Scholar] [CrossRef] [PubMed]
  5. Adachi, A.; Sarayama, Y.; Shimizu, H.; Yamada, Y.; Horikawa, T. Thiodiglycolic acid as a possible causative agent of fixed drug eruption provoked only after continuous administration of S-carboxymethyl-L-cysteine, case report and review of reported cases. Br. J. Dermatol. 2005, 153, 226–228. [Google Scholar] [CrossRef] [PubMed]
  6. Velisek, J.; Cejpek, K. Biosynthesis of food constituents, Amino acids, 2. The alanine-valine-leucine, serine-cysteine-glycine, and aromatic and heterocyclic amino acids groups—A review. Czech J. Food Sci. 2006, 24, 45–58. [Google Scholar] [CrossRef] [Green Version]
  7. Kargosha, K.; Ahmadi, S.H.; Zeeb, M.; Moeinossadat, S.R. Vapour phase Fourier transform infrared spectrometric determination of L-cysteine and L-cystine. Talanta 2008, 74, 753–759. [Google Scholar] [CrossRef]
  8. Hurtado-Fernández, E.; Velázquez-Gómez, M.; Lacorte, S.; Ramos, L. Exhaustive characterization of (semi-) volatile organic contaminants in car dust using comprehensive two-dimensional gas chromatography—Time-of-flight mass spectrometry. J. Hazard. Mater. 2021, 411, 125058. [Google Scholar] [CrossRef] [PubMed]
  9. Ouchemoukh, S.; Amessis-Ouchemoukh, N.; Gómez-Romero, M.; Aboud, F.; Giuseppe, A.; Fernández-Gutiérrez, A.; Segura-Carretero, A. Characterisation of phenolic compounds in Algerian honeys by RP-HPLC coupled to electrospray time-of-flight mass spectrometry. LWT 2017, 85, 460–469. [Google Scholar] [CrossRef]
  10. Heidari, M.; Ghaffarinejad, A. Electrochemical sensor for L-cysteine by using a cobalt(II)/aluminum(III) layered double hydroxide as a nanocatalyst. Microchim. Acta 2019, 186, 365. [Google Scholar] [CrossRef]
  11. Kurniawan, A.; Kurniawan, F.; Gunawan, F.; Chou, S.H.; Wang, M.J. Disposable electrochemical sensor based on copper-electrodeposited screen-printed gold electrode and its application in sensing L-Cysteine. Electrochim. Acta 2019, 293, 318–327. [Google Scholar] [CrossRef]
  12. Yao, J.; Liu, C.H.; Liu, L.; Chen, M.; Yang, M. An Electrochemical Sensor for Sensitive Determination of L-cysteine and Its Electrochemical Kinetics on AgNPs/GQDs/GCE Composite Modified Electrode. J. Electrochem. Soc. 2018, 165, B551–B558. [Google Scholar] [CrossRef]
  13. Pazalja, M.; Kahrovic, E.; Zahirovic, A.; Turkusic, E. Electrochemical Sensor for Determination of L-Cysteine Based on Carbon Electrodes Modified with Ru(III) Schiff Base Complex, Carbon Nanotubes and Nafion. Int. J. Electrochem. Sci. 2016, 11, 10939–10952. [Google Scholar] [CrossRef]
  14. Xiao, C.H.; Chen, J.H.; Liu, B.; Chu, X.C.; Wu, L.A.; Yao, S.Z. Sensitive and selective electrochemical sensing of L-cysteine based on a caterpillar-like manganese dioxide-carbon nanocomposite. Phys. Chem. Chem. Phys. 2011, 13, 1568–1574. [Google Scholar] [CrossRef]
  15. Huang, B.; Wang, Y.; Lu, Z.W.; Du, H.J.; Ye, J.S. One pot synthesis of palladium-cobalt nanoparticles over carbon nanotubes as a sensitive non-enzymatic sensor for glucose and hydrogen peroxide detection. Sens. Actuators B Chem. 2017, 252, 1016–1025. [Google Scholar] [CrossRef]
  16. Hoa, L.T.; Hur, S.H. Non-Enzymatic Glucose Sensor Based on 3D Graphene Oxide Hydrogel Cross linked by Various Diamines. J. Nanosci. Nanotechnol. 2015, 15, 8697–8700. [Google Scholar] [CrossRef]
  17. Hoa, L.T.; Sun, K.G.; Hur, S.H. Highly sensitive non-enzymatic glucose sensor based on Pt nanoparticle decorated graphene oxide hydrogel. Sens. Actuators B Chem. 2015, 210, 618–623. [Google Scholar] [CrossRef]
  18. Qiu, H.W.; Xu, S.C.; Jiang, S.Z.; Li, Z.; Chen, P.X.; Gao, S.S.; Zhang, C.; Feng, D.J. A novel graphene-based tapered optical fiber sensor for glucose detection. Appl. Surf. Sci. 2015, 329, 390–395. [Google Scholar] [CrossRef]
  19. Tian, Y.; Liu, Y.; Wang, W.; Zhang, X.; Peng, W. CuO nanoparticles on sulfur-doped graphene for nonenzymatic glucose sensing. Electrochim. Acta 2015, 156, 244–251. [Google Scholar] [CrossRef]
  20. Alal, O.; Caglar, A.; Kivrak, H.; Sahin, O. Dendrimer Templated Synthesis of Carbon Nanotube Supported PdAu Catalyst and its Application as Hydrogen Peroxide Sensor. Electroanalysis 2019, 31, 1646–1655. [Google Scholar] [CrossRef]
  21. Kivrak, H.D.; Aktas, N.; Caglar, A. Electrochemical production of Graphene Oxide and its application as a novel Hydrogen Peroxide sensor. Int. J. Nano Dimens. 2019, 10, 252–259. [Google Scholar]
  22. Kazici, H.C.; Salman, F.; Kivrak, H.D. Synthesis of Pd-Ni/C bimetallic materials and their application in non-enzymatic hydrogen peroxide detection. Mater. Sci. Pol. 2017, 35, 660–666. [Google Scholar] [CrossRef] [Green Version]
  23. Jiang, Y.Y.; Li, Y.H.; Li, Y.C.; Li, S.X. A sensitive enzyme-free hydrogen peroxide sensor based on a chitosan-graphene quantum dot/silver nanocube nanocomposite modified electrode. Anal. Methods 2016, 8, 2448–2455. [Google Scholar] [CrossRef]
  24. Wang, X.; Deng, W.P.; Shen, L.; Yan, M.; Yu, J.H. A 3D electrochemical immunodevice based on an Au paper electrode and using Au nanoflowers for amplification. New J. Chem. 2016, 40, 2835–2842. [Google Scholar] [CrossRef]
  25. Kivrak, H.; Alal, O.; Atbas, D. Efficient and rapid microwave-assisted route to synthesize Pt-MnOx hydrogen peroxide sensor. Electrochim. Acta 2015, 176, 497–503. [Google Scholar] [CrossRef]
  26. Habibi, B.; Jahanbakhshi, M. A novel nonenzymatic hydrogen peroxide sensor based on the synthesized mesoporous carbon and silver nanoparticles nanohybrid. Sens. Actuators B Chem. 2014, 203, 919–925. [Google Scholar] [CrossRef]
  27. Ye, D.; Li, H.; Liang, G.; Luo, J.; Zhang, X.; Zhang, S.; Chen, H.; Kong, J. A three-dimensional hybrid of MnO2/graphene/carbon nanotubes based sensor for determination of hydrogen-peroxide in milk. Electrochim. Acta 2013, 109, 195–200. [Google Scholar] [CrossRef]
  28. Guzmán, C.; Orozco, G.; Verde, Y.; Jiménez, S.; Godínez, L.A.; Juaristi, E.; Bustos, E. Hydrogen peroxide sensor based on modified vitreous carbon with multiwall carbon nanotubes and composites of Pt nanoparticles-dopamine. Electrochim. Acta 2009, 54, 1728–1732. [Google Scholar] [CrossRef]
  29. Kivrak, H.; Selçuk, K.; Er, O.F.; Aktas, N. Nanostructured Electrochemical Cysteine Sensor Based on Carbon Nanotube Supported Ru, Pd, and Pt Catalysts. Mater. Chem. Phys. 2021, 267, 124689. [Google Scholar] [CrossRef]
  30. Kivrak, H.; Selcuk, K.; Er, O.F.; Aktas, N. Electrochemical Cysteine Sensor on Novel Ruthenium Based Ternary Catalyst. Int. J. Electrochem. Sci. 2021, 16, 210519. [Google Scholar] [CrossRef]
  31. Ramoraswi, N.O.; Ndungu, P.G. Photo-Catalytic Properties of TiO2 Supported on MWCNTs, SBA-15 and Silica-Coated MWCNTs Nanocomposites. Nanoscale Res. Lett. 2015, 10, 427. [Google Scholar] [CrossRef] [Green Version]
  32. Shen, L.H.; Wang, N. Effect of Nitrogen Pressure on the Structure of Cr-N, Ta-N, Mo-N, and W-N Nanocrystals Synthesized by Arc Discharge. J. Nanomater. 2011, 2011, 1–5. [Google Scholar] [CrossRef]
  33. Song, J.; Li, G.R.; Xiong, F.Y.; Gao, X.P. Synergistic effect of molybdenum nitride and carbon nanotubes on electrocatalysis for dye-sensitized solar cells. J. Mater. Chem. 2012, 22, 20580–20585. [Google Scholar] [CrossRef]
  34. Rondon, S.; Wilkinson, W.R.; Proctor, A.; Houalla, M.; Hercules, D.M. Characterization of Mo/C catalysts by XRD, XPS, and TOF SIMS. J. Phys. Chem. 1995, 99, 16709–16713. [Google Scholar] [CrossRef]
  35. Aritani, H.; Tanaka, T.; Funabiki, T.; Yoshida, S.; Eda, K.; Sotani, N.; Kudo, M.; Hasegawa, S. Study of the local structure of molybdenum-magnesium binary oxides by means of Mo L(3)-edge XANES and UV-vis spectroscopy. J. Phys. Chem. 1996, 100, 19495–19501. [Google Scholar] [CrossRef]
  36. Thielemann, J.P.; Ressler, T.; Walter, A.; Tzolova-Muller, G.; Hess, C. Structure of molybdenum oxide supported on silica SBA-15 studied by Raman, UV-Vis and X-ray absorption spectroscopy. Appl. Catal. A Gen. 2011, 399, 28–34. [Google Scholar] [CrossRef] [Green Version]
  37. Hu, F.P.; Shen, Y. Influence of propyl alcohol addition during processing of molybdenum trioxide powders, Observation of novel dual-wavelength excitation photochromism. Mater. Sci. Semicond. 2015, 30, 271–274. [Google Scholar] [CrossRef]
  38. Allaedini, G.; Aminayi, P.; Tasirin, S.M. Methane decomposition for carbon nanotube production, Optimization of the reaction parameters using response surface methodology. Chem. Eng. Res. Des. 2016, 112, 163–174. [Google Scholar] [CrossRef]
  39. Inturi, S.N.R.; Boningari, T.; Suidan, M.; Smirniotis, P.G. Visible-light-induced photodegradation of gas phase acetonitrile using aerosol-made transition metal (V, Cr, Fe, Co, Mn, Mo, Ni, Cu, Y, Ce, and Zr) doped TiO2. Appl. Catal. B Environ. 2014, 144, 333–342. [Google Scholar] [CrossRef]
  40. Eswaramoorthi, I.; Sundaramurthy, V.; Das, N.; Dalai, A.K.; Adjaye, J. Application of multi-walled carbon nanotubes as efficient support to NiMo hydrotreating catalyst. Appl. Catal. A Gen. 2008, 339, 187–195. [Google Scholar] [CrossRef]
  41. Wang, L.; Zhang, G.H.; Chou, K.C. Study on oxidation mechanism and kinetics of MoO2 to MoO3 in air atmosphere. Int. J. Refract. Hard Met. 2016, 57, 115–124. [Google Scholar] [CrossRef] [Green Version]
  42. Barrie, P.J. Analysis of temperature programmed desorption (TPD) data for the characterisation of catalysts containing a distribution of adsorption sites. Phys. Chem. Chem. Phys. 2008, 10, 1688–1696. [Google Scholar] [CrossRef] [PubMed]
  43. Zhou, M.; Liu, P.; Wang, K.; Xu, J.; Jiang, J. Catalytic hydrogenation and one step hydrogenation-esterification to remove acetic acid for bio-oil upgrading, model reaction study. Catal. Sci. Technol. 2016, 6, 7783–7792. [Google Scholar] [CrossRef]
  44. Castro e Silva, C.d.C.C.; Breitkreitz, M.C.; Santhiago, M.; Corrêa, C.C.; Kubota, L.T. Construction of a new functional platform by grafting poly (4-vinylpyridine) in multi-walled carbon nanotubes for complexing copper ions aiming the amperometric detection of l-cysteine. Electrochim. Acta 2012, 71, 150–158. [Google Scholar] [CrossRef]
Figure 1. Scanning electron microscopy energy-dispersive X-ray spectroscopy (SEM-EDX) (ac,g) and mapping images (mapping (d), C (e), Mo (f)) of %10 Mo/CNT catalyst.
Catalysts 11 01561 g001aCatalysts 11 01561 g001b
Figure 2. X-ray diffraction (XRD) pattern of 10% Mo/CNT catalyst.
Catalysts 11 01561 g002
Figure 3. Ultraviolet–visible (UV-Vis) diffuse reflectance spectroscopy for 10% Mo/CNT catalyst.
Catalysts 11 01561 g003
Figure 4. H2-TPR (a), O2-TPO (b), and NH3-TPD (c) profiles of Mo/CNT catalyst.
Catalysts 11 01561 g004
Figure 5. Cyclic voltammetry (CV) curves obtained with 3 different pH in Mo/CNT studies.
Catalysts 11 01561 g005
Figure 6. Electrochemical measurements for Mo/CNT at four different molarities.
Catalysts 11 01561 g006
Figure 7. CV of Mo/CNT/GCE under different srs (10, 30, 50, 100, 120, 150, 180, 200, 230, 250 300, 320, 350, 380, 400, 420, 450, 480, 500 mV·s−1) in 5 mM L-C.
Catalysts 11 01561 g007
Figure 8. (a) Differential pulse voltammetry (DPV) measurements conducted on Mo/CNT/GCE at varying concentrations (0–1000 µM L-C) in 0.1M PBS; (b) calibration plot obtained from maximum current density vs. L-C concentration.
Catalysts 11 01561 g008
Figure 9. Electrochemical impedance spectra (EIS) on Mo/CNT/GCE at different potentials in 0.1 M PBS (pH 7.2) + 5 mM L-C. The frequency range (0.02–100,000 Hz), signal amplitude (10 mV).
Catalysts 11 01561 g009
Figure 10. EIS results for interfering species of 0.1 mM uric acid, 0.1 mM ascorbic acid, 0.1 mM L-tyrptophane, 0.1 mM L-tyrosine, 0.1 mM L-C, 0.1 mM dopamine at −0.2 V on Mo/CNT/GCE at the frequency range (0.02–100,000 Hz), signal amplitude (10 mV).
Catalysts 11 01561 g010
Table 1. Electrode materials employed in electrochemical determination of L-cysteine (L-C).
SensorSensitivityLinear Range(LOD)Ref.
CuFe2O4/rGO-Au4.73 μA/mM0.05–0.2 μM0.383 μM[10]
copper-electrodeposited screen-printed gold electrode0.028 μA/mM400–1800 μM0.21 μM[11]
AgNPs/GQDs/GCE-0.1–200 μM0.01 μM[12]
Ru(III) Schiff Base Complex-411–4111 μM0.9 μM[13]
MnO2-CNTs-0.5–680 μM [14]
Ru/CNT305.8 μA/mM0–200 μM0.353 μM[29]
Ru-Mo-Pd/CNT136 μA/mM5–200 μM0.1 μM[30]
Table 2. L-C analysis data in acetylcysteine drug sample.
SampleAdded (mM)Found (mM)Recovery (%)
11.51.598.0
23.02.997.3
36.05.998.5
Publisher’s Note: MDPI stays neutral with regard to jurisdictional claims in published maps and institutional affiliations.

