Abstract
V-TiO2 photocatalyst with 0 ≤ V ≤ 20 mol% was prepared via the sol–gel method based on mixed oxide titanium–vanadium nanoparticles with size and composition control. The mixed oxide vanadium–titanium oxo-alkoxy nanonoparticles were generated in a chemical micromixing reactor, coated on glass beads via liquid colloid deposition method and underwent to an appropriate thermal treatment forming crystallized nanocoatings. X-ray diffraction, Raman, thermogravimetric and differential thermal analyses confirmed anatase crystalline structure at vanadium content ≤ 10 mol%, with the cell parameters identical to those of pure TiO2. At a higher vanadium content of ~20 mol%, the material segregation began and orthorhombic phase of V2O5 appeared. The crystallization onset temperature of V-TiO2 smoothly changed with an increase in vanadium content. The best photocatalytic performance towards methylene blue decomposition in aqueous solutions under UVA and visible light illuminations was observed in V-TiO2 nanocoatings with, respectively, 2 mol% and 10 mol% vanadium.
1. Introduction
The current high level of environmental pollution by toxic contaminants requires the development of an effective decontamination processes, a field in which photocatalysis has attracted particular interest [1,2,3]. In particular, hair dye [4], leather and paper industries [5] and luminescent solar concentrator (LSC) technologies [6] use a large amount of organic dyes potentially associated with water pollution. In this context, titanium dioxide (TiO2) became the key material [7,8] showing high effectiveness in the pollutants’ decomposition, whose activation is, however, limited by the ultraviolet (UV) spectral range hν > Eg = 3.2 eV of anatase crystalline phase. Despite its lower band gap energy Eg = 3.0 eV, thermodynamically stable rutile TiO2 generally showed a lower photocatalytic activity [9].
In the last few decades, many studies have been directed to modifications of the material composition and structure, in order to improve the photocatalytic process efficiency and selectivity, and to extend the material activation to the visible spectral range [10,11,12,13,14]. An important method in this direction concerns Ti cations replacement by other cations, M, which can be referred to as doping (at small level of insertion, <1%) or mixing (at a larger level), or even formation of composites (at a level above M solubility limit). Moreover, when M forms oxides with a lower band-gap energy (Eg) compared to that of anatase TiO2, there appears to be potential for a desirable decrease in the activation energy of the photocatalytic process: hν < 3.2 eV (λ > 380 nm). An insertion of vanadium (V) atoms, of which the pentoxide compound V2O5 has the band gap energy of 2.2 eV, into the host titania matrix creates an opportunity for the photocatalytic process improvement [15]. Different V-TiO2 compositions have been investigated in the photocatalytic process under UV and visible light illuminations [16,17,18,19,20,21,22,23,24,25,26,27,28], which generally concluded with an efficiency enhancement. Although the underlying mechanisms are still under discussion, these studies converged to a conclusion about an optimal vanadium loading in the range between 1 and 5 mol% into the anatase titania lattice prepared by different methods. At the same time, the activity variations of V-TiO2 materials could be attributed according to Chang et al. [29] to different fractions of bulk and surface states: while V3+/V4+ ions in titania lattice inhibited charge diffusion to the photocatalyst surface through deep trapping, surface states facilitated interfacial charge transfer to adsorbates. Furthermore, Liu et al. [30] have drawn attention to the problem of the composition homogeneity of V-TiO2 materials; they suggested that the photocatalysts doped by vanadium unevenly with a p–n junction semiconductor structure have much higher photocatalytic activity than pristine and evenly doped TiO2 and ascribed this result to the electrostatic-field-driven electron-hole separation. Moreover, these authors have observed the activity enhancement at a very low level of ~0.002 mol% V. We notice that this low value of optimal doping can be connected to the compositional homogeneity; it is characteristic of the materials with different mobilities of photoexcited electron and hole and can be explained by a competition between charge localisation and annihilation processes on the inserted cations [31].
The optimization of the photocatalyst composition requires fine morphology and composition control, which becomes even more critical in case of the nanostructured materials with a large surface-to-volume ratio. A chemical reactor with ultrarapid micromixing of reactive solutions has been earlier developed in our group for the mass-fabrication of size-selected oxo-alkoxy nanoparticles of binary [32,33] and ternary [34] metal oxides, exploiting the MTSALs mechanism of soft chemistry [35]; effective photocatalytic nanocoatings have been produced of these nanoparticles [36]. Very recently, the preparation of size-selected vanadium–titanium oxo-alkoxy (VTOA) nanoparticles with controlled elemental composition has been also realized via this approach [37]. In this work, we paid attention to the nanoscale compositional and structural homogeneity of V-TiO2 photocatalyst, which has not been addressed in previous studies. The photocatalytic activity of V-TiO2 nanocoatings, prepared of size-selected VTOA nanoparticles, was investigated under UVA and visible (VIS) light illuminations.
2. Results and Discussion
2.1. Structural Properties
As we showed recently [37], at a relatively low V content of ≤20 mol%, the VTOA nanoparticles are formed via condensation of titanium oxo-alkoxy (TOA) species, which attract hydrolyzed vanadium species at the surface. In contrast, at the higher V content above 20 mol%, the hydrolyzed vanadium oxo-alkoxy (VOA) species imprison subnucleus condensed TOA species prohibiting the nucleation. The obtained species in this range of strong vanadium loadings are not well defined: they appear to be strongly polydispersed with a size exceeding 1 μm. Furthermore, available literature data indicate the solubility limit of ~21 mol% V in anatase titania [38]. In order to keep the material in the most photocatalytically efficient anatase crystalline phase, the vanadium content in these studies was limited to 20 mol%.
The results of thermogravimetric and differential thermal analyses (TGA-DTA) measurements of the prepared nanopowder probes identical to nanocoating samples from Table 3 are shown in Figure 1. In all presented patterns, the broad endothermic peak between 50 °C and ~200 °C with the maximum at 150 °C was observed, which is due to desorption of solvent release from the particles surface, followed by another broad exothermic band with the maximum at ~250 °C due to the residual organics burning. We can notice comparable fractions of the desorbed surface species in the mixed oxide and pure titania nanoparticles, which indicates a comparable retention of the adsorbed solvent and, by consequence, similar specific surface area of the produced nanomaterials. We would like to draw attention to significant modifications of the strong exothermic peak due to the anatase phase crystallization, which appeared at Tc = 414 °C in pure titania (Figure 1a). When even a small amount of vanadium of 0.5 mol% was introduced to the system, the crystallization peak broadened and shifted to the low temperatures of 382 °C. Further on, at 1 mol% V it flattened (almost vanished). At 2 mol% V this peak reappeared, progressively intensified, narrowed and shifted back to higher temperatures, attaining Tc = 440 °C at 20 mol% V. This modification clearly shows a strong interaction of vanadium atoms with TiO2 host matrix.
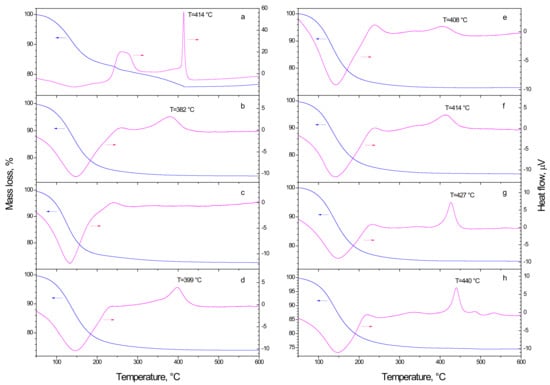
Figure 1.
TGA (left axis) and DTA (right axis) measurements of as-synthetized V-TiO2 samples with 0 (a), 0.5 (b), 1 (c), 2 (d), 5 (e), 7 (f), 10 (g) and 20 (h) mol% vanadium content.
A very limited number of TGA-DTA measurements of V-TiO2 mixed oxide materials exist in the literature. The most relevant one to our studies has been published by Shao et al. [39] who synthetized V-TiO2 powder via sol–gel method. They have reported in V-TiO2 powder with 5.8 mol% V the principal mass loss due to the solvent/water desorption below 300 °C associated with endothermic heat flow followed by a broad exothermic band with the maximum at ~250 °C due to the residual organics burning, which are in agreement with our results. A broad exothermic peak associated with the material crystallization between 380 and 560 °C has been observed in these studies, which merged together anatase, brookite and rutile phase transitions. Unfortunately, no detailed analysis of samples with different vanadium content has been presented in the earlier studies. The well-resolved exothermic crystallization peak observed in our studies, which shifted with an increase in the vanadium content (see Figure 1), was attributed by us to the phase transition in size-selected V-TiO2 nanoparticles (see, e.g., [36]).
According to these TGA-DTA measurements, the heat treatment temperature of 450 °C was sufficient to crystalize all prepared samples from Table 1. Therefore, the photocatalysts were heat treated at 450 °C during 4 h and x-ray diffraction (XRD) patterns of V-TiO2 nanopowders are shown in Figure 2. The pure anatase phase was observed in all prepared samples, except for that with 20 mol% vanadium, which is biphasic with the contribution of both anatase TiO2 and orthorhombic α-V2O5 phases. This signifies that vanadium is inserted in anatase titania up to 10 mol% without major structural modifications; for a higher mol%, the metal oxide mixture segregates and an excess of vanadium crystallizes into α-V2O5. In pure TiO2 sample, we can notice a large low-intensity bump in the range of 28° ≤ 2θ ≤ 35°, which could be related to a residual amorphous titania and explained by uncompleted crystallization of sample. We also notice a very weak brookite peak appeared in samples with 2, 3 and 5 mol% V content, which is in agreement with XRD patterns reported in V-TiO2 sol–gel powders heat treated at 450 °C [39]; this peak weakened at higher vanadium contents. The Scherrer size of the brookite domain ~5 nm (Δ2θ = 1°) corresponds to that 2R of the elementary V-TiO2 nucleus [37], while that of anatase domain (Δ2θ = 0.3°) to that of the coating thickness (~30 nm); this permits us to suppose that the smallest (occasionally not sintered) V-TiO2 nanoparticles crystallize into brookite phase. Complementary measurements are required to verify this assumption. For all samples, the XRD peak width remained relatively large after the heat treatment at 450 °C confirming the small size of the nanoparticles.

Table 1.
Rietveld analysis of V-TiO2 nanopowders with 0–10 mol% V calcinated at 450 °C.
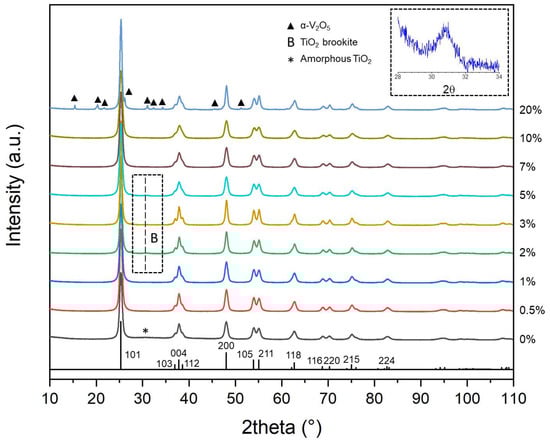
Figure 2.
XRD powder patterns of TiO2 and V-TiO2 samples after calcination at 450 °C with different vanadium content (in mol%). Vertical bars show positions and heights of anatase TiO2 peaks. Brookite phase of TiO2 (B) and orthorhombic phase of V2O5 (▲) are indicated.
In order to obtain more precise structural and microstructural information, Rietveld refinement of the XRD patterns was performed. A typical result of the fitting procedure for the sample with 1 mol% V, shown in Figure 3, confirms anatase crystalline structure of the formed lattice.
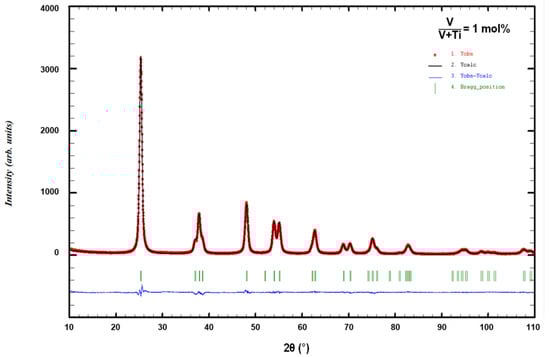
Figure 3.
Rietveld refinement with TiO2 anatase structural model of V-TiO2 sample with 1 mol% V calcinated at 450 °C.
The structural and microstructural parameters extracted from this procedure are summarized in Table 1 and Table 2. These data correspond to a negligible amount of microstrain in all V-TiO2 samples. The particle size is thus considered to be the main contribution to the peak enlargement. For all the samples, we observed that the cell parameters (a, c) remain stable in agreement with those of the anatase structure: a = 3.785 Å and c = 9.520 Å. No major structural modifications were could be highlighted when mol% of the introduced vanadium increased. In the same time, in 20 mol% V sample the performed refinement evidenced presence of α-V2O5. The phases percentage was estimated to be ~90% for anatase TiO2 and 10% for α-V2O5, which corresponds to 10 mol% V still being inserted into TiO2 matrix and the remaining 10 mol% V segregated into α-V2O5. These observations permit elucidating a picture of the vanadium insertion into anatase structure. In fact, below 10 mol% V, vanadium atoms substitute titanium atoms in anatase lattice without inducing any modification of the crystalline structure. When vanadium content exceeds 10 mol%, an excess of vanadium begin to segregate and at 20 mol% V crystallizes into α-V2O5. This sets the solubility limit of V atoms into anatase TiO2 nanopowders to ~10 mol%, which is in general agreement with expectations, while remaining appreciably lower than the previously reported value of 21 mol% [38]. However, a decrease in elemental solubility in nanomaterials should not be surprising. In fact, taking into account that in 4.2-nm particles [37] about 50% of cationic sites belong to the surface, one can conclude that half of the inserted vanadium atoms in 20 mol% V sample appear at the surface and, therefore, tend to form α-V2O5 domains during the heat treatment. Further investigations, via transmission electronic microscopy, could be interesting to perform in order to characterize the V segregation phenomenon when the solubility limit is exceeded, which is between 10 and 20 mol% V.
Table 2.
Rietveld analysis of V-TiO2 nanopowder with 20 mol% V calcinated at 450 °C.
An interesting trend in the anatase crystalline size evolution with vanadium content within the solubility range, previously highlighted by the peak width evolution of the XRD patterns, was also confirmed: the size sharply increased at 2–3 mol% V, where brookite phase appeared, and remained twice smaller at the higher and lower vanadium contents. This evolution is very complex since low amount of V promotes the crystalline domain growth from 12.0 nm (0 mol% V) to 21.5 nm (3 mol% V), while higher amounts (5–10 mol% V) have an opposite effect of the size decrease from 11.5 nm (5 mol% V) to 10.7 nm (10 mol% V), which are comparable to 12.0 nm in pure titania (0 mol% V). The explanation of this trend could probably rely on the position of vanadium atoms on surface and in bulk sites of VTOA particles. Furthermore, for 20 mol% V, which corresponds to the TiO2/α-V2O5 phase segregation phenomenon, the particles coarsen to attain the size of ~18 nm. Concerning the α-V2O5 particles size, it appears to be far bigger than that of TiO2, which supports our previous conclusions about the precursor VTOA species nucleation in the sol-gel process [37]. Further structural investigations are required in order to probe the local atomic order in the VTOA particles and then to elucidate the role of V on the crystalline domain growth.
In order to follow crystallization of the material with the highest level of vanadium, close to the solubility limit, we performed XRD measurements on 20 mol% V probes treated with different temperatures from 300 to 1000 °C during 4 h. The results are shown in Figure 4. The XRD patterns after heat treatment temperature below 400 °C showed an amorphous state of V-TiO2 material. At 400 °C, broad peaks attributed to the TiO2 anatase phase were observable, attesting that the crystallization process is underway. However, the sample remains poorly crystallized. At 500 °C we observed the anatase phase related to TiO2, which transformed to pure rutile at 700 °C and higher temperatures. In the same time, we observed many peaks of a smaller intensity at 600 °C (a very weak contamination of XRD patterns by these peaks can be noticed after heat treatment with 500 °C and 700 °C). These peaks more probably belong to the orthorhombic α-V2O5 phases, which would indicate the material segregation at intermediate heat treatment temperatures; in contrast, a perfect dissolution of vanadium in anatase and rutile titania takes place at, respectively, lower and higher temperatures. Alternatively, these peaks may be due to a metastable VxTiyOz solid, which decays after its formation at high temperatures. More work is required to understand their origin.
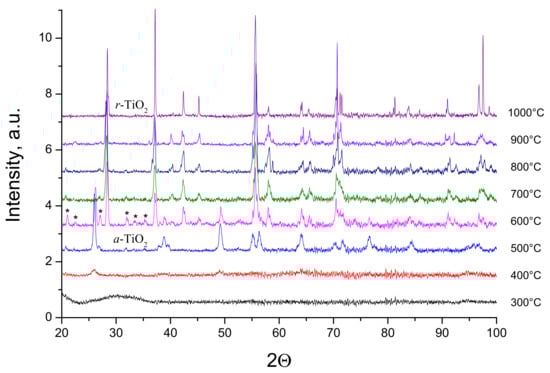
Figure 4.
XRD powder patterns of V-TiO2 samples with 20 mol% vanadium content heat treated at different temperatures for 4 h. Anatase (a) and rutile (r) phases of TiO2 are indicated. Peaks assigned to α-V2O5 orthorhombic phase are labeled by stars.
Our observations of the anatase crystalline cell stability with an addition of vanadium are in agreement with those of Khan et al. [21], who have studied V-doped TiO2 with V/Ti ratio of 1–5 mol% synthesized by hydrothermal method: the positions and intensity of DRX peaks in this study was found unchanged, which shows that crystallinity is not significantly affected by the V. We notice no appreciable weakening of anatase XRD peaks in our samples with an increase in vanadium content, which is in disagreement with that reported by Ren et al. [24] in V-doped TiO2 prepared via solid state sintering method and explained by a poor crystallization of powders. Our results also disagree with those of Zhou et al. [27] reporting that vanadium doping restrains the crystal growth and promotes the phase transition from anatase to rutile compared with pure titania.
The Raman spectra of V-TiO2 samples with different vanadium content, calcinated at 450 °C for 4 h are shown in Figure 5. The spectra with 0, 0.5, 1, 2, 5 and 7 mol% V showed frequencies of the bands maximum at 147 cm−1 (Eg), 198 cm−1 (Eg), 396 cm−1 (B1g), 515 cm−1 (A1g/B1g) and 637 cm−1 (Eg), which correspond to anatase TiO2 in agreement to literature [42]. In the same time, samples with 10 and 20 mol% V showed significant deviations: the band at 515 cm−1 weakened while the bands at 396 cm−1 and 637 cm−1 shift, respectively, to high and lower frequencies and new bands appeared at 280 cm−1, 300 cm−1 and 690 cm−1. These modifications correspond to the short-range structural rearrangements. We notice that according to the XRD pattern in Figure 2, TiO2 with 20 mol% V after calcination at 450 °C contained a small amount of orthorhombic phase of V2O5, which could explain for these modifications [43].
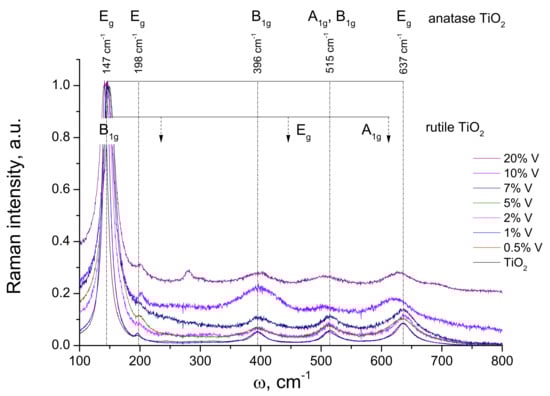
Figure 5.
Raman spectra of V-TiO2 samples calcinated at 450 °C with different vanadium content. The positions of anatase and rutile TiO2 bands are indicated by vertical dashed lines.
The Raman spectra of V-TiO2 samples with 20 mol% V heat treated at different temperatures are shown in Figure 6. These samples were calcinated at temperatures star-ting from 300 °C to 1000 °C every 100 °C making a total of 8 samples of 20 mol% vanadium. The positions of bands in samples calcinated at 300 °C, 400 °C and 500 °C correspond to anatase TiO2, while those of samples calcinated at temperatures above 700 °C to rutile TiO2. In contrast, samples heat treated at 500 °C, 600 °C and 700 °C showed more complex spectra. In particular, three new unassigned bands appeared at 281 cm−1, 300 cm−1 and 696 cm−1, which can be connected to the unassigned XRD peaks in Figure 4. We notice in this connection, that Ren et al. [24] have observed in V-TiO2 a weak peak in the frequency range ~280 cm−1 attributed to V2O5 with an increased vanadium contents up to 5 and 10 mol%; however, the applied method did not guarantee perfect V element dispersion in the host matrix, which may result in the vanadium oxide clustering at the high elemental content. On the other hand, segregation of titania and vanadia materials at intermediate temperatures of ~600 °C seems unlikely in our preparation conditions. More work is required to understand the new phase appearance.
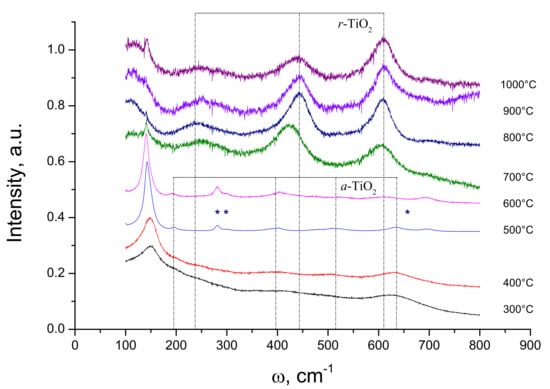
Figure 6.
Raman spectra of V-TiO2 samples with 20 mol% vanadium content heat treated at different temperatures for 4 h. Positions of anatase (a) and rutile (r) TiO2 bands are indicated by vertical dashed lines. Stars indicate unassigned bands (see in text).
2.2. Photocatalytic Properties
2.2.1. UVA Light Activation
The adsorption measurements of the selected samples are shown in Figure 7. Two groups of the curves can be distinguished in these experiments. In fact, the uncoated glass beads at equilibrium adsorbed ~50 mol% of MB, while about 30 mol% MB was adsorbed by the coated beads regardless of the composition of coated V-TiO2 material.
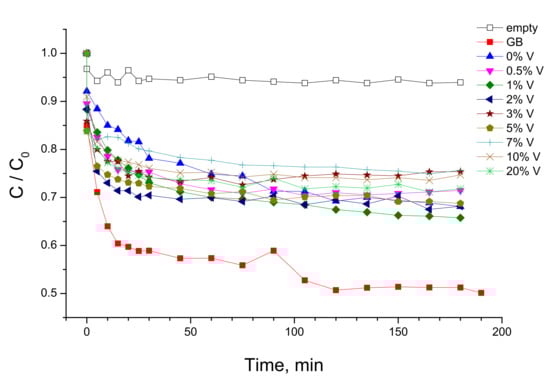
Figure 7.
MB adsorption measurements with UVA lamp “off” using uncoated and V-TiO2 coated glass beads (GB). Adsorption curve in empty reactor is also shown. Vanadium content is indicated in mol%.
The adsorption measurements permitted distinguishing free and adsorbed MB exposed to UVA illumination in the photocatalytic tests and, consequently, their respective contributions to the MB photolysis and photocatalytic decomposition. The kinetics of MB decomposition under UVA illumination in the empty reactor and that filled with uncoated and coated glass beads with V-TiO2 nanoparticles with different vanadium content is presented in Figure 8. One can see from these data that the photolysis of solvated MB molecules (empty reactor) is almost negligible in our experimental conditions. In contrast, adsorbed MB molecules onto uncoated glass beads underwent an appreciable photolytic decomposition. Consequently, we assumed that MB decomposition kinetics due to photolysis is directly proportional to the adsorbed MB quantity at equilibrium obtained from Figure 7. As a result, we conclude that the photolytic rate in presence of the prepared photocatalysts was about a half of that in presence of uncoated glass beads. We also notice that a significant deactivation of TiO2 photocatalyst takes place during the MB decomposition process. Complementary studies of the deactivation process and methods of the catalyst recovery are under way.
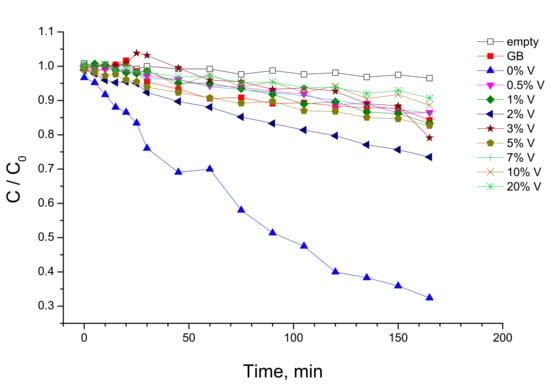
Figure 8.
Photocatalytic measurements with UVA lamp “on” using V-TiO2 coated glass beads (GB). Vanadium content (in mol%) is indicated.
The measured kinetic curves followed the first-order process kinetics, which permits evaluation of the intrinsic material activity [36]. As a result, the data were linearly fitted in semi-logarithmic frame and the obtained reaction rate constants k (in min−1) are shown in Figure 9 as a function of vanadium content in the photocatalyst. The results clearly evidenced the activity varied with an increase in V content; it increased from 0.5 mol% to 2 mol% and vanished at 20 mol% of vanadium. The last was not connected to a non-complete crystallization of the material, since our complementary measurements of the MB decomposition kinetics did not show any increment of the activity of the 20 mol% V coating after the heat treatment at temperatures of 300 °C, 450 °C, 500 °C and 600 °C.
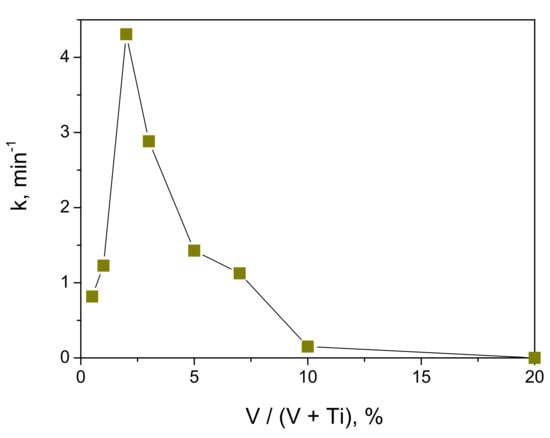
Figure 9.
Rate constant of photocatalytic decomposition of MB with UVA lamp illumination (λ = 365 nm) versus vanadium content in V-TiO2 coated glass beads.
Although the direct comparison with literature data is not possible, Chang et al. [18] showed that insertion of vanadium ions decreases photocatalytic activity of TiO2 nanoparticles under UV light (305 nm) illumination toward MB decomposition. On the other hand, Zhang et al. [28] reported that the maximum rate of the MB decomposition of V-doped TiO2 nanofibers is attained at 5.0 wt% V under UV light illumination (50 W high-pressure Hg-lamp, λ ≥ 330 nm). Furthermore, the maximum activity of 1 mol% V-doped TiO2 nanoparticles was reported in degradation of methyl orange in aqueous solutions under UVA lamp (365 nm) illumination [23]. This spread of data may be explained by material elemental homogeneity. In fact, Liu at al. [30] proposed that the photocatalytic activity under UV illumination (365 nm) of evenly V-doped TiO2 photocatalysts attains the maximum at low dopant level ~0.002 mol% and decreases with further increase in the V content; in contrast, the unevenly doped V-TiO2 photocatalysts possess a higher photocatalytic activity, which can be ascribed to an effective electrostatic-field-driven electron-hole separation. Chang et al. [29] rationalized these results by concluding that the bulk doping caused detrimental effects on the UV photocatalytic activity (λ = 305 nm, Rhodamine B degradation), since V3+/V4+ ions in titania lattice inhibit charges diffusion to the surface through deep trapping; in contrast, the surface impurities facilitate interfacial charge transfer to adsorbates. In particular, the activity of bulk V-doped TiO2 decreased upon increasing V/Ti ratio up to V/Ti = 1.2%; in contrast, activity of the surface V-doped TiO2 increased upon increasing the concentration of V ions up to V/Ti = 0.3. These results evidence the key role of the preparation method on the V-TiO2 material activity.
Because of the similar absorbance of V-TiO2 coatings (Figure 7, see also discussion of DTA-TGA measurements in Section 2.1) the specific surface area is not expected to be responsible for the observed effect. The anatase crystalline cell was also preserved at the vanadium content below 20 mol%. We, therefore, relate it to the material morphology and electronic structure. In fact, our particular method of the controlled V-TiO2 nucleation [37] suggests the formation of particles enriched with surface vanadium, which according to Bettinelli et al. [17] promotes the photocatalytic activity because of a modification of the adsorption capacity; we notice that a complex interaction between Ti3+/Ti4+ and V4+/V5+ in mixed metal oxides has been earlier investigated by Trifiro [44]. However, this explanation is not supported by our MB adsorption measurements, which showed a small variation of the adsorbance capacity of anatase TiO2 with vanadium loading, in agreement with earlier results of Khan et al. [21], who reported the specific surface area (BET) of V-doped TiO2 with V/Ti ratio of 1–5 mol% synthesized by hydrothermal method ranged between 140 and 168 m2/g. Furthermore, we notice an interesting correlation; the maximum activity corresponds to the composition, in which, according to our Rietveld analysis, brookite phase appeared and crystalline domains increased. The last may strengthen charge separation efficiency at the anatase–brookite interface, improving the activity.
2.2.2. Visible Light Activation
The V-TiO2 tested with the UVA light source were also used in complementary photocatalytic experiments with the visible illumination. The experimental procedure is described in Section 3.3. After establishment of equilibrium of the MB adsorption/desorption on the photocatalyst (Figure 7), the visible 50-W lamp was switch “on” and sampling was periodically taken on the solution for the evaluation of the MB concentration decrease. An appropriate film filter (λcutoff = 385 nm, Figure 15b) was used in the experiments to avoid material activation with the UVA component. The kinetics of MB decomposition on glass beads coated with V-TiO2 nanoparticles with different vanadium content are shown in Figure 10.
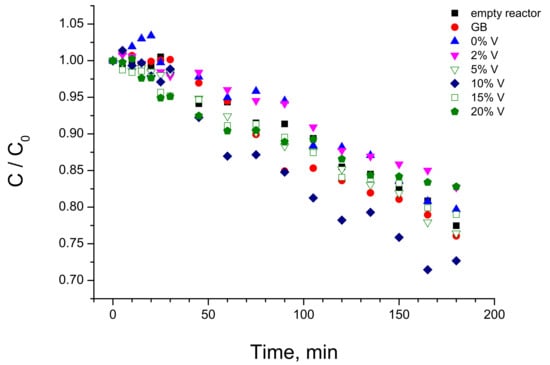
Figure 10.
Kinetics of MB decomposition with VIS lamp illumination (λ > 385 nm) using V-TiO2 coated glass beads with different vanadium content (in mol%).
The experimental data in Figure 10 followed the first-order kinetics and, by analogy with the UVA photocatalytic data (see Section 2.2.1), were linearly fitted in semi-logarithmic frame to obtain the reaction rate constants k (in min−1). These k values are presented in Figure 11 as a function of vanadium content in the photocatalyst.
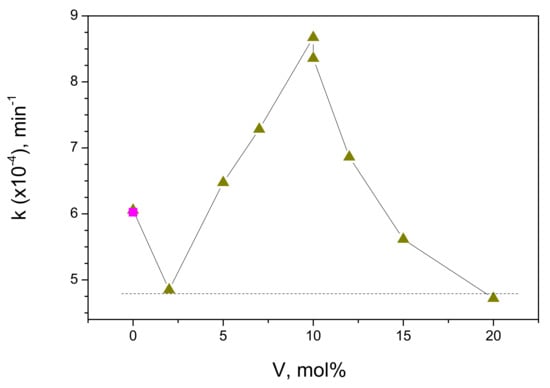
Figure 11.
Rate constant of MB decomposition with VIS lamp illumination (λ > 385 nm) versus vanadium content on V-TiO2 coated glass beads. Rate in empty reactor (due to photolysis) is shown by “filled square” symbol.
According to these data, the activity of the V-TiO2 anatase coatings increased with the increase in vanadium content reaching maximum at 10 mol% V and decreasing afterwards. We notice that the level of k = 6 ∙ 10−oo4 min−1 in empty reactor belongs to the direct photolysis, which remains the main route of the MB decomposition with pure anatase TiO2 (0 mol% V) under the visible light illumination. Because of the somewhat weaker adsorption capacity of the V-doped coatings, the rate constant of direct photolysis slightly decreased (k = 4.8 ∙ 10−4 min−1) over 2 mol% V doped material. By consequence, the following increase in the activity was purely attributed to photocatalysis. At 20 mol% V doping, the MB decomposition rate constant decreased to the direct photolysis level, confirming evanescent photocatalytic contribution. We conclude, therefore, that the photocatalytic activity of the V-doped anatase TiO2 has a maximum at 10 mol% V content and disappeared in pure TiO2 as well in heavily doped V-TiO2 material with the vanadium content of 20 mol% and higher (not shown here).
In order to clear up the nature of material activity, we underwent the measurements of the photocatalytic kinetics with different intensities of the visible lamp illumination. These series were completed with different lamp powers for V-TiO2 coatings with 10 mol% V content. The resulting dependence of the photocatalytic rate constants in empty reactor (photolysis) and in reactor filled with V-TiO2 coated glass beads (photocatalysis) on the visible lamp power is shown in Figure 12.
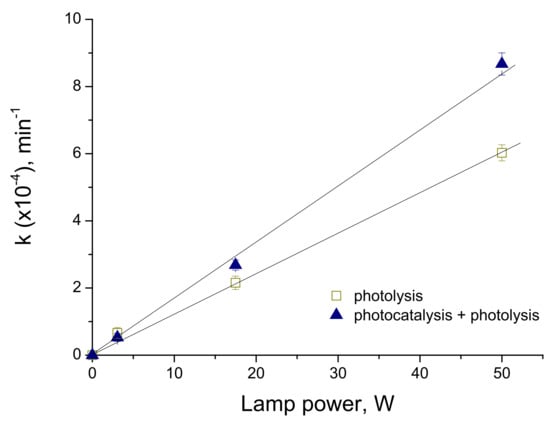
Figure 12.
Rate constant of MB decomposition versus visible lamp power (λ > 385 nm).
The analysis of the experimental data showed that photocatalytic rates kph of MB decomposition have an evident linear component kph ∝ W, which confirms that the process is far from a saturation phenomena.
The electronic properties of vanadium-doped rutile TiO2 are investigated theoretically with a Hartree–Fock/DFT hybrid approach by Islam et al. [45]. The energetic and electronic properties are converged with dopant concentrations in the range of 0.9 to 3.2%, which is compatible with the experimentally accessible range of the V-TiO2 compositions. The results of this study confirmed the creation of occupied and unoccupied V4+ states in the band gap and V5+ unoccupied states at the bottom of the conduction band. These conclusions were confirmed by Khan et al. [21], who showed that V 3d states are introduced below the conduction band minimum suggesting that the combined effect of V5+/V4+ centers is helpful for the reduction in recombination rates of photoinduced charge carriers by trapping. Recently, position of the V dopant-induced intra-gap levels has been estimated as 2.2 eV below the conduction band minimum by Rossi et al. [26], permitted the transfer of electrons into the CB on electronic transitions from intra-gap levels associated with V4+ cations, by absorbing 530 nm photons. Furthermore, a precision on the intraband defect states was given by Ren et al. [24] suggesting a synergistic effect of V and single-electron-trapped oxygen vacancy (SETOV) Vo• centers. They showed that this deep donor level hybridized by the Ti 3d and O 2p states within the band gap disappeared in V + Vo2+-TiO2 moving to the top of the valence band, while V3d at the bottom of the CB also disappeared and new electronic states consisted of Ti3d, V3d, and O2p appeared on the bottom of the CB. All these results confirm the existence of the impurity/defect states capable receiving a photoinduced electron enabling the photocatalytic activity of the material.
The previously reported studies have attributed the maximum photocatalytic activity under visible light illumination to the V-TiO2 materials with the vanadium content about 1–2 mol% [18,21,23,24,25], although a significant activity has been extended up to 5 mol% V and dropped only at 10 mol% V [24]. However, a comparison with our results indicating a maximum activity of V-TiO2 at 10 mol% V (Figure 11), is not straightforward. First at all, this is because complex interplay between the surface and bulk states [29] could affect the material response and control the photocatalytic process. In fact, cations occupy almost 50% of surface sites in the elementary V-TiO2 nuclei, which is the principal building block of our nanocoatings [37]. In small nanoparticles, no distinct separation between surface and bulk states could be expected, which can affect the charge diffusion process, by simultaneously improving (surface sites) and inhibiting (bulk sites) the interfacial charge transfer to adsorbates. The variation of the material activity under UVA illumination (Figure 9) could be rationalized by first assuming filling of bulk states (which initially reduced the activity of V-TiO2 compared with pure titania), then filling of surface states (which subsequently reproduced an expected activity variation). The visible illumination does not result in any appreciable photocatalytic activity of pure titania; therefore, in contrast to UVA illumination, no initial reduction in the activity with small addition of vanadium can be observed. With the following increase in the vanadium content, the activity increases (Figure 11), apparently because the bulk states weakly participate in the excitation process. Regardless, by comparing in Figure 13 the activity curves after UVA and visible lamp illuminations, one can assume the existence of specific active sites X1 and X2 in respectively 2 mol% V and 10 mol% V materials. The site X1 can be populated after the photoinduced CB/VB charges relaxation (UVA lamp). In contrast, the direct intragap excitation (VIS lamp) cannot reach these states, which makes the activity of 2 mol% V material low. On the other hand, the direct intragap excitation (VIS lamp) populates active site X2, which population after CB/VB charges relaxation (UVA lamp) is not effective. Since the CB electrons appear in V-TiO2 materials under both ultraviolet and visible light illuminations [26], the hypothetical states X1 and X2 can be attributed to the hole (h+) localization at the nanoparticles surface. Their natures still remain unclear.
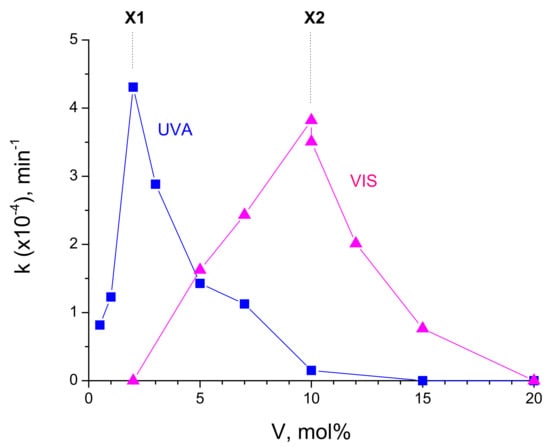
Figure 13.
Comparison of V-TiO2 photocatalysts activities towards MB decomposition under UVA (8 W, λ = 365 nm) and VIS (50 W, λ > 385 nm) lamps illuminations. Participation of active sites X1 and X2 in respective materials can be suggested.
3. Materials and Methods
3.1. Photocatalyst Preparation
The mixed oxide V-TiO2 nanoparticles with different vanadium content V/(V + Ti) between 0 and 20 mol% were prepared in a laboratory chemical reactor with ultrarapid micromixing [46] followed by the reactive colloid deposition on glass beads and heat treatment. The sol–gel method using titanium and vanadium precursors was applied to the VTOA nanoparticles synthesis [37]. In brief, the two stock solutions (each of 50 mL volume) injected into the reactor contained, respectively, (A) mixed vanadium oxytripropoxide (98%, Sigma Aldrich, Saint-Quentin-Fallavier, France) and titanium tetraisopropoxide (TTIP, 98%, Sigma-Aldrich, Saint-Quentin-Fallavier, France) precursors in n-propanol (99.5%, Sigma Aldrich, Saint-Quentin-Fallavier, France) and (B) twice filtered distilled water (syringe filter 0.1 µm porosity PALLs Acrodisc) in n-propanol. The titanium precursor concentration in the reaction volume was CTi = 0.3 mol/L and water concentration Cw was adjusted in order to maintain the hydrolysis ratio H = Cw/(CTi + CV) = 1.5, which according to our previous results assures the particles nucleation but prohibits their mutual aggregation and growth [32,47]. The reactor was maintained at the temperature of 20.0 °C using a thermo-cryostat Haake DC10K15. The reactor operated at the Damköhler number Da ≤ 1, which means that the reaction medium was perfectly homogeneous before the chemical reactions leading to nucleation of species occurred, which permits the narrowest polydispersity of the produced nanoparticles.
In order to prepare photocatalytic coatings, the nanoparticles generated in the reactor were deposited on glass beads of 4 mm diameter (Supelco, Merck, Fontenay-sous-Bois, France) via liquid colloid deposition method under controlled atmosphere in a LABstar glove box workstation MBraun (O2 ≤ 0.5 ppm, H2O ≤ 0.5 ppm). Before deposition, the beads were washed in sulfuric acid for 1 day, rinsed in water until pH reached 7.0 and dried in oven at 80 °C for 12 h. After the deposition, the beads were separated from the solution, dried overnight in the glove box and heat treated at 450 °C for 4 h. The coating thickness in this method was estimated to be about 30–40 nm [48]. The coated beads were conserved in a glass box before the experiments. The prepared photocatalyst compositions are indicated in Table 3.
Table 3.
Synthetized V-TiO2 samples.
3.2. Photocatalyst Caracterisation
The TGA-DTA of the prepared nanoparticles were carried out with Labsys Evo de SETARAM at the air flow and heating rate of 10 °C/min. XRD patterns were obtained using D8 Discover (Bruker, Palaiseau, France) equipped with a Copper source (Kα1 = 1.54056 Å: Kα2 = 1.54439 Å, I2/I1 = 0.5) and a Lynxeye XE-T detector (1D mode). In the case of PXRD diagrams dedicated to Rietveld refinement, a wide 2θ range was used (10–110°) as well as a short step (0.02°) and a high counting rate (384 s per step). These PXRD diagrams were treated using the Rietveld method [49,50], implemented in the Fullprof software [51]. Microstructural information (size, strain) were estimated using the Thompson–Cox–Hastings formulation of the pseudo-Voigt line profile function. The Raman spectra were measured with high-resolution micro-Raman spectrometer HR800 (HORIBA JobinYvon, Palaiseau, France) operating at 633 nm wavelength with spectral and spatial resolution of 0.25 cm−1 and ~5 μm, respectively. The scattered light was collected in a backscattering configuration and recorded on a Peltier-cooled CCD camera.
3.3. Photocatalytic Activity
The effectiveness of the prepared materials in photocatalysis was tested on degradation of methylene blue (MB) in aqueous solutions. The experimental installation is shown in Figure 14.
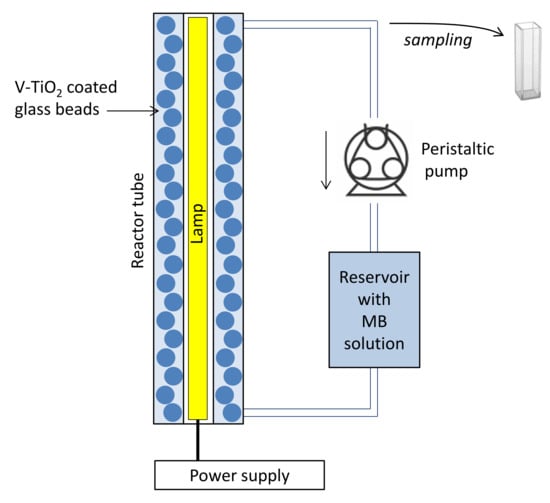
Figure 14.
Schema of fixed-bed photocatalytic reactor.
In brief, 1 L of 10−5 mol/L MB solution in distilled water was placed in a reservoir and pushed by a peristaltic pump into the quartz reactor tube, which has, respectively, external and internal diameters of 46 mm and 34 mm and 395 mm length, filled with the V-TiO2-coated glass beads of a total mass m = 90 g containing N ≈ 1050 pieces. The light source was introduced into the central air-filled part of the reactor tube. Two lamps were used in present experiments: (i) UVA lamp Phillips TL BLB of 8 Watts power emitting at 365 nm with full-width at half maximum Δλ1/2 = 16 nm and (ii) VIS lamp OSRAM HLX 64610 BRL of 50 W, having a broad-band spectrum with spectral maximum at ~700 nm.
The emission spectrum of the UVA lamp is shown in Figure 15a. Since visible lamps generally have a non-negligible UVA component in the emission, capable activating anatase TiO2 photocatalyst (λ < 380 nm), we made an additional verification of the emission spectra shown in Figure 15b (curve 1). Indeed, we observed a considerable intensity in the UVA/UVB spectral range between 300 and 380 nm. Because of this, an appropriate UV filter, in form of a film, with cutoff wavelength of 385 nm, was introduced in the inner tube of the reactor containing the lamp. The resulting emission spectrum shown in Figure 15b (curve 2) evidences an excellent elimination of the UV component, with no light of photons energy above that of the anatase TiO2 band gap: hν > Eg = 3.2 eV (λ < 380 nm).
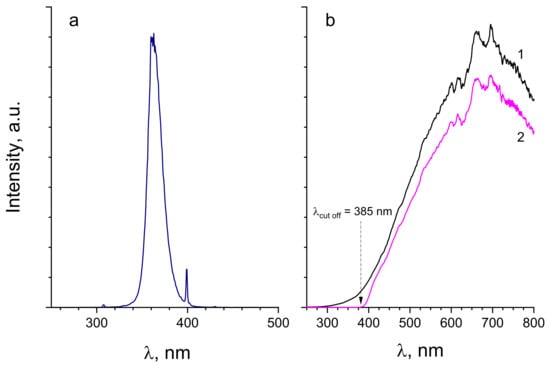
Figure 15.
Emission spectra of UVA lamp (a) and VIS lamp without (1) and with (2) UV cut-off filter (b).
The photocatalytic experiments were organized as follows:
- (1)
- The MB solution was pushed with the peristaltic pump through the main reactor tube containing the photocatalyst in dark (lamp “off”) for about 3 h duration. During this time, equilibrium was established between free pollutant molecules in the reactive solution and those adsorbed at the catalyst surface.
- (2)
- After the equilibrium was attained, the lamp was set “on” and the experiment (without interruption) was continued for 3 h longer.
- (3)
- The sampling of the pollutant solution was periodically taken at the reactor tube outlet and UV-visible absorption spectra of MB were measured using a compact optical fiber coupled PC-plugged AvaSpec-Mini UV/VIS/NIR Spectrometer (spectral resolution of 0.5 nm) (Avantes, Apeldoorn, Nederland). The MB concentration was obtained from the maximum absorbance at 665 nm, after the calibration curve measurements.
Besides of using V-TiO2 nanocoatings, blank tests were carried out in the empty reactor and in rector filled with uncoated glass beads, in order to evaluate two contributions of the direct photolysis of free and adsorbed MB by lamp photons. The reproducibility of the experimental series was verified on several chemical compositions for the catalysts and for both illumination sources. The maximum standard deviation on the calculated photocatalytic decomposition rate constant was estimated at 5%.
4. Conclusions
The structure of V-TiO2 samples in form of nanopowders with different vanadium content from 0 to 20 mol% was studied. The TGA-DTA measurements showed complex behavior of the material, resulting in a significant dependence of the anatase phase transition temperature on V content, which evidenced perfect insertion of V in the host TiO2 matrix. The heat treatment at 450 °C of V-TiO2 nanoparticles with the vanadium content below 20 mol% resulted in the formation of anatase crystalline structure, which is identical to that of pure TiO2; the Riedveld analysis of XRD patterns evidenced no significant deviation of the anatase structure parameters. In contrast, the material with 20 mol% V, which is close to the vanadium solubility limit in bulk anatase TiO2 (21 mol% [38]), showed signs of segregation with the appearance of orthorhombic phase of V2O5. Furthermore, our observations suggest the lower solubility limit of V in anatase TiO2 nanoparticles, i.e., between 10 and 20 mol%. An increase in the heat treatment temperature of the material with 20 mol% V led to a transformation of anatase to rutile structure, as confirmed by XRD and Raman measurements. In addition, peaks (XRD) and bands (Raman) assigned to α-V2O5 appeared in a relatively narrow range of temperatures of 600 ± 100 °C, i.e., between those characteristic of pure anatase and rutile phases crystallizations. This may be due to a decay of a unknown metastable phase of VxTiyOz solid formed at high temperatures. More work is required to identify this phase and relate it to the preparation method, which is specific to small size (nanoscale) and elemental homogeneity (due to micromixing conditions in chemical reactor).
Following the first stage of the size-selected VTOA nanoparticles mass fabrication and structural characterization after the heat treatment, we have prepared photocatalytic nanocoatings with the vanadium content 0 ≤ V/(V + Ti) ≤ 0.2 by the VTOA chemical colloid deposition on glass beads with the subsequent heat treatment at 450 °C for 4 h. The photocatalytic activity of the prepared coatings was investigated under illuminations with UVA (λ = 365 nm, 8 W) and visible (λ > 390 nm, 50 W) lamps. The MB kinetics was continuously monitored (i) in dark during 3 h until attaining the equilibrium of the MB adsorption–desorption process on the catalyst surface and (ii) under lamp illumination during 3 h for quantification of the photolytic and photocatalytic reaction kinetics. The photolytic and photocatalytic processes were distinguished. The best performance under UVA and Visible light illuminations showed V-TiO2 photocatalysts with, respectively, 2 mol% and 10 mol% of vanadium. We tentatively assigned this finding to the population of specific active sites X1 and X2. These states can be accessed either via charge relaxation through the CB/VB continuum states (X1/UVA lamp) or via direct impurity/defect intraband levels excitation (X2/VIS lamp), while their population via complementary pathways (X2/UVA lamp and X1/VIS lamp) is not effective. We also noticed that the maximum UVA activity corresponds to the composition where brookite phase appeared and crystalline domains sharply increased, which might strengthen the charge separation efficiency at the anatase–brookite interface.
Author Contributions
Conceptualization, A.K.; methodology, M.N.; validation, A.K., M.N. and A.L.; formal analysis, A.L.; investigation, M.S.M., C.P., C.S. and M.S.; resources, M.N., M.B.A. and M.T.; data curation, M.S.M., A.L., C.P., C.S. and M.S.; writing—original draft preparation, A.K.; writing—review and editing, A.K., M.N., A.L.; visualization, M.S.M., A.L., M.T., M.N. and M.B.A.; supervision, A.K. and M.N.; funding acquisition, M.N. All authors have read and agreed to the published version of the manuscript.
Funding
This research received no external funding.
Data Availability Statement
The study did not report any data.
Acknowledgments
M.S.M. acknowledges a financial support of his PhD work by the National Council of Science and Technology (CONACYT) of the Mexican government and the Doctoral School of the Sorbonne Paris-Nord University.
Conflicts of Interest
The authors declare no conflict of interest.
References
- Fox, M.A.; Dulay, M.T. Heterogeneous photocatalysis. Chem. Rev. 1993, 93, 341–357. [Google Scholar] [CrossRef]
- Ohtani, B. Photocatalysis A to Z—What we know and what we do not know in a scientific sense. J. Photochem. Photobiol. C 2010, 11, 157–178. [Google Scholar] [CrossRef] [Green Version]
- Parrino, F.; Loddo, V.; Augugliaro, V.; Camera-Roda, G.; Palmisano, G.; Palmisano, L.; Yurdakal, S. Heterogeneous photocatalysis: Guidelines on experimental setup, catalyst characterization, interpretation, and assessment of reactivity. Catal. Rev. 2018, 61, 163–213. [Google Scholar] [CrossRef]
- Nohynek, G.; Hueber-Becker, F.; Meuling, W.; Dufour, E.; Bolt, H.; de Bie, A. Occupational exposure of hairdressers to [14C]-para-phenylenediamine-containing oxidative hair dyes. Toxicol. Lett. 2007, 172, S30–S31. [Google Scholar] [CrossRef]
- Cassano, A.; Molinari, R.; Romano, M.; Drioli, E. Treatment of aqueous effluents of the leather industry by membrane processes A review. J. Membr. Sci. 2001, 181, 111–126. [Google Scholar] [CrossRef]
- Albano, G.; Aronica, L.A.; Biver, T.; Detti, R.; Pucci, A. Tris-ethynylphenyl-amine fluorophores: Synthesis, characterisation and test of performances in luminescent solar concentrators. ChemistrySelect 2018, 3, 1749–1754. [Google Scholar] [CrossRef]
- Fujishima, A.; Hashimoto, K.; Watanabe, T. TiO2 Photocatalysis: Fundamentals and Applications; BKC: Tokyo, Japan, 1999. [Google Scholar]
- Hashimoto, K.; Irie, H.; Fujishima, A. TiO2 photocatalysis: A historical overview and future prospects. Jpn. J. Appl. Phys. 2005, 44, 8269–8285. [Google Scholar] [CrossRef]
- Carneiro, J.T.; Savenije, T.J.; Moulijn, J.A.; Mul, G. How phase composition influences optoelectronic and photocatalytic properties of TiO2. J. Phys. Chem. C 2011, 115, 2211–2217. [Google Scholar] [CrossRef]
- Schneider, J.; Matsuoka, M.; Takeuchi, M.; Zhang, J.; Horiuchi, Y.; Anpo, M.; Bahnemann, D.W. Understanding TiO2 photocatalysis: Mechanisms and materials. Chem. Rev. 2014, 114, 9919–9986. [Google Scholar] [CrossRef]
- Zaleska, A. Doped-TiO2: A review. Recent Pat. Eng. 2008, 2, 157–164. [Google Scholar] [CrossRef]
- Doustkhah, E.; Assadi, M.H.N.; Komaguchi, K.; Tsunoji, N.; Esmat, M.; Fukata, N.; Tomita, O.; Abe, R.; Ohtani, B.; Ide, Y. In situ blue titania via band shape engineering for exceptional solar H2 production in rutile TiO2. Appl. Catal. B 2021, 297, 120380. [Google Scholar] [CrossRef]
- Esmat, M.; El-Hosainy, H.; Tahawy, R.; Jevasuwan, W.; Tsunoji, N.; Fukata, N.; Ide, Y. Nitrogen doping-mediated oxygen vacancies enhancing co-catalyst-free solar photocatalytic H2 production activity in anatase TiO2 nanosheet assembly. Appl. Catal. B 2021, 285, 119755. [Google Scholar] [CrossRef]
- Hussein, M.; Assadi, N.; Hanaor, D.A. The effects of copper doping on photocatalytic activity at (101) planes of anatase TiO2: A theoretical study. Appl. Surf. Sci. 2016, 387, 682–689. [Google Scholar]
- Kruefu, V.; Sintuya, H.; Pookmanee, P.; Phanichphant, S. Visible light photocatalytic degradation of methylene blue using V2O5 nanoparticles. In Proceedings of the 6th International Conference on Developments in Engineering and Technology, Bangkok, Thailand, 6–7 February 2017; pp. 62–67. [Google Scholar]
- Liu, J.; Yang, R.; Li, S. Preparation and characterization of the TiO2/V2O5 photocatalyst with visible light activity. Rare Met. 2006, 25, 636–642. [Google Scholar] [CrossRef]
- Bettinelli, M.; Dallacasa, V.; Falcomer, D.; Fornasiero, P.; Gombac, V.; Montini, T.; Romano, L.; Speghini, A. Photocatalytic activity of TiO2 doped with boron and vanadium. J. Hazard. Mater. 2007, 146, 529–534. [Google Scholar] [CrossRef] [PubMed]
- Chang, P.-Y.; Huang, C.-H.; Doong, R.-A. Characterization and photocatalytic activity of vanadium doped titanium dioxide nanocatalysts. Water Sci. Technol. 2009, 59, 523–530. [Google Scholar] [CrossRef] [PubMed]
- Lin, W.-C.; Lin, Y.-J. Effect of vanadium(IV)-doping on the visible light-induced catalytic activity of titanium. Environ. Eng. Sci. 2012, 29, 447–452. [Google Scholar] [CrossRef] [Green Version]
- Khan, H.; Berk, D. Sol–gel synthesized vanadium doped TiO2 photocatalyst: Physicochemical properties. J. Sol-Gel Sci. Technol. 2013, 68, 180–192. [Google Scholar] [CrossRef]
- Khan, M.; Song, Y.; Chen, N.; Cao, W. Effect of V doping concentration on the electronic structure, optical and photocatalytic properties of nano-sized V-doped anatase TiO2. Mater. Chem. Phys. 2013, 142, 148–153. [Google Scholar] [CrossRef]
- Al-Mamun, M.R.; Kader, S.; Islam, M.S.; Khan, M.Z.H. Photocatalytic activity improvement and application of UV-TiO2 photocatalysis in textile wastewater treatment: A review. J. Environ. Chem. Eng. 2019, 7, 103248. [Google Scholar] [CrossRef]
- Liu, B.; Wang, X.; Cai, G.; Wen, L.; Song, Y.; Zhao, X. Low temperature fabrication of V-doped TiO2 nanoparticles, structure and photocatalytic studies. J. Hazard. Mater. 2009, 169, 1112–1118. [Google Scholar] [CrossRef]
- Ren, F.; Li, H.; Wang, Y.; Yang, J. Enhanced photocatalytic oxidation of propylene over V-doped TiO2 photocatalyst: Reaction mechanism between V5+ and single-electron-trapped oxygen vacancy. Appl. Catal. B 2015, 176–177, 160–172. [Google Scholar] [CrossRef]
- Gu, D.-E.; Yang, B.-C.; Hu, Y.-D. A Novel method for preparing V-doped titanium dioxide thin film photocatalysts with high photocatalytic activity under visible light irradiation. Catal. Lett. 2007, 118, 254–259. [Google Scholar] [CrossRef]
- Rossi, G.; Pasquini, L.; Catone, D.; Piccioni, A.; Patelli, N.; Paladini, A.; Molinari, A.; Caramori, S.; O’Keeffe, P.; Boscherini, F. Charge carrier dynamics and visible light photocatalysis in vanadium-doped TiO2 nanoparticles. Appl. Catal. B 2018, 237, 603–612. [Google Scholar] [CrossRef] [Green Version]
- Zhou, W.; Liu, Q.; Zhu, Z.; Zhang, J. Preparation and properties of vanadium-doped TiO2 photocatalysts. J. Phys. D 2010, 43, 035301. [Google Scholar] [CrossRef]
- Zhang, Z.; Shao, C.; Zhang, L.; Li, X.; Liu, Y. Electrospun nanofibers of V-doped TiO2 with high photocatalytic activity. J. Colloid. Interface Sci. 2010, 351, 57–62. [Google Scholar] [CrossRef] [PubMed]
- Chang, S.; Liu, W. Surface doping is more beneficial than bulk doping to the photocatalytic activity of vanadium-doped TiO2. Appl. Catal. B 2011, 101, 333–342. [Google Scholar] [CrossRef]
- Liu, S.; Xie, T.; Chen, Z.; Wu, J. Highly active V–TiO2 for photocatalytic degradation of methyl orange. Appl. Surf. Sci. 2009, 255, 8587–8592. [Google Scholar] [CrossRef]
- Tieng, S.; Kanaev, A.; Chhor, K. New homogeneously doped Fe(III)-TiO2 photocatalyst for gaseous pollutant degradation. Appl. Catal. A 2011, 399, 191–197. [Google Scholar] [CrossRef]
- Azouani, R.; Soloviev, A.; Benmami, M.; Chhor, K.; Bocquet, J.-F.; Kanaev, A. Stability and growth of titanium-oxo-alcoxy TixOy(OiPr)z clusters. J. Phys. Chem. C 2007, 111, 16243–16248. [Google Scholar] [CrossRef]
- Labidi, S.; Jia, Z.; Ben Amar, M.; Chhor, K.; Kanaev, A. Nucleation and growth kinetics of zirconium-oxo-alkoxy nanopparticles. Phys. Chem. Chem. Phys. 2015, 17, 2651–2659. [Google Scholar] [CrossRef] [PubMed]
- Cheng, K.; Chhor, K.; Brinza, O.; Vrel, D.; Kanaev, A. From nanoparticles to bulk crystalline solid: Nucleation, growth kinetics and crystallisation of mixed oxide ZrxTi1-xO2 nanoparticles. Cryst. Eng. Comm. 2017, 19, 3955–3965. [Google Scholar] [CrossRef]
- Seisenbaeva, G.A.; Kessler, V.G. Precursor directed synthesis—“molecular” mechanisms in the Soft Chemistry approaches and their use for template-free synthesis of metal, metal oxide and metal chalcogenide nanoparticles and nanostructures. Nanoscale 2014, 12, 6229–6244. [Google Scholar] [CrossRef]
- Cheng, K.; Chhor, K.; Passarello, J.-P.; Colbeau-Justin, C.; Kanaev, A. Photocatalytic nanoparticulate ZrxTi1-xO2 coatings with controlled homogeneity of elemental composition. Chem. Sel. 2018, 3, 11118–11126. [Google Scholar]
- Sanchez Mendez, M.; Jia, Z.; Traore, M.; Ben Amar, M.; Nikravech, M.; Kanaev, A. Nucleation and growth of mixed vanadium-titanium oxo-alkoxy nanoparticles in sol-gel synthesis. Colloid. Surf. A 2021, 610, 125636. [Google Scholar] [CrossRef]
- Le Roy, D.; Valloppilly, S.; Skomski, R.; Liou, S.-H.; Sellmyer, D.J. Magnetism and structure of anatase (Ti1−xVx)O2 films. J. Appl. Phys. 2012, 111, 07C118. [Google Scholar] [CrossRef] [Green Version]
- Shao, G.N.; Imran, S.M.; Jeon, S.J.; Kang, S.J.; Haider, S.M.; Kim, H.T. Sol-gel synthesis of vanadium doped titania: Effect of the synthetic routes and investigation of their photocatalytic properties in the presence of natural sunlight. Appl. Surf. Sci. 2015, 351, 1213–1223. [Google Scholar] [CrossRef]
- Rezaee, M.; Khoie, S.M.M.; Liu, K.H. The role of brookite in mechanical activation of anatase-to-rutile transformation of nanocrystalline TiO2: An XRD and Raman spectroscopy investigation. CrystEngComm 2011, 13, 5055–5061. [Google Scholar] [CrossRef] [Green Version]
- Enjalbert, R.; Galy, J. A refinement of the structure of V2O5. Acta Cryst. C 1986, 42, 1467–1469. [Google Scholar] [CrossRef]
- Balachandran, U.; Eror, N.G. Raman spectra of titanium dioxide. J. Solid State Chem. 1982, 42, 276–282. [Google Scholar] [CrossRef]
- Shvets, P.; Dikaya, O.; Maksimova, K.; Goikhman, A. A review of Raman spectroscopy of vanadium oxides. J. Raman Spectrosc. 2019, 50, 1–19. [Google Scholar] [CrossRef]
- Trifiro, F. The chemistry of oxidation catalysts based on mixed oxides. Catal. Today 1998, 41, 21–35. [Google Scholar] [CrossRef]
- Islam, M.M.; Bredow, T.; Gerson, A. Electronic Properties of Vanadium-Doped TiO2. ChemPhysChem 2011, 12, 3467–3473. [Google Scholar] [CrossRef]
- Azouani, R.; Michau, A.; Hassouni, K.; Chhor, K.; Bocquet, J.-F.; Vignes, J.-L.; Kanaev, A. Elaboration of pure and doped TiO2 nanoparticles in sol-gel reactor with turbulent micromixing: Application to nanocoatings and photocatalysis. Chem. Eng. Res. Des. 2010, 88, 1123–1130. [Google Scholar] [CrossRef]
- Cheng, K.; Chhor, K.; Kanaev, A. Solvent effect on nucleation-growth of titanium- oxo-alkoxy nanoparticles. Chem. Phys. Lett. 2017, 672, 119–123. [Google Scholar] [CrossRef]
- Benmami, M.; Chhor, K.; Kanaev, A.V. Supported nanometric titanium oxide sols as a new efficient photocatalyst. J. Phys. Chem. B 2005, 109, 19766–19771. [Google Scholar] [CrossRef]
- Rietveld, H.M. A profile refinement method for nuclear and magnetic structures. J. Appl. Crystallogr. 1969, 2, 65–71. [Google Scholar] [CrossRef]
- Young, R.A. The Rietveld Method; Oxford University Press: New York, NY, USA, 1995. [Google Scholar]
- Rodríguez-Carvajal, J. Recent advances in magnetic structure determination by neutron powder diffraction. Phys. B Condens. Matter. 1993, 192, 55–69. [Google Scholar] [CrossRef]
Publisher’s Note: MDPI stays neutral with regard to jurisdictional claims in published maps and institutional affiliations. |
© 2021 by the authors. Licensee MDPI, Basel, Switzerland. This article is an open access article distributed under the terms and conditions of the Creative Commons Attribution (CC BY) license (https://creativecommons.org/licenses/by/4.0/).