Abstract
Inelastic neutron scattering (INS) spectroscopy is used to explore the 0–12,000 cm−1 range to characterise the interaction of H2 with iron benzene-1,3,5-tricarboxylate (Fe-BTC). Two peaks are observed in the low energy (<350 cm−1) region after exposure to H2. Measurements with hydrogen deuteride (HD) confirm that the peaks originate from H2. The most likely explanation is that there are two populations of H2 (HD) present. For both the H2- and the HD-loaded samples, the higher energy peak is close in energy to that of the pure isotopomer, so it is assigned to bulk-like H2/HD held in pores of the Fe-BTC. The lower energy peak is assigned to H2/HD interacting directly with the Fe ion exposed on dehydration. It was also possible to detect the H–H stretch in the same experiment; however, unfortunately, the instrumental resolution is insufficient to separate the stretch modes of the bound H2 (HD) and that in the pores.
1. Introduction
Metal organic framework (MOF) materials are coordination complexes where the metal ions are linked by bridging organic ligands (“linkers”) to generate porous materials [1]. The metal ions can be any except the alkali metals and the alkaline earth metals. The linkers are typically polycarboxylates e.g., benzene-1,4-dicarboxylate or adamantane-1,3,5,7-tetracarboxylate. Intense interest in these materials was sparked by the report [2] that they exhibited exceptionally high capacity for hydrogen absorption, opening the possibility of their use as hydrogen storage media [3,4,5,6]. Depending on the metal and the linker, it is possible to create MOFs that have pore sizes from < 2 to almost 10 nm [6].
One of the most studied [7,8,9,10] materials for hydrogen storage is copper benzene-1,3,5-tricarboxylate (Cu-BTC, HKUST-1). The tridentate ligand results in a three-dimensional network that has three distinct pore systems, having dimensions ranging from ca. 5 to 12 Å in diameter. This exhibits 2–3 weight% uptake of hydrogen at 77 K with a maximum uptake of ~6 weight% at 25 K. The material has been structurally characterised by neutron diffraction that has enabled the location of the adsorbed dihydrogen [7]. The nature of the binding was explored by inelastic neutron scattering (INS) [7,8,9] spectroscopy and infrared spectroscopy [10]. These confirmed that multiple sites were occupied, each having different degrees of interaction, as shown by the shift of the H2 J = 0 → 1 rotational line at 120 cm−1 and the change in the H–H stretch mode at 4161 cm−1.
A related material is iron benzene-1,3,5-tricarboxylate (Fe-BTC, BasoliteTM F300), and while formally this is the iron analogue of Cu-BTC, it has a different structure and has been much less studied. This is because, unlike Cu-BTC, it only forms as a poorly crystalline, almost amorphous material. From 57Fe Mössbauer spectroscopy, it was concluded that: “Fe(BTC) is neither crystalline nor amorphous, but rather, disordered” [11]. The most complete description of the structure is that of Sciortino et al. [12], who modelled the structure around the Fe3+ ions as acetate (Ac) ions, rather than BTC, and formulated it as Fe3(μ3-O)(μ-OAc)6(H2O)3. Figure 1 shows their structure: the coordination around the iron is octahedral with the μ3-O being one vertex, two μ-OAc providing a further four, and the H2O occupying the sixth site. The proposed structure around the Fe ions is similar to that of the fully crystalline MOF MIL-100(Fe) [13]. This is also an iron benzene-1,3,5-tricarboxylate, but which is made by a different method than BasoliteTM F300. On drying Fe-BTC, the water is lost to leave a vacant coordination site, where hydrogen can bind (right side panel of Figure 1). At 77 K, the H2 uptake of Fe-BTC at 1 bar is just under 1 wt% (0.8 [14]).
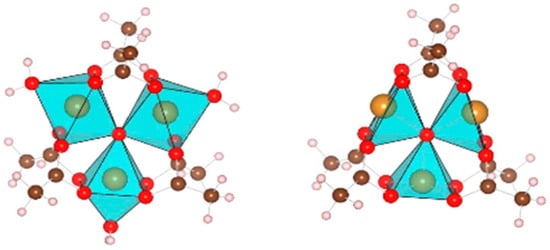
Figure 1.
Acetate model of the structure of iron benzene-1,3,5-tricarboxylate (Fe-BTC), where iron atoms are inside the polyhedra. Oxygen = red, carbon = brown, and hydrogen = white. Left panel: hydrated form, right panel: dehydrated form. Reprinted with permission from [12]. Copyright 2015 American Chemical Society.
In this paper, I use INS spectroscopy to explore the full 0–12,000 cm−1 range to characterise the interaction of H2 with Fe-BTC. INS spectroscopy [15] is a form of vibrational spectroscopy. It is analogous to Raman spectroscopy, which is inelastic light (photon) scattering, but uses neutrons as the scattering particle. This has a number of consequences that derive from the fact that a neutron has significant mass (1.008 amu ≈ 1H). In any scattering event (elastic or inelastic), there is always a change in momentum (Q, Å−1), and in an inelastic event, there is also a change in energy (ω, cm−1); thus, INS spectroscopy is intrinsically two dimensional, with the measured intensity (S(Q, ω)) depending on both the energy and momentum transfer—see Figure 2. INS spectrometers are of two types [15]: one that follows a fixed trajectory through (Q, ω) space, and the second that allows both Q and ω to be measured independently. The second type is used in this work. As explained in more detail elsewhere, [15,16] with this type of spectrometer, the incident beam (Ei) is a single energy selected from a polychromatic pulse of neutrons. This provides a spectrum in the range 0–Ei, and the resolution is a fraction of Ei (in the present case ~1.5%); thus, to obtain good resolution across the entire spectral range, several incident energies are required. Note that improved resolution comes with reduced spectral range.
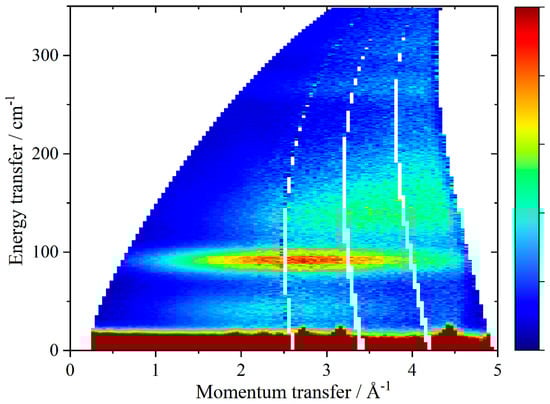
Figure 2.
S(Q, ω)) map of solid hydrogen deuteride at 7 K with Ei = 400 cm−1.
The intensity also depends on the inelastic scattering cross-section of the atom, and this is both element and isotope specific. As this is ~20 times larger for 1H than any other nucleus (including 2H), it means that the spectra are dominated by motions that involve hydrogen. The most convincing method to show that a motion involves a particular type of atom is to carry out an isotopic substitution. For H2, D2 would be the usual choice. However, the cross-section for deuterium is small, thus, in INS spectroscopy, deuterium substitution results in the expected downshift in transition energy but also in a very large reduction in intensity. To overcome this drawback, in this work, I use hydrogen deuteride (HD) to confirm H2 involvement. The isotope shift is not as large, but still significant and has the advantage that the intensity remains high, as shown in Figure 2.
In the gas-phase hydrogen, H2, has six degrees of freedom: three translational, two rotational and one vibrational, the H–H stretch. In the solid state, the translational degrees become the translational modes in the crystal. Very unusually, the molecule still undergoes nearly free rotation (usually, the modes are frustrated and give rise to librations), and the H–H stretch is largely unchanged. INS spectroscopy has long been used to study the translational and rotational excitations of solid H2 [17,18,19,20]; recently the H–H stretch was also observed by INS [21]. Interaction of H2 with a material downshifts the transition energy of the first rotational line [7,8,9,15].
2. Results
Figure 3 shows the low energy region of Fe-BTC (Figure 3a, blue) and after adsorption of H2 at 77 K (Figure 3b, red). HD was adsorbed at 77 K after evacuation of the H2-loaded sample at room temperature (Figure 3c, olive). It can be seen that adsorption results in an increased baseline, consistent with the presence of more “scattering power” and new bands at 84 and 127 cm−1 (H2 loaded) and 50 and 107 cm−1 (HD loaded). These are more clearly seen in the difference spectra, as shown in Figure 3e,g. For reference, the spectra of solid H2 (Figure 3d) and HD (Figure 3f) are also shown.
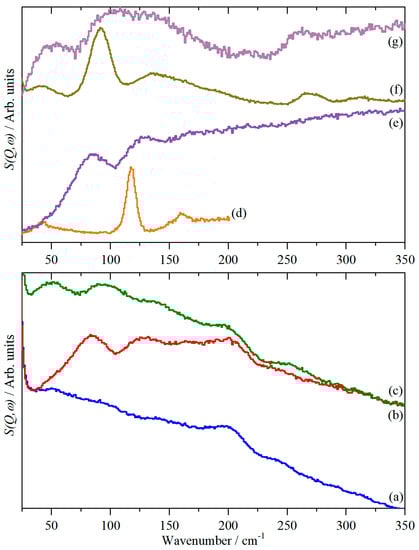
Figure 3.
Inelastic neutron scattering (INS) spectra at 7 K in the low energy region (Ei = 400 cm−1) of (a) clean Fe-BTC, (b) Fe-BTC + H2, (c) Fe-BTC + HD, (d) solid H2 (Ei = 240 cm−1 [21]), (e) difference spectrum ((Fe-BTC + H2 )-(clean Fe-BTC)), i.e., (b–a), (f) solid HD and (g) difference spectrum ((Fe-BTC + HD)-(clean Fe-BTC)), i.e., (c–a). (e) is ordinate expanded × 1.1 and (g) × 2 relative to (a), (b) and (c).
Spectra in the “fingerprint region” are shown in Figure 4. The spectra are almost identical to that of Cu-BTC [9], so must be the spectrum of the BTC ligand. This is confirmed by the difference spectrum that shows no molecular features; there is only the broad feature characteristic of molecular recoil of dihydrogen [15,19].
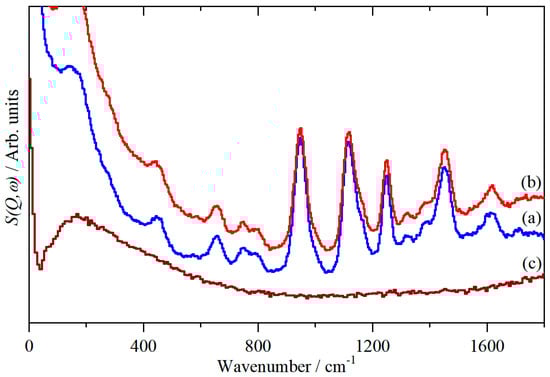
Figure 4.
INS spectra at 7 K in the fingerprint region (Ei = 2000 cm−1) of (a) clean Fe-BTC, (b) Fe-BTC + H2 and (c) difference spectrum ((Fe-BTC + H2)-(clean Fe-BTC)), i.e., (b–a). All the spectra are plotted on the same ordinate scale, with no offsets.
In Figure 5a,b are shown the S(Q, ω) maps of solid H2 [21] and solid HD, respectively, using Ei = 16,000 cm−1, which allows the H–H and H–D stretch modes to be observed. As explained elsewhere [21], the spectra are dominated by the recoil trajectories of the isotopomers in their ground and first excited vibrational states. These are given by
where is the energy (cm−1) of the molecule in vibrational level ν (= 0, 1…) and rotational level J, Er is the recoil energy (cm−1), and M is the molecular mass (amu).
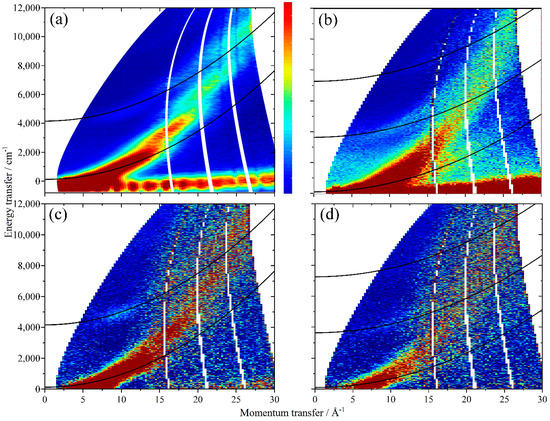
Figure 5.
S(Q, ω)) maps at 7 K in the high energy region (Ei = 16,000 cm−1) of (a) H2, (b)solid HD, (c) difference spectrum ((Fe-BTC + H2)-(clean Fe-BTC)) and (d) difference spectrum ((Fe-BTC + HD)-(clean Fe-BTC)). In (a,c), the solid lines show the recoil trajectories of the ν = 1, J = 0 (upper) and ν = 0, J = 1 (lower) lines and in (b,d), the ν = 2, J = 0 (top), ν = 1, J = 0 (middle) and ν = 0, J = 1 (bottom).
The ideal trajectories are parabolae in (Q, ω) and are shown by the solid black lines; these are calculated for the ν = 0, J = 1 (lower) and ν = 2, J = 0 (upper) states. The experimental data deviate from these because excitations to higher rotational states are also possible, e.g., ν = 2, J = 1 for HD. In Figure 5c,d are shown the corresponding S(Q, ω) maps of H2 and HD absorbed in Fe-BTC after subtraction of the map of Fe-BTC (which is why the signal-to-noise ratio is markedly poorer). Nonetheless, it can be seen that Figure 5a,c and also Figure 5b,d are very similar. This is emphasized in Figure 6, where the spectra have been summed over a range of momentum transfer values, and it can be seen that the peaks occur at 4718 cm−1 (Figure 6b, H2) and 3878 cm−1 (Figure 6c, HD). These are in reasonable agreement with 4632 and 3946 cm−1 calculated from Equation (1) with fundamental transition energies of 4161 and 3630 cm−1 for H2 and HD, respectively, [22] at Q = 7.5 Å−1 (average of Q range that the data are summed over).
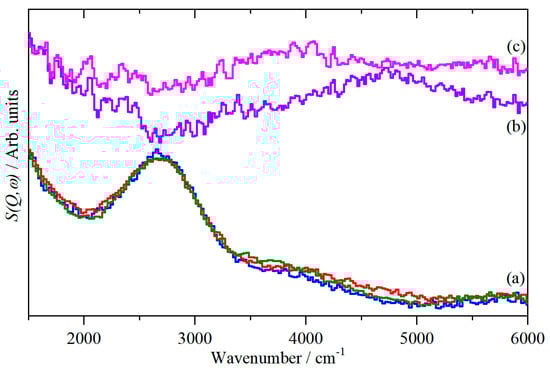
Figure 6.
INS spectra at 7 K in the high energy region (Ei = 16,000 cm−1) of (a) clean Fe-BTC (blue), Fe-BTC + H2 (red) and Fe-BTC + HD (olive) (spectra integrated over the range 0 ≤ Q ≤ 8 Å−1), (b) difference spectrum ((Fe-BTC + H2)-(clean Fe-BTC)) and (c) difference spectrum ((Fe-BTC + HD)-(clean Fe-BTC)) (spectra integrated over the range 5 ≤ Q ≤ 10 Å−1). (b,c) are ordinate expanded × 2 relative to (a).
3. Discussion
From Figure 3b,e, it can be seen that new peaks appear in the region associated with H2 rotational motions on exposure of Fe-BTC to H2. The isotopic shift observed on replacement of H2 with HD confirms that the features are characteristic of H2 (HD).
The simplest explanation for the presence of two peaks is that there are two populations of H2 (HD) present. I note that for Cu-BTC, multiple sites are occupied [7,8,9,10]. For both the H2- and the HD-loaded samples, the higher energy peak is close in energy to that of the pure isotopomer, so it is assigned to bulk-like H2/HD held in pores of the Fe-BTC. The lower energy peak is assigned to H2/HD interacting directly with the Fe ion exposed on dehydration (see Figure 1, right panel).
An alternative assignment is that there is only a single species present. Two peaks can arise because the first excited rotational state of H2 is triply degenerate in the gas phase (m = 0, ±1, where m is the rotational quantum number), but if the interaction with the metal ion is sufficiently strong, it will partially lift the degeneracy. This will result in two lines with a 1:2 or 2:1 intensity ratio, depending on whether the m = 0 level moves to lower or higher energy, which, in turn, depends on the orientation (end-on or sideways) of the H2 molecule with respect to the metal ion [15]. Arguing against this possibility is that the spectra do not conform to the prediction of the intensities and that the H2 uptake would require that there were approximately two dihydrogen molecules coordinated per metal atom. For these reasons, the simpler explanation of two sites is preferred.
One of the aspirations of this work, was that the use of a type of instrument that could access both the H2 rotational transitions at low energy and the H–H stretch at high energy would allow a better description of the interactions between the H2 and the iron. Unfortunately, the resolution in the high energy region is insufficient to separate the two types of H2 present. Infrared spectroscopy [10] shows that in Cu-BTC, the H–H vibration is red-shifted to 4090 cm−1, i.e., only by 68 cm−1, and as Figure 6 shows (note the widths of the H2 and HD lines), this is not resolvable by this instrument. As MAPS is the highest resolution INS spectrometer anywhere on Earth in this energy range, this means that INS spectroscopy is not a viable technique for investigation of the H–H stretch mode of weakly adsorbed species. The inability to resolve the stretch modes of the bound and “free” H2 is a consequence of two factors. The first is the instrumental resolution, which to have a sufficient Q-range to include the H2 peak would require an incident energy of 8000 cm−1, which would have a resolution of ~160 cm−1, i.e., two to four times greater than the 20–80 cm−1 shifts that are typically observed [10,23,24]. The second factor is the physics of the interaction between hydrogen and the metal, which results in recoil of the H2. This is likely to occur for H2 in any MOF, as the interaction energies are similar in all cases. The result is that summing across a range of Q also results in summing across a range of energy transfer, so the mode is intrinsically broad.
In the low energy region, two peaks are apparent. The first INS studies of Cu-BTC showed several peaks [8,9], with better resolution some of these could be resolved and provided more information about the present interactions [7]. It is quite possible that a similar situation is present for Fe-BTC, namely, that the broad lines observed here are actually multiplets. Higher resolution studies would be required to address this possibility.
4. Materials and Methods
Fe-BTC (BasoliteTM F300, produced by BASF) was purchased from Aldrich (Gillingham, Dorset, UK). Hydrogen (99.9995%) from CK Special Gases Ltd. (West Bromwich, UK) and hydrogen deuteride (96 mol % DH, 98 atom % D) from Aldrich (Gillingham, Dorset, UK ) were used as received. The Fe-BTC was dried overnight under vacuum at 373 K to remove water in an aluminium flow-through cell. The design is the same as that of the Inconel [25] and stainless steel [26] cells that have been previously described, except that the cell body is made of aluminium and the Conflat flanges are sealed with indium wire rather than a copper gasket. The cell was then attached to a gas-handling centre stick and background spectra recorded with the direct geometry INS spectrometer MAPS [16,27] at ISIS [28]. Incident energies (Ei) of 50, 250, 650 and 2000 meV (1 meV = 8.066 cm−1) were used. These are to study the J = 0 → 1 rotational line of H2 and HD, the internal mode region of Fe-BTC, the C–H/O–H stretch region and the H–H/H–D stretch region, respectively. H2 and HD were adsorbed by the Fe-BTC at 77 K in the aluminium flow-through cell from a calibrated volume attached to a vacuum manifold. Reference spectra of HD were recorded as described previously [21].
5. Conclusions
Vibrational spectroscopy is a local probe, and one of its strengths is that disordered materials, such as Fe-BTC, can be investigated. Dehydration of Fe-BTC results in vacant iron sites [12]. This work shows that there is a specific interaction between the H2 and the Fe. From the relative intensities of the bound and free H2, it is estimated that there are approximately equal numbers in each type of site. The strength of the interaction between hydrogen and the metal is similar in both Cu-BTC (which is an ordered, crystalline MOF) and Fe-BTC, as shown by the heat of adsorption (8.2 and 7.2 kJ mol−1 for Cu and Fe, respectively [14]) and the rotational transition energy (73 cm−1 for Cu [7] and 84 cm−1 for Fe).
Funding
This research was funded by the Science and Technology Facilities Council (STFC).
Acknowledgments
The STFC Rutherford Appleton Laboratory is thanked for access to neutron beam facilities [29].
Conflicts of Interest
The author declares no conflict of interest.
References
- Eddaoudi, M.; Moler, D.B.; Li, H.; Chen, B.; Reineke, T.M.; O’Keeffe, M.; Yaghi, O.M. Modular chemistry: Secondary building units as a basis for the design of highly porous and robust metal-organic carboxylate frameworks. Acc. Chem. Res. 2001, 34, 319–330. [Google Scholar] [CrossRef] [PubMed]
- Rosi, N.L.; Eckert, J.; Eddaoudi, M.; Vodak, D.T.; Kim, J.; O’Keeffe, M.; Yaghi, O.M. Hydrogen storage in microporous metal-organic frameworks. Science 2003, 300, 1127–1129. [Google Scholar] [CrossRef] [PubMed]
- Murray, L.J.; Dincă, M.; Long, J.R. Hydrogen storage in metal–organic frameworks. Chem. Soc. Rev. 2009, 38, 1294–1314. [Google Scholar] [CrossRef] [PubMed]
- Yang, S.; Callear, S.K.; Ramirez-Cuesta, A.J.; David, W.I.F.; Sun, J.; Blake, A.J.; Champness, N.R.; Schröder, M. Pore with gate: Modulating hydrogen storage in metal-organic framework materials via cation exchange. Faraday Discuss. 2011, 151, 19–36. [Google Scholar] [CrossRef] [PubMed]
- Suh, M.P.; Park, H.J.; Prasad, T.K.; Lim, D.-W. Hydrogen storage in metal-organic frameworks. Chem. Rev. 2012, 112, 782–835. [Google Scholar] [CrossRef] [PubMed]
- Deng, H.; Grunder, S.; Cordova, K.E.; Valente, C.; Furukawa, H.; Hmadeh, M.; Gándara, F.; Whalley, A.C.; Liu, Z.; Asahina, S.; et al. Large-Pore Apertures in a series of metal-organic frameworks. Science 2012, 336, 1018–1023. [Google Scholar] [CrossRef] [PubMed]
- Callear, S.K.; Ramirez-Cuesta, A.J.; David, W.I.F.; Millange, F.; Walton, R.I. High-resolution inelastic neutron scattering and neutron powder diffraction study of the adsorption of dihydrogen by the Cu(II) metal–organic framework material HKUST-1. Chem. Phys. 2013, 427, 9–17. [Google Scholar] [CrossRef]
- Liu, Y.; Brown, C.M.; Neumann, D.A.; Peterson, V.K.; Kepert, C.J. Inelastic neutron scattering of H2 adsorbed in HKUST-1. J. Alloys Compds. 2007, 446–447, 385–388. [Google Scholar] [CrossRef]
- Brown, C.M.; Liu, Y.; Yildirim, T.; Peterson, V.K.; Kepert, C.J. Hydrogen adsorption in HKUST-1: A combined inelastic neutron scattering and first-principles study. Nanotechnology 2009, 20, 204025. [Google Scholar] [CrossRef]
- Bordiga, S.; Regli, L.; Bonino, F.; Groppo, E.; Lamberti, C.; Xiao, B.; Wheatley, P.S.; Morris, R.E.; Zecchina, A. Adsorption properties of HKUST-1 toward hydrogen and other small molecules monitored by IR. Phys. Chem. Chem. Phys. 2007, 9, 2676–2685. [Google Scholar] [CrossRef]
- Dhakshinamoorthy, A.; Alvaro, M.; Horcajada, P.; Gibson, E.; Vishnuvarthan, M.; Vimont, A.; Grenèche, J.M.; Derre, C.; Daturi, M.; Garcia, H. Comparison of porous iron trimesates Basolite F300 and MIL-100(Fe) as heterogeneous catalysts for Lewis acid and oxidation reactions: Roles of structural defects and stability. ACS Catal. 2012, 2, 2060–2065. [Google Scholar] [CrossRef]
- Sciortino, L.; Alessi, A.; Messina, F.; Buscarino, G.; Gelardi, F.M. Structure of the FeBTC metal−organic framework: A model based on the local environment study. J. Phys. Chem. C 2015, 119, 7826–7830. [Google Scholar] [CrossRef]
- Horcajada, P.; Surblé, S.; Serre, C.; Hong, D.-H.; Seo, Y.-K.; Chang, J.-S.; Grenèche, J.-M.; Margiolaki, I.; Férey, G. Synthesis and catalytic properties of MIL-100(Fe), an iron(III) carboxylate with large pores. Chem. Commun. 2007. [Google Scholar] [CrossRef]
- Torres, N.; Galici, J.; Plasenci, Y.; Cano, A.; Echevarría, F.; Desdin-Garcia, L.F. Implications of structural differences between Cu-BTC and Fe-BTC on their hydrogen storage capacity. Colloids Surf. A 2018, 549, 138–146. [Google Scholar] [CrossRef]
- Mitchell, P.C.H.; Parker, S.F.; Ramirez-Cuesta, A.J.; Tomkinson, J. Vibrational Spectroscopy with Neutrons, with Applications in Chemistry, Biology, Materials Science and Catalysis; World Scientific: Singapore, 2005. [Google Scholar]
- Parker, S.F.; Lennon, D.; Albers, P.W. Vibrational spectroscopy with neutrons—A review of new directions. Appl. Spec. 2011, 65, 1325–1341. [Google Scholar] [CrossRef]
- Neilsen, M. Phonons in solid hydrogen and deuterium studied by inelastic coherent neutron scattering. Phys. Rev. B 1973, 7, 1626–1635. [Google Scholar] [CrossRef]
- Langel, W.; Price, D.L.; Simmons, R.O.; Sokol, P.E. Inelastic neutron scattering from liquid and solid hydrogen at high momentum transfer. Phys. Rev. B 1988, 38, 11275–11283. [Google Scholar] [CrossRef] [PubMed]
- Zoppi, M.; Colognesi, D.; Celli, M. Density dependence of mean kinetic energy in liquid and solid hydrogen at 19.3 K. Eur. Phys. J. B 2001, 23, 171–178. [Google Scholar] [CrossRef]
- Colognesi, D.; Celli, M.; Zoppi, M. Density of phonon states in solid parahydrogen from inelastic neutron scattering. J. Chem. Phys. 2004, 120, 5657–5663. [Google Scholar] [CrossRef] [PubMed]
- Parker, S.F.; Ewings, R.A.; Fernandez-Alonso, F.; Colognesi, D. Observation of the stretch mode in H2 and D2 by inelastic neutron scattering spectroscopy. J. Phys.: Conf. Ser. 2018, 1055, 012001. [Google Scholar] [CrossRef]
- Huber, H.; Herzberg, G. Constants of Diatomic Molecules; Van Nostrand Reinhold Company Inc.: New York, NY, USA, 1979. [Google Scholar]
- FitzGerald, S.A.; Allen, K.; Landerman, P.; Hopkins, J.; Matters, J.; Myers, R.; Rowsell, J.L.C. Quantum dynamics of adsorbed H2 in the microporous framework MOF-5 analyzed using diffuse reflectance infrared spectroscopy. Phys. Rev. B 2008, 77, 224301. [Google Scholar] [CrossRef]
- Kong, L.; Cooper, V.R.; Nijem, N.; Li, K.; Li, J.; Chabal, Y.J.; Langreth, D.C. Theoretical and experimental analysis of H2 binding in a prototypical metal-organic framework material. Phys. Rev. B 2009, 79, 081407(R). [Google Scholar] [CrossRef]
- Silverwood, I.P.; Hamilton, N.G.; McFarlane, A.; Ormerod, R.M.; Guidi, T.; Bones, J.; Dudman, M.P.; Goodway, C.M.; Kibble, M.; Parker, S.F.; et al. Experimental arrangements suitable for the acquisition of inelastic neutron scattering spectra of heterogeneous catalysts. Rev. Sci. Instrum. 2011, 82, 034101. [Google Scholar] [CrossRef] [PubMed]
- Warringham, R.; Bellaire, D.; Parker, S.F.; Taylor, J.; Ewings, R.A.; Goodway, C.M.; Kibble, M.; Wakefield, S.R.; Jura, M.; Dudman, M.P. Sample environment issues relevant to the acquisition of inelastic neutron scattering measurements of heterogeneous catalyst samples. J. Phys. Conf. Ser. 2014, 554, 012005. [Google Scholar] [CrossRef]
- Ewings, R.A.; Stewart, J.R.; Perring, T.G.; Bewley, R.I.; Le, M.D.; Raspino, D.; Pooley, D.E.; Škoro, G.; Waller, S.P.; Zacek, D.; et al. Upgrade to the MAPS neutron spectrometer. Rev. Sci. Instrum. 2019, 90, 035110. [Google Scholar] [CrossRef] [PubMed]
- ISIS Neutron and Muon Source. Available online: https://www.isis.stfc.ac.uk/Pages/home.aspx (accessed on 8 August 2020).
- Parker, S.F. Can we Use the H-H Stretch of Adsorbed Dihydrogen to Characterise Materials? STFC ISIS Neutron and Muon Source. 2018. Available online: https://doi.org/10.5286/ISIS.E.RB1810304 (accessed on 22 October 2020).
Sample Availability: Fe-BTC (BasoliteTM F300, produced by BASF), H2 and HD are widely available from commercial sources. |
Publisher’s Note: MDPI stays neutral with regard to jurisdictional claims in published maps and institutional affiliations. |
© 2020 by the author. Licensee MDPI, Basel, Switzerland. This article is an open access article distributed under the terms and conditions of the Creative Commons Attribution (CC BY) license (http://creativecommons.org/licenses/by/4.0/).