Article

Modeling the Mineralization Kinetics of Visible Led Graphene Oxide/Titania Photocatalytic Ozonation of an Urban Wastewater Containing Pharmaceutical Compounds

Department of Chemical Engineering and Physical Chemistry, University Institute of Research in Water, Climate Change and Sustainability (IACYS), University of Extremadura, 06006 Badajoz, Spain
*
Author to whom correspondence should be addressed.
Catalysts 2020, 10(11), 1256; https://doi.org/10.3390/catal10111256
Submission received: 2 October 2020 / Revised: 22 October 2020 / Accepted: 26 October 2020 / Published: 30 October 2020

Abstract

:
In a water ozonation process, dissolved organics undergo two reactions at least: direct ozone attack and oxidation with hydroxyl radicals generated from the ozone decomposition. In the particular case of urban wastewater contaminated with pharmaceuticals, competition between these two reactions can be studied through application of gas–liquid reaction kinetics. However, there is a lack in literature about kinetic modeling of ozone processes in water specially in photocatalytic ozonation. In this work, lumped reactions of ozone and hydroxyl radicals with total organic carbon have been proposed. Urban wastewater containing a mixture of eight pharmaceutical compounds has been used to establish the kinetic model that simulates the mineralization process. The kinetic model is based on a mechanism of free radical and molecular reactions and the knowledge of mass transfer, chemical reaction rate constants, and radiation transfer data. According to the model, both single ozonation and photocatalytic ozonation present two distinct reaction periods characterized by the absence and presence of dissolved ozone. In the first period (less than 10 min), pharmaceuticals mainly disappear by direct ozone reactions and TOC variation due to these compounds has been modeled according to gas–liquid reaction kinetics through a lumped ozone-pharmaceutical TOC fast second order reaction. The corresponding rate constant of this reaction was found to change with time from 3 × 10⁵ to 200 M−1 s−1 with Hatta values higher than 0.3. In the second period (nearly 5 h), competition between direct and hydroxyl radical reactions takes place and a kinetic model based on a direct and free radical reaction mechanism is proposed. Main influencing parameters to be known were: Direct ozone reaction rate constant, catalyst quantum yield, and hydroxyl radical scavengers. The first two take values of 0.5 M−1 s−1 and 5 × 10⁻⁴ mol·photon−1, respectively, while a fraction of TOC between 10% and 90% that changes with time was found to possess hydroxyl radical scavenger nature.

Graphical Abstract

1. Introduction

Present municipal wastewater treatment plants (MWWTP) were designed to solve the contamination of urban wastewaters so their release to natural aquatic media would be safe from the health and environmental point of views. However, some decades ago, the discovery of many pharmaceutical and personal care products in treated wastewater at the outlet of MWWTP indicated the incapability of these plants to retain or remove these contaminants [1,2,3]. The presence of these compounds represents an environmental challenge due to their potential toxicity and endocrine-disrupting character [4,5,6]. Previous facts awakened the interest of researchers to look for advanced processes that could solve the problem. Contrarily to systems only based on contaminant transfer to another medium (such as adsorption and membranes), advanced oxidation processes where hydroxyl free radicals are the main oxidizing species, are technologies able to eliminate chemical contaminants [7,8,9,10]. Because of its high reactivity and capacity to decompose in hydroxyl radicals (especially when combined with other agents) ozone is being used and studied in processes catalogued as advanced ozonation processes (AOzP) [11,12,13]. The first AOzP was mentioned in the work of Glaze et al. in 1987 [14] dealing with the combinations of ozone and UVC radiation or hydrogen peroxide. Nowadays, the combination between ozone, UVA, or visible radiation and catalysts (also called photocatalytic ozonation) PhCatOz, is gaining increasing interest due to the different ways of hydroxyl radical formation [15,16,17]. PhCatOz has already been the subject of reviews and its importance can be deduced from the number of publications in the last 10 years (more than 200 according to Scopus data base). Both catalyst nature and radiation source are presently investigated to lead to a more environmentally friendly process [18]. Regarding catalyst nature, TiO2, so far the most used photocatalyst, is being combined or doped with other metal oxides or other non-metal (N,S) atoms to improve its visible light absorption avoiding the use of UV lamps [19,20,21]. Graphene discovered in 2004—a 2D material with significant optical, conductivity, and electronic properties, among others [22]—is also investigated. TiO2 doping with graphene oxide, confers it the possibility of reducing the band gap and, hence, the increase of visible light absorption [23]. Additionally, some works have already been published on the use of UVA or visible light emitting diodes (visLED) to substitute artificial UV lamps [24,25]. Also, the combination of ozone, UVA /visLED or solar light and a graphene oxide/titania catalyst (GO/TiO2) has recently been the subject of some works to eliminate some contaminants—such as oxalic acid, bisphenol, cefixime, primidone, etc. [24,26,27,28,29]—and a mixture of pharmaceuticals in an urban wastewater [30]. In PhCatOz works, main objectives studied are focused on the influence of variables, ozone consumption, stability of catalysts or the use of solar radiation [16]. However, few works deal with studies on the kinetics of the process. In many cases, the kinetics are oversimplified just determining pseudo first order rate constants [23,31,32,33,34]. Other investigations are limited to find out through which mechanism the oxidation occurs, different scavengers that react with reactive oxygen species (ROS)—such as hydroxyl radicals, singlet oxygen, positive holes in the valence band, etc.—are therefore applied [27,35]. In few works, the kinetic study is based on a mechanism of reactions. For instance, Beltrán et al. reported the study of diclofenac photocatalytic ozonation, with UVA lamps and TiO2. These authors considered TOC as lumped reactant representing the organic content of water prone to the attack of ozone and/or hydroxyl radicals [36]. More recently Figueredo et al. presented a kinetic model applied to primidone ozonation processes in the presence of UVA LEDs [37]. Regarding ozone free photocatalytic oxidation, Tolosana-Moranchela has reported a mechanism of reactions to deduce the kinetic model for dichloroacetic acid [38]. However, as far as the authors knowledge, no study on the PhCatOz kinetic modeling of an urban wastewater containing a mixture of pharmaceutical compounds has been undertaken. This lack of kinetic studies also refers to the application of optical catalyst properties, especially when dealing with visible light from LEDs and GO/TiO2 catalysts. Another important point highlighting the novelty of the present work is the absence of kinetic modeling of ozone fast reactions in water that normally occurring between ozone and many pharmaceuticals [39]. These studies need the inclusion of dimensionless numbers of Hatta, reaction factor and instantaneous reaction factor [40]. All these parameters are applied in the first reaction part of this work.
In a previous work [30], a mixture of eight pharmaceuticals: acetaminophen, antipyrine, sulfamethoxazole, diclofenac, caffeine, ketorolac, metoprolol, and hydrochlorothiazide spiked in a secondary effluent of a municipal wastewater treatment plant, SEMWWTP, at about 10 mg L−1 each, was treated with ozone and GO/TiO2 visLED photocatalytic ozonation and their results expressed as variation of individual compound concentration and TOC with time. This work [30] claimed that the kinetics differ depending on reaction time. Accordingly, the ozone process was divided into two reaction periods. In the first one of less than 10 min, negligible total TOC removal pharmaceuticals concentration were reduced just under the detection limit of the analytical equipment used. For this reaction period, ozone fast direct reactions were proposed as the responsible way in pharmaceutical abatement. During the second reaction period (next 3 h), hydroxyl radicals were proposed as the oxidation pathway. It remained unanswered, however, the study of the kinetic model of these two reaction periods which is the novelty of this work.
Therefore, the main objective of this work is the study of the kinetic modeling of ozonation and photocatalytic ozonation, carried put in the presence of visLED and GO/TiO2 catalyst. The aqueous matrix was the SEMWWTP doped with the previously named pharmaceuticals. The study was based on gas–liquid reaction kinetic concepts, to distinguish between ozone fast or slow direct and hydroxyl free radical reactions. Also, when both reactions types compete, a mechanism is proposed to derive a kinetic model that predict actual TOC and ozone and hydrogen peroxide concentrations. TOC calculated results are always compared to the experimental ones obtained at the same conditions in a previous work [30]. Also, a second objective was studying the influence of some parameters such as the direct rate constant of a lumped ozone–TOC reaction, the fraction of hydroxyl radical scavengers due to intermediates and catalyst quantum yield.

2. Results and Discussion

In this work, the kinetics of ozonation and photocatalytic ozonation of a pharmaceutical doped SEMWW (main characteristics were given in a previous work [30]) was divided in two reaction periods of fast and slow ozone reactions, according to kinetic regimes of gas–liquid reactions [41]. Both periods are also characterized by the absence and presence of dissolved ozone.

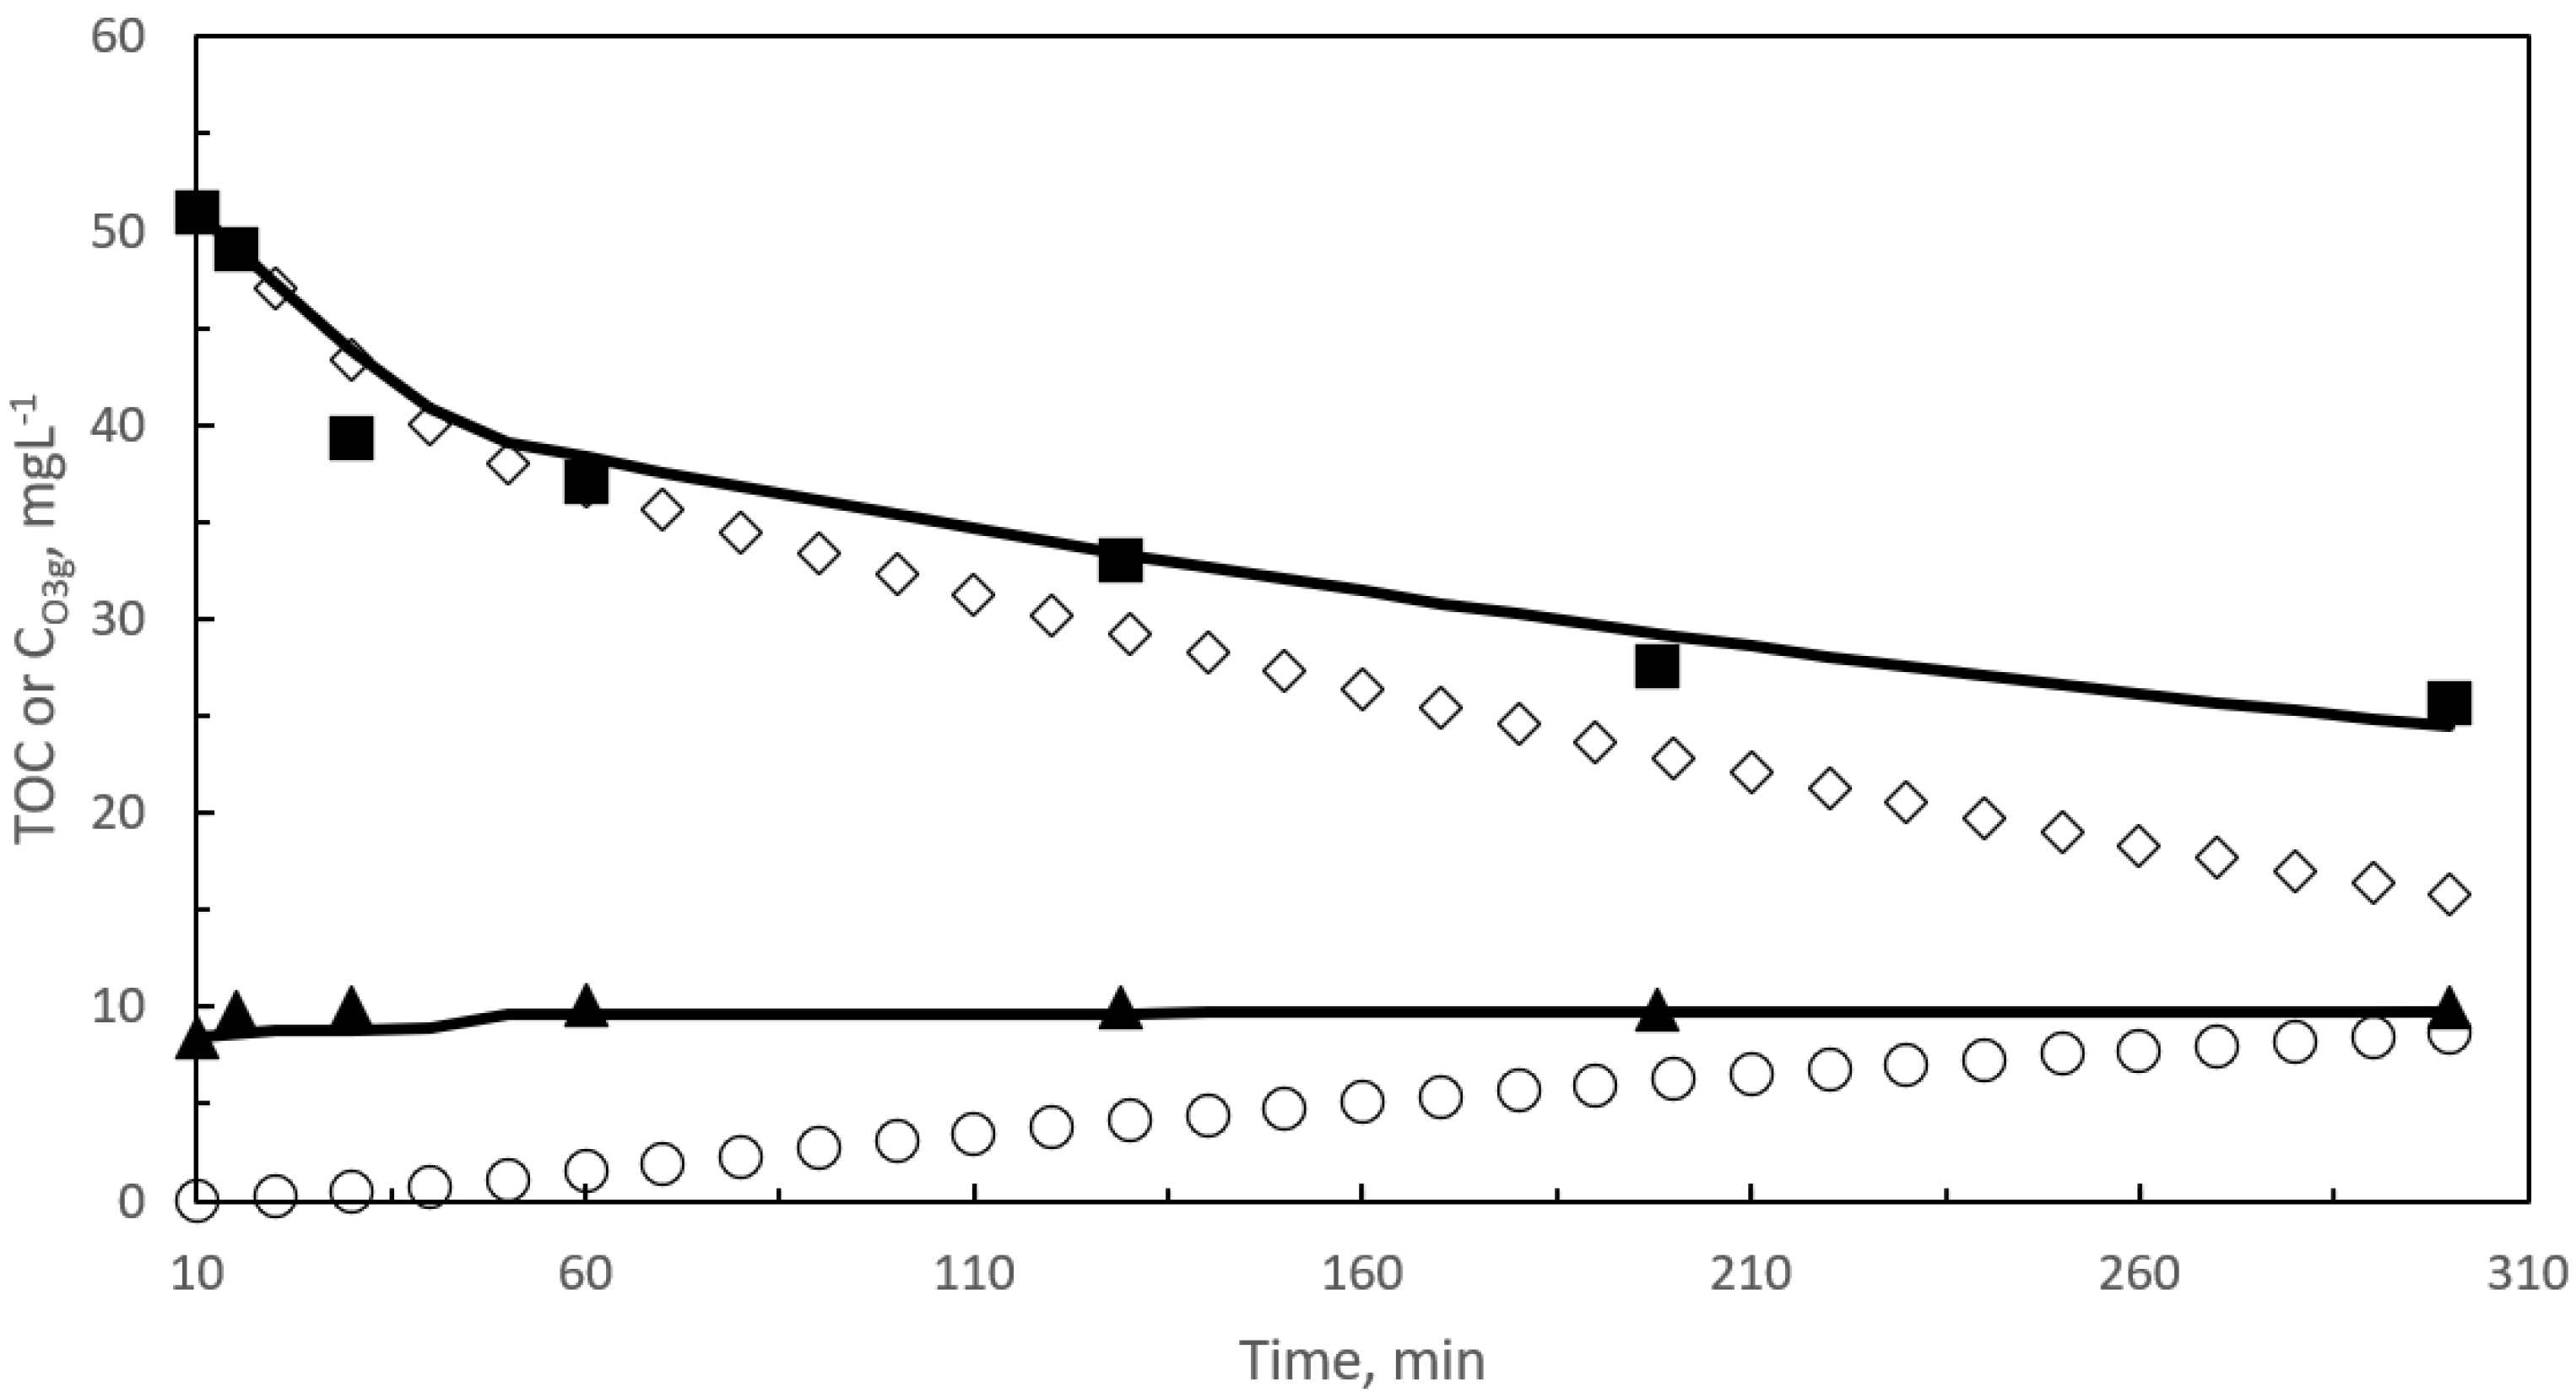
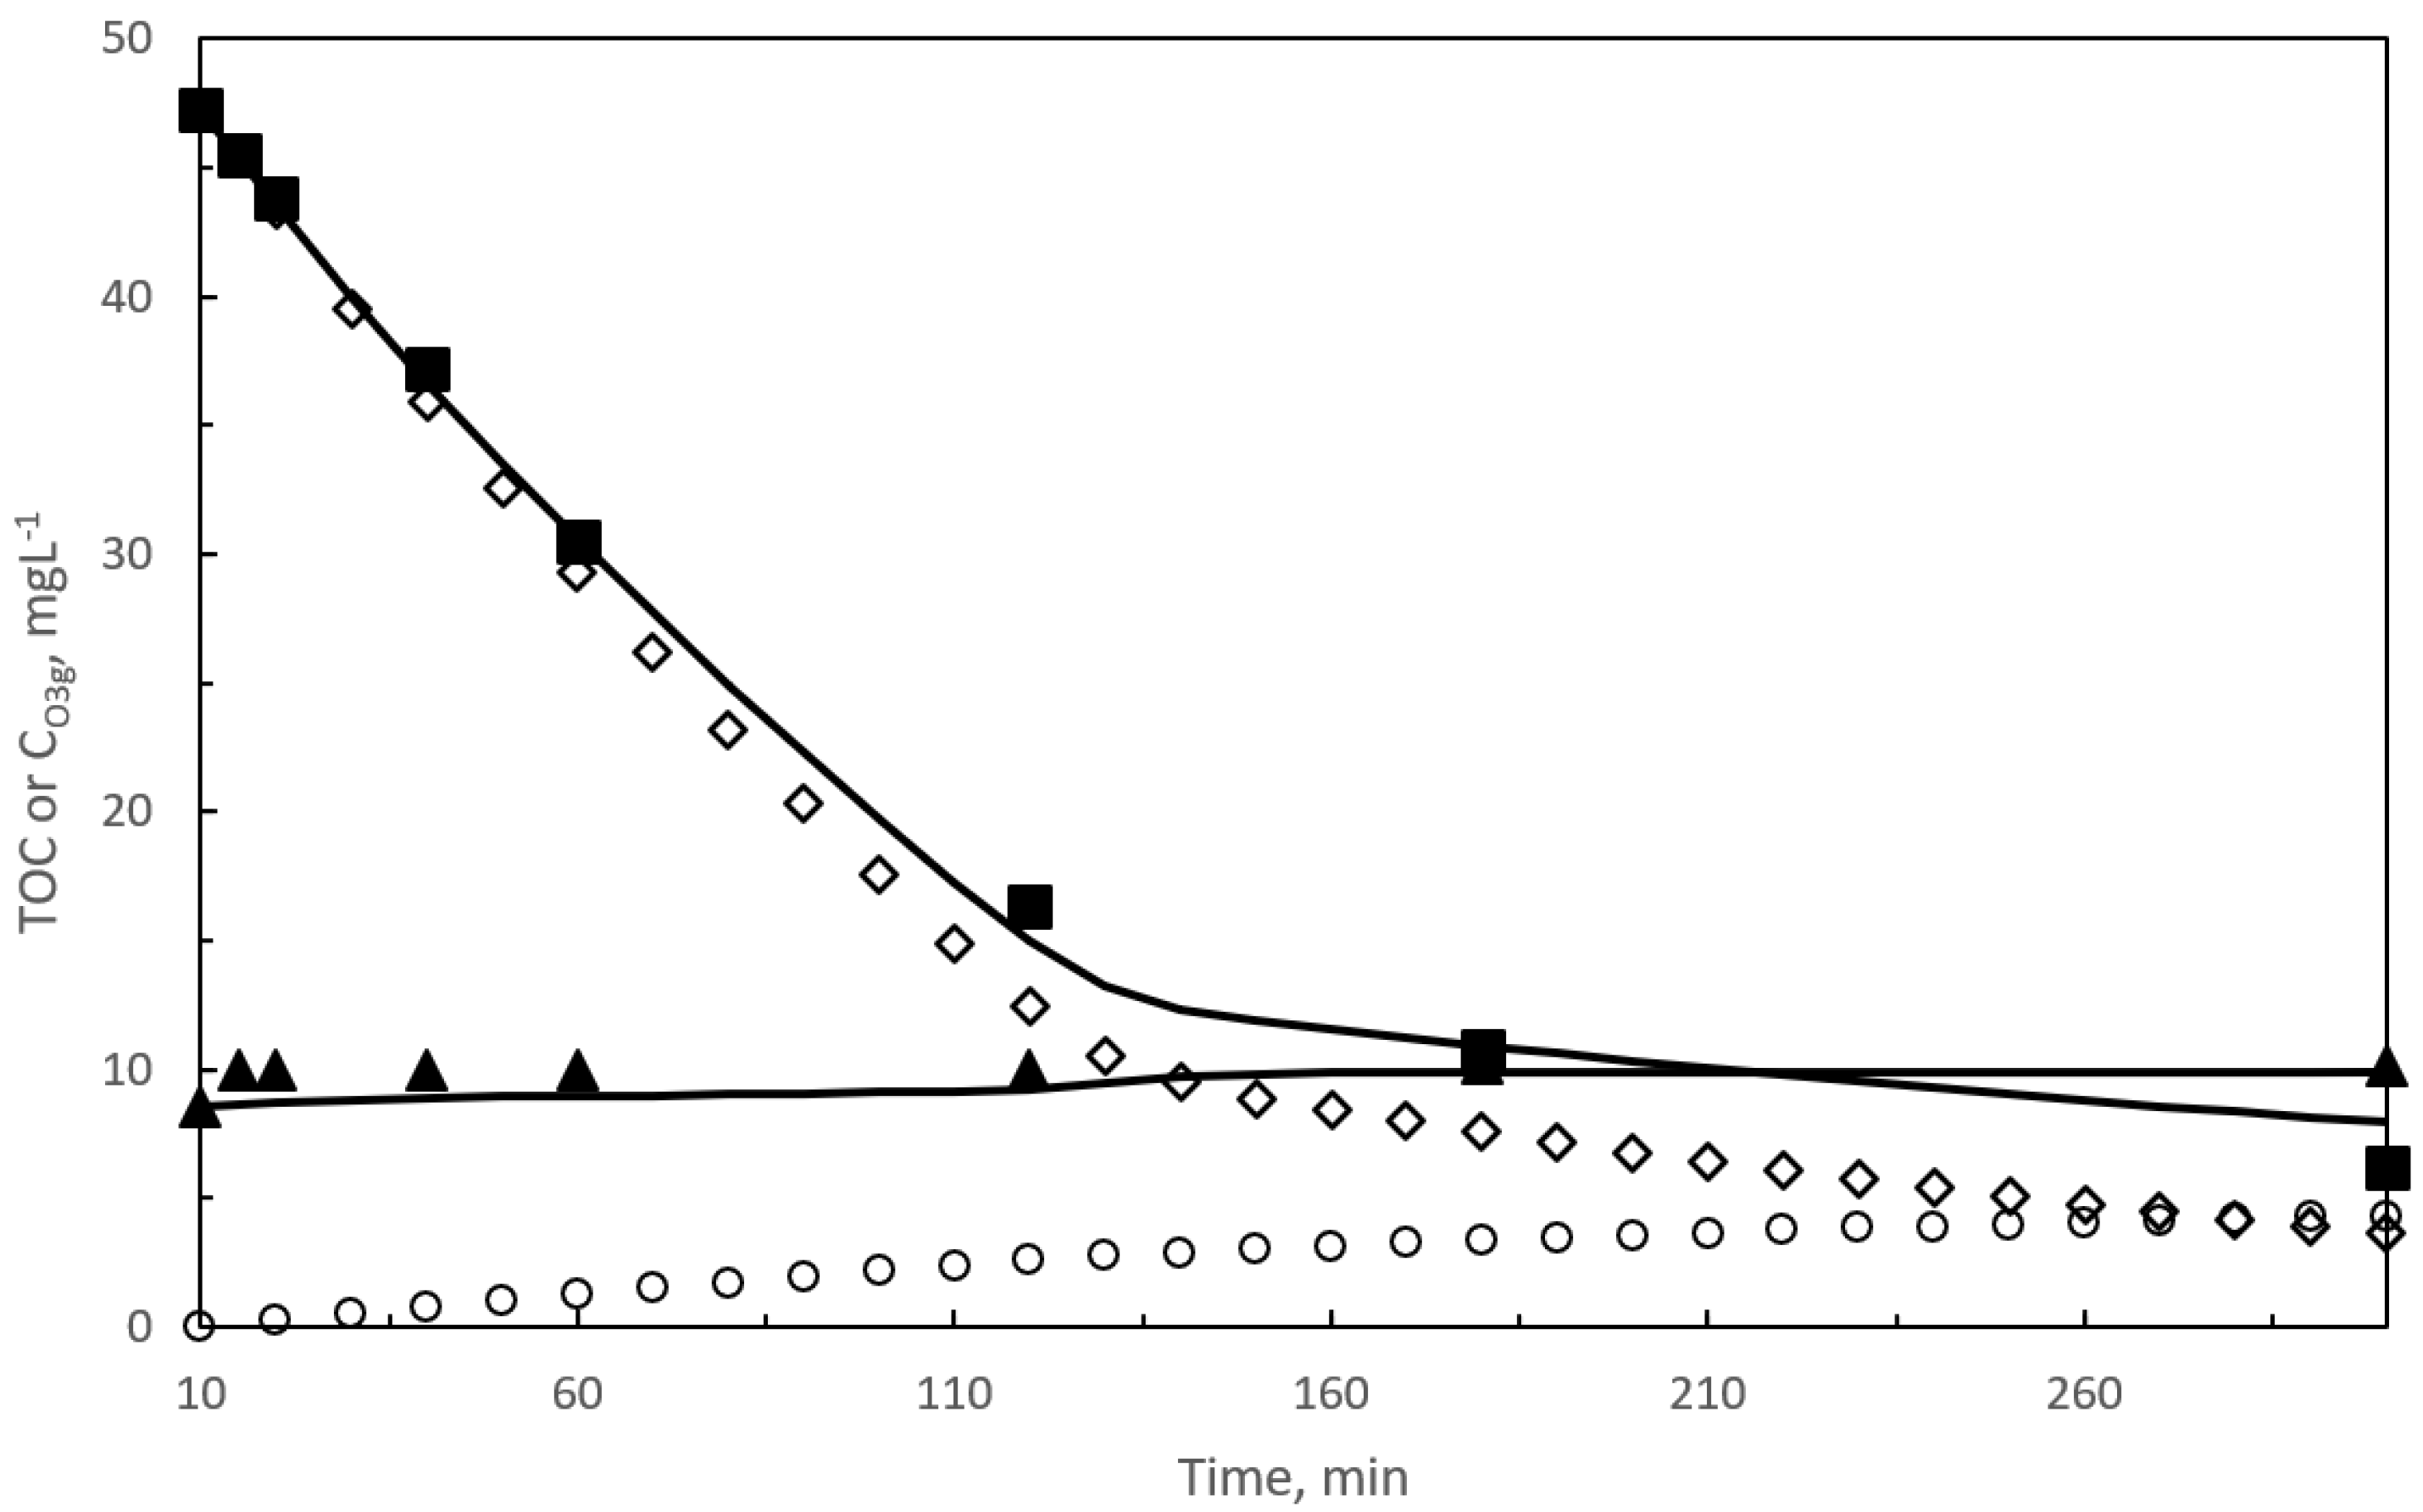
2.1. First Reaction Period

Initially wastewater had a TOC value of 56.5 mg L−1 from which 46.5 mg L−1 were due to doped pharmaceuticals. The first reaction period where no dissolved ozone was found, corresponds to the first 12 min of reaction. Figure 1 and Figure 2 show the time evolution of TOC from remaining pharmaceuticals and ozone gas concentration at the reactor outlet during the first 12 min of ozonation and photocatalytic ozonation, respectively. During this period, no dissolved ozone was detected while pharmaceutical concentrations could be quantitatively measured. In the first 12 min, total TOC removal was less than 10%. However, TOC removal due to pharmaceuticals was nearly complete. Also, concentration of ozone in the gas reaches a stationary value of about 10 mg L−1. Other important results are related to the concentrations of dissolved ozone and hydrogen peroxide. The first one establishes the frontier of the fast period and started to be detected after the first 9 and 7 min of single ozonation and photocatalytic ozonation, respectively (see Section 2.1.1). Concentration of hydrogen peroxide at these reaction times was 1.02 and 0.95 mg L−1 for ozonation and photocatalytic ozonation, respectively.
According to the film theory concept, the absence of dissolved ozone during the first reaction period means that ozone was, completely depleted in the proximity of the gas-water interphase or in the liquid film [41]. At these conditions, it can be admitted that pharmaceuticals removal was due to direct ozone reactions, subsequently, participation of hydroxyl radicals is considered negligible [30]. To sustain the last hypothesis, it can be argued that in this short initial reaction period TOC disappearance was negligible, that is, initial compounds were transformed into intermediates, likely, of similar reactivity. Values of the Hatta number (Ha) [41] of the ozone-pharmaceuticals direct reactions were always higher than 1. Hatta values above 1 confirmed that these reactions developed in the fast-kinetic regime of ozone chemical absorption [40]. With this in mind, there is increased interest in deepening the kinetics of pharmaceutical ozonations. This study would require the application of simultaneous reaction–diffusion mass balance equations through the liquid film applied to the eight pharmaceuticals and corresponding intermediates. The previous study makes the kinetics implementation very complicated and difficult to solve. Instead, the mineralization kinetics of the pharmaceuticals by following their corresponding TOC with time has been studied, (see Figure 1 and Figure 2).
As inferred from Figure 1 and Figure 2, TOC removal rates in both ozone based processes are similar though slightly higher in the photocatalytic ozonation process. The similar TOC conversion values (due to pharmaceuticals) with time in both ozone processes is another proof of the presence of direct ozone reactions as main responsible of pharmaceutical removal. In fact, ozone gas concentrations at the reactor outlet were also similar which means that ozone consumption was similar as well. Dissolved ozone appeared after the first 8 and 7 min during ozonation and photocatalytic ozonation, respectively. Measured concentration of hydrogen peroxide is likely due to the ozone reactions after breaking some aromatic rings or unsaturated double carbon bonds present in the parent compounds or first intermediates [42,43]. As it will be shown in Section 2.2, hydrogen peroxide plays an important role in the kinetic study of the second reaction period.

2.1.1. Kinetic Modeling of Pharmaceuticals Oxidation in a SEMWW Due to Direct Ozone Reactions

The kinetic model of the first reaction period is based on the development of a lumped fast second order irreversible reaction between TOC associated to remaining pharmaceuticals and ozone
TOC + zO 3 °   k D   ° Products
Taking into account the high agitation speed applied (700 rpm) and the fine bubbles of ozone–oxygen mixture supplied, the slurry reactor used in this work behaves as a semibatch perfectly mixed reactor (see Section 3). Under these circumstances, the kinetic model relies on the following form of the mass balance equations of TOC in water and ozone in the gas phase [40]
dTOC dt = 1 z N O 3
( 1 β ) V dC O 3 g dt = m O 3 e v g C O 3 g N O 3 β V
where NO3 is the ozone chemical absorption rate, that is, the kinetics of the gas–liquid reaction (1), CO3g the concentration of gas ozone at the reactor outlet, β the liquid hold-up, V the reaction volume, mO3e the inlet ozone molar rate, and vg the volumetric gas flow rate (values of these parameters and other necessary to solve the kinetic model are given in the Supplementary Section). In the case of fast gas–liquid reactions, the ozone chemical absorption rate can be expressed as a function of the reaction factor, F, and the volumetric mass transfer coefficient, kLa, as [41]
N O 3 = k L a C O 3 g RT He F
where the fractional term in the right side represents the concentration of ozone at the water interphase—that is, the ozone solubility—and T, R, and He are the temperature and perfect gas and Henry constants, respectively. For reactors similar to the one used, the accumulation rate term of ozone in the gas inside the reactor can be considered negligible that means Equation (3) could be simplified [44]. Hence, also considering Equation (4), an explicit equation for the concentration of ozone in the gas is obtained after this simplification
C O 3 g = m O 3 e v g + k L a RT He F β V
The reaction factor, F, in Equations (4) and (5), can be obtained from Equation (6) (see also Equation (S1) to determine F from experimental results) which corresponds to a fast kinetic regime of ozone absorption for an irreversible second order reaction (as in reaction (1)) [40,41]
F = Ha F I F F I 1 tah ( Ha F I F F I 1 )
where FI is the instantaneous reaction factor that, in this case, can be defined as
F i = 1 + zD TOC TOC D O 3 C O 3 g RT He
with DTOC and DO3 stand for the diffusivities of TOC and ozone in water, respectively. In Equation (6), the Hatta number, Ha, contains the rate constant, kD, of reaction (1), and is defined as
Ha = k D D O 3 TOC k L
where kL is the liquid phase mass transfer coefficient (see Supplementary Section for parameter values). Because of the different fast reactivity with ozone of remaining pharmaceuticals and intermediates [30], kD will change with time. Accordingly, a relationship between the rate constant of reaction (1) and time is needed to solve Equations (2) and (5). The procedure to relate kD and t, during this initial period is shown in the Supplementary Section. Equations (S2) and (S3) show the exponential functions of kD with time obtained for single and photocatalytic ozonations, respectively.
Additionally, a mean value of the stoichiometric ratio, z, for this period was deduced just by determining the ratio between the moles of ozone absorbed and consumed per mol of TOC consumed, that resulted to be 0.264 and 0.213 for single ozonation and photocatalytic ozonation, respectively. The similar values of z for both ozone-based processes also confirm the direct reactions of ozone (reaction (1)) as the principal way of oxidation.
Starting with Equations (S2) and (S3), calculated values of Ha, F, and FI could be obtained from Equations (8), (6), and (7), respectively, at intervals of 10 s. With these values, Equation (2), and hence Equation (5), could be numerically solved to yield the concentrations of ozone in the gas and TOC during the first reaction period. This solution required the ozone gas concentration, CO3g, the reaction factor, F, and TOC to be known at the start of the ozonation period. While the starting TOC (at t = 0) was known, CO3g and F are not available. As a consequence, the solution of the kinetic model was initiated at t = 1 min, where the first value of CO3g was experimentally determined, and hence F could also be calculated.
From Figure 1 and Figure 2, a great concordance between calculated and experimental concentrations for both TOC and CO3g can be seen. Also, no significant differences between ozonation and photocatalytic ozonation results were experienced. The latter facts confirm, on one hand, the use of gas–liquid reaction kinetics to validate the kinetic model of the first reaction period and, on the other hand, the direct ozone reactions (represented by lumped reaction (1)) as responsible for pharmaceutical disappearance.

2.2. Second Reaction Period

When dissolved ozone is detected, pharmaceutical concentrations are so low that the corresponding Hatta number of their individual ozone direct reactions is lower than 1, as a consequence, the kinetic regimes move to slow [30]. This happens at about 9 and 8 min of reaction in single ozonation and photocatalytic ozonation, respectively. For simulation purposes, a reaction time of 10 min has been considered as the start of the second reaction period in both ozone processes. This reaction time was extended to 300 min (see later Figure 3, Figure 4 and Figure 5 and Figure S1, for single ozonation, and Figure 6 to Figure 7 and Figure S2, for photocatalytic ozonation, to show the time changes in total TOC, concentrations of ozone in the gas leaving the reactor and dissolved in water and hydrogen peroxide). During this reaction period, TOC removal rates are faster during photocatalytic ozonation where about 90% TOC elimination is observed after 300 min compared to 50% in single ozonation [30]. These results suggest the importance of hydroxyl free radical oxidation in this reaction period. Concentration of ozone in the gas leaving the reactor remains practically constant with a value slightly higher than that achieved at the end of the first reaction period, regardless of the ozonation type. From Figures S1 and S2, it is seen that concentration of dissolved ozone, as expected, increases with time reaching similar steady state values in both ozone-based processes (at 300 min reaction) (about 1.7 mg L−1). This could be due to the absence of ozone reacting compounds after 5 h reaction. Finally, hydrogen peroxide concentrations follow the trends already observed in previous works [45,46]: there is a short time where the concentration is practically constant or slightly increases (single ozonation) o decreases (photocatalytic ozonation) and finally decreases with time in both ozone processes to disappear in the case of photocatalytic ozonation.

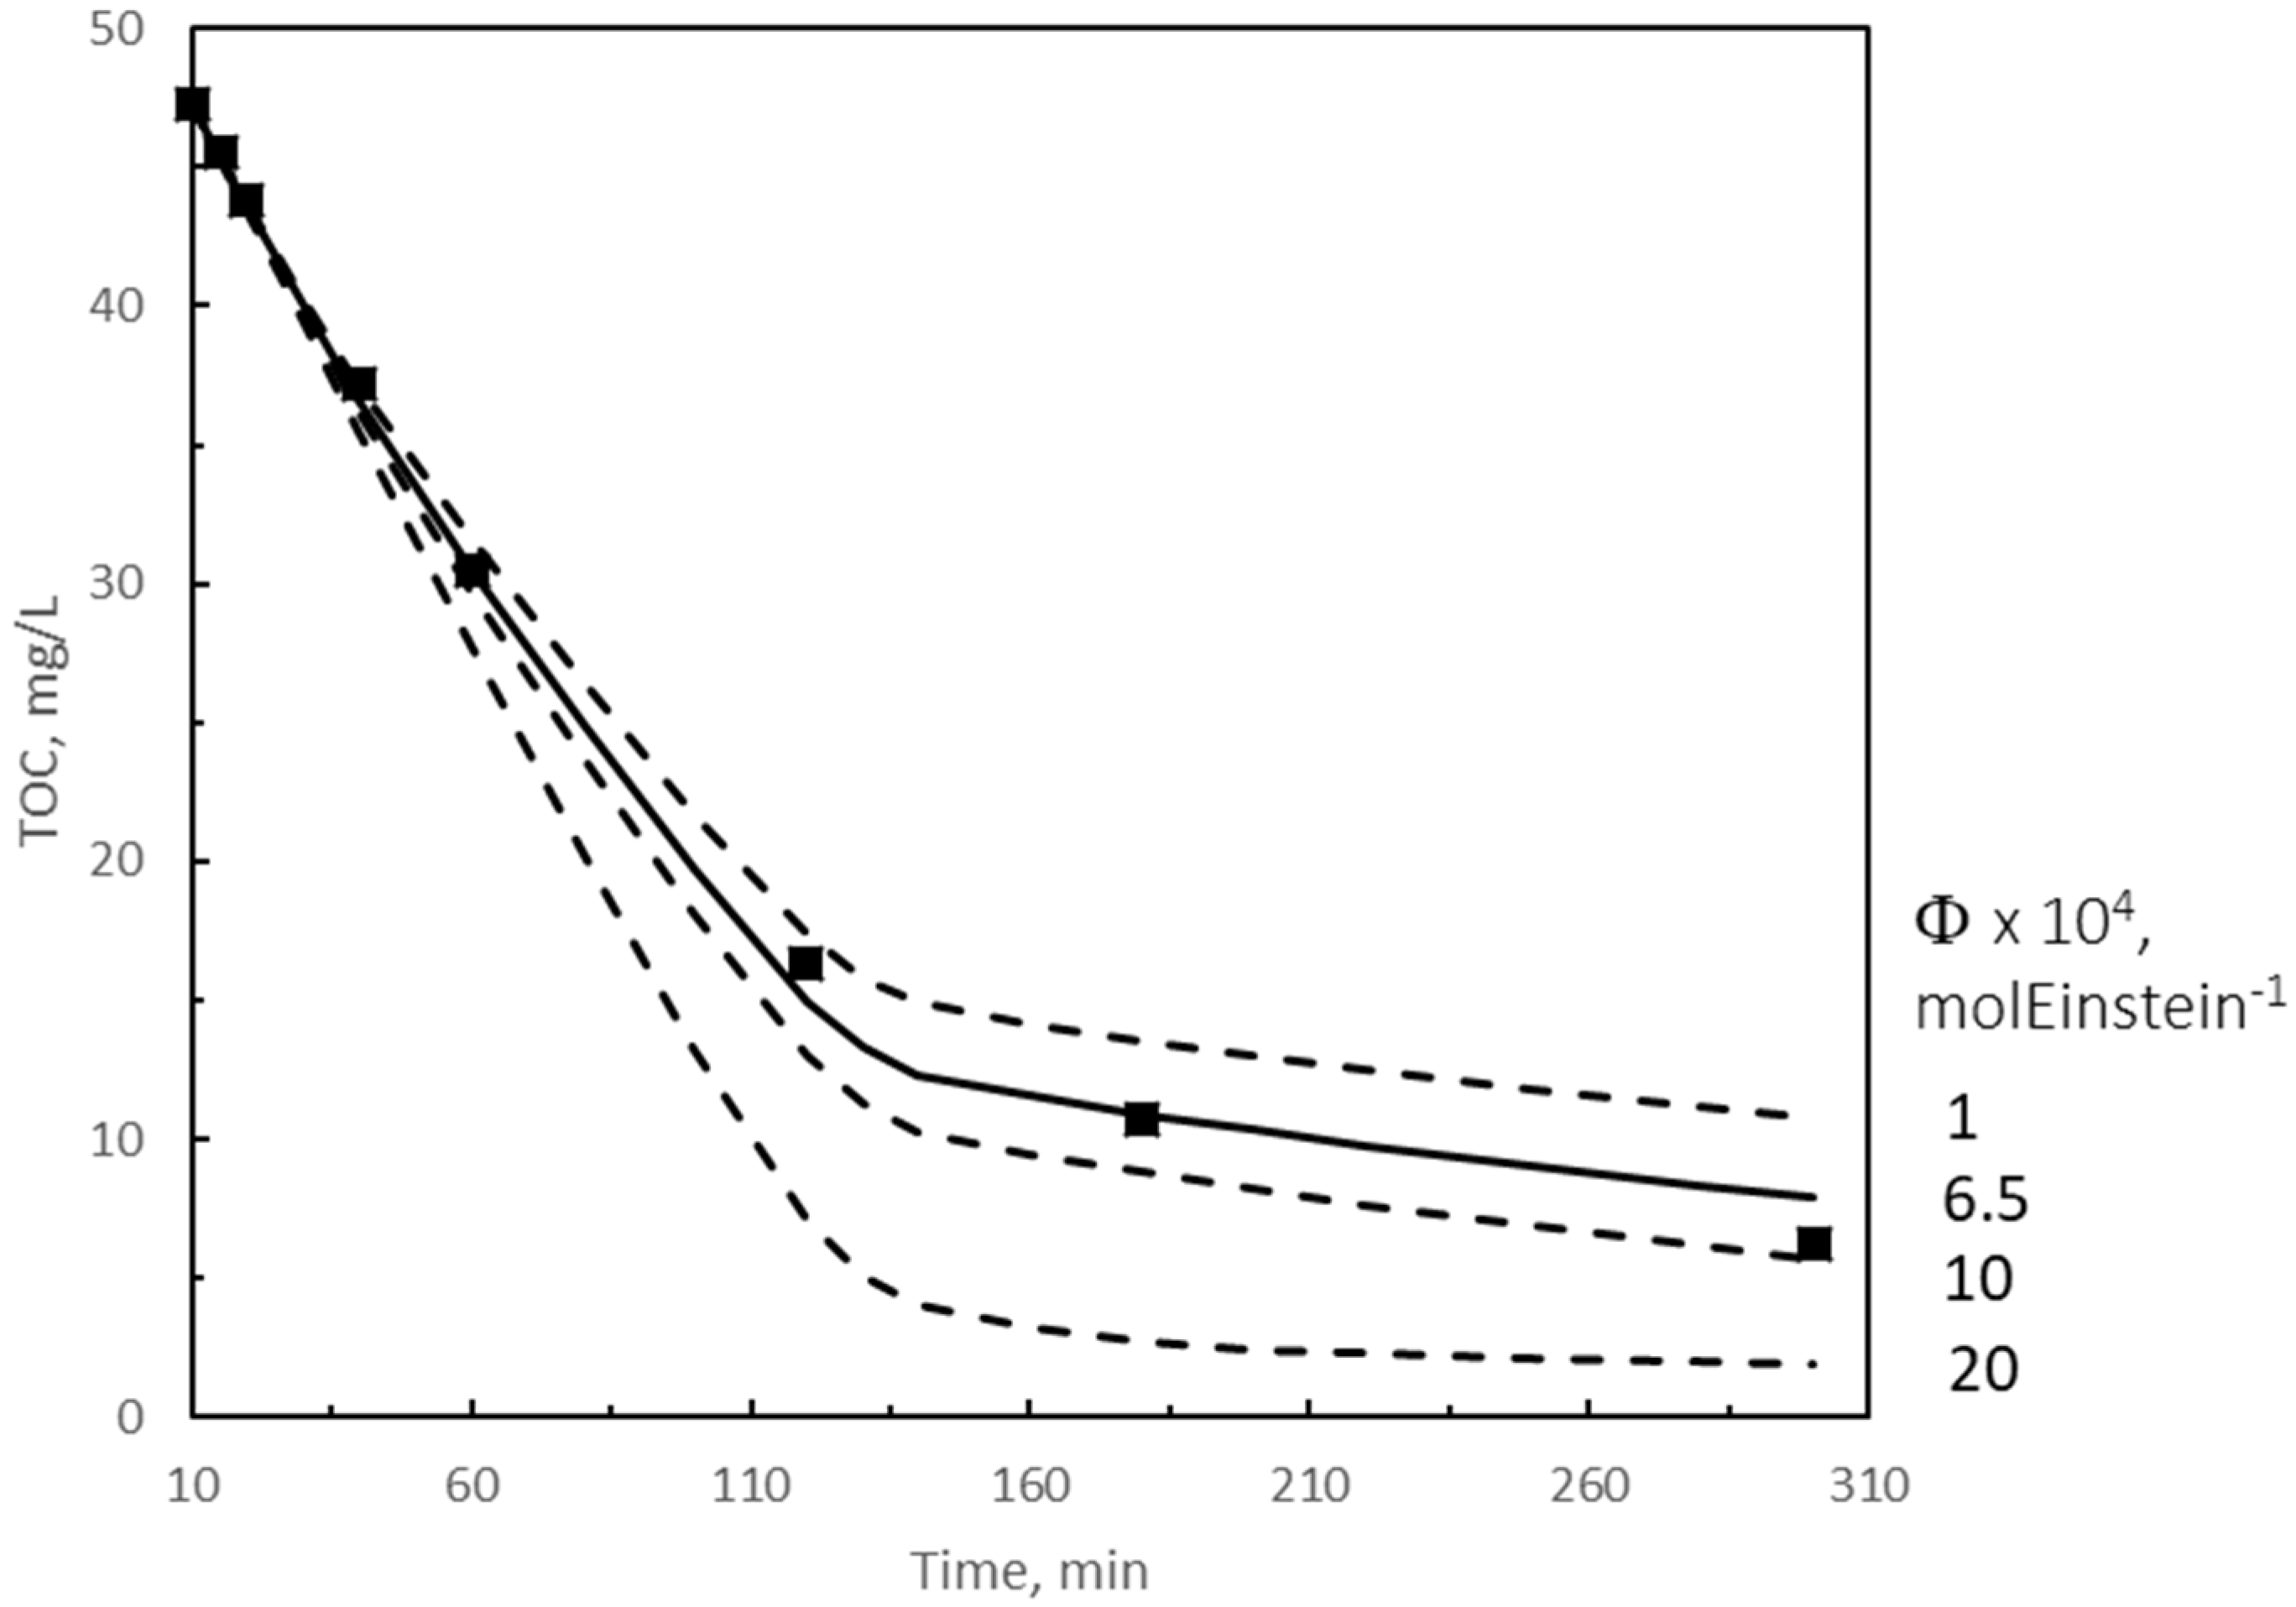
2.2.1. Kinetic Modeling of TOC Removal during the Second Reaction Period with Slow Gas–Liquid Reactions

In the second reaction period, the reaction factor was even lower than 1 confirming the slow kinetic regime of ozone absorption [41]. Under these conditions it is highly probable that both direct and free radical reactions compete for the abatement of organics (both remaining pharmaceuticals and intermediates) [39,47]. Under the slow kinetic regime, the kinetic model is constituted by macroscopic mass balance equations of species present in water: TOC (that now represents all the organics), ozone in the gas and water phases, hydrogen peroxide, and short lived reactive species: free radicals. For the semibatch perfectly mixed photoreactor of this work, the general mass balance equation for any of these species except those of ozone in the gas and water phases is
dC i dt = R i
where Ri is the reaction rate of species i due to all chemical and photochemical reactions in which participates. Mass balance of ozone in the gas phase can also be expressed by Equation (3) but now the ozone absorption rate is given by Equation (10)
N O 3 = k L a ( C O 3 g RT He C O 3 )
where CO3 is the concentration of dissolved ozone. The mass balance equation of ozone in the water phase is
dC O 3 dt = N O 3 R O 3
The mass balance of ozone in the gas phase (Equation (3)) must be added to Equations (9) and (11) to complete the kinetic model system of differential equations. Also, by assuming negligible the accumulated rate of ozone gas concentration, as in Equation (5) for fast reactions, the ozone gas concentration can be explicitly obtained. This is given by Equation (12)
C O 3 g = m O 3 e + k L aC O 3 β V v g + k L a RT He β V
In this kinetic model, given the long period of reaction studied (nearly 5 h) and the fact that reactivity of organics in water changes with time, TOC was assumed to be the sum of two contributions: TOC1 due to remaining pharmaceuticals and first intermediates, and TOC2 representing the secondary intermediates and end products with only TOC1 directly reacting with ozone. In order to deduce the rate equations (Ri) for any species present in water the mechanism, based on literature [48,49,50,51,52], shown in the Supplementary Materials (see reactions (S4) to (S28)) was proposed. From this mechanism, rate equations, Ri, for any species can be obtained. These equations for the main molecular species are
For TOC1:
R TOC 1 = ( k D 1 C O 3 + k HO 1 C HO ) TOC 1
For TOC2:
R TOC 2 = ( k D 1 C O 3 + k HO 1 C HO ) TOC 1 k HO 2 C HO TOC 2
For hydrogen peroxide:
R H 2 O 2 T = k D 1 C O 3 TOC 1 k i 1 C O 3 C HO 2 k i 5 C e C H 2 O 2 T k H C HO C H 2 O 2 T
where CHO2- and CH2O2T are the concentrations of the ionic form of hydrogen peroxide and its total concentration (i.e., the sum of the concentrations of the ionic and non-ionic forms). Then, according to the hydrogen peroxide pK and pH of wastewater, CHO2- is defined as
C HO 2 = 10 pH pK 1 + 10 pH pK C H 2 O 2 T
Also, kH represents the total reaction rate constant of hydroxyl radicals with both forms of hydrogen peroxide that can be defined from rates of Reactions (S22) and (S23), pH and pK of Equilibrium (S15) as shown in Equation (17) [40,51]
k H = k H 1 + k H 2 10 pH pK 1 + 10 pH pK
For dissolved ozone
R O 3 = ( k D 1 TOC 1 + k 1 10 pH 14 + k i 1 C HO 2 + k i 4 C e + k 4 C O 2 + k 7 C HO ) C O 3
Rate equations of free radicals and charge carriers are given in the Supplementary Materials (see Equations (S29) to (S34)) as well as other nomenclature of constants and concentrations in Equations (13)–(18).
After substitution of Ri for the case of these short live species in Equation (9), applying the stationary steady state (dCi/dt = 0), and combining the resulting equations, the concentration of free radicals (HO and O2) and electron charge carriers (Ce-), present in Equations (13)–(15) and (18), can be expressed as a function of concentration of molecular species (see Equations (S35) to (S37) in the Supplementary Materials).

● Mean Rate of Photon Absorption

Another important point in the case of photocatalytic ozonation is the rate of charge carrier formation, that is, the effective mean photon amount that the catalyst absorbs to yield charge carriers, which is defined as
r Vis = Φ cat r Photon
where ϕcat is the catalyst quantum yield and rphoton the mean rate of absorbed photons which depends on the radiation transfer equation [53]. An approximation of this equation has been solved by some models such as the six flux model that takes into account the absorption and dispersion coefficients of the catalyst and considers that photon dispersion goes through the six directions of the three coordinate axis [34,54]. In this paper, an approximate value of rphoton given by the Lambert–Beer law, rLB, was first calculated [55]. The equation only considers the light absorption of the catalyst and dispersion is excluded
r LB = Φ cat I 0 L [ 1 exp ( 2.303 L κ C cat ) ]
where Io, L, k, and Ccat are the incident radiation at the reactor wall (1.09 × 10⁻⁷ Einstein·cm−2 s−1, calculated by actinometry, see Section 3), the light path through the reactor (the reactor internal diameter in this case, see Section 3), the catalyst absorption coefficient at 425 nm and the concentration of catalyst (4 × 10⁻⁴ g cm−3), respectively. For the catalyst absorption coefficient, a value of 7900 cm2 g−1 was taken following the work of Tolosana-Moranchela et al. [56] who studied the absorption properties of a similar GO/TiO2 catalyst. The value of rLB was finally 1.76 × 10⁻⁸ Einstein cm−3 s−1. Also, from this work [56], the catalyst dispersion coefficient, σ, at 425 nm, was taken as 20,000 cm2 g−1. Hence the albedo, ω, defined as the ratio between the dispersion coefficient and the sum of dispersion and absorption coefficients of catalyst resulted to be 0.72 in the studied system. Additionally, Li Puma and Brucato [57] reported constant ratios, γ, between the mean absorption rate of photons for a TiO2 catalyst given by the six flux and Lambert–Beer models at different albedo when the optical density thickness was higher than 10 as occurring in this work. Then, it was finally assumed that the catalyst effective mean photon absorption rate could be calculated as
r Vis = Φ cat r SFM = Φ cat γ r LB
where rSFM is the mean absorption rate of the catalyst given by the six flux model. From Li Puma and Brucato’s work [57], a value of 0.625 can be taken for γ with an albedo of 0.72. Then, by substituting rLB and γ values in Equation (21), rVis was finally 1.1 × 10⁻⁵ ϕcat mol L−1 s−1. The catalyst quantum yield (mol Einstein−1) is one of the parameters to determine from the kinetic model of photocatalytic ozonation.

● Solution of the Kinetic Model

The kinetic model formed by Equations (9) to (12), taking into account equations deduced for short live species (see corresponding Ri equations in Supplementary Part) was numerically solved [58] with the initial conditions known at 10 min reaction for concentrations of TOC1, TOC2, dissolved and gaseous ozone, and hydrogen peroxide (see starting values in the Supplementary Section).
In this system, however, there are two unknows for single ozonation: kD and α, the fraction of TOC1 that scavenges hydroxyl radicals, and three unknowns for the photocatalytic system: kD, α, and ϕ the quantum yield of the catalyst. These unknows are also the parameters studied.
Solution of the kinetic model for the ozonation system was first tried by assuming no contribution of the direct rate constant (kD = 0) and scavenger effect of TOC1 (α = 0). In this situation, however, no suitable solution could be found. By only assuming a value of α different from zero, again no satisfactory solution was encountered. Next, it was assumed that some direct reaction competition develops, which implies kD ≠ 0. Since the kinetic regime is slow, the highest value for kD is limited to a value leading to a Hatta number of 0.3 [41]. By using Equation (8) with Ha = 0.3, a value of 13.1 M−1s−1 was obtained for kD. With this value and no contribution of TOC1 as scavenger (α = 0), the solution of the kinetic model overestimated TOC abatement. Calculated TOC disappeared in a few minutes. Finally, the model was solved by considering the existence of both kD and α. Since approximately at 40 min the removal rate of TOC shows a clear change (see Figure 3), an α value of 0.1 was assumed in the first 40 min reaction. This change was likely due to an increase of the scavenging character of intermediates formed, that is, what it is defined as TOC1. Next, after some attempts at varying α, an exponential increase of this parameter from 0.1 to 0.9 from reaction times between 40 and 50 min was assumed. Then, α = 0.9 was considered constant until the end of the reaction. With this assumption, the kinetic model was solved for different kD values and TOC results were compared to the experimental data. Figure 3 shows the results obtained. From Figure 3, it can be seen that regardless of kD, during the first 40 min reaction, calculated and experimental results are very close, which means that hydroxyl radical reactions are the important contributing species to TOC removal. In fact, for this reaction period, calculated contributions of free radical reaction to TOC removal represented more than 97%. At higher reaction time, kD has a significant effect, with a value of 0.5 M−1s−1, as the best one to predicts the experimental TOC results. From 50 min reaction, contribution of the direct reaction to remove TOC was about 30%. Note that these values of kD and α were not the optimum ones since the objective of the work was not the optimization of the kinetic model but to discuss the effect of parameters and to obtain the best approximate values of them to predict the experimental results. In any case, since the criteria followed was the minimization of the sum of the squares of the differences between calculated and experimental results (see also ANOVA results in Section 2.3.), the optimum should be very close to 0.5 M−1s−1 and 0.1 to 0.9 for kD and α, respectively. The best values of kD and α also lead to the calculated results of TOC1, TOC2, and concentrations of ozone in the gas (Figure 4 and Figure 5) and of hydrogen peroxide and ozone dissolved in water (Figure S3) (see later discussion of these results).
Figure 4 presents the effect of α on TOC by keeping kD = 0.5 M−1 s−1. As can be seen from Figure 4 assuming a constant value of α for the whole reaction period between 0.1 and 0.9 leads to unacceptable differences between calculated and experimental TOC values. Also, neglecting the scavenging effect of TOC1 after the first 40 min reaction or even changing the value of α from 0.9 to 0.1 for the 40 to 50 min interval time (not shown) resulted in TOC removal rates much faster than the experimental ones. In these cases, calculated TOC removal percentages were higher than 90% which is against mineralization data reported for single ozonation processes [40].
For the best values of α and kD, Figure 5 shows the changes with time of calculated TOC1, TOC2, TOC (sum of TOC1 and TOC2), and CO3g.
From Figure 5 both calculated TOC and CO3g are very close to the experimental data. Also, it is observed how theoretical TOC1 and TOC2 decreases and increases, respectively, with reaction time. At this respect, it has to be noted that the scavenger contributing effect of TOC1 was always higher than 98% while those of TOC2, carbonates already present in the treated wastewater and formed from mineralization reached a maximum value of 0.6, 0.26, and 0.24%, respectively, at 300 min reaction. This indicates the importance of considering a scavenging effect for the remaining pharmaceutical and intermediates of ozonation to explain the evolution of TOC. From Figure 5, it is also observed that CO3g values correspond to a nearly steady state situation.
Changes with time of calculated and experimental concentrations of dissolved ozone and hydrogen peroxide are depicted in Figure S3. In these cases, however, although both calculated and experimental time concentration profiles follow similar trends, calculated CO3 and CH2O2 values overestimate and underestimate their corresponding experimental concentrations, respectively. In any case, differences can be assumed valid from an engineering point of view. For instance, as average, differences between calculated and experimental dissolved ozone concentration oscillate between 0.1 and 0.4 mg L−1. The results suggest the development of some non-effective decomposition reactions of ozone not considered in the proposed mechanism, albeit their absence in the mechanism had no influence on TOC removal rates. Regarding hydrogen peroxide, it has to be noted that the analytical method applied does not distinguish between hydrogen peroxide and organic peroxides; accordingly, the actual hydrogen peroxide concentrations are likely lower than those experimentally determined. In any case, the importance of hydrogen peroxide is clear because its reaction with ozone is the main initiation step of free radicals in single ozonation. The presence of H2O2 in solution is guaranteed through the reaction between TOC1 and ozone. This type of reaction has already been reported in other works, such as in the ozonation of diclofenac, one of the pharmaceuticals present in the studied secondary wastewater effluent [59,60]. The kinetic model predicts a significant decrease of hydrogen peroxide concentration at 40 min reaction when TOC removal rate shows an important decreasing change. In spite of the differences observed between calculated and experimental dissolved ozone and hydrogen peroxide concentrations, the most important features to keep in mind are that the kinetic model accurately predicts the level of mineralization to be reached (TOC removal) and also the ozone consumption per TOC removed. This latter parameter is based on the good concordance between calculated and experimental TOC and ozone gas concentrations at the reactor outlet. The influence of dissolved ozone on consumption is negligible. Level of mineralization, toxicity, and economic cost (not treated in this work) are likely the most important items to check in ozonation processes.
Finally, Figure S4 shows the changes with time of calculated hydroxyl radical concentration. As it can be observed, the hydroxyl radical concentration starts with calculated values (see Equation (S37)) of about 2.7 × 10⁻¹⁴ M for the first 40 min and then undergo a decrease to about 7 × 10⁻¹⁵ M as a consequence of the increasing value of α. Finally, it slightly increases until the end of ozonation (5 h) to up to a value of 9 × 10⁻¹⁵ M.
In photocatalytic ozonation, in addition to kD and α, the quantum yield of the catalyst, ϕcat, is added to parameters to be studied. Best values of kD and α were found to be the same as in single ozonation. However, in this system, the change of experimental TOC removal rate was observed after 2 h (see Figure 6). As a result, α was varied between 0.1 and 0.9 from 120 and 150 min of reaction. Here, only the effect of ϕcat on TOC removal, shown in Figure 6, is discussed. As can be observed from Figure 6, the best value for ϕcat, was 6.5 × 10⁻⁴ mol Einstein−1. Higher or lower values lead to poor fitting between calculated and experimental TOC values. Tolosana-Moranchel et al. [56] found a value between 1.8 × 10⁻² and 2.4 × 10⁻² mol Einstein−1 for a 0.5% GO/TiO2 catalyst in the ozone-free photocatalytic oxidation of clofibric acid with four UVA lamps emitting in the range 315–415 nm. Also, the same authors [61] reported a value of 3.7 × 10⁻³ molEinstein−1 for TiO2 P25 catalyst while studying the ozone-free photocatalytic oxidation of phenol with different UVA/visible lamps. Compared to these quantum yields found in literature for similar catalysts, 6.5 × 10⁻⁴ mol Einstein−1 results much lower, but it corresponds to a LED visible wavelength of 425 nm without any contribution of UVA radiation as reported in the other works. This means that the quantum efficiency of our catalyst is exclusively due to the presence of GO since TiO2 does not absorb radiation above 385 nm because of its high band gap [62].
Changes of main species concentration with time corresponding to the best values of kD, α, and ϕcat for the photocatalytic ozonation process are depicted in Figure 7 and Figure S5.
In Figure 7, it is seen how the calculated TOC and CO3g are practically coincident with the experimental values. Also, TOC1 and TOC2 profiles follow similar trends than in single ozonation. The difference is the time where changes of TOC removal rate are significant, at about 120 min which justifies the change introduced in α. Similarly to single ozonation, during the first period of reaction, at 120 min in this case, contribution of free radical oxidation was above 96%. From this reaction time the contributing effect of direct TOC1 ozonation increases up to 22% at the end of the reaction. Notice, that initiation steps of hydroxyl radicals in photocatalytic ozonation are due to both ozone-hydrogen peroxide direct reaction (reaction (S8)) and photon absorption rate (reaction (21)) leading to catalyst excitation. From calculated data, the contribution of photon absorption rate to initiate the chain propagation of free radicals was 100% at start of the second reaction period, because of the low dissolved ozone concentration, it decreases to 20% during the following 10 min and reaches a maximum value of 41.4% at the end of the process.
Figure S5 depicts the experimental and calculated changes of hydrogen peroxide and dissolved ozone concentration with time. Regarding the concentration trends, results are similar to those found in single ozonation. Calculated ozone concentration overestimates the experimental results during the last 150 min but with lower deviations than in single ozonation. Ozone concentration profiles follow a clear sigmoid curve as a result of the high ozone consumption during the first 120 min. Also, calculated concentrations of hydrogen peroxide were closer to the experimental ones compared to single ozonation results but always underestimating the experimental data. Similar to single ozonation, deviations could be due to the analytical method to determine hydrogen peroxide concentration. Again, it should be kept in mind that the kinetic model accurately predicts both mineralization and ozone consumption.
Finally, Figure S4 also shows the time concentration profile calculated for hydroxyl radical during photocatalytic ozonation at the best conditions of parameters investigated. A similar trend to single ozonation with a clear change in concentration in the interval 120–150 min is observed, where α was also changed to increase the scavenging character of intermediates. As a consequence of these changes and the importance of initiation steps (21) and (S8), calculated hydroxyl radical concentration first increases for the first 120 min, from 3 × 10⁻¹⁴ to 5.7 × 10⁻¹⁴ M, then decreases for the next 30 min down to 1.2 × 10⁻¹⁴ M, and finally slightly increases up to 1.6 × 10⁻¹⁴ at 300 min reaction.

2.3. Analysis of Variance

Analysis of variance (ANOVA) of the experimental and predicted data from the model for both reaction periods was carried out by ANOVA statistic tool of OriginPro 2018® software, establishing a significance level of 0.05 (see Tables S1 and S2 for the first and second reaction periods, respectively).
For the first reaction period, according to Table S1 good fitting statistics were obtained for both concentrations studied: TOC and ozone gas concentration in the two ozonation systems studied. This is also confirmed in Figures S6 and S7 where experimental versus predicted TOC and CO3g are shown together to ±10% deviation lines.
For the second reaction period, similar tendencies in the prediction model were found for both ozonation and PhCatOz processes (see Table S2). Due to the problems mentioned for dissolved ozone and hydrogen peroxide concentrations, only ANOVA of TOC and ozone gas concentration at the reactor outlet is discussed. For the case of TOC very good fitting parameters were obtained (see also Figures S8 and S9). On the contrary, R2 for ozone gas concentration shows poor results. However, it should be noted that, as shown in Figure 5 and Figure 7, experimental ozone gas concentration at the reactor outlet reached a nearly stationary value just after some minutes of the start of the second reaction period while predicted values showed a slight increasing trend only deviating less than ±10% from the experimental ones as observed from Figures S8 and S9 for ozonation and PhCatOz, respectively. In fact, for 5 reaction hours, calculated ozone gas concentration in single ozonation varied from 8.4 to 9.8 mg L−1 while experimental ones changed from 8.4 to 10 mg L−1 while in PhCatOz changes were from 8.6 to 9.9 mg L−1 and 8.6 to 10.1 mg L−1 for calculated and experimental concentrations, respectively. Therefore, in spite of the low value found for R2 predictions of ozone gas concentration, the results can be considered acceptable from an engineering point of view.

3. Materials and Methods

All materials, catalyst preparation and characterization, equipment and procedures to obtain the experimental results are described in detail in previous works [24,29,30]. Briefly, regarding the experimental set-up and some other analytical determinations: the photoreactor was a cylindrical tank of 6.2 cm diameter and 0.5 L of effective volume supplied with inlet and outlet for gas and a sampling port. The reactor worked in semibatch mode by charging the SEMWW sample doped with pharmaceuticals (at 10 mg L−1 each) and 0.4 g L−1 of 1.5% GO/TiO2 catalyst. An ozone–oxygen mixture was continuously fed after allowing 30 min of contact between the doped SEMWW and catalyst to facilitate equilibrium adsorption of organics. The catalyst was an 8.5 nm size 1.5% graphene oxide on TiO2 composite with 100% anatase phase [29] (see also Figure S10 of Supplementary Materials). Agitation was provided at 700 rpm with a magnetic stirrer situated at the reactor bottom. The reactor was inserted in a cubic box with 44 LEDs emitting mainly at 425 nm radiation. Each vertical wall of the box had 11 LEDs equidistantly situated. Ozone was produced in a 30/7 Sander laboratory ozonator and its concentration measured with an Anseros GM-19 ozone analyzer (Tubingen, Germany). TOC was measured with a Shimadzu TOC-VSCH instrument (Kyoto, Japan). Initially, pharmaceutical doped SEMWW had about 56.7 mg L−1 TOC (10 mg L−1 due to non-doped SEMWW). Ozone in the water was determined by the Indigo method [63]. Hydrogen peroxide (and likely organic peroxides) concentration was determined photometrically by the cobalt/bicarbonate method, at 260 nm [64]. The intensity of incident radiation was calculated by actinometry with ferrioxalate complex, [Fe(C2O4)3]3−, in acidic medium [30]. A value of 1.09 × 10⁻⁷ Einstein cm−2 s−1 was obtained, which is equivalent to 307 W m−2 at 425 nm. Typical values of variables for an ozone process were ozone inlet mass rate = 5.83 mg min−1 and gas flow rate = 35 L h−1. The liquid phase deposition method was applied for the synthesis of catalysts [65].

4. Conclusions

The main conclusions reached in this work are:
Both ozonation and photocatalytic ozonation of the pharmaceutical doped secondary urban wastewater effluent studied can be kinetically modeled following the kinetic regime of ozone absorption and then the gas–liquid reaction kinetics. The gas–liquid system is based on a lumped reaction between TOC and ozone and hydroxyl radicals, depending on the ozone system.
The ozone processes, from a kinetic point of view, are divided in two periods with different ozone kinetic regimes. A first period of just less than 10 min of duration where pharmaceuticals concentrations are reduced nearly under their detection limit. This first period is characterized by the absence of dissolved ozone and Ha number and reaction factors higher than 1, which correspond to fast ozone reactions. In this period, the main molecular species are TOC of pharmaceuticals and ozone in the gas at the reactor outlet. Influence of photochemical reactions during this period can be considered negligible from the kinetics perspective so that pharmaceuticals can be considered exclusively consumed with ozone.
The second reaction period is characterized by the presence of dissolved ozone, with hydroxyl radical and direct ozone reactions competing to consume total TOC. Now, the kinetic regime of ozone reactions is slow and Hatta numbers and reaction factors lower than 1. In this period main molecular species are represented by TOC, ozone in the gas and water phases and hydrogen peroxide. During this period, TOC was divided in TOC1 and TOC2 to account for the diverse nature of intermediates formed. Now, hydroxyl radical reactions are mainly responsible for TOC removal with percentages varying depending on the ozone process applied. Also, initiation of free radicals is due to two main steps: the mean photon absorption rate of catalyst to generate charge carriers and the reaction of ozone with the hydrogen peroxide anion. The presence of a reaction between ozone and TOC1 to yield hydrogen peroxide makes possible the concordance between calculated and experimental TOC results though the inclusion of a fraction α of scavenger nature in TOC1 was also fundamental.
The kinetic model, despite the discrepancies observed in hydrogen peroxide and dissolved ozone concentrations, accurately predicts mineralization levels and ozone consumption.
This kind of kinetic model could be applied to any wastewater ozonation system after a detailed study of the actual TOC–time trends to establish the fraction of TOC of scavenging nature and the value of the direct rate constant. Also, in the case of photocatalytic reactions, the study will allow the catalyst quantum yield to be estimated provided other catalyst properties (absorption and dispersion coefficients among others) are known.

Supplementary Materials

The following are available online at https://www.mdpi.com/2073-4344/10/11/1256/s1, Figure S1. Single ozonation: Changes with time of concentrations of dissolved ozone (▲) and hydrogen peroxide (■) during the second reaction period. Experimental conditions as in Figure 1. Figure S2. Photocatalytic ozonation: Changes with time of concentrations of dissolved ozone (▲) and hydrogen peroxide (■) during the second reaction period. Experimental conditions as in Figure 2. Figure S3. Kinetic model results in ozonation. Second reaction period. Changes with time of calculated and experimental concentrations of dissolved ozone and hydrogen peroxide. Black symbols: experimental results. Curves: calculated results: ■ Hydrogen peroxide, ▲ CO3. Note that experimental hydrogen peroxide concentrations likely include the one of organic peroxides. Experimental conditions as in Figure 1. Figure S4. Kinetic model results for the second reaction period. Changes with time of calculated concentrations of hydroxyl radicals. In ozonation: Continuous line, In photocatalytic ozonation: dotted line. Figure S5. Kinetic model results in photocatalytic ozonation. Second reaction period. Changes with time of calculated and experimental concentrations of dissolved ozone and hydrogen peroxide. Black symbols: experimental results. Curves: calculated results: ■ Hydrogen peroxide, ▲ CO3. Note that experimental hydrogen peroxide concentrations likely include the one of organic peroxides. Experimental conditions as in Figure 2. Figure S6. Experimental vs predicted values of TOC and CO3g in Ozonation for the first reaction period. Dotted lines correspond to ±10% deviations. Figure S7. Experimental vs. predicted values of TOC and CO3g in PhCatOz for the first reaction period. Dotted lines correspond to ±10% deviations. Figure S8. Experimental vs. predicted values of TOC and CO3g in Ozonation for the second reaction period. Dotted lines correspond to ±10% deviations. Figure S9. Experimental vs. predicted values of TOC and CO3g in PhCatOz for the second reaction period. Dotted lines correspond to ±10% deviations. Figure S10. XRD of GO/TiO2 composite. Table S1. ANOVA statistics of the kinetic model at 0.05 significance level for the first reaction period. Table S2: ANOVA statistics of the kinetic model at 0.05 significance level for the second reaction period.

Author Contributions

Conceptualization, F.J.B., J.R., and J.F.G.-A.; Methodology, M.C. and F.J.B.; Software, F.J.B. and J.R.; Validation, F.J.B. and J.R.; Formal analysis, M.C. and J.F.G.-A.; Investigation, M.C. and J.F.G.-A.; Resources, F.B.N..; Writing—original draft preparation, F.J.B.; Writing—review and editing, F.J.B. and J.R.; Supervision, F.J.B. and J.F.G.-A.; Funding acquisition, F.J.B. All authors have read and agreed to the published version of the manuscript.

Funding

This research was funded by ERDF- European Funds for Regional Development and MINISTERIO DE ECONOMÍA Y COMPETITIVIDAD OF SPAIN (MINECO) through Project CTQ2015-64944-R.

Acknowledgments

Authors are grateful to the MINECO (Project CTQ2015-64944-R), and the ERDF for economically supporting this work.

Conflicts of Interest

The authors declare no conflict of interest. The funders had no role in the design of the study; in the collection, analyses, or interpretation of data; in the writing of the manuscript, or in the decision to publish the results.

References

  1. Ternes, T.A.; Joss, A.; Siegrist, H. Scrutinizing pharmaceuticals and personal care products in wastewater treatment. Environ. Sci. Technol. 2004, 38, 392A–399A. [Google Scholar] [CrossRef] [Green Version]
  2. Tran, N.H.; Reinhard, M.; Gin, K.Y.-H. Occurrence and fate of emerging contaminants in municipal wastewater treatment plants from different geographical regions—A review. Water Res. 2018, 133, 182–207. [Google Scholar] [CrossRef]
  3. Lapworth, D.J.; Baran, N.; Stuart, M.E.; Ward, R.S. Emerging organic contaminants in groundwater: A review of sources, fate and occurrence. Environ. Pollut. 2012, 163, 287–303. [Google Scholar] [CrossRef] [PubMed] [Green Version]
  4. González, S.; López-Roldán, R.; Cortina, J.L. Presence and biological effects of emerging contaminants in Llobregat River basin: A review. Environ. Pollut. 2012, 161, 83–92. [Google Scholar] [CrossRef] [PubMed]
  5. Pal, A.; Gin, K.Y.H.; Lin, A.Y.C.; Reinhard, M. Impacts of emerging organic contaminants on freshwater resources: Review of recent occurrences, sources, fate and effects. Sci. Total Environ. 2010, 408, 6062–6069. [Google Scholar] [CrossRef] [PubMed]
  6. López-Pacheco, I.Y.; Silva-Núñez, A.; Salinas-Salazar, C.; Arévalo-Gallegos, A.; Lizarazo-Holguin, L.A.; Barceló, D.; Iqbal, M.N.; Parra-Saldívar, R. Anthropogenic contaminants of high concern: Existence in water resources and their adverse effects. Sci. Total Environ. 2019, 690, 1068–1088. [Google Scholar] [CrossRef]
  7. Wang, J.; Shih, Y.; Wang, P.Y.; Yu, Y.; Su, J.F.; Huang, C. Hazardous waste treatment technologies. Water Environ. Res. 2019, 91, 1177–1198. [Google Scholar] [CrossRef]
  8. Kanakaraju, D.; Glass, B.D.; Oelgemöller, M. Advanced oxidation process-mediated removal of pharmaceuticals from water: A review. J. Environ. Manag. 2018, 219, 189–207. [Google Scholar] [CrossRef]
  9. Salimi, M.; Esrafili, A.; Gholami, M.; Jafari, A.J.; Kalantary, R.R.; Farzadkia, M.; Kermani, M.; Sobhi, H.R. Contaminants of emerging concern: A review of new approach in AOP technologies. Environ. Monit. Assess. 2017, 189, 414. [Google Scholar] [CrossRef]
  10. Gogate, P.R.; Pandit, A.B. A review of imperative technologies for wastewater treatment II: Hybrid methods. Adv. Environ. Res. 2004, 8, 553–597. [Google Scholar] [CrossRef]
  11. Gomes, J.; Costa, R.; Quinta-Ferreira, R.M.; Martin, R.C. Review Application of ozonation for pharmaceuticals and personal care products removal from water. Sci. Total Environ. 2017, 586, 265–283. [Google Scholar] [CrossRef] [PubMed]
  12. Wang, J.; Chen, H. Catalytic ozonation for water and wastewater treatment: Recent advances and perspective. Sci. Total Environ. 2020, 704, 135249. [Google Scholar] [CrossRef] [PubMed]
  13. Katsoyiannis, I.A.; Canonica, S.; von Gunten, U. Efficiency and energy requirements for the transformation of organic micropollutants by ozone, O3/H2O2 and UV/H2O2. Water Res. 2011, 45, 3811–3822. [Google Scholar] [CrossRef] [PubMed]
  14. Glaze, W.H.; Kang, J.W.; Chapin, D.H. The chemistry of water treatment processes involving ozone, hydrogen peroxide and ultraviolet radiation. Ozone Sci. Eng. 1987, 9, 335–342. [Google Scholar] [CrossRef]
  15. Agustina, T.E.; Ang, H.M.; Vareek, V.K. A review of synergistic effect of photocatalysis and ozonation on wastewater treatment. J. Photochem. Photobiol. C 2005, 6, 264–273. [Google Scholar] [CrossRef]
  16. Mehrjouei, M.; Müller, S.; Möller, D. A review on photocatalytic ozonation used for the treatment of water and wastewater. Chem. Eng. J. 2015, 263, 209–219. [Google Scholar] [CrossRef]
  17. Mecha, A.C.; Onyango, M.S.; Ochieng, A.; Momba, M.N.B. Ultraviolet and solar photocatalytic ozonation of municipal wastewater: Catalyst reuse, energy requirements and toxicity assessment. Chemosphere 2017, 186, 669–676. [Google Scholar] [CrossRef]
  18. Rodríguez, E.M.; Rey, A.; Mena, E.; Beltrán, F.J. Application of solar photocatalytic ozonation in water treatment using supported TiO2. Appl. Catal. B Environ. 2019, 254, 237–245. [Google Scholar] [CrossRef]
  19. Fernandes, E.; Martins, R.C.; Gomes, J. Photocatalytic ozonation of parabens mixture using 10% N-TiO2 and the effect of water matrix. Sci. Total Environ. 2020, 718, 137321. [Google Scholar] [CrossRef]
  20. Rey, A.; García-Muñoz, P.; Hernández-Alonso, M.D.; Mena, E.; García-Rodríguez, S.; Beltrán, F.J. WO3-TiO2 based catalysts for the simulated solar radiation assisted photocatalytic ozonation of emerging contaminants in a municipal wastewater treatment plant effluent. Appl. Catal. B Environ. 2014, 154–155, 274–284. [Google Scholar] [CrossRef]
  21. Yang, T.; Peng, J.; Zheng, Y.; He, X.; Hou, Y.; Wu, L.; Fu, X. Enhanced photocatalytic ozonation degradation of organic pollutants by ZnO modified TiO2 nanocomposites. Appl. Catal. B Environ. 2018, 221, 223–234. [Google Scholar] [CrossRef]
  22. Dreyer, D.R.; Park, S.; Bielawski, C.W.; Ruoff, R.S. The chemistry of graphene oxide. Chem. Soc. Rev. 2010, 39, 228–240. [Google Scholar] [CrossRef] [PubMed]
  23. Beltrán, F.J.; Álvarez, P.M.; Gimeno, O. Graphene-Based Catalysts for Ozone Processes to Decontaminate Water. Molecules 2019, 24, 3438. [Google Scholar] [CrossRef] [PubMed] [Green Version]
  24. Checa, M.; Figueredo, M.; Aguinaco, A.; Beltrán, F.J. Graphene oxide/titania photocatalytic ozonation of primidone in a visible LED photoreactor. J. Hazard. Mater. 2019, 369, 70–78. [Google Scholar] [CrossRef]
  25. Matafonova, G.; Batoev, V. Recent advances in application of UV light-emitting diodes for degrading organic pollutants in water through advanced oxidation processes: A review. Water Res. 2018, 132, 177–189. [Google Scholar] [CrossRef]
  26. Liao, G.; Zhu, D.; Zheng, J.; Yin, J.; Lan, B.; Li, L. Efficient mineralization of bisphenol A by photocatalytic ozonation with TiO2–graphene hybrid. J. Taiwan Inst. Chem. Eng. 2016, 67, 300–305. [Google Scholar] [CrossRef]
  27. Sheydaei, M.; Shiadeh, H.R.K.; Ayoubi-Feiz, B.; Ezzati, R. Preparation of nano N-TiO2/graphene oxide/titan grid sheets for visible light assisted photocatalytic ozonation of cefixime. Chem. Eng. J. 2018, 353, 138–146. [Google Scholar] [CrossRef]
  28. Pedrosa, M.; Pastrana-Martínez, L.M.; Pereira, F.R.; Faria, J.L.; Figueiredo, J.L.; Silva, A.M.T. N/S-doped graphene derivatives and TiO2 for catalytic ozonation and photocatalysis of water pollutants. Chem. Eng. J. 2018, 348, 888–897. [Google Scholar] [CrossRef]
  29. Beltrán, F.J.; Checa, M. Comparison of graphene oxide titania catalysts for their use in photocatalytic ozonation of water contaminants: Application to oxalic acid removal. Chem. Eng. J. 2020, 385, 123922. [Google Scholar] [CrossRef]
  30. Checa, M.; Beltrán, F.J.; Rivas, F.J.; Cordero, E. On the role of a graphene oxide/titania catalyst, visible LED and ozone in removing mixtures of pharmaceutical contaminants from water and wastewater. Environ. Sci. Water Res. Technol. 2020, 6, 2352–2364. [Google Scholar] [CrossRef]
  31. Cernigoj, U.; Stangar, U.L.; Trebse, P. Degradation of neonicotinoid insecticides by different advanced oxidation processes and studying the effect of ozone on TiO2 photocatalysis. Appl. Catal. B Environ. 2007, 75, 229–238. [Google Scholar] [CrossRef]
  32. Rey, A.; Quinones, D.H.; Alvarez, P.M.; Beltran, F.J.; Plucinski, P.K. Simulated solarlight assisted photocatalytic ozonation of metoprolol over titania-coated magnetic activated carbon. Appl. Catal. B Environ. 2012, 111–112, 246–253. [Google Scholar] [CrossRef]
  33. Mecha, A.C.; Onyango, M.S.; Ochieng, A.; Fourie, C.J.S.; Momba, M.N.B. Synergistic effect of UV-vis and solar photocatalytic ozonation on the degradation of phenol in municipal wastewater: A comparative study. J. Catal. 2016, 341, 116–125. [Google Scholar] [CrossRef]
  34. Li Puma, G.; Khor, J.N.; Brucato, A. Modeling of an Annular Photocatalytic Reactor for Water Purification:  Oxidation of Pesticides. Environ. Sci. Technol. 2004, 38, 3737–3745. [Google Scholar] [CrossRef]
  35. Mena, E.; Rey, A.; Rodriguez, E.M.; Beltran, F.J. Nanostructured CeO2 as catalysts for different AOPs based in the application of ozone and simulated solar radiation. Catal. Today 2017, 280, 74–79. [Google Scholar] [CrossRef]
  36. Beltrán, F.J.; Aguinaco, A.; García-Araya, J.F. Kinetic modelling of TOC removal in the photocatalytic ozonation of diclofenac aqueous solutions. Appl. Catal. B Environ. 2010, 100, 289–298. [Google Scholar] [CrossRef]
  37. Figueredo, M.; Rodríguez, E.M.; Rivas, F.J.; Beltrán, F.J. Kinetic model of ozone/light-based advanced oxidation processes: A pseudoempirical approach. Environ. Sci. Water Res. Technol. 2020, 6, 1176. [Google Scholar] [CrossRef]
  38. Tolosana-Moranchela, A.; Manassero, A.; Satuf, M.L.; Alfano, O.M.; Casas, J.A.; Bahamonde, A. TiO2-rGO photocatalytic degradation of an emerging pollutant: Kinetic modelling and determination of intrinsic kinetic parameters. J. Environ. Chem. Eng. 2019, 7, 103406. [Google Scholar] [CrossRef]
  39. Beltrán, F.J.; Rey, A. Free radical and direct ozone reaction competition to remove priority and pharmaceutical water contaminants with single and hydrogen peroxide ozonation systems. Ozone Sci. Eng. 2018, 40, 1–15. [Google Scholar] [CrossRef]
  40. Beltrán, F.J. Ozone Reaction Kinetics for Water and Wastewater Systems; Lewis Publishers: Boca Raton, FL, USA, 2004; pp. 1–358. [Google Scholar]
  41. Charpentier, J.-C. Mass-transfer rates in gas-liquid absorbers and reactors. In Advances in Chemical Engineering; Academic Press: New York, NY, USA, 1981; Volume 11, pp. 1–133. [Google Scholar]
  42. Mvula, E.; von Sonntag, C. Ozonolysis of phenols in aqueous solution. Org. Biomol. Chem. 2003, 1, 1749–1756. [Google Scholar] [CrossRef]
  43. Leitzke, A.; von Sonntag, C. Ozonolysis of unsaturated acids in aqueous solution: Acrylic, methacrylic, maleic, fumaric and muconic acids. Ozone Sci. Eng. 2009, 31, 301–308. [Google Scholar] [CrossRef]
  44. Beltrán, F.J.; Encinar, J.M.; García-Araya, J.F. Modelling industrial wastewater ozonation in bubble contactors. 2: Scale-up from bench to pilot plant. Ozone Sci. Eng. 1995, 17, 379–398. [Google Scholar]
  45. Rey, A.; Mena, E.; Chávez, A.M.; Beltrán, F.J.; Medina, F. Influence of structural properties on the activity of WO3 catalysts for visible light photocatalytic ozonation. Chem. Eng. Sci. 2015, 126, 80–90. [Google Scholar] [CrossRef]
  46. Mena, E.; Rey, A.; Rodríguez, E.M.; Beltrán, F.J. Reaction mechanism and kinetics of DEET visible light assisted photocatalytic ozonation with WO3 catalyst. Appl. Catal. B Environ. 2017, 202, 460–472. [Google Scholar] [CrossRef]
  47. Chávez, A.M.; Ribeiro, A.R.; Moreira, N.F.; Silva, A.M.T.; Rey, A.; Álvarez, P.M.; Beltrán, F.J. Removal of Organic Micropollutants from a Municipal Wastewater Secondary Effluent by UVA-LED Photocatalytic Ozonation. Catalysts 2019, 9, 472. [Google Scholar] [CrossRef] [Green Version]
  48. Staehelin, S.; Hoigné, J. Decomposition of Ozone in Water the Presence of Organic Solutes Acting as Promoters and Inhibitors of Radical Chain Reactions. Environ. Sci. Technol. 1985, 19, 1206–1212. [Google Scholar] [CrossRef]
  49. Staehelin, S.; Hoigné, J. Decomposition of ozone in water: Rate of initiation by hydroxide ions and hydrogen peroxide. Environ. Sci. Technol. 1982, 16, 666–681. [Google Scholar] [CrossRef]
  50. Buxton, G.V.; Greenstock, C.L.; Helman, W.P.; Ross, A.B. Critical review of data constants for reactions of hydrated electrons, hydrogen atoms and hydroxyl radicals (OH/·O) in aqueous solution. J. Phys. Chem. Ref. Data 1988, 17, 513–886. [Google Scholar] [CrossRef] [Green Version]
  51. Christensen, H.S.; Sehensted, H.; Corfitzan, H. Reactions of hydroxyl radicals with hydrogen peroxide at ambient and elevated temperatures. J. Phys. Chem. 1982, 86, 55–68. [Google Scholar] [CrossRef]
  52. Weeks, J.L.; Rabani, J. The pulse radiolysis of dearated carbonate solutions. 1. Transient optical spectrum and mechanism. 2. pK for OH radicals. J. Phys. Chem. 1966, 82, 138–141. [Google Scholar]
  53. Cassano, A.E.; Alfano, O.M. Reaction engineering of suspended solid heterogeneous photocatalytic reactors. Catal. Today 2000, 58, 167–197. [Google Scholar] [CrossRef]
  54. Brucato, A.; Cassano, A.E.; Grisafi, F.; Montante, G.; Rizzuti, L.; Vella, G. Estimating radiant fields in flat heterogeneous photoreactors by the six-flux model. AIChE J. 2006, 52, 3882. [Google Scholar] [CrossRef]
  55. Zalazar, C.S.; Labas, M.D.; Martín, C.A.; Brandi, R.J.; Alfano, O.M.; Cassano, A.E. The extended use of actinometry in the interpretation of photochemical reaction engineering data. Chem. Eng. J. 2005, 109, 67–81. [Google Scholar] [CrossRef]
  56. Tolosana-Moranchela, A.; Manassero, A.; Satuf, M.L.; Alfano, O.M.; Casas, J.A.; Bahamonde, A. Influence of TiO2-rGO optical properties on the photocatalytic activity and efficiency to photodegrade an emerging pollutant. Appl. Catal. B Environ. 2019, 246, 1–11. [Google Scholar] [CrossRef]
  57. Li Puma, G.; Brucato, A. Dimensionless analysis of slurry photocatalytic reactors using two-flux and six-flux radiation absorption–scattering models. Catal. Today 2007, 122, 78–90. [Google Scholar] [CrossRef]
  58. Rice, R.G.; Do, D.D. Applied Mathematics and Modeling for Chemical Engineers; John Wiley & Sons Inc.: New York, NY, USA, 1996. [Google Scholar]
  59. Sein, M.M.; Zedda, M.; Tuerk, J.; Schmidt, T.C.; Golloch, A.; von Sonntag, C. Oxidation of diclofenac with ozone in aqueous solution. Environ. Sci. Technol. 2008, 42, 6656–6662. [Google Scholar] [CrossRef]
  60. Rakowski, S.; Cherneva, D. Kinetics and mechanism of the reaction of ozone with aliphatic alcohols. Int. J. Chem. Kinet. 1990, 22, 321–329. [Google Scholar] [CrossRef]
  61. Tolosana-Moranchel, A.; Casas, J.A.; Carbajo, J.; Faraldos, M.; Bahamonde, A. Influence of TiO2 optical parameters in a slurry photocatalytic reactor: Kinetic modelling. Appl. Catal. B Environ. 2017, 200, 164–173. [Google Scholar] [CrossRef]
  62. Linsebigler, A.L.; Lu, G.; Yates, J.T., Jr. Photocatalysis on TiO2 surfaces: Principles, mechanisms and selected results. Chem. Rev. 1995, 95, 735–758. [Google Scholar] [CrossRef]
  63. Bader, H.; Hoigné, J. Determination of ozone in water by the indigo method. Water Res. 1981, 15, 449–456. [Google Scholar] [CrossRef]
  64. Masschelein, W.; Denis, M.; Ledent, R. Spectrophotometric determination of residual hydrogen peroxide. Water Sew. Work. 1977, 8, 69–72. [Google Scholar]
  65. Pastrana-Martínez, L.M.; Morales-Torres, S.; Likodimos, V.; Figueiredo, J.L.; Faria, J.L.; Falaras, P.; Silva, A.M.T. Advanced nanostructured photocatalysts based on reduced graphene oxide-TiO2 composites for degradation of diphenhydramine pharmaceutical and methyl orange dye. Appl. Catal. B Environ. 2012, 123–124, 241–256. [Google Scholar]
Figure 1. Single ozonation: Changes with time of calculated and experimental TOC (●), due to pharmaceuticals, and ozone gas concentration at the reactor outlet (▲) for the first reaction period. Symbols represent experimental data while curves are calculated results. Experimental conditions: pH = 7.5, gas flow rate: 35 L h−1, ozone mass rate: 5.83 mg min−1. SEMWW initial TOC: 10 mg L−1. Initial TOC due to pharmaceuticals: 46.5 mg L−1.
Catalysts 10 01256 g001
Figure 2. Photocatalytic ozonation: Changes with time of calculated and experimental TOC (●), due to pharmaceuticals, and ozone gas concentration at the reactor outlet (▲) for the first kinetic reaction period. Symbols represent experimental data while curves are calculated data. Experimental conditions: pH = 7.5, gas flow rate: 35 L h−1, ozone mass rate: 5.83 mg min−1. SEMWW initial TOC: 10 mg L−1. Initial TOC due to pharmaceuticals: 46.5 mg L−1. Radiation source: VisLED at 425 nm. Incident flux of radiation: 307 W m−2. Catalyst: 0.4 g L−1 of 1.5% GO/TiO2.
Catalysts 10 01256 g002
Figure 3. Solution of the kinetic model for single ozonation. Influence of direct rate constant, kD, on TOC changes with time during the second reaction period. TOC1 scavenging fraction: α = 0.1 for first 40 min, variable (following an exponential function) between 0.1 at 40 min and 0.9 at 50 min reaction, then constant at 0.9. Symbols: experimental results. Continuous and dotted curves: Calculated results. Continuous curve: best fitting results. Other experimental conditions as in Figure 1. Experimental TOC values from [30].
Catalysts 10 01256 g003
Figure 4. Solution of the kinetic model for single ozonation. Influence of α on TOC changes with time during the second reaction period. kD = 0.5 M−1 s−1. Symbols: experimental results. Dotted and continuous curves: calculated results. Continuous curve: best fitting results with α variable. Other experimental conditions as in Figure 1. Experimental TOC values taken from [30].
Catalysts 10 01256 g004
Figure 5. Kinetic model results in ozonation. Second reaction period. Changes with time of calculated and experimental concentrations of TOC (TOC1 and TOC2) and ozone in the gas leaving the reactor. Black symbols: experimental results: ■ TOC, ▲ CO3g. Empty symbols: Calculated ◇ TOC1, ○ TOC2. Curves: TOC and CO3g, calculated results: Experimental conditions as in Figure 1. Experimental TOC values taken from [30].
Catalysts 10 01256 g005
Figure 6. Solution of the kinetic model for photocatalytic ozonation. Influence of catalyst quantum yield at 425 nm. kD = 0.5 M−1 s−1; TOC1 scavenging fraction: α = 0.1 for first 120 min, variable (following an exponential function) between 0.1 at 120 min and 0.9 at 150 min reaction, then constant at 0.9. Symbols: experimental results. Continuous and dotted curves: calculated results. Continuous curve: best fitting results. Other experimental conditions as in Figure 2. Experimental TOC values from [30].
Catalysts 10 01256 g006
Figure 7. Kinetic model results in photocatalytic ozonation. Second reaction period. Changes with time of calculated and experimental concentrations of TOC (TOC1 and TOC2) and ozone in the gas leaving the reactor. Black symbols: experimental results: ■ TOC, ▲ CO3g. Empty symbols: calculated ◇ TOC1, ○ TOC2. Curves: TOC and CO3g calculated results. Experimental conditions as in Figure 2. Experimental TOC values taken from [30].
Catalysts 10 01256 g007
Publisher’s Note: MDPI stays neutral with regard to jurisdictional claims in published maps and institutional affiliations.

