Abstract
Von Neumann’s minimax theorem defines optimal strategic unpredictability in zero-sum games. Empirical evidence from professional sports has been interpreted as positive behavioral evidence for minimax. In this article, we analyze the strategic optimality of offensive plays in the basketball endgame when a team has a final possession and trails by no more than a single basket. This final moment of the game most closely approximates the simultaneous-move conditions of a game where minimax theory applies. Using comprehensive NBA data from 2010 to 2025, we test for equality of success rates across shooter types (star vs. non-stars) and shot selection (two-point vs. three-point). Our analysis reveals systematic violations of minimax play that have intensified with basketball’s shift to three-pointers and higher expected points. In the final decisive moment of the game, we find that teams systematically overuse three-point shots even though the two-point attempt yields higher field goal percentages. In addition, teams over-rely on star players for the final shot; non-star two-point shots have been the top-performing endgame option in 2022–2025.
“What the wise do in the beginning, fools do in the end.”Warren Buffett
1. Introduction
John von Neumann (1928)’s minimax theorem establishes that rational players in zero-sum games should randomize unpredictably across available strategies to prevent exploitation by opponents.1 Yet decades of controlled experiments reveal a persistent behavioral puzzle: human subjects systematically deviate from minimax predictions, exhibiting predictable patterns and failing to equalize success probabilities across mixed strategies (Ochs, 1995; O’Neill, 1987; Rapoport & Boebel, 1992). These laboratory findings have motivated alternative behavioral theories and raised fundamental questions about the descriptive relevance of classical game theory for understanding real-world strategic behavior.
Defenders of minimax as a behavioral theory argue that laboratory experiments lack external validity, as they task untrained experimental subjects with abstract problems and provide insufficient training and incentives for more sophisticated play (Binmore et al., 2001). True experts in their familiar high-stakes environments might still achieve optimal behavior, is the argument. Indeed, this perspective has gained some empirical support from analyses of professional sports, in particular, beginning with Walker and Wooders (2001)’s analysis of tennis serves (later by Hsu et al., 2007) and from analysis of soccer penalties by Chiappori et al. (2002) and Palacios-Huerta (2003). One view is that the best, most seasoned professionals tend to play à la minimax. Evidence from Major League Baseball and the National Football League has challenged this consensus: Kovash and Levitt (2009) document systematic deviations from minimax in pitch selection and run–pass decisions, as well as negative serial correlation in selected plays. One recent finding is that minimax is violated especially when athletes face extreme levels of pressure, which is when they turn to intuitive and ‘trusted’ options too often. In particular, Depoorter et al. (2023) find that elite tennis players exhibit predictable patterns favoring more reliable serves under pressure.2 Similarly, Jantschgi et al. (2023) record over-switching during penalty shootouts at major international tournaments by both goalkeepers and kickers.
This paper contributes to the wider literature on testing minimax against sports data, in particular investigating behavior under pressure in the context of NBA endgames and game-winning situations with focus on the behavior of the offense’s final possession when trailing by no more than a single made basket. These high-pressure moments most closely approximate the simultaneous-move, zero-sum conditions underlying minimax predictions: time constraints eliminate subsequent sequential adjustments, while the binary outcome creates pure opposition of interests. We test for optimal mixing across a four-strategy space defined by shooter type (star versus other/non-star player) and shot selection (two-point versus three-point attempts).
Using comprehensive play-by-play data from 2010 to 2025, our analysis documents a striking paradox: on the one hand, regular-time possessions have converged toward something like the theoretical equilibrium—with expected points per shot now statistically identical across strategic combinations; on the other hand, game-winning situations exhibit systematic violations of minimax play that have intensified alongside basketball’s three-point revolution. Despite two-point attempts yielding significantly higher success rates in clutch moments, teams systematically overuse three-point shots when games are on the line. This pattern is solidifying in tandem with the three-point revolution. Indeed, this pattern becomes nearly universal after 2019, suggesting that analytical frameworks optimizing regular-game strategy may paradoxically undermine performance precisely when optimal play matters most, i.e., in the final moments. Rather than preserving equilibrium play, high-pressure play reveals a reversion to the strategy that feels most intuitive in context. In the modern NBA, that is the three-pointer.
2. Basketball as a Natural Lab
2.1. The Three-Point Revolution
Perhaps no athlete is more emblematic of the NBA’s three-point revolution than Stephen Curry. The Golden State Warriors’ rise in the 2010s, paired with the growth of basketball analytics, transformed offenses into high-volume, perimeter-focused systems. Among the leading advocates of this shift was Daryl Morey, former general manager of the Houston Rockets. His philosophy, dubbed “Moreyball” coined after the famous “Moneyball” in baseball, prioritized three-point shots and layups over mid-range shots to maximize expected points per attempt.3
Analytics have proven effective: a recent empirical study found that NBA teams investing more heavily in analytics staff win significantly more games (Wang et al., 2025). Yet the three-point revolution has also drawn criticism about the aesthetics of a game that is now more and more dominated by perimeter attempts and homogeneous offensive schemes.4 Even NBA Commissioner Adam Silver has acknowledged these concerns, promising to “tweak it” and “correct those issues.”5
2.2. The Star Phenomenon
Much of the rise in three-point volume can be traced to the league’s stars.6 The fact that stars drive this trend is unsurprising—it reflects the NBA’s long-standing “star phenomenon,” in which a select group of elite players are the focal point of the league’s marketing strategy, whether through showcases like the All-Star Game or by commanding the league’s largest contracts. High-profile roster moves such as LeBron James’s 2010 “Decision” or Kevin Durant’s 2016 move to the Warriors are expected to create dynasties spanning multiple championships. Traditionally, these players are relied upon in the highest-stakes moments, expected to take over in the clutch and clinch games almost single-handedly. In 1990, Phil Jackson labeled this kind of late-game strategy the “Archangel Offense”: “That is where we give the ball to Michael Jordan and say, ‘Save us, Michael.’”7
2.3. Strategic Interactions in Clutch Moments
This paper examines how these two forces—the three-point revolution and the star phenomenon—interact strategically in the game’s most pivotal moments. The intersection creates a natural strategy space where the offense must decide both who shoots (star or other player)8 and what type of shot (two-pointer or three-pointer). From the defense’s perspective, these same dimensions define the counter-strategy: whether to concentrate pressure on the opponent’s star or adopt balanced coverage, and whether to protect the paint or defend the perimeter intensely.9
This strategic interaction becomes most pronounced in game-winning situations—the offense’s final possession when trailing by no more than can be overcome with a single made basket. In this final moment, unlike during the rest of the game characterized by its flowing, sequential nature, several factors converge to approximate a simultaneous-move, zero-sum condition that makes minimax theory relevant. The final-moment time constraints eliminate the defense’s ability to make subsequent sequential adjustments based on the offense’s initial action, and the binary nature of the possession outcome—make or miss—largely determines victory or defeat with limited opportunity for recovery. In other words, the entire game’s stakes reach their absolute peak, culminating in one last decision, with both teams fully focused on the single possession and the shot-making decision that will decide the game.
3. Data
We combine several data sources in our analysis.10 For detailed player statistics during the regular season and playoffs, including playing time, field goals attempted and made, and three-point attempts since the 2010–2011 season, we use official NBA statistics.11 We queried the NBA.com API12 and filtered play-by-play data from every game since the 2010–2011 season to identify all potential game-winning situations.
First, we formally define the notion of a star player in our setting. For each offensive formation, the star player on the court is defined hierarchically.
Definition 1
(Star Player). First, any player designated as an official NBA All-Star or All-NBA selection for the given season qualifies. If several or no such players are present, the star is identified as the player with the highest points per game (PPG). To account for players whose reputation stems primarily from defensive ability, we additionally require that a star must be within five PPG of the team’s leading scorer. In an alternative specification, we allow multiple players to qualify as stars: if a team fields more than one All-Star or All-NBA player, each may be considered a designated shooter.
This definition of a star player ensures that stardom captures both recognized league-wide status and team-specific offensive importance. Next, we formally define the notion of a game-winning situation in our setting.
Definition 2
(Game-Winning Situation). A game-winning situation is an offensive possession with at most 24 seconds remaining in the fourth quarter or overtime, where the offense trails by no more than one point (0 or 1 points), ensuring that both two- and three-point attempts can secure the win. We isolate strategically meaningful possessions as follows:
- Exclusions: back-court heaves, tip-ins, and put-backs are excluded, as they are not strategically initiated attempts.
- Offensive rebounds, jump balls, or steals: possessions beginning with these events are included only if the elapsed time before the shot exceeds a minimum threshold, ensuring the attempt follows a developed offensive sequence.
- Full-court possessions: following an opponent’s shot, rebound, or free throw, the offense must have sufficient time to advance the ball and initiate a set play.
- Dead-ball possessions: for possessions starting with a timeout, foul, or violation, we apply distinct timing thresholds to accommodate both quick inbounds and longer full-court plays.
Finally, we define the relevant success measure in our setting.
Definition 3
(Success Measure). We define success in regular-time possessions as expected points per shot (EPPS), since point value matters for ongoing play. We define success in game-winning situations as the probability that the shot is made, measured by field goal percentage (FGP).13
This distinction reflects the different optimization problems across contexts. In regular time, teams maximize expected returns across many possessions. In game-winner situations, by contrast, any made shot secures the lead regardless of whether it is worth two or three points, while a miss leaves the team behind with limited recourse.
To balance sample size and temporal precision, we group seasons into three-year windows, yielding a clean partition of the 15 seasons since 2010–2011. Alternative groupings yield similar results.14 In robustness checks, we further vary both the maximum remaining time (24, 14, 8, or 4 s) and the event-based timing thresholds to confirm the stability of our results; Table 1 summarizes these specifications. To ensure that our findings are not driven by arbitrary definitions, we run our analysis across all 3996 permutations of defining a meaningful possession, creating a total of 19,980 tests across all season windows.

Table 1.
Configuration grid for game-winner identification and timing thresholds.
4. Formal Model and Testable Hypothesis
With the definitions in place, we can formalize the minimax prediction in a simple theoretical model. We model the game-winner as a simultaneous-move, zero-sum game between offense and defense.
Let the offense choose from four pure strategies , where S denotes the star shooter, O denotes the other shooter, and the number indicates the type of shot (two-point or three-point). The defense chooses simultaneously a coverage strategy , allocating defensive pressure across the same strategic dimensions.15
Denote by the mixed strategy of the offense, where represents the probability of choosing the strategy j. Similarly, let represent the mixed strategy of the defense.16
The offense payoff function equals 1 if strategy j succeeds against defense k, and 0 otherwise, reflecting that in the game-winner setting, both two- and three-point makes yield the same outcome of securing the win. Given the zero-sum nature, .
In a mixed-strategy Nash equilibrium, the offense must be indifferent between all strategies played with positive probability. This indifference condition requires that the expected payoff from any strategy j employed in equilibrium equals the overall expected payoff,
where denotes the value of the game and represent equilibrium strategies.
This equilibrium condition translates directly into the following empirical prediction:
Hypothesis 1
(Minimax Equilibrium). In game-winning situations, field goal percentages should be equal across all strategies,
The intuition is straightforward: if any strategy consistently outperformed others, the defense would reallocate coverage to neutralize that advantage, while the offense would exploit any underdefended option. In equilibrium, this competitive pressure equalizes success probabilities across all strategies.
We test this hypothesis empirically using chi-squared tests on contingency tables of makes versus misses across the four strategies, evaluating whether differences in field goal percentage deviate significantly from optimal play. We examine multiple configurations varying the definition of game-winning situations (maximum time remaining, possession type, etc.) and test across different season windows. Rejection of the null hypothesis across these specifications provides evidence against minimax play, indicating systematic deviations from optimal strategic behavior in high-pressure situations.
5. Results
5.1. Systematic Minimax Violations in Game-Winning Situations
Our central finding is systematic violation of minimax play in NBA game-winning situations. Figure 1 reveals that field goal percentages differ substantially across the four strategic options, contradicting the equal success rates predicted by minimax theory. Two-point attempts consistently outperform three-point shots across all time periods, with the gap widening in recent seasons. In the most recent period (2022–2025), two-point shots by non-star players achieve field goal percentages above 40%, while three-point attempts by star players are used at a frequency of 16%—nearly as much as in 2010–2013—and succeed at rates barely above 30%.
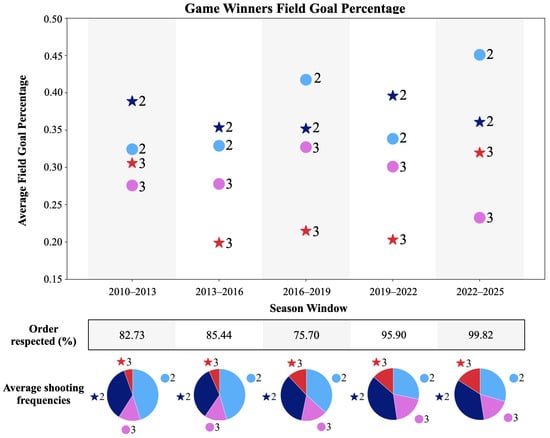
Figure 1.
Average field goal percentage across all configurations; percentage of configurations consistent with the ordering of the average; average shooting frequencies. It is clear that the three-pointer is not the better option for the game winner, especially as of late.
Despite this clear success differential, teams systematically overuse the least effective options while underutilizing the most successful ones. The consistency of this pattern across our configurations is striking. The bottom row of Figure 1 shows the percentage of configurations where field goal percentages follow the ordering of the average. In recent seasons, over 99% of our analytical specifications yield results consistent with two-point attempts outperforming three-point shots, indicating this is not an artifact of particular definitional choices but a robust empirical regularity.
5.2. Temporal Evolution and Robustness Across Configurations
Figure 2 demonstrates that these violations have intensified dramatically over time and are statistically robust across our 3996 analytical configurations. The evolution is particularly striking: in the earliest period (2010–2013), only 11.46% of configurations reject minimax at the 5% level. This proportion steadily increases through 30.78% (2013–2016) and 92.69% (2016–2019), culminating in near-universal rejection in recent seasons—98.40% in 2019–2022 and 99.70% in 2022–2025.
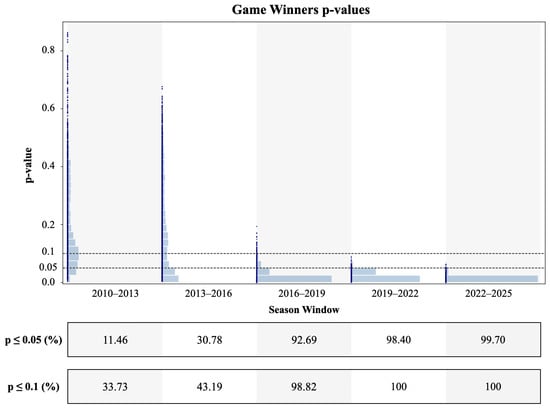
Figure 2.
p-values across all configurations of game-winners; histograms of p-values; percentage of configurations that violate minimax play at 5% and 10% level. Minimax is being rejected in almost all configurations since 2019.
The pattern at the 10% significance level tells an even starker story. In the most recent seasons, minimax is rejected in 100% of our test configurations, indicating that the deviations are not only systematic but also statistically overwhelming. The few early-period non-rejections clustered around configurations allowing more time on the clock (all configurations with 4 s maximum are rejected). However, since 2019, violations have become universal regardless of how we define game-winning situations—whether allowing 4, 8, 14, or 24 s; whether requiring specific possession types; or whether using single-star or multi-star definitions.
This temporal pattern suggests the violations have both strengthened and generalized. Early deviations were confined to the most restrictive game-winner definitions (very short time limits, specific possession sequences), but recent violations occur across all specifications. The three-point revolution appears to have created increasingly systematic biases that manifest regardless of the precise situational parameters.
5.3. Game-Winners Versus Regular-Time Play: The Pressure Paradox
These violations are specific to high-pressure situations, creating a striking paradox with regular-time performance. Figure 3 shows that regular-time NBA basketball has actually converged toward strategic equilibrium over the same period that game-winner violations intensified. We examine expected points per shot (EPPS) across our four strategic dimensions, using this metric because point value matters in regular possessions, unlike game-winners, where any made shot puts you in the lead in the final moments, regardless of whether it scores two or three points.
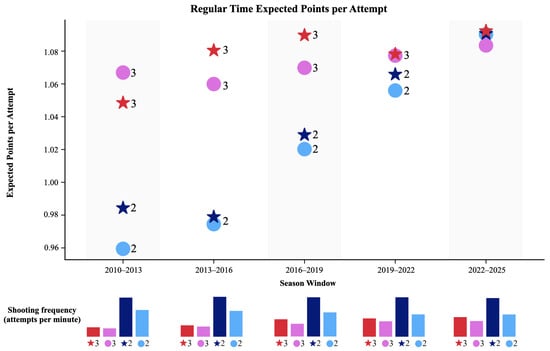
Figure 3.
Expected points per shot attempt in regular time; histograms of shots attempted per minute. Here is where we see convergence in the sense that three-pointers, which were taken less frequently, used to promise higher expected gains in the past, and today all shot types yield similar high expected points. This plot also indicates the fact the three-point trend has satiated. The histograms show shooting frequency (shot attempts per minute): stars increased their three-point attempts from 0.086 (2010–2013) to 0.179, more than doubling, while others rose from 0.077 to 0.143. By contrast, stars’ two-point shooting frequency remains stable, while others’ declines from 0.244 to 0.203. Overall, NBA players attempt more shots per minute today than in the past.
The contrast is remarkable. In the 2010s, regular-time EPPS varied significantly between the four strategies (ANOVA, , ), indicating suboptimal strategic mixing. By contrast, in recent seasons (2019–2020 onwards), these differences have nearly vanished, with EPPS statistically indistinguishable across strategies (ANOVA, , ).17 This convergence represents a triumph of analytical optimization—teams have successfully eliminated strategic inefficiencies in regular play through data-driven decision-making.
The analytical revolution has thus created a bifurcated strategic landscape. In regular possessions, teams optimize effectively, achieving near-perfect equilibrium where expected values equalize across strategic options. But in game-winning situations, these same analytical frameworks appear to systematically mislead decision-makers. The habits and heuristics that optimize regular play—particularly the emphasis on three-point shots for their superior expected value—become counterproductive when success probability rather than expected points determines outcomes.
This contrast corroborates the findings from tennis and soccer penalties that pressure specifically breaks minimax behavior. While aggregating across all possessions might suggest sophisticated strategic play—as evidenced by regular-time equilibrium—this masks systematic deviations in the highest-stakes moments. The phenomenon appears to be pressure-dependent: when games are routine and stakes moderate, teams play optimally; when everything is on the line, systematic biases emerge.
The irony is profound. The three-point revolution, which rationalized regular possessions by aligning shot selection with expected value, backfires precisely when games are decided. Teams have internalized analytical principles so thoroughly that they persist in applying them even when the underlying optimization problem has changed. In game-winners, the goal shifts from maximizing expected points to maximizing success probability, but teams continue optimizing for the wrong objective function, creating systematic strategic errors at the moments that matter most.
5.4. Some Remarks on Stars Versus Others
While our main results concern the shot selection of two-pointers versus three-pointers, we also analyzed the decision to have a star or non-star player take the shot. As with the two-versus-three analysis, we find regarding star-versus-non-star that there is an evolution of associated FGPs over time. Early on (2010–2013), star twos are positive outliers. Then, from 2013–2016 to 2019–2022, by contrast, star threes are the negative outliers. Finally, most recently (2022–2025), both star twos and star threes are “sandwiched”, with their twos and threes close together, by non-star twos at the top and non-star threes at the bottom. This sandwiching phenomenon occurs in three of the five windows in Figure 1, with the identity of the sandwiching group and the twos and threes trading places over time, which is why the star-versus-non-star analysis does not give a simple result by itself.
6. Field Goal Percentage Versus Win-Rates
An alternative success metric to field goal percentage is the probability of ultimately winning the game (“win-rate”). Crucially, win-rates are not uniquely defined across all game-theoretic treatments of sports. In some settings, such as penalty shootouts, each attempt is treated as a terminal score or no-score. In others, like tennis, win-rates are defined over the point level, folding in continuation play from serve to end of point. On the other extreme, one could look at the entire match (win or lose) outcome for these. Our analysis, as presented in this paper, mirrors the penalty-style perspective, treating the shot as the decision point, without folding in subsequent possessions into the success definition. In basketball, however, until the very last second, downstream events can intervene between a shot and the final result. Figure 4 and Figure 5 illustrate this by comparing shot outcome and game outcome as we vary the maximum time remaining.
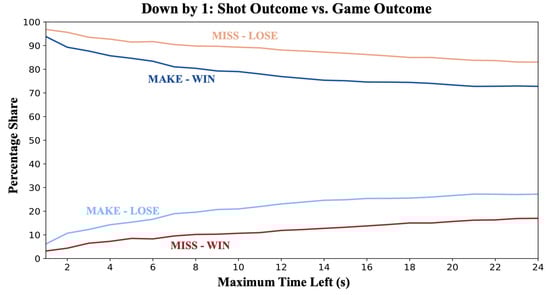
Figure 4.
Shot vs. game outcome, down 1 point. For each maximum time threshold t, we plot the empirical win-rate conditioned on the shot result; within each shot result (MAKE/MISS), win/loss shares sum to 100%.
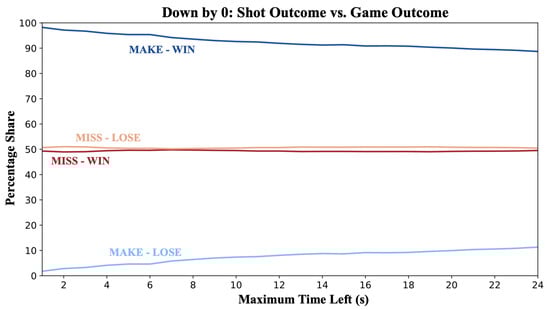
Figure 5.
Shot vs. game outcome, tied game (down 0). Definition as in Figure 4.
In the very last moment of the game, when down by one point, for example, making/missing a shot and winning/losing reduce to the same thing, while for larger time windows, making/missing a shot and winning/losing are not one-to-one correspondent. Various events (e.g., post-shot put-backs, tip-ins, fouls, overtime, etc.) drive a wedge between the shot outcome and the final match outcome. As we restrict t, these mismatches shrink. When trailing by one, outcomes move toward one-to-one with very few caveats. At s, we observe rare “make-and-lose” cases—two immediate opponent buzzer-beaters and two shooting-foul sequences where one made free throw ties the game (counted as a made shot) and play proceeds to overtime. Conversely, “miss-and-win” at s arises entirely from second-chance scoring (put-backs/tip-ins). When tied, the logic differs: a make secures the win in ≈98% of cases (the rest are opponent buzzer-beaters), while a miss sends the game to overtime in ≈99% of cases, yielding a ≈50% post-miss win-rate. Strikingly, in Figure 5 this ≈50% post-miss win-rate remains near-constant as t expands: at very small t, the parity is due almost entirely to overtime; as t grows, parity is sustained by a mix of overtime, second-chance scoring, opponent answers, and immediate counter-responses that offset each other in aggregate. Nevertheless, for any t, overtime remains the modal outcome after a miss when tied, decreasing monotonically from ≈99% at s to ≈87% at s.
Because, when tied, misses are not penalized by win-rate (you enter a ∼50:50 lottery), and field goal percentage and win-rate results need not coincide. To align the success notions more closely, we therefore focus on down by 1 point. We also consider a bounded-continuation variant, the Did-Not-Lose rate (DNL-rate), that caps continuation at the end of the current period: . This decouples overtime from the success criterion, still taking into account downstream events until the end of the current period, such as second-chance shots. Thus, tying the game through a free throw counts as a DNL outcome, even if you go into overtime.18 Here, what we seek to understand is whether certain shots, even if missed, leave more opportunity for an offensive rebound and second-chance shots.
In Figure 6, we plot FGP (hollow) and DNL-rate (fill) for 2022–2025 as a function of the maximum time remaining t. Cross-strategy gaps (star/non-star × two/three) are largest at small t, but our headline result—twos outperform threes, with non-star twos as the top option—persists for every t. For FGP, stars are generally “sandwiched” by non-stars, except at s, while the DNL-rate shows occasional S3–O3 swaps. As t increases, cross-strategy differences compress for both measures. Using FGP, we reject minimax at the 5% level for all t except , reflecting a standard power trade-off: small t yields fewer observations but larger effects; large t yields more observations but smaller effects. FGP and DNL move in lockstep with only small residual gaps at each t, but as differences compress, DNL’s absorption of downstream noise reduces power, leading to non-rejection for s. Our paper adopts FGP as the canonical success measure; nonetheless, the downstream-looking DNL rate corroborates our conclusions qualitatively across t and, for short horizons, quantitatively in formal tests.19
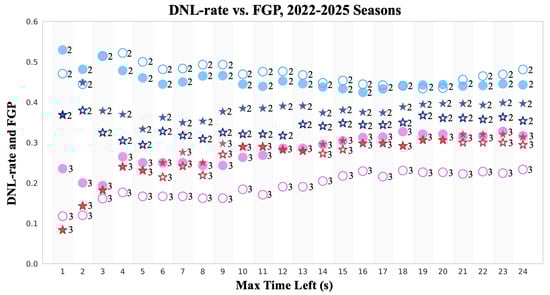
Figure 6.
2022–2025 NBA seasons, FGP (hollow) vs. DNL-rate (fill).
7. Conclusions
Basketball’s analytical revolution has created a strategic paradox. While teams have optimized regular-time play to near-theoretical equilibrium, they systematically violate minimax principles in game-winning situations. Despite two-point attempts yielding higher field goal percentages in clutch moments, teams increasingly overuse three-point shots when games are decided. This pattern has intensified since 2019, with violations occurring in over 98% of our test configurations in recent seasons. In addition, our results show that in the last three seasons (2022–2025), two-point attempts by non-stars have been the top-performing endgame option.
The three-point revolution appears to have created habits that serve teams well in regular play but backfire under extreme pressure. When stakes peak, teams revert to ingrained shot-selection patterns rather than optimizing for the specific strategic context. While teams might have under-utilized three-pointers a decade or so ago, today they actually over-utilize them in the endgame. This challenges a branch of the literature according to which “professionals play minimax,” adding basketball to a list of sports where elite athletes are shown to deviate from optimal play in high-stakes moments and under pressure.
More broadly, our findings suggest that analytical frameworks (sports analytics insights) optimizing routine decisions may create new and unforeseen systematic vulnerabilities in high-stakes situations where different criteria apply. Organizations should consider how optimization in one domain might spillover into contexts requiring different strategic approaches. In basketball terms, we have found evidence that as the three-pointer became the new go-to shot and indeed proved advantageous in regular play, it also became the new rely-upon shot in the endgame, where it is now actually over-utilized. The simpler and safer two-pointer in high-stakes situations instead is strategically advantageous.
Author Contributions
Conceptualization, L.S., T.S., S.J. and H.H.N.; methodology, L.S., T.S. and H.H.N.; software, L.S. and T.S.; validation, L.S. and H.H.N.; formal analysis, L.S., T.S. and S.J.; investigation, L.S., T.S. and H.H.N.; data curation, L.S. and T.S.; writing—original draft, L.S., T.S., S.J. and H.H.N.; writing—review and editing, L.S., S.J. and H.H.N.; visualization, L.S. and T.S.; supervision, L.S. and H.H.N.; project administration, L.S. and H.H.N.; funding acquisition, H.H.N. All authors have read and agreed to the published version of the manuscript.
Funding
Funded by the Swiss National Science Foundation under the Eccellenza Grant ‘Market and Norms’.
Data Availability Statement
The data presented in this study are available at the Center for Open Science under https://osf.io/fzcr8/ project reference number fzcr8.
Conflicts of Interest
The authors declare no conflicts of interest.
Notes
| 1 | See Hofbauer (2018) for a recent proof via the replicator equation. |
| 2 | See Depoorter et al. (2023) also for further references and discussion of relevant literature. |
| 3 | In 2019, Morey’s Rockets attempted 70 threes against the Nets, setting an NBA record for the most threes in a game. |
| 4 | Proposed solutions vary. One common suggestion is to move the three-point line back. Daryl Morey himself has argued threes should be worth 2.5 points; see CBS Sports (2021) https://www.cbssports.com/nba/news/76ers-president-daryl-morey-says-3-pointers-should-be-worth-2-5-points-its-just-too-big-of-a-bonus/ (accessed on 1 December 2025). |
| 5 | See Adam Silver’s interview on The Herd (2023) https://www.youtube.com/watch?v=pO6fjhDLh7U (accessed on 1 December 2025). |
| 6 | We define one star per team, hierarchically: the official All-Star or All-NBA player, or, if there are several or none, the player with the highest points per game. |
| 7 | See LA Times, “Bulls Have a Play for When It’s Beyond ‘Hail Mary’” (1990) https://www.latimes.com/archives/la-xpm-1990-05-28-sp-109-story.html (accessed on 1 December 2025). |
| 8 | See Liu (2021) for a related stylized game-theoretic analysis in which endgame strategy is defined by whether the shot is taken by a star or non-star and whether the defense double-teams the star or not. |
| 9 | See Annis (2006) and Kenter (2015) for another aspect of late-game defensive strategy: whether to intentionally foul or not. |
| 10 | See our OSF repository https://osf.io/fzcr8/?view_only=53b3bf44349747ed88828772f83b2886 (accessed on 1 December 2025) for details including all datasets, analysis files, and scripts. |
| 11 | See www.nba.com/stats (accessed on 18 September 2024) for data up to the 2023–2024 season, and 8 July 2025 for 2024–2025 season data. |
| 12 | See www.github.com/swar/nba_api (accessed on 18 September 2024) for data up to the 2023–2024 season, and 8 July 2025 for 2024–2025 season data. |
| 13 | An alternative success metric to FGP is the probability of ultimately winning the game (“win-rate”). See Section 6 for a detailed discussion. |
| 14 | See our OSF repository https://osf.io/fzcr8/?view_only=53b3bf44349747ed88828772f83b2886 (accessed on 1 December 2025) for results using different season windows. |
| 15 | In the earliest iteration of this project, we hand-coded video of game-winner possessions to classify offensive and defensive strategies, looking at star vs. other on offense and two defensive responses: focus on the star (F) versus a more even defensive scheme (E). The F–E distinction is sometimes obvious (e.g., hard double-teams) and sometimes subtler, with the star’s defender breaking defensive team cohesion by, for instance, eschewing his help responsibilities. The strongest example of this type of defensive focus is a box and one defense. This manual approach did not scale and was extremely time-consuming, especially as we expanded the offensive strategy space to include two- vs. three-point attempts. We therefore pivoted to a large-scale, programmatic analysis of play-by-play data, focusing on the offense, as presented in the paper. A scalable treatment of the defensive side—e.g., using automated classification of defensive schemes from player-tracking data—remains a promising direction for follow-up work. |
| 16 | To model basketball more realistically, and beyond simple tests of minimax, research could follow Kovenock and Roberson (2018) and Hunt and Zhuang (2023) to model basketball as a richer attack-defense game. |
| 17 | Degrees of freedom are large because the ANOVA is run at the shot level. |
| 18 | Note, that down by 0, DNL still remains uninformative about missed shots (MISS → OT ⇒ DNL), so we assess FGP–DNL alignment primarily in down by 1 situations. |
| 19 | The loss of statistical significance does not mean the pattern is not there, but rather indicates to us that FGP is preferable to DNL. |
References
- Annis, D. H. (2006). Optimal end-game strategy in basketball. Journal of Quantitative Analysis in Sports, 2(2), 1. [Google Scholar] [CrossRef]
- Binmore, K., Swierzbinski, J., & Proulx, C. (2001). Does minimax work? An experimental study. Economic Journal, 119, 445–464. [Google Scholar] [CrossRef]
- Chiappori, P.-A., Levitt, S., & Groseclose, T. (2002). Testing mixed-strategy equilibria when players are heterogeneous: The case of penalty kicks in soccer. American Economic Review, 92(4), 1138–1151. [Google Scholar] [CrossRef]
- Depoorter, B., Jantschgi, S., Lendl, I., Mlakar, M., & Nax, H. H. (2023). Minimax under pressure: The case of tennis. Games, 16(6), 60. [Google Scholar] [CrossRef]
- Hofbauer, J. (2018). Minmax via replicator dynamics. Dynamic Games and Applications, 8, 637–640. [Google Scholar] [CrossRef]
- Hsu, S.-H., Huang, C.-Y., & Tang, C.-T. (2007). Minimax play at wimbledon: Comment. American Economic Review, 97(1), 517–523. [Google Scholar] [CrossRef]
- Hunt, K., & Zhuang, J. (2023). A review of attacker-defender games: Current state and paths forward. European Journal of Operational Research, 313(2), 401–417. [Google Scholar] [CrossRef] [PubMed]
- Jantschgi, S., Nax, H. H., Secilmis, L., & Secilmis, T. (2023). Should I stay or should I go? Over-switching in penalty shootouts. DRAFT. [Google Scholar]
- Kenter, F. H. J. (2015, February 27–28). An analysis of the basketball endgame: When to foul when trailing and leading. 9th MIT Sloan Sports Analytics Conference. Available online: https://www.stat.berkeley.edu/~aldous/157/Papers/kenter.pdf (accessed on 1 December 2025).
- Kovash, K., & Levitt, S. D. (2009). Professionals do not play minimax: Evidence from Major League Baseball and the National Football League. Working Paper No. 15347. National Bureau of Economic Research. Available online: http://www.nber.org/papers/w15347 (accessed on 1 December 2025).
- Kovenock, D., & Roberson, B. (2018). The optimal defense of networks of targets. Economic Inquiry, 56(4), 2195–2211. [Google Scholar] [CrossRef]
- Liu, Y. (2021). Star players in the NBA–decoys or game-changers? Journal of Mathematics Research, 13(2), 40–51. [Google Scholar] [CrossRef]
- Ochs, J. (1995). Games with unique, mixed strategy equilibria: An experimental study. Games and Economic Behavior, 10(1), 202–217. [Google Scholar] [CrossRef]
- O’Neill, B. (1987). Nonmetric test of the minimax theory of two-person zerosum games. Proceedings of the National Academy of Sciences of the United States of America, 84(7), 2106–2109. [Google Scholar] [CrossRef] [PubMed]
- Palacios-Huerta, I. (2003). Professionals play minimax. The Review of Economic Studies, 70(2), 395–415. [Google Scholar] [CrossRef]
- Rapoport, A., & Boebel, R. B. (1992). Mixed strategies in strictly competitive games: A further test of the minimax hypothesis. Games and Economic Behavior, 4(2), 261–283. [Google Scholar] [CrossRef]
- von Neumann, J. (1928). Zur Theorie der Gesellschaftsspiele. Mathematische Annalen, 100(1), 295–320. [Google Scholar] [CrossRef]
- Walker, M., & Wooders, J. (2001). Minimax play at Wimbledon. American Economic Review, 91(5), 1521–1538. [Google Scholar] [CrossRef]
- Wang, H., Sarker, A., & Hosoi, A. (2025). The effect of basketball analytics investment on National Basketball Association (NBA) Team Performance. Journal of Sports Economics, 26(6), 668–688. [Google Scholar] [CrossRef]
Disclaimer/Publisher’s Note: The statements, opinions and data contained in all publications are solely those of the individual author(s) and contributor(s) and not of MDPI and/or the editor(s). MDPI and/or the editor(s) disclaim responsibility for any injury to people or property resulting from any ideas, methods, instructions or products referred to in the content. |
© 2025 by the authors. Licensee MDPI, Basel, Switzerland. This article is an open access article distributed under the terms and conditions of the Creative Commons Attribution (CC BY) license (https://creativecommons.org/licenses/by/4.0/).