Abstract
Dyslexia is not easily observed from outward appearance alone; differences typically emerge through learning performance and certain behavioral indicators. This study introduces the Direction Game, a computer-based task that uses mouse-tracking to capture behavioral signals related to directional perception, a common challenge among children at risk for dyslexia. The prototype consists of language-independent mini-games targeting three main types of directional confusion and was piloted with 102 primary school students. Analyses showed that concentration-related variables, particularly attentional control and visuo-motor planning, may provide more informative indicators of risk than simple accuracy scores. Machine learning models demonstrated promising classification performance relative to standardized school screening protocols. Additionally, an exploratory analysis of mouse trajectories revealed five tentative interaction profiles: hesitation, impulsivity, deliberate processing, fluent performance, and disengagement. Together, these findings highlight the potential of a simple, game-based mouse-tracking tool to support accessible and preliminary dyslexia risk assessment in classroom environments.
1. Introduction
Learning Disabilities (LDs) are the most prevalent developmental challenges among school-aged children, affecting approximately 6–9.9% in Thailand and around 10% globally [1,2]. The three main subtypes, dyslexia, dysgraphia, and dyscalculia, are linked to specific cognitive impairments, with dyslexia accounting for roughly 80% of cases [3,4]. A key deficit in dyslexia is directional processing, which impairs spatial awareness and symbol discrimination [4,5,6,7]. Children often confuse letters, for example, “b” and “d” or “p” and “q”, and about 80% of severe cases show signs of directional confusion. These spatial difficulties frequently co-occur with phonological deficits, contributing to slow or inaccurate reading and spelling [8].
Existing computer-based tools show promise but remain limited [9,10,11,12,13,14] by expert requirements [2,3,4,15], long procedures [3,16,17], and language dependence [2,3,4,18,19]. In many regions, access to clinical diagnosis is also constrained by shortages of specialists, waiting times, and costs [1,16,17,20,21]. Game-based approaches offer engagement and allow performance tracking, but most remain outcome-focused rather than process-sensitive.
Recent studies have applied machine learning to dyslexia preliminary risk assessment using both language-dependent and independent features, along with multimodal data such as speech, handwriting, and eye movements [9,10,22,23]. Algorithms such as Support Vector Machines (SVM), Random Forest (RF), and K-Nearest Neighbors (KNN) have been widely explored [22,24,25,26,27,28,29,30,31]. Studies utilizing these models report varying success; for instance, some ensemble models (Extra Trees) achieved moderate accuracy (0.67–0.75) [25], while others combining multiple features reached high accuracy (90–92.22%) [23,32], highlighting the potential of robust classifiers for this task.
Mouse tracking has become a practical process-tracing method for capturing moment-to-moment cognitive states [33]. Kinematic features such as trajectory deviation, velocity, and pauses co-vary with uncertainty, cognitive load, and shifts in attention [34]. Prior work has linked higher cognitive loads to slower cursor speeds, more direction changes, and longer pauses, which resemble eye fixations as markers of processing effort [35,36,37]. In the context of dyslexia, processing difficulties are often reflected in prolonged and frequent fixations during reading [35,36,37]. Building on this, we hypothesize that directional confusion, a potential marker of dyslexia risk, may manifest in longer pause durations, reduced click acceleration, and increased hesitation during mouse activity.
Despite this potential, few studies have directly examined directional perception through interactive responses [38]. For instance, MusVis [25] applies machine learning but mainly targets general visual patterns (symmetries) or musical cues, rather than kinematic signals of directional processing. Likewise, other tools rely on static symmetrical or mirrored stimuli [16,20,24,25,28,39,40,41,42] (Table A1), overlooking real-time behavioral markers that reveal how children manage, or fail to manage, directional deficits. Because directional difficulties can precede academic deficits, such tasks are promising for early, preliminary risk assessment [23,32,43]. From existing studies, few tools appear to combine three key elements: (i) fine-grained kinematic behavioral analysis (click acceleration, fixation duration), (ii) a game-based format to maintain engagement, and (iii) explicit assessment of directional perception, an area particularly challenging to capture for dyslexia risk evaluation.
To address this gap, we introduce the Direction Game, a game-based task that uses mouse-tracking to capture behavioral signals related to directional confusion. The present study is designed as a preliminary feasibility study aimed at establishing the ecological validity of the proposed measurement methods within a real-world educational setting, where standardized school screening is the established ground truth. It is not presented as a definitive clinical validation study but rather as an effort to surface subtle behavioral indicators that are less visible in conventional assessments.
Specifically, this study addresses three research questions:
- (1)
- To what extent can a computer-based game utilizing only directional cues identify behavioral markers associated with dyslexia risk in young children?
- (2)
- Which additional mouse-tracking and gameplay variables provide significant predictive power beyond those used in prior studies?
- (3)
- Which classification approach, baseline models or ensemble models, yields superior performance for preliminary dyslexia risk assessment under a fivefold cross-validation framework?
The paper is structured as follows. Section 2 introduces the exploratory stage, including the pilot study and the development of the Direction Game. Section 3 presents the confirmatory stage, covering the dataset, feature extraction, and machine-learning validation. Section 4 reports the experimental results, Section 5 discusses findings and limitations, Section 6 provides recommendations, and Section 7 concludes the paper.
2. Pilot Study and Direction Game Design
Phase 1 consisted of an exploratory paper-based pilot designed to test the prototype game and evaluate the feasibility of direction-based tasks for young children. This phase aimed to gather feedback on task appropriateness and the User Interface (UI) and User Experience (UX) design of the game.
The special education experts provided guidance on the game design for screening directional confusion in young students at risk of dyslexia. The key recommendations included:
- The effectiveness of tasks for measuring directional confusion.
- The types of tasks required to accurately distinguish children with dyslexia.
- The application of a graduated task-based approach (via progressive difficulty) to differentiate typically developing children from those with persistent difficulties.
Consequently, the paper prototype was created with three mini-games reflecting sub-indicators of directional understanding. The order of these mini-games was structured according to the experts’ recommendations.
2.1. Pilot Study
Participants were recruited from two public schools in Mueang District, Lampang Province: Banpongsanook (BPN) and Suksasongkraojitaree (SKJ). BPN provided 18 second-grade students (aged 7–9), categorized as at-risk, high-performing, or average-performing. SKJ contributed six third-grade students (aged 8–10), all identified as at risk (as they were the only students in the school who met the inclusion criteria at the time). Schools were selected for variation in size, willingness to participate, and administrative support, ensuring contextual diversity.
The purposive sampling approach, guided by special education experts, was selected given the practical limitations in accessing formally diagnosed populations in Thailand. Due to the limited access to formal clinical services, such as those provided by clinical psychologists or special education assessment professionals, a common and acknowledged challenge in rural Thai schools, this approach was necessary to ensure the inclusion of at-risk students identified through school-based screening.
During administration, children were given clear explanations and group-based verbal instructions (“Draw a line from the fruit to the plate”). These tasks required sequential directional responses, which allowed the researchers to observe how students followed stepwise instructions.
The observations indicated that some at-risk students struggled with spatial tasks (drawing a line from a plate to a shelf, see Figure 1), reflecting directional confusion consistent with prior findings [7,38,44]. However, the paper-based format captured only outcomes rather than underlying processes such as hesitation or error correction.
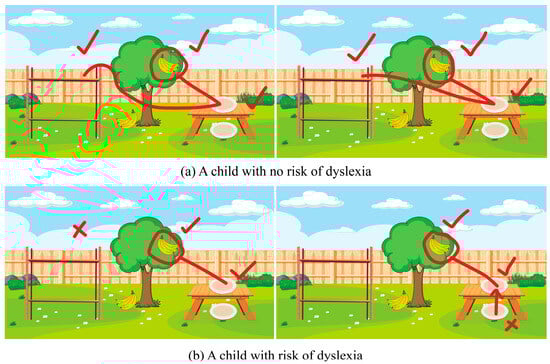
Figure 1.
Examples of directional-understanding tasks from the paper-based prototype. Red ticks indicate correct choices, and red crosses indicate incorrect ones. (a) Example response from the non-risk group, showing accurate spatial orientation. (b) Example response from the at-risk group, illustrating directional confusion through incorrect line placement or hesitation.
2.2. Game Design
Following the pilot study, the Direction Game was implemented in Unity3D (version 2021.3.20f1), incorporating the revised task structure and interface design to create a preliminary risk assessment tool for dyslexia in children. The game was designed with simple visuals, short text, and optional Thai audio to maximize accessibility for young users. Furthermore, the directional tasks are inherently language-independent and can be easily adapted to any language once the core commands are translated, thus supporting wider use across different linguistic populations.
The observed difficulty in drawing a line from one location to another, which may indicate possible directional confusion, emphasizes the need for data collection across a variety of cognitive and motor tasks. In addition to performance and accuracy-based outcomes, the game also needs to record mouse trajectories, providing supplementary motor-related data (extra movements, pauses) for later analysis [38,45]. The following section introduces the mini-games that implement these concepts.
2.3. Mini-Games
The Direction Game consists of three mini-games arranged in ascending difficulty, each addressing a distinct type of directional confusion: vertical (Up–Down), lateral (Left–Right), and cardinal orientation (North, South, East, and West). Each mini-game incorporated three levels of difficulty, easy, medium, and hard, structured across 10 rounds (3 easy, 4 medium, 3 hard). Before gameplay, children were given instructions to ensure they understood the mechanics. Examples of the three mini-games at different difficulty levels are shown in Figure 2. (The English translations of commands provided here are for publication purposes only).
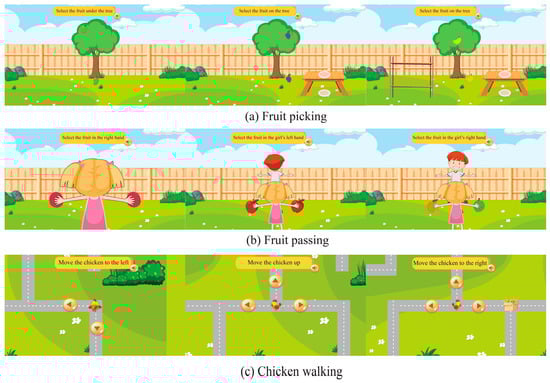
Figure 2.
An example of all three games at different difficulty levels: (a) shows the Fruit picking game; (b) shows the Fruit passing; (c) shows the Chicken walking.
Mini-game #1: Fruit Picking (Vertical Perception): This task assessed vertical confusion (up–down). Participants clicked on fruit positioned at the top or bottom of a tree (“Click on the fruit at the top of the tree”) to test their interpretation of vertical spatial cues.
Mini-game #2: Fruit Passing (Lateral Perception): This task assessed left–right confusion. Participants passed fruit to the avatar’s left or right hand, with the avatar facing either toward or away from the player (“Pass the fruit to the left hand”).
Mini-game #3: Chicken Walking (Cardinal Orientation): This task assessed cardinal orientation. Participants guided a chicken character along a map using symbolic arrows representing North, South, East, and West (“Make the chicken walk up”).
Instructions were displayed both as on-screen text and as optional audio, which can be replayed. At the end, a summary screen showed the participant’s name with options to replay or exit. Figure 3 illustrates the overall flow of gameplay in the Direction Game.
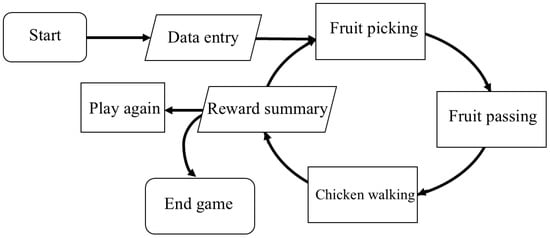
Figure 3.
Flow of gameplay in the Direction Game.
2.4. Behavioral Assessment
The pilot study enabled the transition of the Direction Game from measuring performance outcomes to measuring and controlling the process of the player’s behavior. The core challenge is separating confusion from other variables that also affect mouse trajectories. To address this, this section outlines the task conditions used to control confounding factors and the behavioral features extracted for analysis.
2.4.1. Task Conditions
The Direction Game was designed to differentiate directional confusion from general task difficulty by varying cognitive and motor demands. Task conditions were categorized by Task Difficulty (TD), Cognitive Load (CL), and Motor Load (ML). Response Latency (RL, delay before the first response), Movement Time (MT, duration of cursor movement), and Movement Jerk (variability in movement acceleration) were observed.
- (1)
- Baseline (Low load): This condition (Low TD, Low CL, and Low ML) was implemented in Mini-Game #1: Fruit Picking. This task uses fixed, absolute spatial references with minimal cognitive or motor demand, serving to establish each child’s typical, non-confused kinematic profile (characterized by fast RL, fast MT, and low jerk).
- (2)
- Motor Load Control (High motor load): This condition is a variant of Fruit Picking designed to isolate motor execution demands rather than cognitive processing. By reducing the clickable target size, the task imposes high motor load but minimal cognitive load (High TD, Low CL, High ML). The expected behavioral pattern is a fast decision (low RL) paired with a longer MT featuring a deliberate and steady trajectory. This pattern reflects physical precision effort rather than hesitation arising from cognitive confusion.
- (3)
- Cognitive Load (Directional Confusion): Two mini-games were designed to impose high cognitive load while maintaining moderate motor demands (High TD, High CL, and Medium ML), each testing distinct forms of directional confusion:
- Mini-game #2: Fruit Passing imposed higher cognitive demand through perspective-switching (avatar facing toward and away).
- Mini-game #3: Chick Walking required map-based navigation using cardinal directions, eliciting more complex planning demands.
Controlling baseline, motor load, and cognitive-load tasks provided a framework for distinguishing directional confusion from general motor or task demands. Together, these mini-games turned abstract spatial concepts into simple, engaging activities that were intended to enable child-friendly detection of directional difficulties.
2.4.2. Behavioral Features
Raw gameplay logs and mouse-tracking streams were processed to capture behavioral variables. Informed by prior studies [22,24,25,26,27,28,29,30,31], these variables were organized into three construct-driven domains: Organizational Skills (OS) [46,47], Concentration (CONC) [47,48], and Performance (PF) [49,50], which reflect task efficiency, attentional control, and outcome performance, respectively.
The detailed operationalization of these constructs, mapping them from raw data measures into 20 behavioral variables, is presented in Table A2. The complete feature extraction and engineering process is described in Section 3.4.
3. Validation Study Using Machine Learning Models
Phase 2 is a validation study designed to collect gameplay and mouse-tracking data from 102 participants for machine learning analysis.
3.1. Experimental Design
Research variables and control of confounding factors: The independent variable was group classification (at-risk and non-at-risk), while the dependent variables were behavioral features, including response time, movement dynamics, mouse clicks, and accuracy. All tasks used mouse clicks only, minimizing fine-motor demands.
Study procedure and data collection flow: Children received standardized instructions before gameplay and then completed the three mini-games targeting vertical, lateral, and cardinal directions. Data were collected in a controlled environment using notebook computers (1920 × 1080). Mouse trajectories were recorded in real time with Ogama (version 5.1, 2021), a behavioral data logging software. Motor behaviors such as extra movements or pauses were not task outcomes but were captured as supplementary data.
3.2. Participants, Process, and Tools
The participants were 102 students (ages 7–12; mean = 8.5, SD = 1.1; Grades 2–4) from Ban Pong Sanuk School, Lampang, Thailand. The school’s special-education teacher classified students as at-risk (n = 58) or non-at-risk (n = 44). All students had undergone routine school-based screening for reading and learning difficulties prior to data collection.
Standardized school screening process: In Thai primary schools, learning-difficulty screening follows a multi-week, curriculum-embedded process rather than a single assessment. In this study, all participants had undergone at least one academic term (≈4 months) of preliminary screening, including behavioral observation records, curriculum-based assessments, and Tier-1 risk-screening instruments administered by trained special-education teachers.
Screening and group classification: Classification was based on classroom observations and two standardized Tier-1 tools mandated in Thai public schools: (1) the Office of the Basic Education Commission (OBEC), Checklist for classifying the types of disabilities, a standard instrument mandated by the Ministerial Regulation B.E. 2550 (2007) requiring initial screening for eligibility to special education services, and (2) the Kasetsart University Screening Inventory (KUS-SI), developed by Kasetsart University Laboratory School (KUS) and the Faculty of Medicine Siriraj Hospital (SI). The KUS-SI has shown strong correspondence with clinical assessments (>94% diagnostic agreement; ≥90% scoring accuracy) [51,52,53,54], supporting its suitability for school-based risk identification. Although not equivalent to clinical diagnosis, these instruments represent the most feasible evidence-based approach in Thai primary schools, where access to psychologists and diagnostic services, especially in rural areas, is limited.
3.3. Data Collection and Preparation
For the classification experiments, the dataset was organized into five systematically defined feature configurations to compare predictive performance and interpretability. Here, n refers to the number of features included in each configuration.
- (1)
- Game Element Features (n = 8): In-game telemetry variables (misses, hits, score, play time).
- (2)
- Mouse-Tracking Features (n = 90): Cursor dynamics including movement, fixation duration, clicks, velocity (horizontal velocity (Vx) and vertical velocity (Vy)), and acceleration (a) along X–Y axes.
- (3)
- All Features (n = 98): Combined game-related and mouse-tracking variables.
- (4)
- Behavioral Features (n = 20): Construct-driven indicators mapped from raw features into three domains: OS, CONC, and PF, as defined in Section 3.4.
- (5)
- Selected Features (n = 18): A compact subset carried forward as the main basis for classification and subsequent analysis of interaction patterns (see Section 3.6).
To ensure validity and avoid data leakage, all preprocessing was performed within each training fold prior to model evaluation.
3.4. Feature Extraction and Engineering
Raw gameplay logs and mouse-tracking streams were processed into all quantifiable variables. To improve interpretability, we map these measures onto our behavioral framework (introduced in Section 2.4.2). These behavioral variables are grouped into our three construct-driven domains:
- (1)
- OS: Indicators of task efficiency and error control from game telemetry. Subcategories:
- Speed and Latency (SL) (Time to first click, Total play time), commonly used as indicators of task efficiency and information-acquisition timing in mouse-based attention research [47].
- Accuracy and Error Control (AEC) (Misses), consistent with accuracy deficits observed in dyslexia [46].
- (2)
- CONC: Indicators of attentional and visuo-motor control. Subcategories:
- Attentional Control (AC), which includes Fixation Behavior (FB) (Fixation duration, defined as pauses ≥ 100 ms within a 20-pixel radius), Hesitation and Re-checking (HRC) (Number of duplicate clicks, Time difference in clicks), and Exploration and Focus (EVF) (Trajectory length). These measures have been used in prior mouse-tracking and visuomotor-decision studies as indicators of hesitation, impulsive re-clicking, and cognitive load [47,48,55].
- Visuo-motor Planning and Dynamics (VMPD), which includes Movement Amplitude (MA) (Mouse movement (count)) and Kinematics (KIN) (of mouse movement (Std)). Duplicate clicks (points ≥ 2 within ≤20 pixels) were coded as repeated attempts and interpreted as corrective visuo-motor adjustments [47,48,56,57,58].
- (3)
- PF: Outcome-based indicators of accuracy and throughput. Subcategories:
- Accuracy and Error Control (AEC) (Score/success rate), a standard outcome measure in reading- and visuomotor-related performance assessments [49,50].
- Throughput (THR) (Speed (clicks/second)), commonly used as an indicator of processing efficiency and motor fluency in child–computer interaction studies [49,50].
The 20 behavioral variables (Table A2) were derived from construct-to-behavior mapping informed by prior studies on mouse-tracking and reading-related behaviors [2,3,46,47,59,60,61]. A hybrid feature-selection procedure then reduced these to the Selected-18 set (Table A3). Because many of these engineered variables reflect correlated aspects of the same visuomotor processes, six representative indicators, covering the core dimensions of OS, CONC, and PF, were chosen to summarize broader behavioral patterns. The remaining variables were retained for modeling but not emphasized due to redundancy or weaker discriminative value.
3.5. Modeling
To compare model performance for dyslexia risk classification, we tested models of varying complexity. Baseline algorithms included Gaussian Naive Bayes, Decision Tree, Support Vector Machine (SVM), AdaBoost, and Random Forest (RF). In addition, two ensemble strategies were implemented:
- Soft voting (RF + SVM): probability averaging of class posteriors.
- Stacking (RF + SVM → LR): logistic regression meta-learner for calibrated probabilities and improved robustness with small samples.
Models were selected for interpretability, efficiency, and suitability for small-sample contexts, with priority given to simpler classifiers. All experiments followed a two-stage framework: (i) feature set specification and (ii) comparative model evaluation. Models were trained and validated using stratified 5-fold cross-validation with a fixed random seed. To address class imbalance, the Synthetic Minority Oversampling Technique (SMOTE) was applied within each training fold to prevent data leakage.
3.6. Data Analysis
Before classification, descriptive and inferential analyses were performed on the 20 behavioral variables to characterize group differences (at-risk and non-at-risk). For each variable, group means and standard deviations were computed and compared using Welch’s t-test (α = 0.05). Effect sizes were calculated as Cohen’s d with 95% confidence intervals, with positive values indicating higher scores in the at-risk group. The results are summarized in Table A4, which reports statistical significance (p-values) and effect sizes for each variable. These analyses were used for feature characterization; the classification results are reported in Section 4.
Model performance was evaluated using complementary metrics. The primary metric was the Receiver Operating Characteristic and Area Under the Curve (ROC-AUC). In addition, the Area Under the Precision–Recall Curve (AUPRC) was reported to emphasize correct identification of the at-risk class under class imbalance. Accuracy, Sensitivity (Recall), Specificity, and Cohen’s κ were calculated to provide threshold-dependent measures and agreement beyond chance.
To characterize broader behavioral tendencies, six representative indicators, duplicate clicks (HRC), fixation duration (FB), accuracy (PF-AEC), misses (OS-AEC), time difference between clicks (HRC), and trajectory length (EVF), were selected to summarize performance across the three behavioral domains (OS, CONC, PF) [33,34,36,38,46,47,55,57,58]. Five exploratory profiles were hypothesized and later examined against empirical clustering results (Section 4.4). The profiles were defined as follows:
- Profile 1—Hesitation: High duplicate clicks, long fixation durations, extended click interval, and increased trajectory length.
- Profile 2—Impulsivity: High duplicate clicks, short fixation durations, short click intervals (rapid corrective movements).
- Profile 3—Deliberate processing: Low-to-moderate duplicates, long fixation durations, extended click interval, and high accuracy.
- Profile 4—Fluent performance: Low duplicates, short fixation durations, high accuracy, and minimal misses.
- Profile 5—Disengagement: Overall low engagement across fixation and duplicates, coupled with low accuracy and elevated misses.
4. Experiment Results
This section presents the empirical results of our two-stage experimental framework. All performance metrics reported are the average results from the fivefold cross-validation process, ensuring a robust and unbiased evaluation. The following analyses were performed in Phase 2, building upon the refined mini-games and behavioral features developed in Phase 1.
4.1. Optimal Feature Set Identification
To balance predictive performance and interpretability, we ranked variables using SelectK-Best (mutual information) and formed candidate subsets. Under stratified fivefold cross-validation with SMOTE applied to training splits only, we compared the compact Selected-18 against All-98, Mouse-90, Game-8, and Behavioral-20 (Table 1). Across baseline models, Selected-18 achieved the highest mean ROC-AUC; for example, SVM gives 0.815 ± 0.089, and RF gives 0.792 ± 0.093. The mean ROC–AUC of Selected-18 was higher than that of all other feature sets.

Table 1.
ROC-AUC (mean ± SD) under stratified fivefold cross-validation (positive = at-risk). Rows indicate classifiers; columns indicate feature sets.
4.2. Model Comparison and Selected Model
Using the Selected-18 feature set with stratified fivefold cross-validation (positive = at-risk), we report ROC-AUC together with AUPRC and include Sensitivity and Specificity, Accuracy, and Cohen’s κ (Table 2). Overall, SVM achieved the highest values on most metrics except AUPRC: Accuracy = 0.744 ± 0.068, Sensitivity = 0.826 ± 0.067, ROC-AUC = 0.815 ± 0.089. The RF–SVM ensembles yielded the highest AUPRCs (Voting 0.866 ± 0.092; Stacking 0.859 ± 0.089), with AUCs comparable to SVM and identical Specificity (0.639 ± 0.115). The top three models (SVM, RF, and Voting) showed overlapping confidence intervals in Figure 4. In contrast, Naive Bayes exhibited the highest specificity (0.747 ± 0.104) and the lowest sensitivity (0.377 ± 0.134).
Table 2.
Comparative performance on the Selected-18 feature set (mean ± SD; fivefold CV).
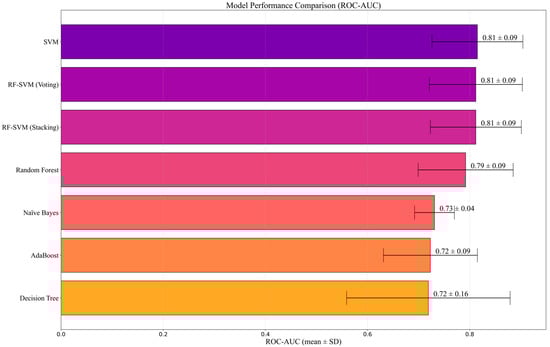
Figure 4.
Model comparison by Mean AUC using the 18-feature set (fivefold CV). Error bars denote standard deviation.
4.3. Behavioral Group Differences (Univariate Analysis)
Univariate analysis of the 20 behavioral variables (Table A2) compared the at-risk and non-at-risk groups using two-sided Welch’s t-tests. Eleven variables showed significant group differences, defined as a p-value (p) < 0.05. The practical significance of these differences was measured using Cohen’s d (d) as the effect size. The results are grouped by construct for clarity (see Table A4 for full descriptive statistics and 95% CIs).
- Kinematic Fluctuations (VMPD/KIN): Larger values in the at-risk group were observed for: acceleration of point clicks (d = 0.536, p = 0.0060), acceleration of mouse movement (Std) (d = 0.442, p = 0.0189), maximum click velocity (d = 0.450, p = 0.0130), horizontal click-velocity variability (Vx, Std) (d = 0.361, p = 0.0462), and maximum vertical mouse velocity (Vy, Max) (d = 0.493, p = 0.0141).
- Attentional Control (AC): The at-risk group showed more duplicate points (d = 0.513, p = 0.0101) and a longer fixation duration (d = 0.462, p = 0.0330), together with shorter minimum inter-click intervals (d = −0.426, p = 0.0351).
- Planning and Path (VMPD/MA, EVF): The mouse-movement count was higher in the at-risk group (d = 0.459, p = 0.0165), and the trajectory length was greater in the at-risk group (d = 0.488, p = 0.0141).
- Organizational or error control: Misses were more frequent in the at-risk group (d = 0.429, p = 0.0336).
4.4. Behavioral Interaction Profiles (Exploratory)
To examine whether the hypothesized behavioral profiles were observable in the data, exploratory clustering was performed using K-means (K = 4). Six representative indicators were designated across four behavioral constructs: HRC, FB, AEC, and EVF. This unsupervised approach grouped children based on similarity in interaction patterns rather than predefined labels.
The clustering solution produced four groups with distinct variable patterns (Figure 5). Cluster 0 showed elevated duplicate clicks and higher misses. Cluster 1 showed higher accuracy with lower misses. Cluster 2 was characterized by an increased mouse trajectory length. Cluster 3 showed extended fixation durations and longer time differences between clicks.
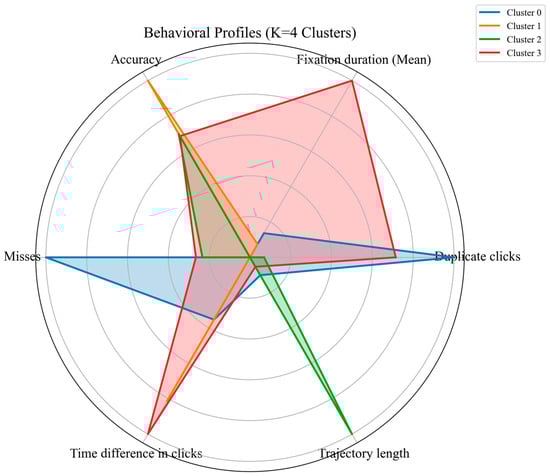
Figure 5.
Behavioral interaction profiles from K-means clustering (K = 4).
Exploratory clustering indicated that the hypothesized profiles were represented in the observed data with varying prominence. At-risk children appeared more frequently in Clusters 0 and 3, whereas non-at-risk children were more often observed in Clusters 1 and 2. The correspondence between clusters and the five behavioral profiles is summarized in Table A5.
5. Discussion
We evaluated the Direction Game, designed to distinguish directional confusion from motor difficulty. Framed by three behavioral domains: OS, CONC, and PF, the most informative signals in this dataset were found within the CONC domain, especially AC and VMPD, while PF contributed little. These results are consistent with the experimental rationale and indicate that mouse-tracking can capture behavioral markers relevant to early screening.
5.1. Interpretation of Key Findings
As shown in Table 1, the Selected-18 consistently offered the best balance between predictive performance and interpretability. This outcome highlights the value of combining construct-driven mapping with statistical filtering when deriving behavioral indicators.
Model selection. While the top three models (SVM, RF–SVM Voting, and RF–SVM Stacking, as shown in Table 2 and Figure 4) showed no statistically significant differences, SVM was retained as the reference model. It offered simplicity, lower computational cost, and relative robustness under modest sample conditions, which is preferable at the feasibility stage where marginal gains from ensembles may not justify added complexity. In contrast, Naive Bayes produced the highest specificity but substantially lower sensitivity, indicating a tendency to under-identify at-risk students, an unfavorable trade-off for Tier-1 screening contexts where capturing potential risk cases is prioritized.
Behavioral and outcome features. Differences between at-risk and non-at-risk children were more apparent in fine-grained mouse-interaction measures than in overall task accuracy. This was expected by design: the task difficulty was intentionally kept low so that both groups could achieve similar accuracy, allowing process-level behaviors, such as extended fixations, higher duplicate clicks, or longer trajectories (Table A3 and Table A4), to become more observable. Within the Concentration domain, these patterns were consistent with behaviors observed during gameplay, including slower decision transitions and repeated clicking during movement delays. These observations reflect interaction tendencies within the task environment and are not interpreted as indicators of underlying cognitive mechanisms.
Behavioral interaction profiles. Exploratory clustering of six behavioral variables revealed patterns resembling hesitation, impulsivity, deliberate processing, fluent performance, and disengagement (Figure 5, Table A5). Hesitation (Cluster 3) showed prolonged fixations and extended cursor trajectories, consistent with decision uncertainty [33,36,47,55]. The Impulsivity pattern (Cluster 0) exhibited rapid duplicate clicks, short click intervals, and many misses [57,58]; however, these behaviors may also reflect frustration, low confidence, motor difficulties, or misunderstanding of instructions, as supported by previous research [57,58,62]. Disengagement was less distinct, with low engagement but relatively high accuracy, suggesting task demands were insufficient to elicit typical performance drops. At-risk children were more often in clusters with longer trajectories, prolonged fixations, higher duplicate clicks, short intervals, and more misses, whereas non-at-risk children showed shorter trajectories, fewer fixations, lower duplicate clicks, and fewer misses. These raw behavioral indicators serve as preliminary signals for early risk assessment rather than diagnostic evidence.
Evaluation trade-offs. Complementary metrics (ROC–AUC, AUPRC, sensitivity, specificity, accuracy, and Cohen’s κ) helped characterize model behavior under class imbalance. These metrics revealed expected trade-offs between identifying more at-risk cases and minimizing false-positives. For Tier-1 screening, prioritizing sensitivity may be acceptable as long as the false-positive rate remains manageable.
Overall, the findings indicate that the Direction Game can capture interaction-level signals beyond outcome accuracy, indicate suitable model options for small-sample feasibility testing, and reveal observable interaction styles. Collectively, these results offer preliminary evidence that process-level behavioral analysis may support early risk identification in school-based Tier-1 settings.
5.2. Benchmarking Against Existing Dyslexia Screening Tools
Existing non-linguistic tools, such as MusVis or Whac-A-Mole variants, typically emphasize outcome-level measures (accuracy or response time) and rely on static visual or symbolic cues [25,30]. In contrast, the Direction Game captured process-level interaction signals through mouse tracking, which may reflect aspects of attentional control and planning effort, as suggested by prior research (see Table A3 and Table A4). This extends prior work linking mouse dynamics to cognitive states [33,34,35,36,37] while retaining a simple, low-resource format suitable for Tier-1 school contexts.
Other tools remain constrained by language dependence or specific age ranges (GraphoLearn, Lucid Rapid, Askisi-Lexia, Galexia, Fluffy) [20,22,40,42,63,64]. By comparison, the Direction Game requires only minimal linguistic mediation, making it potentially more adaptable in multilingual classrooms.
Finally, systems such as Beat by Beat demonstrate the potential of multimodal sensing but require costly hardware and setup [19]. The present approach offers a low-overhead alternative (PC + mouse) that may later be integrated into broader multimodal frameworks. Comparative performance claims are beyond the scope of this study.
5.3. Limitations
This feasibility study has several limitations. First, the sample was purposive and drawn from a single school, with an at-risk proportion higher than the typical prevalence. This limits generalizability and introduces potential selection bias. The class distribution was also inverted relative to real-world screening (more at-risk than non-at-risk). Although SMOTE was applied during training, such rebalancing may influence threshold-dependent metrics.
Second, model performance was based solely on internal cross-validation. External validation, clinical benchmarking, and longitudinal follow-up were not conducted. The modest sample size further constrains reliability, and test–retest stability was not examined.
Third, the measurement context imposes constraints. Mouse-tracking was analyzed without concurrent neuropsychological validation, and unmeasured confounders, such as motor difficulties, attention problems, or device familiarity, may have influenced the results. The sessions were brief and conducted on standard PCs with minimal supervision. Post-task interviews or detailed behavioral observations were not included, limiting confirmation of whether specific patterns (rapid duplicate clicks) reflected cognitive impulsivity or situational factors such as frustration or misunderstanding.
Fourth, participant classification relied on school-based OBEC and KUS-SI screening rather than clinical diagnosis. Although this approach does not include biological or clinical confirmation, it adheres to standardized educational screening protocols. Therefore, predictive performance should be interpreted within the context of these educational standards rather than as a substitute for clinically validated diagnoses.
Fifth, behavioral features used in clustering were derived from the same raw interaction data and may be correlated, challenging the independence assumption of K-means. Clusters should be interpreted as exploratory profiles of response styles rather than distinct latent classes.
Finally, multiple univariate comparisons were performed; although effect sizes were reported, this may not fully account for Type I error. Predictive performance should be interpreted relative to the school-based screening labels (OBEC, KUS-SI) used for classification and not as equivalent to confirmed clinical diagnoses. These findings represent preliminary feasibility evidence rather than definitive diagnostic accuracy.
6. Recommendations for Practice and Research
These recommendations aim to address the methodological and contextual gaps identified earlier, outlining priorities for future validation and potential pathways for classroom integration.
6.1. Recommendations for Research
- Clinical benchmarking. Future studies could compare the Direction Game with established clinical diagnostic instruments to evaluate predictive accuracy and clarify its potential role as a screening tool, without implying equivalence to medical diagnosis.
- Stratified random sampling: Employing stratified random sampling across multiple sites can help reduce bias and improve representativeness.
- Behavioral validation: Future research could explore complementary qualitative approaches (e.g., interviews or observations) to provide additional context, although such methods were beyond the scope of the present feasibility study.
- Advanced modeling: Exploring temporal and deep learning approaches (Long Short-Term Memory (LSTM), Transformer) to capture sequential behavioral patterns more effectively.
- Multimodal integration: Combining mouse-tracking with complementary modalities such as eye-tracking or executive function tasks to enhance interpretability.
- Language-independent design: Developing and testing a version that minimizes language dependence by using non-linguistic cues, enabling broader applicability.
6.2. Recommendations for Practice
- Exploratory classroom trials: Conducting small-scale pilot studies with teachers to assess usability, supervision needs, and integration into classroom routines.
- Teacher-friendly dashboards: Prototype dashboards that present outputs as provisional indicators and suggested supports, avoiding overinterpretation.
- Adaptive game design: Including adjustable difficulty levels to accommodate diverse attention spans and learning needs.
- Integration into RTI frameworks: Examining the feasibility of incorporating the game into Tier-1 Response-to-Intervention (RTI) processes while emphasizing that diagnostic assessment remains essential.
- Professional development: Designing training modules to help teachers interpret outputs cautiously and link them to observable behaviors.
Priority for future research: Clinical benchmarking is essential to calibrating operating points under real-world prevalence and to assessing the added value of mouse-tracking relative to existing educational screening methods. Multi-site, stratified samples will be required before considering broader adoption in educational or clinical contexts.
7. Conclusions
This study examined the preliminary feasibility of the Direction Game, a game-based task using mouse tracking for the school-based screening of at-risk students. Phase 1 focused on developing directional tasks, while Phase 2 applied machine learning models to evaluate behavioral features.
The findings offered initial insights into the Research Questions (RQ):
- RQ1: Process-level interaction measures showed clearer group differences than outcome-level scores, suggesting their potential relevance for identifying interaction patterns associated with risk status, though further validation is required.
- RQ2: A compact statistically filtered subset (Selected-18), which emphasized interaction measures, yielded more consistent improvements than larger feature sets, supporting the value of reducing complexity while retaining predictive power.
- RQ3: Among the leading models, overall performance was broadly comparable. SVM was used as a practical reference because of its simplicity and suitability for small-sample contexts, while ensemble methods remain viable when added complexity is acceptable.
Exploratory analysis also indicated tentative interaction profiles (impulsivity-like or hesitation patterns). However, as noted in the limitations, these should be interpreted as behavioral response styles rather than distinct clinical subtypes and require further validation with larger, clinically assessed samples.
The behavioral indicators identified here provide preliminary signals that may support the design of game-based tools to complement teacher-led questionnaire screenings in Tier-1 assessments. By adding objective behavioral data to subjective evaluations, such tools could strengthen early identification in schools, though further validation is still required.
Author Contributions
Conceptualization, N.T. and L.R.; methodology, N.T., S.R. and L.R.; software, S.R.; validation, N.T., K.C. and L.R.; formal analysis, N.T.; investigation, N.T. and N.E.; resources, N.E. and S.R.; data curation, N.T.; writing, original draft preparation, N.T.; writing, review and editing, K.C. and L.R.; visualization, N.T. and S.R.; supervision, L.R.; project administration, L.R. All authors have read and agreed to the published version of the manuscript.
Funding
This research received no external funding.
Institutional Review Board Statement
The study was conducted in accordance with the Declaration of Helsinki and approved by the Research Ethics Committee of Chiang Mai University, Thailand (protocol code CMUREC 64/004; approval date: 12 January 2021). All procedures followed standard ethical safeguards for research with children.
Informed Consent Statement
Informed consent was obtained from all subjects involved in the study. Written informed consent was obtained from parents or legal guardians of minor participants; child verbal assent was obtained before participation.
Data Availability Statement
Deidentified data underlying the results are not publicly available due to ethical and privacy restrictions involving child participants (Thai school settings; IRB CMUREC 64/004). Data (and analysis scripts, if requested) can be shared by the corresponding author upon reasonable request for academic, non-commercial purposes and subject to a data use agreement and institutional approval. Requests for data access should be directed to natsinee1984@gmail.com.
Acknowledgments
We thank the Graduate School and the Department of Computer Engineering, Faculty of Engineering, Chiang Mai University, and Lampang Rajabhat University for institutional support. We also thank Mahafun Co., Ltd. for permission to use fruit illustrations. Generative AI tools (ChatGPT (GPT-5, Pro version), Gemini Pro (Student), and Microsoft Copilot (GPT-5 model)) were used only to assist with English language editing; the study design, experiments, analyses, and conclusions were solely the authors’ work.
Conflicts of Interest
The authors declare no conflicts of interest.
Appendix A
This appendix provides supplementary tables that contain detailed information supporting the results and methodology discussed in the main text. These tables were moved to the appendix to improve the readability of the manuscript while retaining access to complete data. Specifically,
- Table A1 presents Indicators of visual and directional processing in game-based screening for language independence.
- Table A2 summarizes the mapping between behavioral constructs and the measured variables adopted in this study.
- Table A3 describes the selected 18 features with their behavioral categories, operational definitions, and measurement units.
- Table A4 reports detailed statistical comparisons of behavioral variables between risk and non-at-risk groups, including means, standard deviations, p-values, effect sizes, and confidence intervals.
- Table A5 maps exploratory behavioral profiles to represent behavioral variables and supporting literature.
Table A1.
Indicators of visual and directional processing in game-based screening for language independence.
Table A1.
Indicators of visual and directional processing in game-based screening for language independence.
| Games | Years | Indicators of Visual and Directional Processing | |||||
|---|---|---|---|---|---|---|---|
| 1 | 2 | 3 | 4 | 5 | 6 | ||
| Dleksia Game [16] | 2017 | √ | √ SO | ||||
| DD [41] | 2017 | √ OC | √ | √ T | |||
| DGames [30] | 2018 | √ | √ | √ | |||
| DysPuzzle [45] | 2019 | √ | √ R | √ | |||
| PR Game [28] | 2022 | √ MR | √ | ||||
| MusVis [25] | 2025 | √ | √ S/O | √ | |||
| Direction Game | 2025 | √ | √ K | √ CF | |||
Notes—Directional Perception: The ability to recognize and distinguish basic directions (up, down, left, right) without relying on language or complex mental rotation, Feature Key: 1 = Visual Discrimination; 2 = Visual-Spatial Orientation/Rotation; 3 = Visual-Spatial Attention; 4 = Working Memory (Visuo-Spatial); 5 = Motor Skill/Coordination; 6 = Directional Perception. Indicators: SO = Spatial Orientation; OC = open vs. closed circle; T = Tracing; R = Rotation; MR = Mental Rotation; S/O = Symmetry/Orientation; K = Kinematics; CF = Core focus.
Table A2.
Mapping of behavioral constructs to measured variables.
Table A2.
Mapping of behavioral constructs to measured variables.
| No. | Key Behavioral | Category | Subcategory | Variable |
|---|---|---|---|---|
| 1 | OS | TPO | SL | Time to first click |
| 2 | OS | TPO | SL | Total play time |
| 3 | OS | TPO | AEC | Misses |
| 4 | PF | TPO | AEC | Mouse clicks |
| 5 | PF | TPO | AEC | Score/success rate |
| 6 | PF | TPO | THR | Speed (clicks/second) |
| 7 | CONC | AC | FB | Fixation duration |
| 8 | CONC | AC | FB | Number of fixation durations |
| 9 | CONC | AC | HRC | Number of duplicate clicks |
| 10 | CONC | AC | HRC | Number of distinct clicks |
| 11 | CONC | AC | HRC | Time difference in clicks |
| 12 | CONC | AC | EVF | Trajectory length |
| 13 | CONC | VMPD | MA | Mouse movement (count) |
| 14 | CONC | VMPD | KIN | V of a point click (Max) |
| 15 | CONC | VMPD | KIN | Vx of a point click (Std) |
| 16 | CONC | VMPD | KIN | Vx of mouse movement (Mean) |
| 17 | CONC | VMPD | KIN | Vy of mouse movement (Max) |
| 18 | CONC | VMPD | KIN | ɷ of point click (Min) |
| 19 | CONC | VMPD | KIN | a of point clicks (Mean) |
| 20 | CONC | VMPD | KIN | a of mouse movement (Std) |
Notes—Key Behavioral: OS = Organizational Skills; PF = Performance; CONC = Concentration. Category: TPO = Task Performance and Organization; AC = Attentional Control; VMPD = Visuo-motor Planning and Dynamics. Subcategory: SL = Speed/latency; AEC = Accuracy and error control; THR = Throughput; FB = Fixation behavior; HRC = Hesitation and re-checking; EVF = Exploration vs. focus; MA = Movement amplitude; KIN = Kinematics.
Table A3.
Descriptions of behavioral features and measurement units.
Table A3.
Descriptions of behavioral features and measurement units.
| Name of Feature | Behavioral Area | Description | Unit |
|---|---|---|---|
| Mouse movement | Concentration | The total number of recorded (x,y) pixel coordinates through which the mouse cursor traveled during gameplay. | count |
| Mouse clicks | Performance/Concentration | The total number of instances where the mouse button was clicked. | count |
| Age | Player Profile | Player’s chronological age. | years |
| Fixation duration | Organizational Skills/Concentration | The total duration, in milliseconds, during which the mouse cursor remains relatively motionless (i.e., movement below a defined pixel threshold) at a specific pixel location. | milliseconds |
| Number of duplicate clicks | Organizational Skills/Concentration | The count of instances where the mouse cursor was clicked multiple times at the same pixel location within a short interval. | count |
| Vx of a point click (Std) | Concentration | The standard deviation of the horizontal speed (Vx) of the mouse cursor, specifically at the moment of a click. | pixels/millisecond |
| V of a point click (Max) | Concentration | The maximum overall speed (magnitude of velocity vector) of the mouse cursor, specifically at the moment of a click. | pixels/millisecond |
| Vx of mouse movement (Mean) | Concentration | The average horizontal speed (Vx) of the mouse cursor during its movement. | pixels/millisecond |
| Vy of mouse movement (Max) | Concentration | The maximum vertical speed (Vy) of the mouse cursor during its movement. | pixels/millisecond |
| ω of point click (Min) | Concentration | The minimum angular velocity of the mouse cursor during clicks, typically measured in radians per millisecond. This indicates rotational movement characteristics at the point of click. | radians/millisecond |
| a of point clicks (Mean) | Concentration | The average acceleration of the mouse cursor, specifically at the moment of a click. | pixels/millisecond2 |
| a of mouse movement (Std) | Concentration | The standard deviation of the acceleration of the mouse cursor during its overall movement. | pixels/millisecond2 |
| Score | Performance | The score value is calculated as the number of correct responses (Hits) divided by the total number of answers attempted. | dimensionless |
| Time | Organizational Skills/Concentration | The total time spent by the player to complete the entire game session, measured in seconds. | seconds |
| Time difference in clicks | Organizational Skills/Concentration | The time interval, in milliseconds, between consecutive clicks made by the player. | milliseconds |
| Misses | Organizational Skills | The total number of incorrect clicks or selections made by the player during the game. | count |
| Speed | Performance | The click speed, calculated as the total number of clicks divided by the total time taken for the clicks, is expressed in clicks per second. | clicks/second |
| Per | Performance | The player’s overall game performance or gaming ability, often a composite score reflecting accuracy and efficiency. | dimensionless |
| Total | 18 |
Table A4.
Statistical analysis of behavioral variables between risk and non-at-risk groups.
Table A4.
Statistical analysis of behavioral variables between risk and non-at-risk groups.
| Variables | Risk | Non-At-Risk | p-Value | Cohen’s d | 95% Confidence Interval | ||
|---|---|---|---|---|---|---|---|
| (1) Time before clicking (seconds) | 13.80 | 2.76 | 13.51 | 2.70 | 0.5935 | 0.107 | [−0.285, 0.498] |
| (2) Time (seconds) | 451.75 | 145.45 | 462.65 | 122.87 | 0.6829 | −0.080 | [−0.471, 0.312] |
| (3) Misses (count) | 15.44 | 9.93 | 11.22 | 9.68 | 0.0336 | 0.429 | [0.030, 0.822] |
| (4) Number of fixation duration (count) | 240.77 | 45.66 | 227.81 | 40.06 | 0.1311 | 0.299 | [−0.097, 0.690] |
| (5) Number of duplicate clicks (count) | 9644.46 | 1689.81 | 8826.04 | 1458.98 | 0.0101 | 0.513 | [0.111, 0.907] |
| (6) Number of distinct clicks (count) | 3381.48 | 846.98 | 3420.52 | 1008.23 | 0.8363 | −0.042 | [−0.434, 0.349] |
| (7) Fixation duration (milliseconds) | 48,773.67 | 11,125.26 | 44,563 | 8545.97 | 0.0330 | 0.462 | [0.017, 0.809] |
| (8) Time difference in clicks (Min) (milliseconds) | 46.55 | 40.67 | 63.64 | 39.42 | 0.0351 | −0.4256 | [−0.8186,−0.0262] |
| (9) Mouse movement (count) | 13,026.94 | 1982.17 | 12,247.56 | 1226.55 | 0.0165 | 0.4587 | [0.0584,0.8522] |
| (10) Trajectory length (pixels) | 560,178.44 | 90,393.28 | 519,017.04 | 75,765.52 | 0.0141 | 0.4876 | [0.0864,0.8815] |
| (11) Speed (V) of mouse movement (Mean) (pixels/milliseconds) | 0.131 | 0.080 | 0.116 | 0.055 | 0.2885 | 0.201 | [−0.135, 0.537] |
| (12) The angular velocity (ɷ) of the point click (Min) | 0.040 | 0.013 | 0.037 | 0.009 | 0.1870 | 0.266 | [−0.070, 0.602] |
| (13) Speed (clicks/second) | 0.19 | 0.05 | 0.18 | 0.04 | 0.1903 | 0.279 | [−0.057, 0.615] |
| (14) Score | 0.83 | 0.08 | 0.86 | 0.08 | 0.0520 | −0.375 | [−0.712, −0.038] |
| (15) Performance | 0.69 | 0.22 | 0.69 | 0.18 | 0.8470 | 0 | [−0.330, 0.330] |
| (16) a of point clicks (Mean) (pixels/milliseconds2) | 0.23 | 1.10 | −0.30 | 0.77 | 0.0060 | 0.536 | [0.133, 0.930] |
| (17) Vy of mouse movement (Max) (pixels/milliseconds) | 5.89 | 2.45 | 4.73 | 2.20 | 0.0141 | 0.493 | [0.091, 0.886] |
| (18) a of mouse movement (Std) (pixels/milliseconds2) | 0.19 | 1.18 | −0.25 | 0.64 | 0.0189 | 0.442 | [0.043, 0.836] |
| (19) Vx of a point click (Std) (pixels/milliseconds) | 0.08 | 0.07 | 0.06 | 0.02 | 0.0462 | 0.361 | [−0.037, 0.753] |
| (20) V of a point click (Max) (pixels/milliseconds) | 0.80 | 0.94 | 0.48 | 0.26 | 0.0130 | 0.450 | [0.050, 0.844] |
Table A5.
Mapping of exploratory behavioral profiles to behavioral variables and supporting literature.
Table A5.
Mapping of exploratory behavioral profiles to behavioral variables and supporting literature.
| Cluster | Profile | Behavioral Signature | Representative Variables |
|---|---|---|---|
| Cluster 3 | Hesitation ([33,36,47,55]) | Slow, high uncertainty | Fixation ↑, Click interval ↑, Trajectory ↑ |
| Cluster 0 | Impulsivity ([34,46,56,57,58]) | Fast correction bursts, error-prone | Duplicate clicks ↑, Click interval ↓, Misses ↑ |
| Cluster 2 | Deliberate Processing ([35,37]) | Careful, effortful planning | Fixation ↑, Trajectory ↑, Accuracy ↑ |
| Cluster 1 | Fluent Performance ([49,50]) | Efficient, smooth control | Accuracy ↑, Fixation ↓, Misses ↓ |
| No dominant | Disengagement ([48,60]) | Low effort, low accuracy | Fixation ↓, Duplicate clicks ↓, Accuracy ↓ |
Note: Fixation = fixation duration (FB); Click interval = time difference between clicks (HRC); Trajectory = trajectory length (EVF); Duplicate clicks = number of duplicate clicks (HRC); Accuracy = PF − AEC; Misses = OS − AEC.
References
- Piyasil, V.; Wangsan, S. Learning Disorders and Comorbidity. J. Psychiatr. Assoc. Thailand 2015, 60, 287–296. [Google Scholar]
- Rauschenberger, M.; Baeza-Yates, R.; Rello, L. Technologies for Dyslexia. In Web Accessibility: A Foundation for Research; Springer: London, UK, 2019; pp. 603–627. [Google Scholar] [CrossRef]
- Srihirunratsamee, S. Dyslexia (โรคดิสเลกเซีย). Available online: https://th.rajanukul.go.th/_admin/file-download/review0000029.pdf (accessed on 25 November 2025). (In Thailand).
- Ebere, C.S. Understanding Dyslexia; Department of Social Work, University of Nigeria: Nsukka, Nigeria, 2015. [Google Scholar] [CrossRef]
- Siriratraka, T. L.D.—Learning Disabilities. Available online: https://th.rajanukul.go.th/preview-3590.html (accessed on 25 November 2025).
- Williams, C.; Northstone, K.; Sabates, R.; Feinstein, L.; Emond, A.; Dutton, G.N. Visual perceptual difficulties and under-achievement at school in a large community-based sample of children. PLoS ONE 2011, 6, e14772. [Google Scholar] [CrossRef]
- Directional Confusion May Be a Sign of Dyslexia—Edublox Online Tutor. Available online: https://www.edubloxtutor.com/directional-confusion-may-sign-dyslexia/ (accessed on 14 April 2025).
- Gooddy, W. Delayed Development of Speech with Special Reference to Dyslexia. Proc. R. Soc. Med. 1963, 56, 206–209. [Google Scholar] [CrossRef]
- Fink, N. Explainable YOLO-Based Dyslexia Detection in Synthetic Handwriting Data. arXiv 2025, arXiv:2501.15263. [Google Scholar] [CrossRef]
- Robaa, M.; Balat, M.; Awaad, R.; Omar, E.; Aly, S.A. Explainable AI in Handwriting Detection for Dyslexia Using Transfer Learning. arXiv 2024, arXiv:2410.19821. [Google Scholar]
- Toki, E.I. Using Eye-Tracking to Assess Dyslexia: A Systematic Review of Emerging Evidence. Educ. Sci. 2024, 14, 1256. [Google Scholar] [CrossRef]
- Nilsson Benfatto, M.; Öqvist Seimyr, G.; Ygge, J.; Pansell, T.; Rydberg, A.; Jacobson, C. Screening for Dyslexia Using Eye Tracking during Reading. PLoS ONE 2016, 11, e0165508. [Google Scholar] [CrossRef]
- Rello, L.; Miguel, B. Detecting Readers with Dyslexia Using Machine Learning with Eye Tracking Measures. In Proceedings of the 12th International Web for All Conference, Florence, Italy, 18–20 May 2015. [Google Scholar] [CrossRef]
- Molfese, D.L. Predicting dyslexia at 8 years of age using neonatal brain responses. Brain Lang. 2000, 72, 238–245. [Google Scholar] [CrossRef] [PubMed]
- Snowling, M.J. From language to reading and dyslexia. Dyslexia 2001, 7, 37–46. [Google Scholar] [CrossRef]
- Hassan, Z.; Mohtaram, S.; Pee, N.C.; Shibghatullah, A.S. Dleksia Game: A mobile dyslexia screening test game to screen dyslexia using Malay language instruction. Asian J. Inf. Technol. 2017, 16, 1–6. Available online: https://www.makhillpublications.co/view-article/1682-3915/ajit.2017.1.6 (accessed on 25 November 2025).
- Tarmezi, A.S.B.M.; Hamid, S.S.A.; Radzuan, N.F.B.M.; Ismail, Z.B.; Kamaludin, A.B.; Mohamad, M.A.B.; Mahmud, M. Development of the Game-Based Pre-Screening Test for Students with Dyslexia. J. Comput. Sci. Comput. Math. 2023, 13, 133–145. Available online: https://www.jcscm.net/cms/?action=showpaper&id=2304337 (accessed on 25 November 2025).
- Vasalou, A.; Khaled, R.; Holmes, W.; Gooch, D. Digital games-based learning for children with dyslexia: A social constructivist perspective on engagement and learning during group game-play. Comput. Educ. 2017, 114, 175–192. [Google Scholar] [CrossRef]
- Alvarez-Molina, K.; Martínez-Miranda, J.; Martínez-García, A.I.; Caro, K. Beat by Beat: Designing a Rhythm Game for Screening Dyslexia. ReCIBE 2024, 13, E5–E10. [Google Scholar] [CrossRef]
- Maassen, B.A.M.; Glatz, T.; Borleffs, E.; Martínez, C.; de Groot, B.J.A. Digital game-based learning for dynamic assessment and early intervention targeting reading difficulties: Cross-linguistic studies of GraphoLearn. Clin. Linguist. Phon. 2025, 39, 576–601. [Google Scholar] [CrossRef]
- Jap, B.A.J.; Borleffs, E.; Maassen, B.A.M. Towards identifying dyslexia in Standard Indonesian: The development of a reading assessment battery. Read. Writ. 2017, 30, 1729–1751. [Google Scholar] [CrossRef] [PubMed]
- Kariyawasam, R.; Nadeeshani, M.; Hamid, T.; Subasinghe, I.; Ratnayake, P. A Gamified Approach for Screening and Intervention of Dyslexia, Dysgraphia and Dyscalculia. In Proceedings of the 2019 International Conference on Advancements in Computing, ICAC 2019, Malabe, Sri Lanka, 5–6 December 2019; pp. 156–161. [Google Scholar] [CrossRef]
- Kothapalli, P.K.V.; Rathikarani, V.; Nookala, G.K.M. Prediction of dyslexia and attention deficit and hyperactivity disorder prediction using ensemble classifier model. Int. J. Syst. Assur. Eng. Manag. 2022, 1–12. [Google Scholar] [CrossRef]
- Puritat, K.; Atsawakornkan, T.; Intawong, K. Using a Screening Risk of Dyslexia Game to Evaluate Students with Learning Disabilities Through the Use of Language-Independent Content and Machine Learning. In Proceedings of the 2023 Joint International Conference on Digital Arts, Media and Technology with ECTI Northern Section Conference on Electrical, Electronics, Computer and Telecommunications Engineering (ECTI DAMT & NCON), Phuket, Thailand, 22–25 March 2023; pp. 234–237. [Google Scholar] [CrossRef]
- Rauschenberger, M.; Baeza-Yates, R.; Rello, L. Screening Dyslexia Using Visual Auditory Computer Games and Machine Learning. IEEE Access 2025, 13, 29541–29553. [Google Scholar] [CrossRef]
- Jan, T.G.; Khan, S.M. A Systematic Review of Research Dimensions Towards Dyslexia Screening Using Machine Learning. J. Inst. Eng. 2023, 104, 511–522. [Google Scholar] [CrossRef]
- Drigas, A.S.; Politi-Georgousi, S. ICTs as a distinct detection approach for dyslexia screening: A contemporary view. Int. J. Online Biomed. Eng. 2019, 15, 46–60. [Google Scholar] [CrossRef]
- Tangsiripaiboon, N.; Ramingwong, L.; Ramingwong, S. Screening for The Risk of Dyslexia in Children through a Redesigned Game. In Proceedings of the ITC-CSCC 2022—37th International Technical Conference on Circuits/Systems, Computers and Communications, Phuket, Thailand, 5–8 July 2022; pp. 423–426. [Google Scholar] [CrossRef]
- Rello, L.; Williams, K.; Ali, A.; White, N.C.; Bigham, J.P. Dytective: Towards detecting dyslexia across languages using an online game. In Proceedings of the W4A 2016—13th Web for All Conference, Montreal, QC, Canada, 11–13 April 2016. [Google Scholar] [CrossRef]
- Rauschenberger, M.; Rello, L.; Baeza-Yates, R.; Bigham, J.P. Towards language independent detection of dyslexia with a web-based game. In Proceedings of the 15th Web for All Conference: Internet of Accessible Things, W4A 2018, Lyon, France, 23–25 April 2018. [Google Scholar] [CrossRef]
- Rauschenberger, M.; Baeza-Yates, R.; Rello, L. A Universal Screening Tool for Dyslexia by a Web-Game and Machine Learning. Front. Comput. Sci. 2022, 3, 628634. [Google Scholar] [CrossRef]
- AlGhamdi, A.S. Novel Ensemble Model Recommendation Approach for the Detection of Dyslexia. Children 2022, 9, 1337. [Google Scholar] [CrossRef]
- Freeman, J.B.; Ambady, N. MouseTracker: Software for studying real-time mental processing using a computer mouse-tracking method. Behav. Res. Methods 2010, 42, 226–241. [Google Scholar] [CrossRef]
- Grimes, M.; Valacich, J.S.; Grimes, G.M. Mind Over Mouse: The Effect of Cognitive Load on Mouse Movement Behavior. 2015. Available online: https://www.researchgate.net/publication/320471876 (accessed on 25 November 2025).
- Yagle, K.; Richards, T.; Askren, K.; Mestre, Z.; Beers, S.; Abbott, R.; Nagy, W.; Boord, P.; Berninger, V. Relationships between Eye Movements during Sentence Reading Comprehension, Word Spelling and Reading, and DTI and fMRI Connectivity in Students with and without Dysgraphia or Dyslexia. J. Syst. Integr. Neurosci. 2017, 3, 10-15761. [Google Scholar] [CrossRef]
- Maldonado, M.; Dunbar, E.; Chemla, E. Mouse tracking as a window into decision making. Behav. Res. Methods 2019, 51, 1085–1101. [Google Scholar] [CrossRef] [PubMed]
- Liu, J.C.; Li, K.A.; Yeh, S.L.; Chien, S.Y. Assessing Perceptual Load and Cognitive Load by Fixation-Related Information of Eye Movements. Sensors 2022, 22, 1187. [Google Scholar] [CrossRef]
- Papatheodorou, N.; Kouroupetroglou, G.; Pino, A.; Giannopoulos, P.A.; Makris, G.; Papageorgiou, C. Hand dexterity assessment based on mouse pointer trajectory measurements in children with learning disabilities. Univers. Access Inf. Soc. 2021, 20, 321–331. [Google Scholar] [CrossRef]
- Fung, K.-Y.; Tang, K.-Y.; Lui, T.L.R.; Sin, K.-F.; Lee, L.-H.; Qu, H.; Song, S. ADPS—A Prescreening Tool for Students with Dyslexia in Learning Traditional Chinese. IEEE Trans. Learn. Technol. 2024, 17, 1454–1470. [Google Scholar] [CrossRef]
- Zygouris, N.C.; Vlachos, F.; Styliaras, S.K.; Tziallas, G.D.; Avramidis, E. Validation of the Askisi-Lexia neuropsychological web-based screener: A neuropsychological battery for screening cognitive and phonological skills of children with dyslexia. Appl. Neuropsychol. Child 2025, 1–17. [Google Scholar] [CrossRef] [PubMed]
- Gaggi, O.; Palazzi, C.E.; Ciman, M.; Galiazzo, G.; Franceschini, S.; Ruffino, M.; Gori, S.; Facoetti, A. Serious games for early identification of developmental dyslexia. Comput. Entertain. 2017, 15, 1–24. [Google Scholar] [CrossRef]
- Rextina, G.; Asghar, S.; Stockman, T.; Khan, A. Serious Game for Dyslexia Screening: Design and Verification. Int. J. Hum. Comput. Interact. 2024, 41, 4483–4499. [Google Scholar] [CrossRef]
- Jan, T.G.; Khan, S.M. An Effective Feature Selection and Classification Technique Based on Ensemble Learning for Dyslexia Detection. Lect. Notes Data Eng. Commun. Technol. 2023, 131, 413–423. [Google Scholar] [CrossRef]
- Slaghuis, W.L.; Ryan, J.F. Directional motion contrast sensitivity in developmental dyslexia. Vis. Res. 2006, 46, 3291–3303. [Google Scholar] [CrossRef]
- Rauschenberger, M.; Lins, C.; Rousselle, N.; Hein, A.; Fudickar, S. Designing a new puzzle app to target dyslexia screening in pre-readers. In ACM International Conference Proceeding Series; ACM: New York, NY, USA, 2019; pp. 155–159. [Google Scholar] [CrossRef]
- Nicolson, R.I.; Fawcett, A.J.; Dean, P. Developmental dyslexia: The cerebellar deficit hypothesis. Trends Neurosci. 2001, 24, 508–511. [Google Scholar] [CrossRef] [PubMed]
- Stein, J. Dyslexia: The Role of Vision and Visual Attention. Curr. Dev. Disord. Rep. 2014, 1, 267–280. [Google Scholar] [CrossRef]
- Saksida, A.; Iannuzzi, S.; Bogliotti, C.; Chaix, Y.; Démonet, J.-F.; Bricout, L.; Billard, C.; Nguyen-Morel, M.-A.; Le Heuzey, M.-F.; Soares-Boucaud, I.; et al. Phonological skills, visual attention span, and visual stress in developmental dyslexia. Dev. Psychol. 2016, 52, 1503–1516. [Google Scholar] [CrossRef]
- Paimpuech, R. The Relationships Between Intelligence Scores on the Intelligence Abilities Test (WISC-III) in Thai and the Leiter International Performance Scale-Revised (LEITER-R) Test Results for Children with Learning Disabilities; Ramkhamhaeng University: Bangkok, Thailand, 2011. [Google Scholar]
- Parsons, T.D.; Bowerly, T.; Buckwalter, J.G.; Rizzo, A.A. A controlled clinical comparison of attention performance in children with ADHD in a virtual reality classroom compared to standard neuropsychological methods. Child Neuropsychol. 2007, 13, 363–381. [Google Scholar] [CrossRef]
- Utairatanakit, D.; Saengsawang, T. Problems and Needs of Using the KUS-SI Rating Scales: ADHD/LD/Autisms (PDDs). In Indian Ocean Comparative Education Society-IOCES; Khon Kaen University: Khon Kaen, Thailand, 2013; p. 37. [Google Scholar]
- Utairatanakit, D.; Srisukvatananan, P.; Ngamsamut, N.; Saengsawang, T.; Wungwisesgusol, C. The Identification, Screening, and Diagnoses for Person with Attention Deficit Hyperactivity Disorder, and Learning Disorders, and Pervasive Developmental Disorders/Autism. In Proceedings of the 47th Kasetsart University Annual Conference, Bangkok, Thailand, 17–20 March 2009. [Google Scholar]
- Yampratoom, R.; Aroonyadech, N.; Ruangdaraganon, N.; Roongpraiwan, R.; Kositprapa, J. Emergent Literacy in Thai Preschoolers: A Preliminary Study. J. Dev. Behav. Pediatr. 2017, 38, 395–400. [Google Scholar] [CrossRef]
- Jamsai, P.; Boonnak, S.; Ruangcham, C. Studying the Current Situation of Screening, Providing Assistance, and Monitoring Elementary School Students with Learning Disabilities in Thailand. 2024. Available online: https://so02.tci-thaijo.org/index.php/hasss (accessed on 25 November 2025).
- Leontyev, A.; Sun, S.; Wolfe, M.; Yamauchi, T. Augmented Go/No-Go task: Mouse cursor motion measures improve ADHD symptom assessment in healthy college students. Front. Psychol. 2018, 9, 496. [Google Scholar] [CrossRef]
- Nicolson, R.I.; Fawcett, A.J. Comparison of deficits in cognitive and motor skills among children with dyslexia. Ann. Dyslexia 1994, 44, 147–164. [Google Scholar] [CrossRef]
- Yang, T.H.; Liao, R.M.; Su, C.I.; Chien, C.Y.; Ng, C.T.; Yen, N.S. Interval timing relative to response inhibition in the differential reinforcement of low-rate responding in normally developing young adults. Sci. Rep. 2023, 13, 11977. [Google Scholar] [CrossRef] [PubMed]
- Li, C.; Delgado-Gómez, D.; Sujar, A.; Wang, P.; Martin-Moratinos, M.; Bella-Fernández, M.; Masó-Besga, A.E.; Peñuelas-Calvo, I.; Ardoy-Cuadros, J.; Hernández-Liebo, P.; et al. Assessment of ADHD Subtypes Using Motion Tracking Recognition Based on Stroop Color–Word Tests. Sensors 2024, 24, 323. [Google Scholar] [CrossRef] [PubMed]
- Kiziewicz, M.; Biggs, I. CASCADE—Creativity Across Science, Art, Dyslexia, Education. 2007. Available online: http://www.bath.ac.uk/cascade/ (accessed on 25 November 2025).
- Lyytinen, H.; Erskine, J.; Hämäläinen, J.; Torppa, M.; Ronimus, M. Dyslexia—Early Identification and Prevention: Highlights from the Jyväskylä Longitudinal Study of Dyslexia. Curr. Dev. Disord. Rep. 2015, 2, 330–338. [Google Scholar] [CrossRef] [PubMed]
- Nicolson, R.I.; Fawcett, A.J.; Dean, P. Time estimation deficits in developmental dyslexia: Evidence of cerebellar involvement. Proc. R. Soc. B Biol. Sci. 1995, 259, 43–47. [Google Scholar] [CrossRef]
- Meidenbauer, K.L.; Niu, T.; Choe, K.W.; Stier, A.J.; Berman, M.G. Mouse movements reflect personality traits and task attentiveness in online experiments. J. Personal. 2023, 91, 413–425. [Google Scholar] [CrossRef]
- Mancuso, L.; Tancredi, C.; Provola, M.; Marino, L.; Coppola, E.; Presta, R. Predicting Dyslexia in Children Through Game-Based Screening: Introducing Fluffy the Game. In PLAY SERIOUSLY: The Transformative Power of Video Games; WriteUp: Rome, Italy, 2023. [Google Scholar]
- Brookes, G.; Veronica, N.; Lim, B.H.; Tan, W.P.; Natalia, L. The Computerised-based Lucid Rapid Dyslexia Screening for the Identification of Children at Risk of Dyslexia: A Singapore study. Educ. Child Psychol. 2011, 2, 33–55. [Google Scholar] [CrossRef]
Disclaimer/Publisher’s Note: The statements, opinions and data contained in all publications are solely those of the individual author(s) and contributor(s) and not of MDPI and/or the editor(s). MDPI and/or the editor(s) disclaim responsibility for any injury to people or property resulting from any ideas, methods, instructions or products referred to in the content. |
© 2025 by the authors. Licensee MDPI, Basel, Switzerland. This article is an open access article distributed under the terms and conditions of the Creative Commons Attribution (CC BY) license (https://creativecommons.org/licenses/by/4.0/).