Abstract
Nielsen’s heuristics are widely recognized for usability evaluation, but they are often considered insufficiently specific for assessing particular domains, such as e-learning. Currently, e-learning plays a pivotal role in higher education because of the shift in the educational paradigm from a teacher-centered approach to a student-centered approach. The criteria utilized in multiple sets of heuristics for evaluating e-learning are carefully examined based on the definitions of each criterion. If there are similarities in meaning among these criteria, they are consolidated into a single criterion, resulting in the creation of 20 new criteria (spanning three primary aspects) for the evaluation of e-learning. These 20 new criteria encompass key aspects related to the user interface, learning development, and motivation. Each aspect is assigned a weight to facilitate prioritization when implementing improvements to evaluate e-learning, which is especially beneficial for institutions with limited resources responsible for the relevant units. In terms of weighting, there is room for enhancement to attain more optimal weighting outcomes by employing a Fuzzy Preference Programming method known as Inverse Trigonometric Fuzzy Preference Programming (ITFPP). The higher the assigned weight, the greater the priority for implementing improvements.
1. Introduction
Expert research has primarily focused on usability, which is becoming increasingly important. Heuristic evaluation is currently a sought-after evaluation technique. Heuristic evaluation, according to Nielsen and Molich [1,2], is a method of addressing usability problems in user interface design so that they can be resolved through an iterative design process. Many heuristic evaluation techniques exist, including Nielsen’s Ten Heuristics, Ben Schneiderman’s Eight Fundamental Rules of Interface Design in 1998, and Alan Cooper’s Fundamentals of Interaction Design in 2014. However, Nielsen’s 10 heuristics, developed in 1990, are the most commonly used methods in usability-based user interface design [3,4,5]. Nielsen’s heuristics are designed for user interface design to detect usability issues. Many advantages encourage researchers to use this assessment method: it is low cost, does not require extensive planning, encourages everyone to use it, and more importantly, it can be used from the early stages of development as well as during the evaluation phase [1]. However, Nielsen’s ten heuristics have been criticized for being too focused on the system rather than the user experience [6,7]. Therefore, many experts have created new heuristics based on Nielsen [8,9,10] to overcome these shortcomings. However, these new heuristics also have limitations, such as lack of validity [11] or ambiguity in adding heuristics [12]. The weaknesses in Nielsen’s heuristics and their modified versions have encouraged researchers to develop heuristics to address these shortcomings. In this study, we utilized nine criteria from Nielsen’s heuristics and compiled criteria previously used by researchers to evaluate e-learning. As a result, we obtained 20 criteria. The subsequent challenge lies in presenting the evaluation results to e-learning developers, especially those in higher education institutions (as well as decision-makers). It is crucial, particularly for universities with limited resources, to address the entire set of 20 criteria quickly and directly. Therefore, the focus of our article is on prioritizing the 20 heuristic criteria used to evaluate higher education e-learning.
A crucial skill required by a decision-maker is the capacity to prioritize a number of possibilities chosen based on a number of factors. However, when decision-makers are confronted with several criteria and pieces of information, the situation becomes problematic. By implementing the AHP technique, which asks experts to rank their preferences for criteria and options on a scale of 1 to 9, research in [13,14] has simplified this issue. Expert comparisons were then poured into a pairwise comparison matrix as components. The AHP approach has been widely applied [15,16,17,18]. However, the AHP approach suffers greatly from subjectivity and ambiguity during evaluation. The FAHP approach was first proposed in [19] to address these constraints. The FAHP approach traditionally converts a numerical scale into fuzzy triangular numbers, which may be examined in the FAHP literature [20,21,22,23,24]. Since the FAHP aims to obtain weights from a fuzzy pairwise comparison matrix, two types of weights can be derived. As seen in [25], the former is weighted by fuzzy numbers and the latter by hard numbers. A representative method that can provide significant weights is the FPP method proposed in the Extent Analysis (EA) method [19,26,27].
The EA approach is more extensively used than the FPP method owing to its simplicity and ease of use in practical applications. The shortcomings of the majority of FAHP applications employing the EA technique discovered by [19] are frequently disregarded. Consequently, the weights derived using this technique do not accurately reflect the relative weights of the decision-making criteria or alternatives [24,28]. This issue arises from the priority vector that calculates the procedure’s zero-weighting of the selection criteria or alternatives. Therefore, multiple weights were not considered in the choice analysis. These circumstances cause inaccurate findings. Because of this, the EA method’s application, which has been used in several previous studies [29,30,31,32,33,34,35,36,37,38,39], has been incorrect. The FPP technique adds a fuzzy membership function, in contrast to the EA method, which is converted into a restricted nonlinear optimization problem for weighted derivatives of crisp numbers. Decision-maker satisfaction is maximized using this strategy. However, occasionally, when there were significant discrepancies between the fuzzy judgments, the FPP approach described in [27] produced the best option. Some of the responses provided false conclusions. Additionally, ref. [28] noted that ref. [27]’s fuzzy membership initiative may result in membership degrees that are negative. By substituting the triangular fuzzy numbers used in [27] with logarithmic triangular fuzzy judgment, the study in [28] overcame this issue. Consequently, ref. [28] formulated a novel restricted optimization known as LFPP, which has a logarithmic term. The nonlinear nature of the optimization issue necessitates a precise numerical optimization process in order to solve it. In addition, LFPP contains settings that may be changed. According to this study, these factors affect the behavior of the LFPP model. The priority gained is the same as that provided by the EA technique; that is, higher-value parameters are utilized. Logarithmic functions may result in overflow during the reduction process from the perspective of numerical computation.
This study proposed a new Fuzzy Preference Programming method for determining priorities. The proposed method was formulated by modifying the natural logarithmic function used in the LFPP method with trigonometric inverse functions. Several elements reveal that the proposed method obtains an optimal solution, namely the weight of the criteria and alternative priority scores. Furthermore, computational performance is provided in the comparison stage with the LFPP methodology.
The remainder of this paper is structured as follows. A brief theory of LFPP is provided in Section 2 (Related Work). The programming of the new trigonometric inverse fuzzy preferences and analytical studies are presented in Section 3 (Research Methodology). Section 4 contains data obtained from the implementation phase (Results and Discussion). Finally, the conclusions are presented in Section 5.
2. Related Work
The priority-based optimization problem initiated by [27] aims to find sharp priority vectors for such that from the pairwise comparison matrix.
Formally, it can be stated as Case 1.
Case 1
Assume below is the triangular fuzzy number defined in [27] and is a fuzzy pairwise comparison matrix, where
Find from .
To solve case 1, the researcher in [27] initiated the fuzzy membership function for and for with .
From the fuzzy membership function, Mikhailov [27] formulated the possible domain as the intersection of all membership functions and let .
To maximize the satisfaction of the decision-maker(s), a nonlinear optimization problem is formulated in [27], given as Model (1):
Maximize
The optimal solution is obtained for when . The author of [28] revealed that nonlinear optimization problems obtain more than one optimal solution and can produce . Wang and Chin [28] attempted to overcome this obstacle by incorporating the logarithmic function into fuzzy triangular numbers. The logarithm of the triangular fuzzy numbers can be expressed as .
This shows that the nonlinear optimization problem is transformed into a logarithmic fuzzy optimization problem.
Maximize
However, there is no guarantee that the logarithmic fuzzy optimization problem in Model (2) always produces a lambda greater than 0. Therefore, the variable is non-negative and for and included in the logarithmic fuzzy optimization problem model.
Because the variable deviation values and decrease, the objective function can be formulated as
where M is the included parameter to ensure that the weights obtained are always within the 16 fuzzy scoring intervals. Thus, the programming of fuzzy logarithmic preferences for decreasing FAHP weights is defined in Model (3) as follows:
Minimize
where for constraints 1, 2, and 4. The variables in the LFPP problem are . It can be seen that is not included in the LFPP model to avoid complexity in the computational stage.
3. Research Methodology
The research approach employed to develop a novel framework for usability heuristics in this study encompasses a sequence of steps as depicted in Figure 1. Insights gleaned from a comprehensive literature review informed our selection and adaptation of Nielsen’s ten heuristics for our heuristic compilation, alongside the development of additional sub-heuristics. Expert participants conducted a heuristic assessment on two chosen systems using solely Nielsen’s set, aiding the subsequent validation of our suggested heuristics. The ITFPP method was applied to the sub-criteria to derive a hierarchy of priorities, facilitating the filtration of superfluous data and the definition of pertinent sub-heuristics. Integrating these findings with Nielsen’s original heuristics and the newly derived sub-heuristics resulted in the preliminary version of our usability heuristics. Subsequently, an ITFPP analysis was reiterated to ascertain the hierarchical ranking for this initial compilation of our heuristics, leading to the formulation of their definitive version. This ultimate set of heuristics underwent validation through expert assessments of the initially selected systems. The outcomes of these assessments were juxtaposed against those from the initial application of Nielsen’s heuristics.
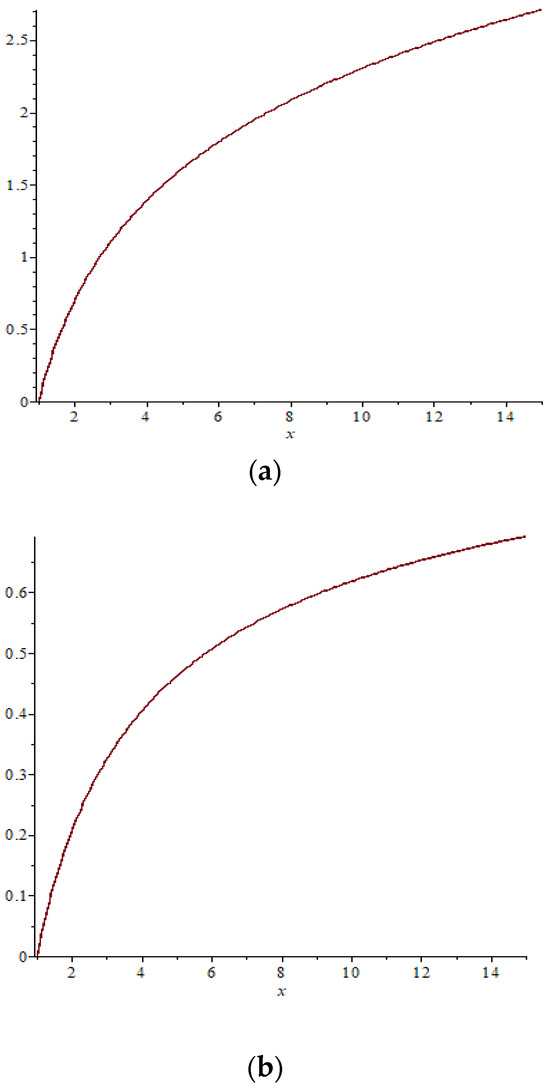
Figure 1.
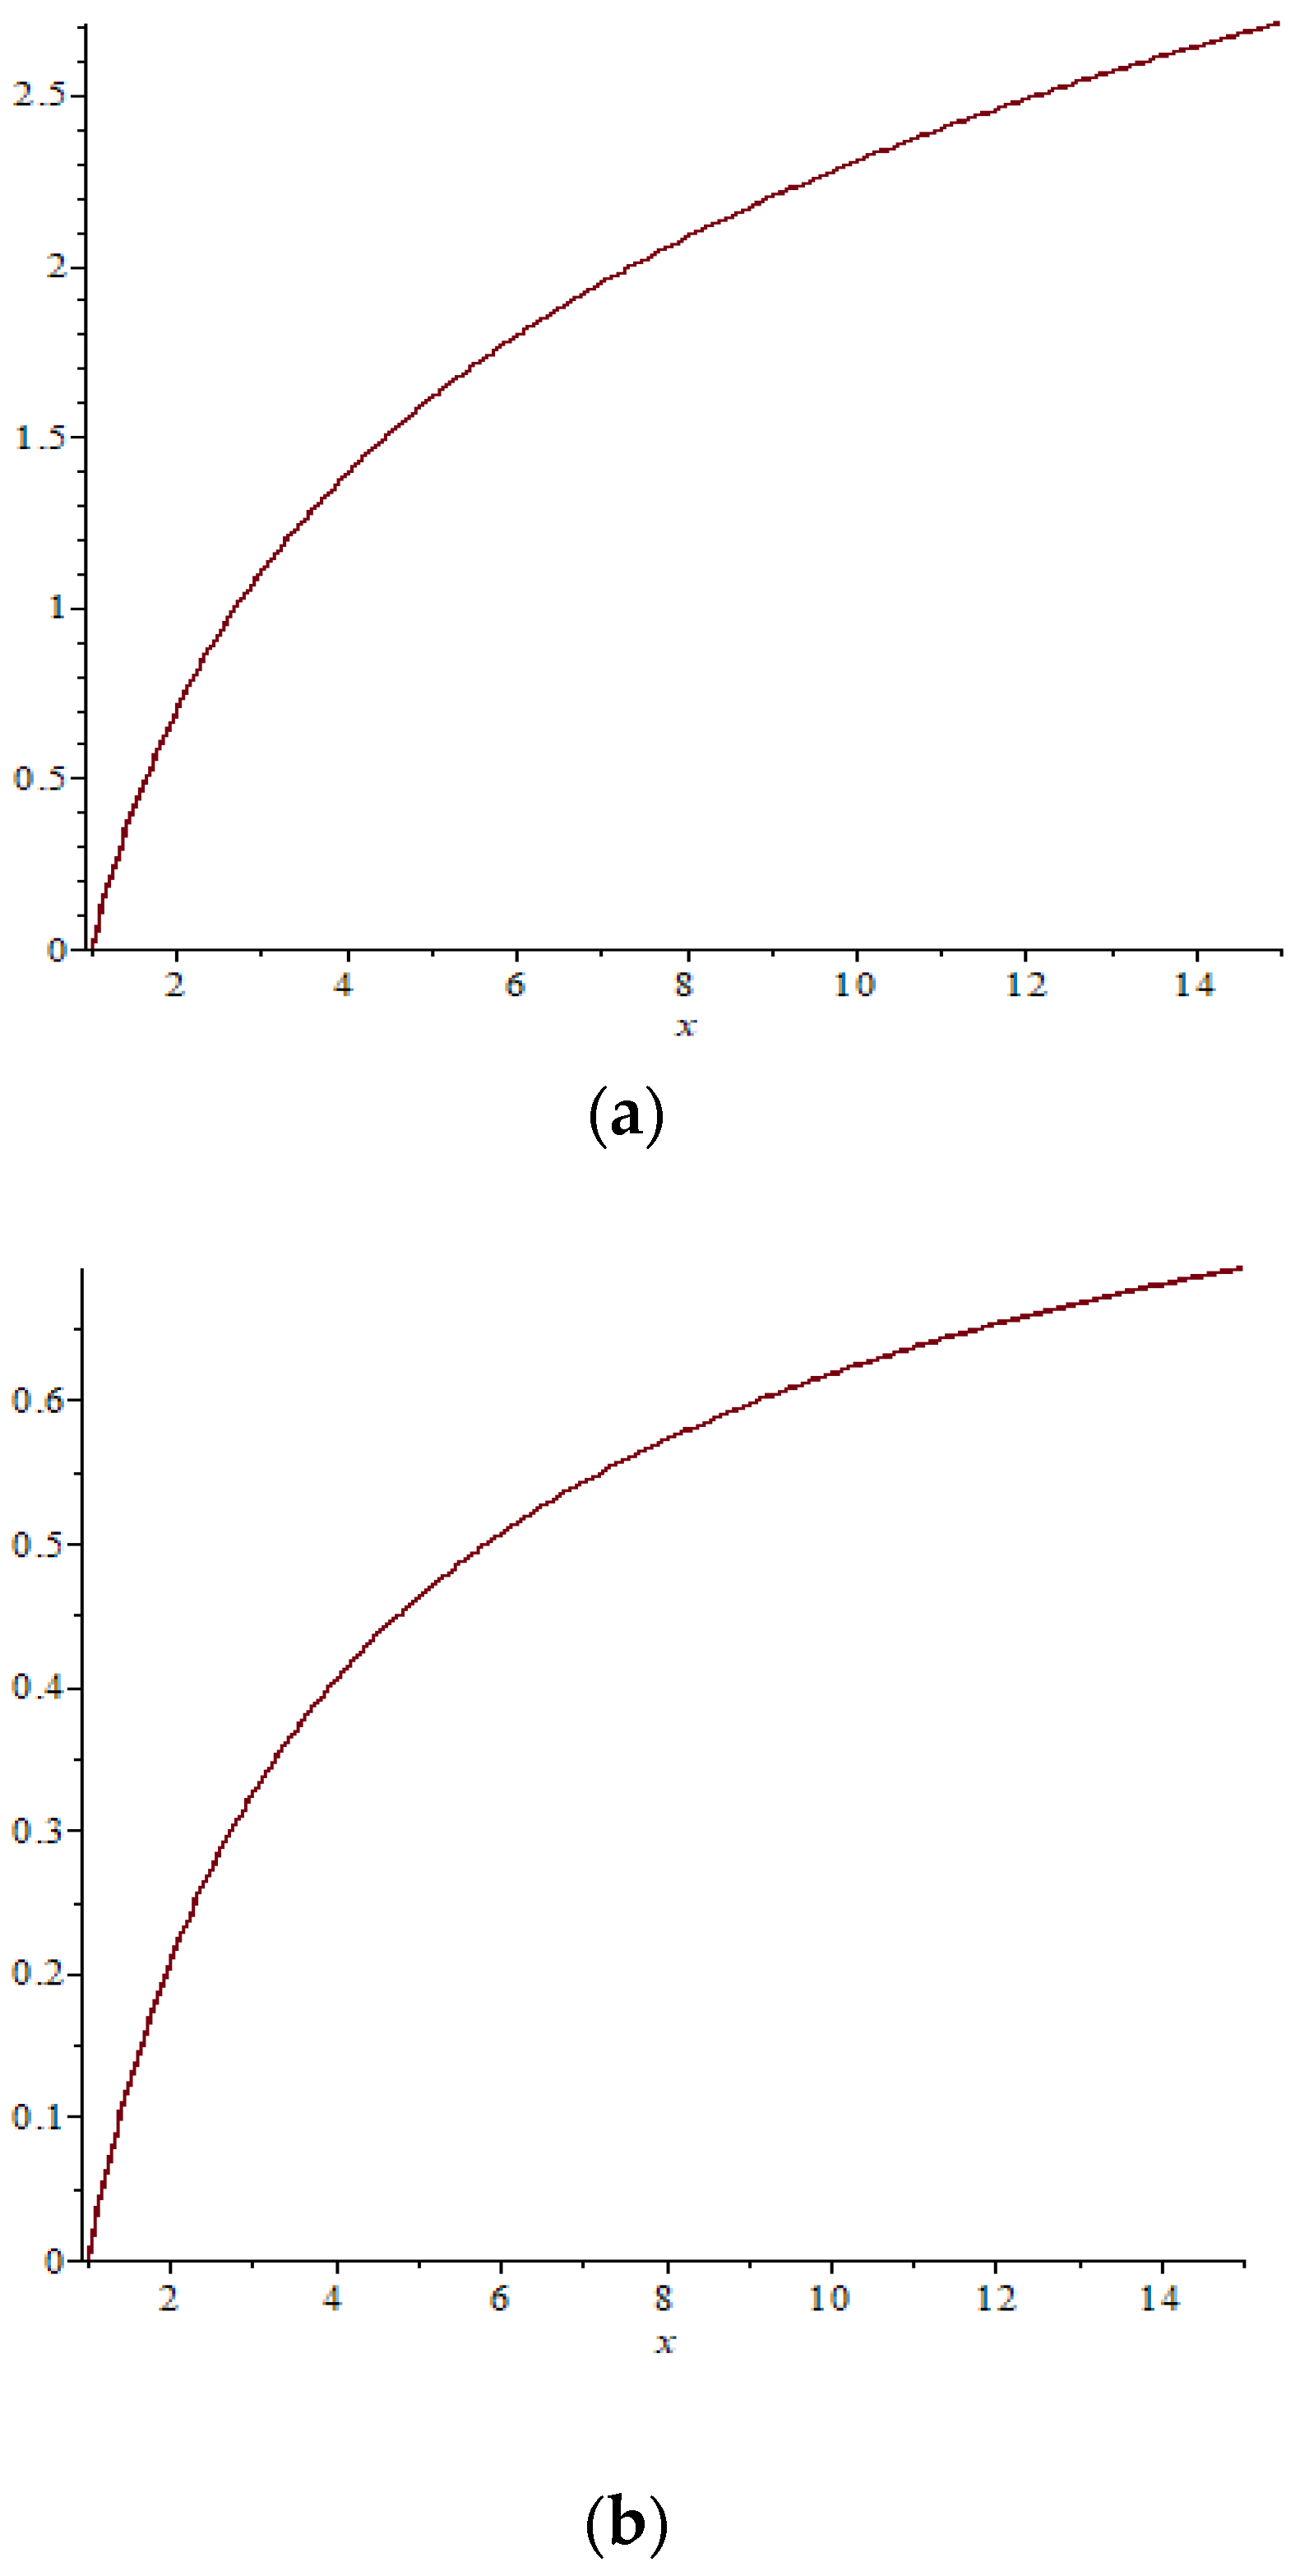
(a) Chart of Function A. (b) Chart of Function B.
3.1. Data Collection
Heuristic evaluation is the data collection strategy used in this study. Experts do an extensive system evaluation to identify issues that the average user would not generally notice. The purpose of a heuristic evaluation is to identify important usability problems that users may encounter and to recommend design improvements to the system before they are implemented. As a result, a panel of five to eight experts, each with a particular field of knowledge and ages ranging from 30 to 46, was assembled. These experts comprised four in the field of human–computer interaction/software engineering, two in learning development, and two in psychology.
3.2. Experiment
We provided a questionnaire sheet containing 4 paired comparison matrices to 8 experts. The first comparison matrix comprised comparisons for three main criteria, and the three paired comparison matrices contained comparisons for sub-criteria from the first main criterion, sub-criteria from the second main criterion, and sub-criteria from the third main criterion. Before experts began assigning weights to each paired comparison matrix, we ensured that they fully understood our instructions. We used a 1–9 scale. Following the experts’ assignment of weights to all paired comparison matrices, we proceeded with normalization and calculated the average values from all experts, utilizing the ITFPP formula (Equation (4)).
The Inverse Trigonometric Fuzzy Preference Programming (ITFPP) method encompasses a systematic procedure involving various sequential steps to facilitate the decision-making process. The initial step involved identifying relevant and crucial criteria for the decision at hand, in this case, criteria used to evaluate e-learning. Subsequently, fuzzy preferences were elicited from experts (involving 8 experts), manifested in fuzzy sets summarizing the level of importance or subjective preference assigned to each criterion. Next, the ITFPP method was employed to conduct nuanced assessments of the weights associated with these criteria. This assessment involved transforming fuzzy preferences into quantitative weight values through the arc sin function, thereby enhancing accuracy and objectivity in the decision model. Once criteria were assigned weights, alternative assessments were conducted, evaluating each alternative against the identified criteria based on the transformed fuzzy preferences. The subsequent step involved calculating aggregate scores for each alternative, achieved by multiplying the assigned criterion weights with the corresponding alternative assessments. As a result, alternatives were ranked based on their aggregate scores, ultimately designating the option with the highest score as the optimal choice. Additionally, the application of sensitivity analysis enriched the decision-making process, highlighting the potential impact of changes in fuzzy preferences or criterion weights on the final outcomes. This provides stakeholders with valuable insights into the robustness and reliability of the decision model. Validation and consistency of the results were then scrutinized, ensuring the integrity of fuzzy preferences and criterion weights. Presentation of the results was carried out in an understandable format, using tables or graphs to facilitate a clear understanding of the decision outcomes.
3.3. Inverse Trigonometric Fuzzy Preference Programming
In this section, a new type of Fuzzy Preference Programming (FPP) is proposed, which aims to improve the effectiveness of the LFPP problem.
The use of the natural number logarithm function in the LFPP method can produce a solution for determining the importance weight value, but it is not yet known whether the results obtained are optimal or not (minimizing the value of J); therefore, it is necessary to conduct experiments using other mathematical functions. Nonlinear equations can be obtained from finite sets, including trigonometric function arguments, logarithms, and exponential functions. Therefore, the ln function limits the objective function LFPP and needs to be changed to, for example, trigonometric functions. From several experiments using trigonometric inverse functions, the function is obtained because its characteristics are similar to the graph of the ln function, especially in quadrant 1 (if the x and y values are positive).
3.4. Example
It is known that , if ; when calculated using Maple Software 18, with the Chart Scatter type, a graph is produced as shown in Figure 1a,b.
Function A is , and Function B is .
By calculating the numbers, you can see the difference in Table 1.

Table 1.
Calculation of each function.
Table 1 shows the differences in values starting from number 2, which are thought to cause scores to be not optimal, although the pairwise comparison matrices are consistent. Therefore, to maximize the value of , we propose replacing the function with the function at its limits, as shown in model (4) as follows:
Minimize
for
As discussed in the previous section, the LFPP model is implemented to derive the priority weights of the fuzzy pairwise comparison matrices. However, the LFPP model contains p or M parameters. The p and M values used affect the optimum solution. Therefore, the results are relative.
Based on the facts mentioned before, we propose a trigonometric function in the form of arc sin. This is aimed at obtaining more optimal weighting results by minimizing the value of J and increasing the value of lambda () closer to 1.
4. Results and Discussion
4.1. Result Comparison
Prior to applying our proposed method to assess the priority levels of criteria in e-learning evaluation, we conducted a comparative analysis between the proposed method (ITFPP) and the previous approach [28]. We employed a matrix, as used by prior researchers [28], denoted as matrix T.
Utilizing the previous method (using Equation (3)) yields the result J = 0.312590239154607374, whereas employing the ITFPP method (proposed method) and using Equation (4) yields the result J = 0.0379230382716251938. A detailed presentation of the results is available in Table 2. This table provides a detailed breakdown of the outcomes derived from both the LFPP and ITFPP methodologies, facilitating a thorough understanding of the contrasting results obtained through these approaches. The juxtaposition of these values underscores the distinctive impact each methodology has on the calculated objective function.
Table 2.
Comparison of ITFPP and previous studies.
The T matrix presented is structured as a 4 × 4 matrix, indicative of the four criteria under comparison. Criterion 1 undergoes evaluations against criteria 2, 3, and 4, a pattern that is repeated for each criterion. The weighting results produce four values (W1 to W4), summing to 1 collectively. Examining Table 2 reveals notable disparities in the obtained J values. The study by [28] defines optimal weighting as the minimum J value. Simultaneously, expert consistency is gauged through the λ variable, where proximity to 1 indicates a high level of expert coherence. The presented matrix elucidates the intricate interplay of criterion evaluations and their impact on the overall weighting structure. The consistency of experts serves as an indicator of the reliability and stability of decision-makers’ judgments throughout the decision-making process. It is a measure that quantifies the degree of coherence in pairwise comparisons, reflecting the extent to which decision-makers maintain consistent preferences across various criteria or alternatives. In the realm of decision sciences, a higher consistency is generally perceived as indicative of a more robust and dependable decision model.
4.2. Implementation of the Proposed Method
We applied this method to determine the priorities of the modified usability heuristic to evaluate the e-learning website. Heuristic evaluation is a usability inspection method that involves the evaluation of an interface against a set of established usability principles known as heuristics. This method is widely used in the field of human–computer interaction (HCI) because it provides a quick and relatively low-cost method to identify usability problems. Heuristic evaluation is widely used in various fields and has recently been found to be useful in evaluating things related to health, such as research conducted by [40,41,42]. In this study, we developed three main criteria: the user interface and experience, learning development, and motivational learning. From these three main criteria, 20 sub-criteria were derived that can be used as principles to be followed when evaluating e-learning: (1) visibility system status; (2) match between the system and the real world; (3) user control and freedom; (4) consistency and standard; (5) error prevention; (6) recognition rather than recall; (7) flexibility and efficiency of use; (8) aesthetic and minimalist design; (9) help and documentation; (10) timeliness; (11) learning design; (12) instructional assessment; (13) instructional material; (14) collaborative learning; (15) learner control; (16) feedback and assessment; (17) diversity of learning content; (18) relevancy; (19) clarity of the purpose and objectives; and (20) motivation to learn.
The data collection for determining the priority level was conducted using a questionnaire and involved eight experts with different backgrounds, consisting of two psychologists, four UI/UX/usability experts, and two experts with expertise in learning development. After the experts filled out the questionnaire, normalization was carried out, followed by calculations using the ITFPP method, resulting in priority rankings.
The consistency index values were calculated and confirmed that the expert assessments were consistent, as shown in Table 3, Table 4, Table 5 and Table 6 below.
Table 3.
The results of the main criteria.
Table 4.
The results of sub-criteria A.
Table 5.
The result of sub-criteria B.
Table 6.
The results of sub-criteria C.
In this study, we have four matrices: (1) matrix of main criteria, (2) matrix of sub-criteria A, (3) matrix of sub-criteria B, and (4) matrix of sub-criteria C.
Matrix of main criteria
The results can be seen in Table 3.
In the main criteria, the highest to lowest priority order is the criteria with codes C (motivational learning), B (learning development), and A (user interface and experience). According to experts, the psychological aspect of motivational learning is the most important criterion compared with the other two criteria.
Table 3 shows the results of the expert assessment calculation using the ITFPP method, where the results obtained indicate that sub-criteria A, which is the most important, is the match between the system and the real-world sub-criteria. The next most important sub-criteria are recognizing rather than recall, help and documentation, aesthetic and minimalist design, flexibility and efficiency of use, error prevention, consistency and standard, user control and freedom, and visibility system status.
The results of the implementation method for the matrix of sub-criteria A are listed in Table 4.
Table 4 shows the priority results for sub-criteria B from the highest to the lowest order: relevance, diversity of learning content, feedback and assessment, learner control, collaborative learning, instructional material, instructional assessment, learning design, and finally timeliness. According to the experts who were the respondents in this study, the timeliness sub-criterion has the smallest weight, making it the lowest priority level.
For the matrix of sub-criteria B, the results of the implementation method are shown in Table 5. In sub-criteria B, the highest priority is B9 (relevancy), and the lowest priority is B1 (timeliness).
In sub-criteria C, as shown in Table 6 above, the motivation to learn sub-criteria is a top priority over the clarity of the purpose and objectives sub-criteria.
The results of the implementation method can be seen in Table 5.
The calculation using the ITFPP method involved the variable M whose magnitude was not explained in previous research, and to determine the effect on the consistency index value, a trial was carried out with the results shown in Table 7.
Table 7.
Trial of consistency index calculation with various M variables.
The determination of the value of M used was 0.1 because from the calculation of the consistency index, a more optimal value was obtained for the value of M = 0.1. In addition, Table 5 shows that the more parameters or criteria that are compared, the smaller the consistency index value.
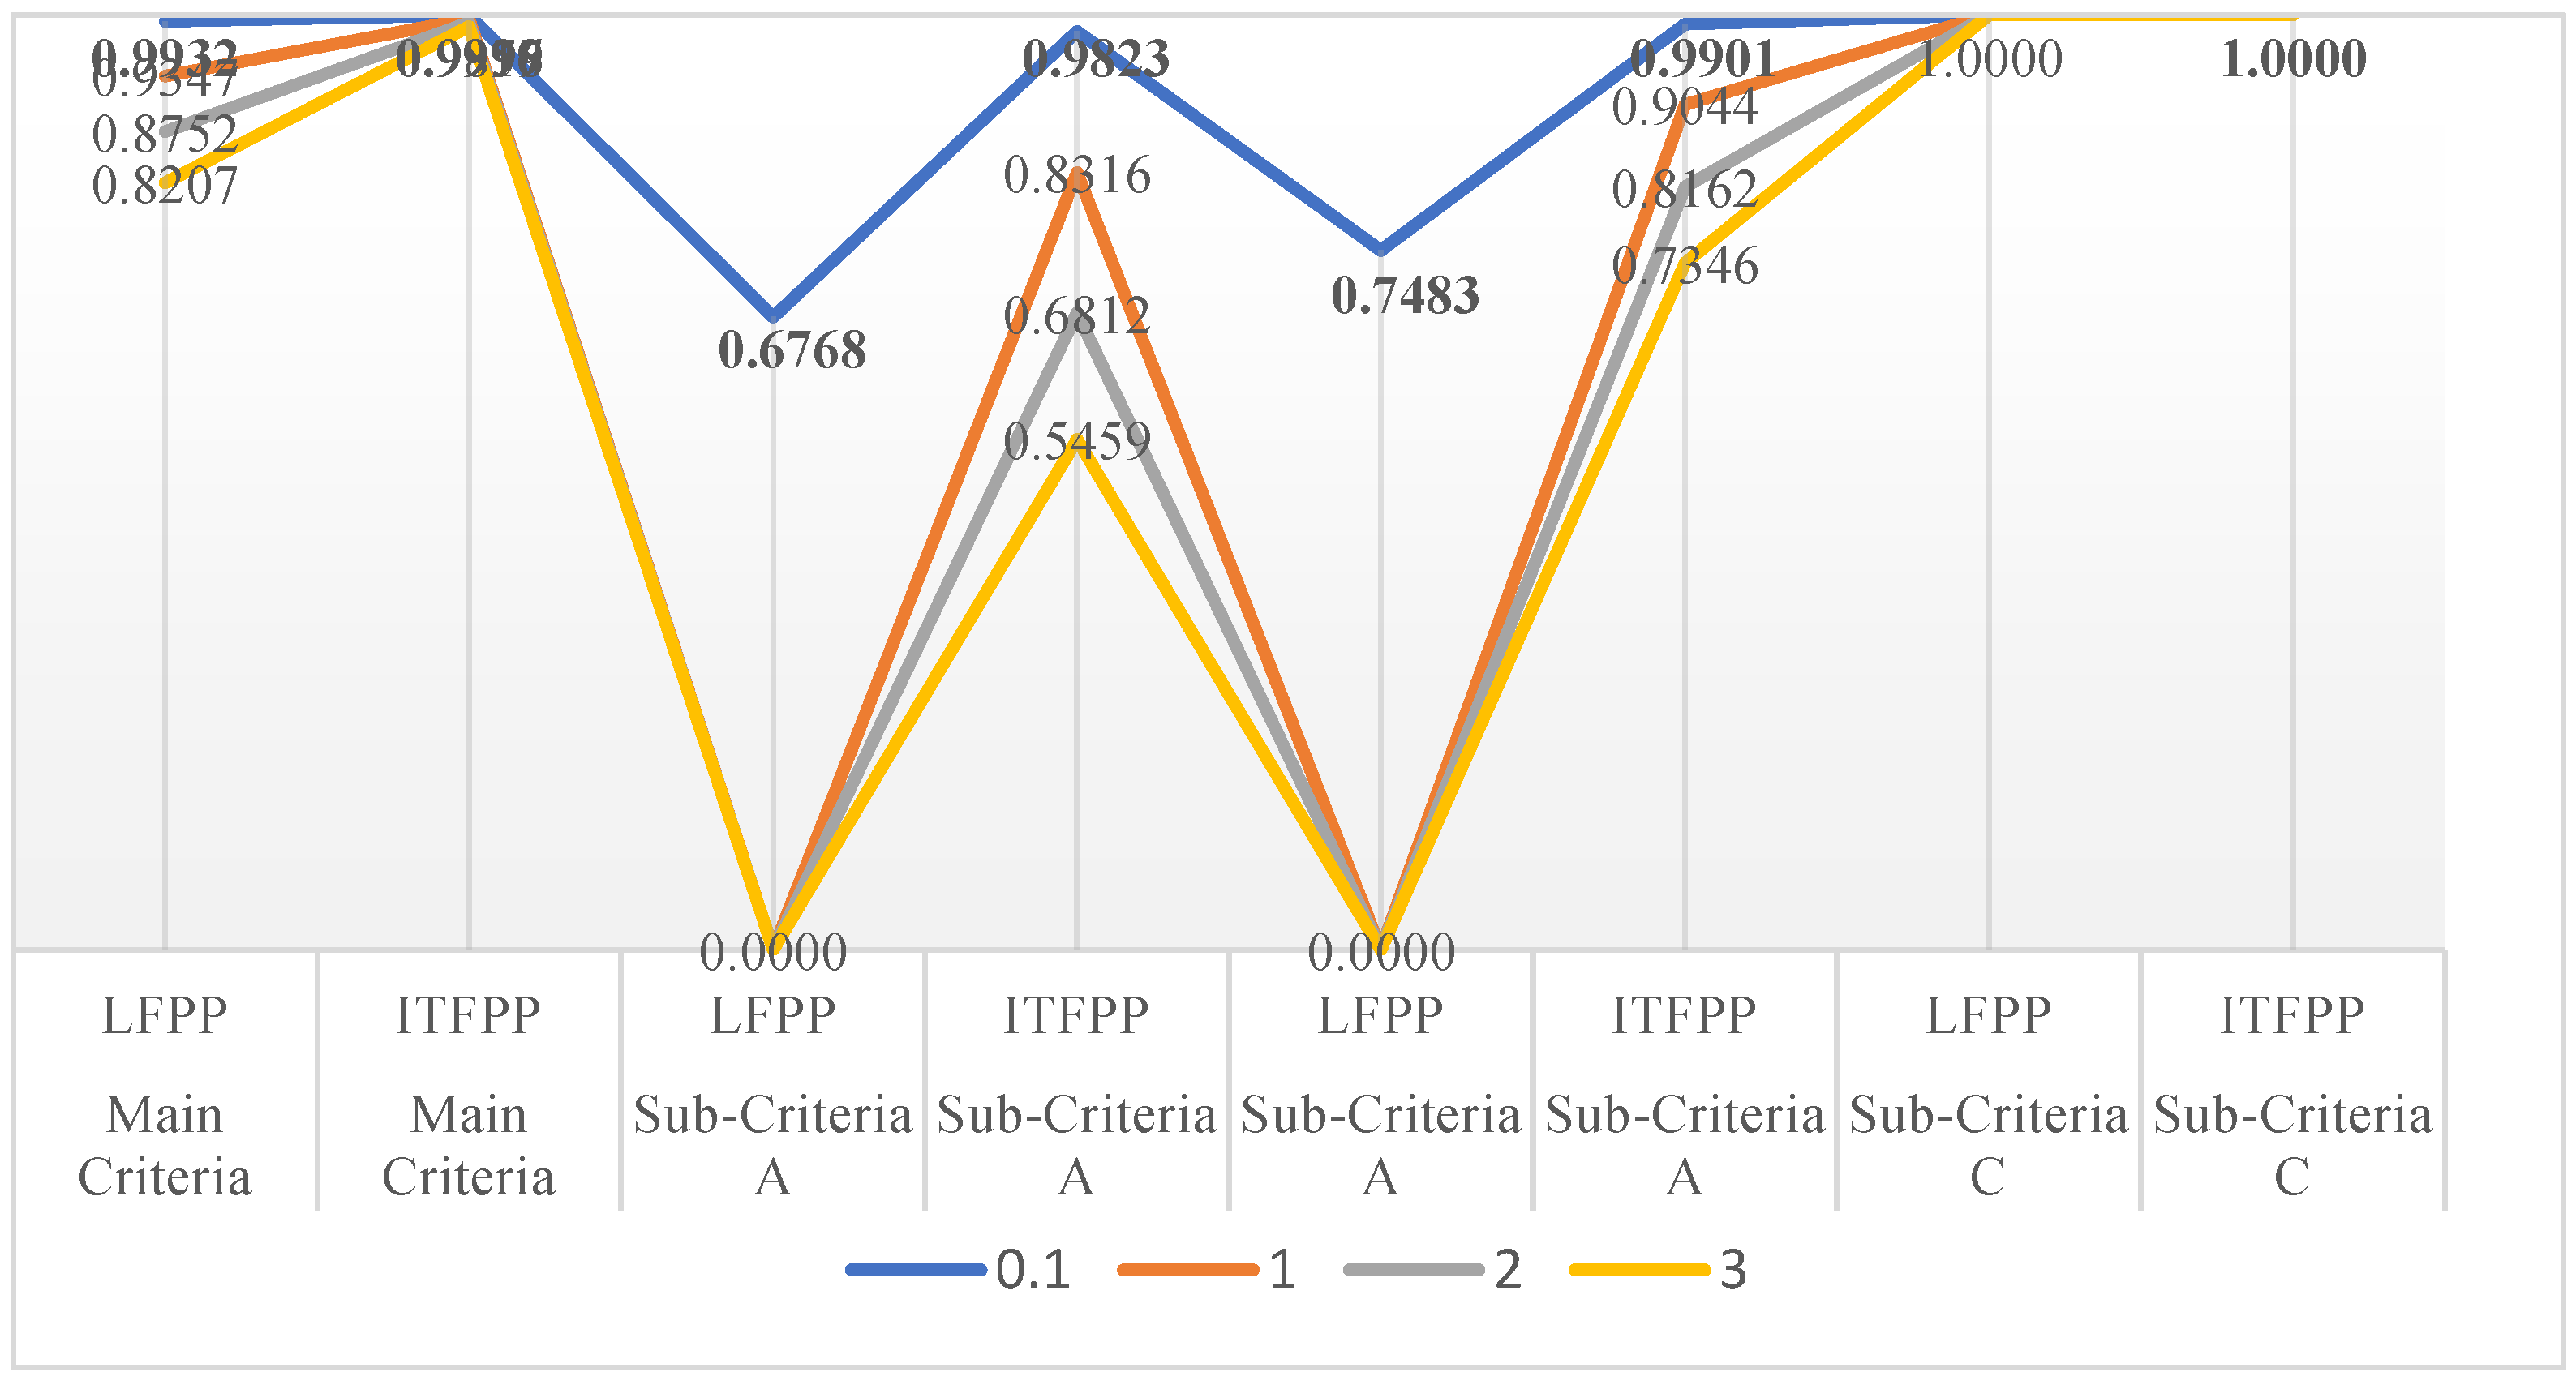
Figure 2 and Figure 3 show that the suggested M variable is 0.1, and the best index consistently reaches 1 for sub-criteria C.

Figure 2.
Consistency index with various M variables.
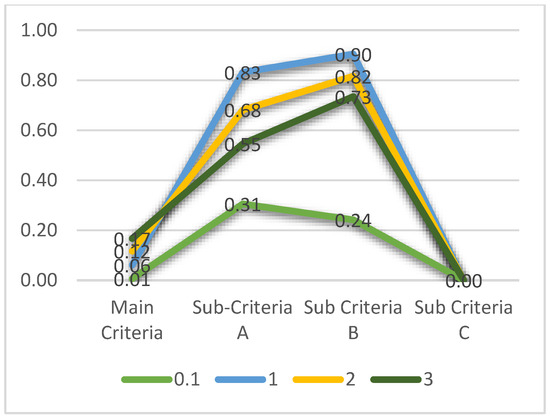
Figure 3.
The difference in consistency index value.
5. Conclusions and Future Work
The Nielsen Heuristic has achieved widespread adoption; however, it is frequently regarded as insufficiently specific for evaluating particular domains, such as e-learning. In the field of prioritization methods, the fuzzy analytic hierarchy process has found extensive application, generating priority weights through a pairwise comparison matrix. This study introduces the Inverse Trigonometric Fuzzy Preference Programming (ITFPP) method, employing a specific function (arc sin) to enhance the solution. The proposed method is utilized to calculate the priority level of e-learning evaluation criteria. The prioritization outcome of the modified usability heuristic can serve as a recommendation to assist interested parties in the development of their e-learning websites.
This investigation contributes not only to the theoretical underpinnings of decision science but also to the practical application of these methodologies in real-world scenarios. By elucidating the superiority of ITFPP over previous studies concerning the consistency index, this study provides valuable insights for researchers, practitioners, and decision-makers seeking optimal solutions in multi-criteria decision-making contexts for enhanced decision quality and reliability.
In our ongoing work, we are exploring ways to integrate a more dynamic perspective into our optimization models. This includes considering factors that might change over time and adapting our models to better align with the complexity of real-world educational settings. We aim to strike a balance between the need for optimization and the need for models that reflect the nuanced and evolving nature of educational scenarios.
Author Contributions
Conceptualization, E.I.; methodology, E.I.; validation, E.I., S.S.K. and I.H.; investigation, E.I.; writing—original draft preparation, E.I.; writing—review and editing, E.I., P.I.S., S.S.K. and I.H.; supervision, P.I.S., S.S.K. and I.H.; project administration, E.I.; funding acquisition, S.S.K. All authors have read and agreed to the published version of the manuscript.
Funding
This research was funded by RTA Program Universitas Gadjah Mada with the Grant Number 3550/UN1.P.III/Dit-Lit/PT.01.05/2022.
Data Availability Statement
The datasets presented in this article are not readily available because the data are part of an ongoing study and due to time limitations. Requests to access the datasets should be directed to the first author.
Acknowledgments
We express our gratitude to Universitas Gadjah Mada for funding this research and publication, and Institut Teknologi Telkom Purwokerto also. We also extend our thanks to all the experts involved. In this study, we utilized two AI tools, namely ChatGPT 4 (https://chat.openai.com/ accessed on 29 February 2024) to refine the English language and Paperpal (https://paperpal.com/ accessed on 29 February 2024) for proofreading.
Conflicts of Interest
The authors declare no conflicts of interest.
References
- Nielsen, J.; Molich, R. Heuristic evaluation of user interfaces. In Proceedings of the SIGCHI Conference on Human Factors in Computing Systems Empowering People—CHI ’90, Seattle, WA, USA, 1–5 April 1990; ACM Press: New York, NY, USA, 1990; pp. 249–256. [Google Scholar] [CrossRef]
- Nielsen, J. Usability Inspection. In Proceedings of the SIGCHI Conference on Human Factors in Computing Systems—CHI ’94, Boston, MA, USA, 24–28 April 1994; pp. 413–414. [Google Scholar]
- Chen, S.Y.; Macredie, R.D. The assessment of usability of electronic shopping: A heuristic evaluation. Int. J. Inf. Manag. 2005, 25, 516–532. [Google Scholar] [CrossRef]
- Paz, F.; Pow-Sang, J.A.; Collantes, L. Usability Heuristics for Transactional Web Sites. In Proceedings of the 2014 11th International Conference on Information Technology: New Generations, Las Vegas, NV, USA, 7–9 April 2014; pp. 627–628. [Google Scholar] [CrossRef]
- Dowding, D.; Merrill, J.A. The Development of Heuristics for Evaluation of Dashboard Visualizations. Appl. Clin. Inform. 2018, 9, 511–518. [Google Scholar] [CrossRef] [PubMed]
- de Jong, M.; Lentz, L. Scenario evaluation of municipal Web sites: Development and use of an expert-focused evaluation tool. Gov. Inf. Q. 2006, 23, 191–206. [Google Scholar] [CrossRef]
- Kamper, R.J. Extending the Usability of Heuristics for Design and Evaluation: Lead, Follow, and Get Out of the Way. Int. J. Hum.-Comput. Interact. 2002, 14, 447–462. [Google Scholar] [CrossRef]
- Moraes, M.C.; Silveira, M.S. How am I ? Guidelines for Animated Interface Agents Evaluation. In Proceedings of the IEEE/WIC/ACM International Conference on Intelligent Agent Technology (IAT’06), Hong Kong, China, 18–22 December 2006; pp. 17–20. [Google Scholar]
- Clarkson, E.; Arkin, R.C. Applying Heuristic Evaluation to Human-Robot Interaction Systems. 2007. Available online: https://sites.cc.gatech.edu/ai/robot-lab/online-publications/ClarksonArkinTechReport2006.pdf (accessed on 29 February 2024).
- Mtebe, J.; Kissaka, M. Heuristics for Evaluating Usability of Learning Management Systems in Africa. In Proceedings of the 2015 IST-Africa Conference, Lilongwe, Malawi, 6–8 May 2015; pp. 1–13. [Google Scholar]
- Hermawati, S.; Lawson, G. Establishing usability heuristics for heuristics evaluation in a specific domain: Is there a consensus? Appl. Ergon. 2016, 56, 34–51. [Google Scholar] [CrossRef] [PubMed]
- Muhanna, M.A.; Amro, R.N.; Qusef, A. Using a new set of heuristics in evaluating Arabic interfaces. J. King Saud Univ.-Comput. Inf. Sci. 2018, 32, 248–253. [Google Scholar] [CrossRef]
- Saaty, T.L. How to make a decision: The Analytic Hierarchy Process. Eur. J. Oper. Res. 1990, 48, 9–26. [Google Scholar] [CrossRef]
- Saaty, T.L. There is no mathematical validity for using fuzzy number crunching in the analytic hierarchy process. J. Syst. Sci. Syst. Eng. 2006, 15, 457–464. [Google Scholar] [CrossRef]
- Dey, P.K. Managing project risk using combined analytic hierarchy process and risk map. Appl. Soft Comput. 2010, 10, 990–1000. [Google Scholar] [CrossRef]
- Ivanco, M.; Hou, G.; Michaeli, J. Sensitivity analysis method to address user disparities in the analytic hierarchy process. Expert Syst. Appl. 2017, 90, 111–126. [Google Scholar] [CrossRef]
- Mekouar, S. Classifiers selection based on analytic hierarchy process and similarity score for spam identification. Appl. Soft Comput. 2021, 113, 108022. [Google Scholar] [CrossRef]
- Bai, B.; Xie, C.; Liu, X.; Li, W.; Zhong, W. Application of integrated factor evaluation–analytic hierarchy process–T-S fuzzy fault tree analysis in reliability allocation of industrial robot systems. Appl. Soft Comput. 2022, 115, 108248. [Google Scholar] [CrossRef]
- Chang, D.-Y. Applications of the extent analysis method on fuzzy AHP. Eur. J. Oper. Res. 1996, 95, 649–655. [Google Scholar] [CrossRef]
- van Laarhoven, P.; Pedrycz, W. A fuzzy extension of Saaty’s priority theory. Fuzzy Sets Syst. 1983, 11, 229–241. [Google Scholar] [CrossRef]
- Boender, C.; de Graan, J.; Lootsma, F. Multi-criteria decision analysis with fuzzy pairwise comparisons. Fuzzy Sets Syst. 1989, 29, 133–143. [Google Scholar] [CrossRef]
- Mikhailov, L.; Tsvetinov, P. Evaluation of services using a fuzzy analytic hierarchy process. Appl. Soft Comput. 2004, 5, 23–33. [Google Scholar] [CrossRef]
- Wang, Y.-M.; Elhag, T.M.; Hua, Z. A modified fuzzy logarithmic least squares method for fuzzy analytic hierarchy process. Fuzzy Sets Syst. 2006, 157, 3055–3071. [Google Scholar] [CrossRef]
- Wang, Y.-M.; Luo, Y.; Hua, Z. On the extent analysis method for fuzzy AHP and its applications. Eur. J. Oper. Res. 2008, 186, 735–747. [Google Scholar] [CrossRef]
- Krejčí, J. Fuzzy eigenvector method for obtaining normalized fuzzy weights from fuzzy pairwise comparison matrices. Fuzzy Sets Syst. 2017, 315, 26–43. [Google Scholar] [CrossRef]
- Mikhailov, L. A fuzzy programming method for deriving priorities in the analytic hierarchy process. J. Oper. Res. Soc. 2000, 51, 341–349. [Google Scholar] [CrossRef]
- Mikhailov, L. Deriving priorities from fuzzy pairwise comparison judgements. Fuzzy Sets Syst. 2003, 134, 365–385. [Google Scholar] [CrossRef]
- Wang, Y.-M.; Chin, K.-S. Fuzzy analytic hierarchy process: A logarithmic fuzzy preference programming methodology. Int. J. Approx. Reason. 2011, 52, 541–553. [Google Scholar] [CrossRef]
- Tavana, M.; Shaabani, A.; Mohammadabadi, S.M.; Varzgani, N. An integrated fuzzy AHP- fuzzy MULTIMOORA model for supply chain risk-benefit assessment and supplier selection. Int. J. Syst. Sci. Oper. Logist. 2021, 8, 238–261. [Google Scholar] [CrossRef]
- Nazari, S.; Fallah, M.; Kazemipoor, H.; Salehipour, A. A fuzzy inference- fuzzy analytic hierarchy process-based clinical decision support system for diagnosis of heart diseases. Expert Syst. Appl. 2018, 95, 261–271. [Google Scholar] [CrossRef]
- Radhika, E.; Sadasivam, G.S. Budget optimized dynamic virtual machine provisioning in hybrid cloud using fuzzy analytic hierarchy process. Expert Syst. Appl. 2021, 183, 115398. [Google Scholar] [CrossRef]
- Khan, A.A.; Shameem, M.; Kumar, R.R.; Hussain, S.; Yan, X. Fuzzy AHP based prioritization and taxonomy of software process improvement success factors in global software development. Appl. Soft Comput. 2019, 83, 105648. [Google Scholar] [CrossRef]
- Sirisawat, P.; Kiatcharoenpol, T. Fuzzy AHP-TOPSIS approaches to prioritizing solutions for reverse logistics barriers. Comput. Ind. Eng. 2018, 117, 303–318. [Google Scholar] [CrossRef]
- Bostancioglu, E. Double skin façade assessment by fuzzy AHP and comparison with AHP. Arch. Eng. Des. Manag. 2021, 17, 110–130. [Google Scholar] [CrossRef]
- Wang, B.; Song, J.; Ren, J.; Li, K.; Duan, H.; Wang, X. Selecting sustainable energy conversion technologies for agricultural residues: A fuzzy AHP-VIKOR based prioritization from life cycle perspective. Resour. Conserv. Recycl. 2019, 142, 78–87. [Google Scholar] [CrossRef]
- Goyal, R.K.; Kaushal, S.; Sangaiah, A.K. The utility based non-linear fuzzy AHP optimization model for network selection in heterogeneous wireless networks. Appl. Soft Comput. 2018, 67, 800–811. [Google Scholar] [CrossRef]
- Singh, P.K.; Sarkar, P. A framework based on fuzzy AHP-TOPSIS for prioritizing solutions to overcome the barriers in the implementation of ecodesign practices in SMEs. Int. J. Sustain. Dev. World Ecol. 2019, 26, 506–521. [Google Scholar] [CrossRef]
- Celik, M.; Er, I.D.; Ozok, A.F. Application of fuzzy extended AHP methodology on shipping registry selection: The case of Turkish maritime industry. Expert Syst. Appl. 2009, 36, 190–198. [Google Scholar] [CrossRef]
- Ju, Y.; Ju, D.; Santibanez Gonzalez, E.D.R.; Giannakis, M.; Wang, A. Study of site selection of electric vehicle charging station based on extended GRP method under picture fuzzy environment. Comput. Ind. Eng. 2019, 135, 1271–1285. [Google Scholar] [CrossRef]
- Black, C.L.; Morris, A.E.; Akinluyi, E.; Kay, R.H. Heuristic evaluation of portable pulse oximeters for domiciliary use: Implications for its use in assessing medical device usability. Smart Health 2023, 27, 100357. [Google Scholar] [CrossRef]
- Klarich, A.; Noonan, T.Z.; Reichlen, C.; Barbara, S.M.J.; Cullen, L.; Pennathur, P.R. Usability of smart infusion pumps: A heuristic evaluation. Appl. Ergon. 2022, 98, 103584. [Google Scholar] [CrossRef]
- Momenipour, A.; Rojas-Murillo, S.; Murphy, B.; Pennathur, P.; Pennathur, A. Usability of state public health department websites for communication during a pandemic: A heuristic evaluation. Int. J. Ind. Ergon. 2021, 86, 103216. [Google Scholar] [CrossRef] [PubMed]

Disclaimer/Publisher’s Note: The statements, opinions and data contained in all publications are solely those of the individual author(s) and contributor(s) and not of MDPI and/or the editor(s). MDPI and/or the editor(s) disclaim responsibility for any injury to people or property resulting from any ideas, methods, instructions or products referred to in the content. |
© 2024 by the authors. Licensee MDPI, Basel, Switzerland. This article is an open access article distributed under the terms and conditions of the Creative Commons Attribution (CC BY) license (https://creativecommons.org/licenses/by/4.0/).