Abstract
Semantic similarity, the task of determining whether two sentences convey the same meaning, is central to applications such as paraphrase detection, semantic search, and question answering. Despite the widespread adoption of transformer-based models for this task, their performance is influenced by both the choice of similarity measure and BERT (bert-base-nli-mean-tokens), RoBERTa (all-roberta-large-v1), and MPNet (all-mpnet-base-v2) on the Microsoft Research Paraphrase Corpus (MRPC). Sentence embeddings were compared using cosine similarity, dot product, Manhattan distance, and Euclidean distance, with thresholds optimized for accuracy, balanced accuracy, and F1-score. Results indicate a consistent advantage for MPNet, which achieved the highest accuracy (75.6%), balanced accuracy (71.0%), and F1-score (0.836) when paired with cosine similarity at an optimized threshold of 0.671. BERT and RoBERTa performed competitively but exhibited greater sensitivity to the choice of Similarity metric, with BERT notably underperforming when using cosine similarity compared to Manhattan or Euclidean distance. Optimal thresholds varied widely (0.334–0.867), underscoring the difficulty of establishing a single, generalizable cut-off for paraphrase classification. These findings highlight the value of fine-tuning of both Similarity metrics and thresholds alongside model selection, offering practical guidance for designing high-accuracy semantic similarity systems in real-world NLP applications.
1. Introduction
Digital content is exploding at a velocity that outpaces manual curation. From search to chatbots, modern applications depend on machines that can comprehend meaning rather than surface form.
Even a subtle change in phrasing, such as substituting ‘effects of climate change’ for ‘consequences of global warming’, can deceive algorithms. Paraphrase detection, therefore, has become a simple pass-fail test for true language understanding. Semantic search is an important contemporary application of LLMs. Recognizing two sentences mean the same thing, even if they are worded differently, so called semantic search, is central to broad range of applications such as information retrieval, machine translation evaluation, and semantic search. Semantic search is a challenge task in natural language processing (NLP) and a measure of semantic similarity is required to perform it.
In this work, we explore sentence-level semantic similarity using the Microsoft Research Paraphrase Corpus (MRPC) [1], a benchmark dataset made up of sentence pairs drawn from news sources. Each pair covers the same topic and may or may not express the same meaning, making MRPC a strong basis for testing paraphrase detection. Our main goal is to find which combination of transformer-based language models and Similarity metrics works best for identifying paraphrased pairs. We use three state-of-the-art pre-trained transformer-based language models: BERT [2], RoBERTa [3,4], and MPNet [5] to create sentence embeddings. These embeddings are then compared using four different similarity-measures: Cosine Similarity, Dot-Product, Manhattan Distance, and Euclidean Distance.
To determine the optimal threshold for classifying sentence pairs as paraphrases, a threshold analysis is conducted, and the results are evaluated using accuracy, balanced accuracy, and F1-score. This analysis aims to identify configurations that yield the most reliable outcomes, particularly valuable in practical applications such as question-answering systems. Accurate sentence similarity depends on effective sentence representation and comparison, alongside appropriate model, measure, and metric selection. Achieving accurate and precise sentence similarity presents challenges related to the model’s capacity to correctly interpret sentence embeddings and the contributions of other model components involved in similarity calculation. A model’s approach to calculating sentence similarity is defined by its chosen similarity-measures, the way it tokenizes sentences, and its method for creating sentence embeddings. These differences distinguish various models in the field. This study aims to determine the optimal measure for sentence similarity by analyzing different approaches.
Previous research on sentence-level similarity began with rule-based heuristics and lexical overlap measures. These early approaches, while transparent, struggled with more complex linguistic phenomena such as clause reordering, synonym substitution, and light negation highlighting the need for more robust representations. Early systems, ranging from WordNet lookups to PMI/LSA vectors and other hand-crafted rules, offered transparency but broke down when clauses were reordered, synonyms substituted, or light negation introduced [6]. Building on these insights, Fernando and Stevenson [7], introduced the Matrix Similarity approach for paraphrase detection, representing sentences as binary vectors and putting similarity using functions analogous to cosine similarity with lexical metrics. This work along with the Microsoft Research Paraphrase Corpus’s relaxed definition of paraphrases, reflects evolving views on how closely meaning must align for text pairs to be considered paraphrases.
Surveys such as Vrublevskyi & Marchenko grouped these pre-neural approaches into three broad families: rule-based, ontology-driven, and classical machine-learning. These categorizations provide a high-level overview; they also reveal that early evaluations often relied on only a single Similarity metric applied to relatively small datasets [6]. Against this backdrop, transformer-based architectures have become the default choice because of their contextualized embedding capabilities. BERT [2] introduced deep bi-directional representations, while RoBERTa [3,4] refined training procedures and data preprocessing. Meanwhile, MPNet [5] combined the advantages of masked and permuted language modeling, achieving notable success in various semantic understanding tasks. Focusing on practical evaluation, Kim et al. [8] compared multiple models on GLUE benchmark tasks, including paraphrase and text similarity, and found that RoBERTa consistently outperformed or matched other models, underscoring its robustness across diverse evaluation settings.
Recent work has centered on developing comprehensive benchmarking datasets to evaluate sentence embeddings, with particular emphasis on their ability to handle paraphrased text [1,9]. The field of sentence paraphrasing and paraphrase detection has been comprehensively surveyed, detailing the historical progression of models and techniques [10]. Existing evaluations and benchmarks have systematically analyzed elements such as the evaluation metrics utilized [10,11], the pooling strategies employed to generate embeddings [11], and the similarity-measures applied. However, a critical deficiency in the current literature lies in the limited assessment of Large Language Model (LLM) embedding performance under different similarity functions and classification thresholds [10,11].
The computational cost associated with cross-encoder setups in pre-Transformer models makes them impractical for large-scale similarity searches. To overcome this shortcoming, our methodology leverages Sentence-BERT (SBERT) [4] to generate Siamese embeddings that enable accurate and significantly faster, millisecond-level cosine comparisons, transitioning from computationally intensive token-level scoring to efficient embedding-based retrieval.
This research offers two key contributions:
- Test and compare the impact of architecture and metric choice on performance of LLMs. To achieve this, BERT, RoBERTa, and MPNet are compared across four similarity-measures (cosine, dot-product, Euclidean, Manhattan).
- Providing a fine-grained view beyond single-point accuracy and identify the cutoff threshold to optimize the performance. SBERT was utilized for embedding while different decision thresholds were tested.
Although research in semantic similarity and paraphrase detection is ongoing, crucial aspects like the selection of similarity-measures for LLM embeddings, appropriate optimization metrics, and the impact of classification thresholding has not been sufficiently explored. This study fills this void by conducting a detailed comparative analysis, offering valuable insights into paraphrase detection methodologies.
2. Data Description
The Microsoft Research Paraphrase Corpus (MRPC) served as a benchmark for evaluating the performance of different Large Language Models (LLMs), with evaluation based on various measures of sentence similarity. The dataset includes pairs of sentences pulled from real-world news articles over the course of 18 months. Accompanying each pair is a binary judgment reflecting whether human annotators considered the two paraphrases in each given pair convey the similar sentiment (vote yes by choosing one) or not (vote no by choosing zero). To ensure that the sentence pairs were not too similar or redundant, the dataset was filtered to include only examples with a minimum word-based Levenshtein distance of ≥8.0 where approximately 67% were labeled as paraphrases, and the remaining 33% as non-paraphrases. These proportions reflect an imbalanced but still informative distribution for binary classification. As part of the preparation and cleaning process, tab separated data was converted to comma separated values to smoothly function with the used libraries, however because some of the dataset’s sentences already contained commas some records were malformed during conversion and were removed from the applied dataset. Before embeddings were generated, application of model-specific tokenization (WordPiece for BERT, Byte-Pair Encoding for RoBERTa, and SentencePiece for MPNet) was performed for each model. This resulted in a final 5533 records from the original dataset of 5801 sentence pairs.
3. Methods
Figure 1 illustrates the primary steps involved in this study. The process starts with data preparation and progresses through LLM selection, sentence embedding, selection of similarity-measure, selection of appropriate measurement techniques and performance metrics, and the subsequent analysis of the results. The rationale and details supporting each stage are elaborated in the sections below.
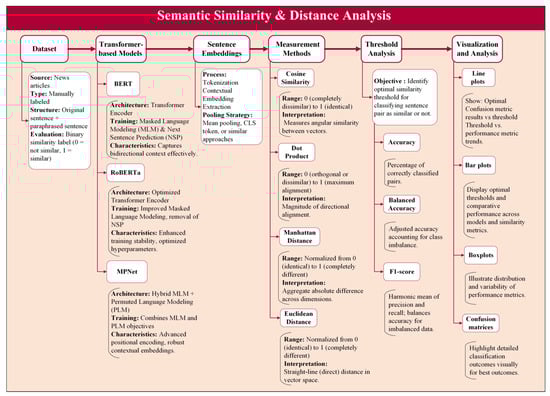
Figure 1.
Schematic of semantic similarity and distance analysis.
3.1. Pre-Trained Transformer-Based Language Models
To generate sentence embeddings, we employ three pre-trained transformer-based language models: bert-base-nli-mean-tokens, all-roberta-large-v1, and all-mpnet-base-v2. While all three models summarized in Table 1 are based on transformer architecture, each takes a slightly different learning approach.

Table 1.
Summary of large language models studied in this work.
The BERT model used in this work is the bert-base-nli-mean-tokens checkpoint from the Sentence-Transformers library, which adapts the original BERT-base (trained on Masked Language Modeling and Next Sentence Prediction) for sentence-level tasks by applying mean pooling over token embeddings. RoBERTa Large, by contrast, removes the NSP objective and relies solely on MLM, and the all-roberta-large-v1 checkpoint is an SBERT variant fine-tuned specifically for sentence similarity. MPNet combines MLM with Permuted Language Modeling (PLM), enabling it to capture dependencies across token positions; the all-mpnet-base-v2 checkpoint is likewise an SBERT fine-tuned version.
Table 1 highlights architectural and training differences among the models. RoBERTa is substantially larger than both BERT and MPNet. These differences suggest that while BERT and MPNet are lightweight models, RoBERTa may offer greater representational power due to its larger architecture. The variation in tokenizers and training objectives reflects each model’s unique strategy for capturing contextual meaning.
3.2. Sentence Embedding Extraction Process
For each model, we convert every paired sentence into a fixed-length vector embedding through tokenization and contextual encoding. First, each sentence is tokenized using WordPiece [12] for BERT (case-insensitive), SentencePiece [13] for MPNet, and Byte-Pair Encoding (BPE) [14,15] for RoBERTa. Then, the tokenized text is fed through the transformer, yielding contextualized embeddings for each token in the sequence. For RoBERTa and MPNet models, sentence embeddings are derived directly from their pre-trained SBERT checkpoints, which are optimized for sentence similarity tasks. In the case of BERT, embeddings are generated by applying mean pooling over the token-level hidden states, following the bert-base-nli-mean-tokens implementation in the Sentence-Transformers library. This pooling strategy ensures that each sentence is represented as a single vector, but differs from the fine-tuned SBERT variants.
3.3. Similarity and Distance Measures
Using the obtained sentence embeddings, pairwise similarity scores were calculated for each sentence pair using four different similarity-measures. These measures are quantified based on similarity or distance. A distance measure in vector space quantifies the difference in the coordinates of two vectors, indicating how far apart they are. Conversely, a similarity-measure evaluates how closely two vectors are aligned in terms of their orientation. These measures are essential to determine the closeness of embedding vectors in semantic space and are summarized in Table 2:
Table 2.
Similarity-measures quantified by similarity or distance.
All four measures were computed for each sentence pair. It must be pointed out that the higher values of cosine similarity and dot-product highlight the resemblance between the paired sentences, whereas the higher values of distance imply semantic differences between the sentences.
3.4. Similarity Threshold Analysis
Because the above Similarity metrics yield continuous scores, a decision threshold must be applied to classify pairs as paraphrases (label = 1) or not (label = 0). As illustrated in Figure 2, threshold analysis was performed to determine the optimal cut-off for each model-metric combination for the paraphrase assessment.
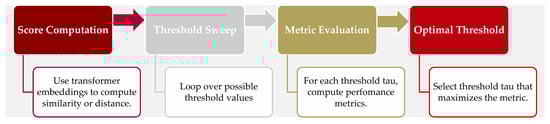
Figure 2.
Schematic of identifying the cutoff threshold to optimize the LLM performance for paraphrase classification.
After calculating the Similarity metrics for every sentence pair within the evaluation set across all model embeddings, empirical distributions were generated to differentiate between paraphrase and non-paraphrase pairs. To improve the visualization and interpretation of these similarity scores, they were normalized where is the normalized score, is the quantified score of the sentence pair, and are the minimum and maximum scores in the evaluation set, respectively.
For each Similarity metric, a decision cutoff threshold in a range from 0 to 1 with increments of 0.001 was set. At each cutoff threshold, classification performance metrics, including accuracy, balanced accuracy, and F1-score, were calculated by comparing predicted labels against ground-truth MRPC labels. These metrics are standard for evaluating semantic similarity in contemporary publications [16,17,18,19,20,21,22,23,24,25,26]. Definition along with a brief description for each metric is provided in Table 3. The optimal threshold was determined by evaluating performance metrics at increments of 0.001 across the threshold range to identify the value that yields the best score of each metric.
Table 3.
List of performance metrics used in this study.
3.5. Statistical Significance Testing
To ensure that observed differences between models were not due to random variation, we incorporated statistical testing alongside the threshold analysis. While point estimates such as Accuracy, Balanced Accuracy, and F1 identify the best-performing configuration, they do not indicate whether differences are statistically reliable.
We therefore used two complementary non-parametric approaches:
- Bootstrap resampling [27,28] to estimate and compare performance of different models. From the evaluation set, we repeatedly resampled sentence pairs with replacement and recalculated the chosen metric. The distribution of resampled statistics was used to form 95% confidence intervals:where denotes the bootstrap replicates of the performance statistic. This approach quantifies how much the reported scores could vary if the experiment were repeated.
- Permutation testing [29,30] for pairwise model comparisons. Under the null hypothesis that two models perform equally, we permuted their prediction–label assignments across sentence pairs and recalculated the difference in performance. This produced an empirical distribution of differences, and the -value was computed as:where is the indicator function, is the observed performance gap, and are the permutation replicates.
By combining bootstrap confidence intervals with permutation-based significance testing, we can assess both the stability of each model’s performance estimates and the credibility of observed differences between models.
4. Results
Figure 3 illustrates the violin plots that display the normalized distributions of similarity and distance scores for BERT, MPNet, and RoBERTa across the four measures including cosine similarity, dot-product, Euclidean distance, and Manhattan distance. To enable direct comparison, normalization was applied independently to each model-metric pair, yielding relative rankings such as quartiles and spread. The distributions for all models demonstrate a negative skew towards high similarity. BERT exhibits a particularly long and narrow tail. While MPNet and RoBERTa visually present slightly wider distributions than BERT, MPNet’s distribution appears marginally narrower than RoBERTa’s. This concentration of values towards high similarity, i.e., towards one for cosine and dot-product, towards zero for Euclidean and Manhattan distances, is due to the imbalanced dataset containing larger proportion of similar pairs. The observed patterns show that the sentence embedding of these models could effectively capture the inherent structure of the data.
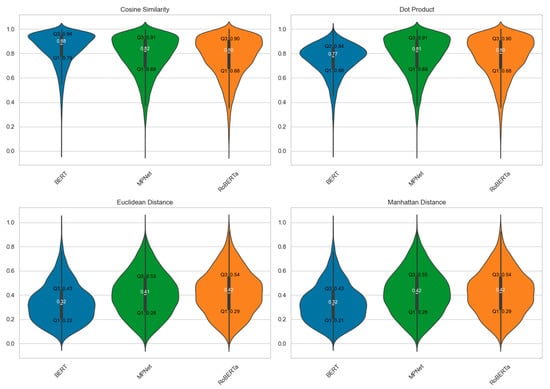
Figure 3.
Violin plots display the similarity scores for each model-measure.
Table 4 summarizes detected outliers, presenting the number of outliers identified by each model and distance/similarity-measure, including those human-judged as negative (not similar), along with the measure-specific cutoff values (upper bound for distance, lower bound for similarity) used to classify outliers. The similarity-measures (cosine and dot-product) consistently produced more outliers than distance measures across all three models. These outliers largely represent instances labeled as dissimilar, which points to a clear separation between the two classes within the data.
Table 4.
Outlier counts by each model and distance metric.
BERT demonstrated a greater number of outliers across all measures. This is likely attributable to the less spread in its model embedding distribution. A notable observation is the presence of outliers labeled as similar despite being beyond the lower bound for BERT. Furthermore, even when considering data points beyond two standard deviations from the mean as negative, the accuracy within this specific subset remained at a low 83%. These findings highlight the need for more sophisticated methods for outlier detection and handling within the BERT model.
Figure 4 shows how the elements of the confusion matrix including true positives, true negatives, false positives, and false negatives change by the changes in the decision threshold for three sentence-embedding models BERT, RoBERTa, and MPNet under four different similarity/distance metrics: Cosine similarity, Euclidean distance, Manhattan distance, and Dot product. The y-axis represents the percentage of total predictions contributed by each confusion matrix component, and the x-axis is the threshold applied to the similarity or distance score for deciding whether two sentences are paraphrases.
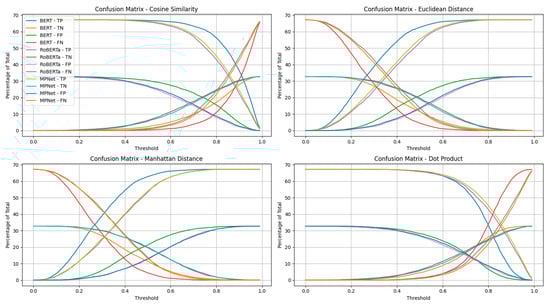
Figure 4.
Threshold-dependent confusion matrix dynamics for three transformer-based sentence embedding models (BERT, RoBERTa, and MPNet) across four similarity/distance metrics (cosine similarity, Euclidean distance, Manhattan distance, and dot product). Each curve represents the proportion of total predictions assigned to a confusion matrix category (TP, TN, FP, FN). At low thresholds, true positives dominate at the expense of false positives, whereas at high thresholds, true negatives dominate but false negatives rise. Mid-range thresholds provide a better balance between correct classifications and errors. MPNet shows more stable performance across metrics, while cosine similarity and dot product yield smoother tradeoffs than distance-based measures.
Observed Trends
- General Threshold Effect
- ⚬
- At low thresholds, the models classify most pairs as positives, leading to high true positive (TP) rates but also many false positives (FP).
- ⚬
- At high thresholds, the models classify most pairs as negatives, so true negatives (TN) dominate but false negatives (FN) increase sharply.
- ⚬
- This is the expected tradeoff: lowering the threshold favors recall, raising the threshold favors precision.
- Model Performance
- ⚬
- BERT: Shows a steeper tradeoff between TPs and TNs, indicating that its decision boundary is more sensitive to threshold shifts.
- ⚬
- RoBERTa: Displays smoother transitions across thresholds, suggesting more stable probability distributions.
- ⚬
- MPNet: Tends to maintain higher TP and TN proportions across mid-range thresholds, implying stronger separation between positive and negative classes.
- Metric Dependence
- ⚬
- Cosine similarity and Dot product: Both show relatively symmetric behavior between positives and negatives, which is consistent since both metrics capture angular similarity in embedding space.
- ⚬
- Euclidean and Manhattan distances: These exhibit sharper crossovers between TP/FP and TN/FN, reflecting that distance-based thresholds can exaggerate separation depending on embedding scale.
- Optimal Threshold Regions
- ⚬
- The mid-range thresholds (around 0.4–0.6 for Similarity metrics, and the corresponding range for distance metrics) show better balance between TP and TN rates, while keeping FP and FN relatively lower.
- ⚬
- MPNet, in particular, appears to sustain favorable balance across these ranges compared to BERT and RoBERTa.
The similarity-based metrics, Cosine and Dot-Product, classify most sentence pairs as ‘similar’ at low values of cutoff threshold which catches nearly all true matches (high TP) but also predicts a lot of incorrect matches (high FP). Conversely, distance-based metrics like Euclidean and Manhattan demonstrate opposite trend where almost all sentence pairs are labeled ‘not similar’ at low thresholds yielding a large number of false negatives as well as true negatives. As thresholds increase, the trends reverse where higher thresholds for similarity metrics raise TN but reduce TP, while lower thresholds for distance metrics increase TP but lower TN. In the middle range of thresholds (around 0.4–0.6 for Cosine Similarity), TP and TN lines often cross FP and FN lines, indicating a balance between precision and recall. Distance metrics show a mirrored version of the Similarity metric patterns, simply because larger distances mean lower similarity. The three models show broadly similar shapes in their curves, but with some subtle differences. MPNet’s curves often shift slightly, suggesting it separates similar and non-similar pairs more distinctly for some metrics. RoBERTa and MPNet both tend to keep higher TN rates at stricter thresholds, which hints at stronger precision in those ranges, while BERT’s performance drops off more quickly. From a practical point of view, Cosine Similarity and Dot-Product work well when we expect positive pairs to have clearly higher similarity scores than negatives, while Euclidean and Manhattan distances are better when the actual magnitude of embedding distance is more informative. Manhattan distance sometimes offers slightly sharper separation between classes. The best threshold depends on whether avoiding false positives or false negatives is more important for the task. Interestingly, MPNet often strikes the best trade-off in the mid-threshold range, making it a strong candidate for paraphrase semantic similarity applications.
Figure 5 presents a comparative analysis of three models across similarity and distance metrics. Across all metrics, a consistent pattern exists where performance generally improves as the threshold increases from zero toward an optimal range at approximately 0.6–0.8, after which accuracy and F1-score tend to decline. For Cosine Similarity, all three models show peak performance around thresholds of 0.7–0.8, with MPNet and RoBERTa maintaining slightly higher stability in accuracy and F1 in comparison with the BERT that has more variation at the extreme values. Euclidean Distance and Manhattan Distance display similar trends, where performance rises steadily to a peak and then falls sharply as the threshold approaches one. Particularly, models have similar trends in the mid-threshold range and the differences are visible at low thresholds, where BERT performed slightly lower in F1-score. For Dot-Product, the trends are similar as the Cosine Similarity, with performance peaks at 0.7–0.8 threshold. MPNet and RoBERTa demonstrate smoother, more stable trends suggesting more consistency compared to BERT. The Balanced Accuracy plots, in particular, highlight that small threshold changes in the optimal range can shift performance noticeably, indicating that fine-tuning the threshold is essential for maximizing classification fairness across classes. Overall, these results suggest that while all three models perform competitively in the optimal threshold range, MPNet and RoBERTa generally provide slightly more consistent results across metrics, whereas BERT’s performance is more sensitive to threshold variation. This indicates that model choice and threshold calibration both play important roles in achieving reliable semantic similarity classification.
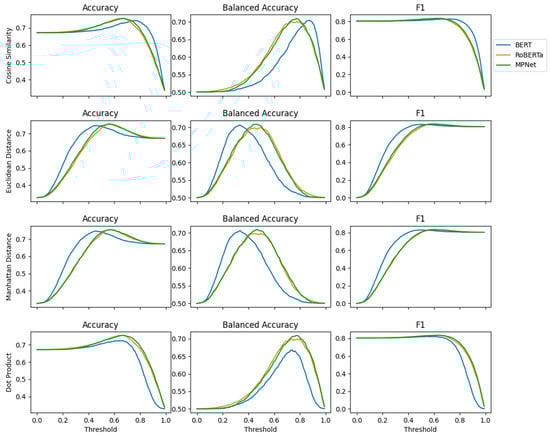
Figure 5.
Trends of performance metrics regarding cutoff threshold values.
To illustrate these effects more concretely, Table 5 provides representative MRPC sentence pairs where outcomes diverge by measure. In both cases, BERT’s predictions shift depending on whether cosine, dot-product, Euclidean or Manhattan distance is applied, while RoBERTa and MPNet remain stable across measures. In the first example, the label is Similar, yet BERT misclassifies the pair as Not Similar under cosine, dot-product, and Euclidean distance, only recovering the correct classification when Manhattan distance is applied. By contrast, MPNet and RoBERTa consistently identify the pair as Similar across all measures. In the second example, the label is also Similar, and again BERT produces unstable predictions, misclassifying under cosine and dot-product but aligning with the label under Euclidean and Manhattan distances. MPNet and RoBERTa remain stable, correctly predicting Similar throughout. In the third example, the label is Not Similar, yet BERT flips depending on the measure, producing false positives under dot-product and Manhattan distance. MPNet and RoBERTa, however, maintain stable predictions and correctly classify the pair as Not Similar in all cases. Together, these examples reinforce the statistical finding that BERT is disproportionately sensitive to the choice of similarity or distance measure, whereas MPNet and RoBERTa exhibit greater robustness.
Table 5.
Example MRPC sentence pairs with predictions across models and measures (S = Similar, NS = Not Similar).
Figure 6 shows both the optimal value and its associated threshold for each model when optimizing each performance metric across distance/similarity-measures. The hatched bar is the threshold, and the solid bar is the optimal performance yield at that threshold. There is a consistent difference in value for BERTs thresholds for each performance metric in comparison with the other models. This is likely because BERT consistently produced more similar embeddings than the other two models as was observed in Figure 4. To verify whether these differences reflect genuine performance gaps, we applied bootstrap resampling and permutation testing. The analyses confirmed that both RoBERTa and MPNet significantly outperformed BERT across Accuracy, Balanced Accuracy, and F1 , while no significant difference was detected between RoBERTa and MPNet (CIs overlapped; permutation
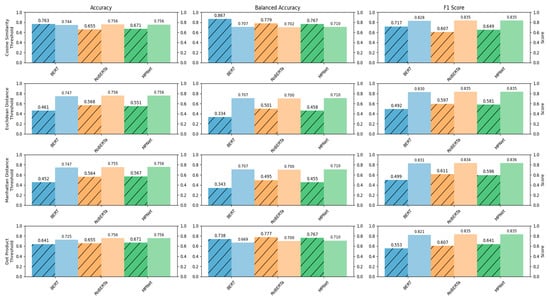
Figure 6.
Bar Plots of optimal thresholds for each metric, model, and measure. Hatched bars correspond to thresholds while solid bars correspond to score.
Table 6 shows the models that reached the performance peak value and similarity/distance measure quantified to calculate the peak performance metric along with the threshold associated with the optimal measure. BERT is notably absent from the top-performing models, while RoBERTa appeared three times with peak accuracy. In contrast, MPNet appeared nine times achieving peak performance with all three metrics. At first glance, each similarity or distance measure appears three times in the table, which might suggest comparable performance across methods. However, the patterns observed in Figure 4 revealed important differences. For example, BERT and RoBERTa performed worse when using dot-product compared to cosine similarity. Interestingly, BERT’s performance improved when using Manhattan or Euclidean distance instead of cosine similarity. This is particularly noteworthy because cosine similarity is widely used as a standard measure, yet it yields suboptimal results for BERT here. A less obvious but important observation is that MPNet paired with Manhattan distance produces the highest F1 score peak of any distance measure. The optimal thresholds vary considerably, ranging from 0.334 to 0.867 (Figure 5), indicating that a single, universally applicable threshold is difficult to define. This variability underscores the importance of task-specific calibration rather than relying on a fixed threshold.
Table 6.
Performance metric peak values and the associated model-metric-threshold.
Figure 7 shows 12 confusion matrices, one for each combination of metric and distance measure. The matrix displayed shows only the best performing model with its associated threshold. False Positive (FP) or Type-I error was the primary source of error when optimizing the performance using accuracy or F1 score. In contrast, False Negative (FN) or Type-II error was the primary source of error when optimizing the performance using balanced accuracy.
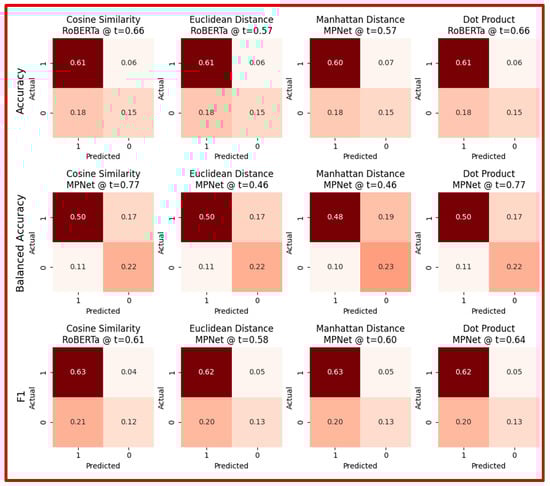
Figure 7.
Confusion matrices for best performing models at each metric and measure.
As can be expected, the disparity between FN and FP is lower for balanced accuracy. The lowest percentage of misclassification at 24% was obtained when optimizing accuracy using cosine similarity closely followed by Manhattan distance, and dot-product. The highest percentage of misclassification at 29% occurred when optimizing balanced accuracy using Manhattan distance as the similarity-measure. MPNet among the three models explored in this study frequently outperformed the other two models based on different performance metrics and using different similarity-measures. The same threshold was found optimizing cosine-similarity and dot-product to achieve peak performance quantified by accuracy and balanced accuracy. Similarly for Euclidean and Manhattan distances. However, for F1-score, a different threshold was found for each similarity-measure yielding the peak performance.
5. Discussion
Across all Similarity metrics, BERT consistently produced the largest number of outliers. This can present challenges in real-world applications that demand consistent performance across a wide range of inputs. MPNet, by contrast, demonstrated more stable and balanced performance with fewer extreme values. This makes MPNet a more reliable option for practical applications where robustness is necessary. RoBERTa performed almost at the same level as MPNet, but showed slightly less consistency, with a marginally higher number of outliers in every metric and slightly lower peak performance. Its larger model size and slower runtime, further limit its efficiency in certain operational contexts. These findings underscore the need to weigh both accuracy and reliability when selecting a model, as the best choice depends heavily on the specific requirements of the application. Factors like latency, interpretability, and compatibility with other tasks can direct toward one model or another.
These performance patterns can also be linked to structural differences among the models. BERT relies on WordPiece tokenization and produces embeddings that vary more in magnitude than orientation, making it sensitive to the choice of Similarity metric. RoBERTa benefits from Byte-Pair Encoding (BPE) tokenization and large-scale pretraining with dynamic masking, which stabilizes its embeddings but increases model size and runtime cost. MPNet combines masked and permuted language modeling, allowing it to generate more balanced contextual embeddings and explaining its robustness across metrics. In simple terms, BERT tends to “stretch” or “shrink” its embeddings more than it rotates them, while RoBERTa and MPNet shape their vectors in a way that makes comparisons more consistent. This helps clarify why BERT can be thrown off by certain measures, whereas the others maintain steadier performance.
Looking at the effect of different Similarity metrics, Euclidean and Manhattan distances generally yielded fewer outliers than cosine similarity or dot-product measures. With cosine similarity and dot-product, BERT not only detected the highest total number of outliers but also labeled the largest number of pairs as “not similar” (around 208 and 162, respectively). These results were obtained with relatively low cutoff thresholds (0.56 for cosine similarity and 0.45 for dot-product), which led to less conservative decisions and a higher number of potential false positives. This suggests that cosine similarity and dot-product measures are more sensitive to the lack of fine-tuning in BERT compared to other models. A closer look reveals that BERT consistently performed better with Euclidean and Manhattan distances than with cosine similarity, diverging from common practice in semantic similarity research. This points to the internal geometry of BERT’s embedding space: its vectors often cluster with limited angular variation but show larger differences in magnitude. Because cosine similarity focuses only on angle while ignoring magnitude, it underutilizes the variance present in BERT’s representations, leading to weaker discrimination. In contrast, Euclidean and Manhattan distances capture these positional differences more effectively, which better aligns with how BERT encodes information. By comparison, RoBERTa and MPNet generate more normalized and evenly distributed embeddings, making cosine similarity more competitive in their case.
Choosing a very conservative cutoff, models prioritize precision over recall, identifying only the most obvious outliers with high confidence but missing moderate ones. While this increases confidence in the detected anomalies, it reduces statistical power by missing several outliers. The imbalance in MRPC (67% paraphrases) compounds this trade-off, since models become biased toward predicting the dominant “similar” class. Balanced accuracy is less affected by this skew, but accuracy and F1 can shift noticeably once the dataset is balanced. This occurs because true positives are easier to detect under imbalance, and rebalancing lowers their prevalence, reducing the apparent performance of metrics that emphasize positive cases.
Conversely, using a less conservative cutoff increases the number of detected outliers but risks introducing more false positives, reducing overall reliability. This highlights that class imbalance not only skews distributions but can also influence the placement of optimal thresholds. In practice, thresholds tuned on imbalanced data may overstate performance, whereas balanced datasets produce more realistic cutoffs that emphasize both classes equally. This illustrates a fundamental trade-off between the number of anomalies detected and the certainty of those detections. In addition, the choice of cutoff should be informed by a balance between meaningful anomaly detection and preventing excessive false classifications. Taken together, these observations suggest that static thresholds may not be sufficient in imbalanced settings, and dynamic or data-aware thresholding strategies should be considered to better align decision boundaries with true class distributions.
6. Conclusions
Our analysis reveals a complex interplay between model choice, distance measures, and evaluation metrics in semantic similarity tasks. The key finding of this study was that MPNet model consistently performs with greater robustness across various distance measures and evaluation metrics compared to BERT, which is more sensitive to the choice of distance measure. RoBERTa achieved nearly identical results to MPNet, and statistical tests confirmed that both significantly outperform BERT, while their difference is negligible. This means the real decision between MPNet and RoBERTa lies in secondary factors such as runtime, efficiency, or deployment context. At the same time, BERT’s stronger performance with Euclidean and Manhattan distances compared to cosine similarity highlights that metric effectiveness is tied to the geometry of the embedding space itself. In BERT’s case, distances that account for magnitude better capture their representational characteristics, whereas cosine similarity overlooks them. This shows that distance measure selection should not be assumed universal but empirically validated for each model.
At the same time, the results underscore a fundamental challenge in semantic similarity, that is, the complex relationship between model, metric, and thresholding. There is no single “optimal” threshold, and imbalance in the MRPC dataset makes this even more evident. Adjusting thresholds can shift the balance between precision and recall, altering Accuracy and F1, while metrics such as Balanced Accuracy remain relatively stable because they normalize across class proportions. This highlights that thresholds should not be treated as fixed constants but as dynamic levers that can be recalibrated when class distributions, application goals, or evaluation settings change. In practice, this means thresholds can be optimized for the desired trade-off, whether prioritizing fewer false positives, fewer false negatives, or a balance, rather than assumed to be stable across datasets or measures.
To address this, our future research will focus on exploring dynamic thresholding to fine tune the threshold to improve the performance. Furthermore, given recent criticisms raised regarding cosine similarity, we showed the potential of the Manhattan and Euclidean distances (as special cases of Minkowski distance) can be considered as reliable replacements. Future research will further investigate different orders of Minkowski distance as preferred similarity-measure for LLM performance metric in natural language vector space. We also suggest moving beyond static pooling methods like mean pooling by implementing a trainable pooling mechanism, which would allow the model to learn how to aggregate embeddings based on the specific patterns of the training data. Ultimately, our findings reinforce that semantic similarity modeling requires a holistic, interconnected approach. It is not a one-size-fits-all problem. It requires both statistical rigor and flexibility in designing the Similarity metric with the embedding geometry, adopting thresholds that reflect data balance, and creating evaluation strategies that balance robustness with adaptability. While MPNet provides a solid foundation under the conditions tested, further research into metric design, threshold optimization, and the geometry of embedding spaces is essential for significant advancements in the field.
Author Contributions
Conceptualization: N.N.K. and D.O.M.; Methodology: N.N.K. and D.O.M.; Data Collection: D.O.M. and E.G.; Preprocessing: D.O.M., E.G., and C.N.; Modeling: D.O.M., E.G., C.N., and N.N.K.; Analysis: D.O.M., E.G., C.N., and N.N.K.; Visualization: D.O.M., E.G., and C.N.; Figures: D.O.M., E.G., and N.N.K.; Writing the Manuscript: D.O.M., E.G., C.N., and N.N.K.; Editing and Modifications: D.O.M. and N.N.K. Project Advisor: N.N.K.; Supervision: N.N.K.; Resources: N.N.K. All authors have read and agreed to the published version of the manuscript.
Funding
This project was made possible through partial support from the National Aeronautics and Space Administration (NASA). We gratefully acknowledge their contribution.
Data Availability Statement
The data presented in this study are available in Microsoft Research Paraphrase Corpus (MRPC) at https://aclanthology.org/I05-5002/, reference number [1], accessed on 28 April 2025.
Conflicts of Interest
The authors declare that they have no conflicts of interest.
References
- Dolan, W.B.; Brockett, C. Automatically Constructing a Corpus of Sentential Paraphrases. In Proceedings of the Third International Workshop on Paraphrasing (IWP2005), Jeju Island, Republic of Korea, 14 October 2005. [Google Scholar]
- Devlin, J.; Chang, M.-W.; Lee, K.; Toutanova, K. BERT: Pre-training of Deep Bidirectional Transformers for Language Understanding. arXiv 2018, arXiv:1810.04805. [Google Scholar]
- Liu, Y.; Ott, M.; Goyal, N.; Du, J.; Joshi, M.; Chen, D.; Levy, O.; Lewis, M.; Zettlemoyer, L.; Stoyanov, V. RoBERTa: A Robustly Optimized BERT Pretraining Approach. arXiv 2019, arXiv:1907.11692. [Google Scholar]
- Reimers, N.; Gurevych, I. Sentence-BERT: Sentence Embeddings using Siamese BERT-Networks. arXiv 2019, arXiv:1908.10084. [Google Scholar] [CrossRef]
- Song, K.; Tan, X.; Qin, T.; Lu, J.; Liu, T.-Y. MPNet: Masked and Permuted Pre-training for Language Understanding. arXiv 2020, arXiv:2004.09297. [Google Scholar] [CrossRef]
- Marchenko, O.; Vrublevskyi, V. Comparison of Transformer-based Deep Learning Methods for the Paraphrase Identification Task. In CEUR Workshop Proceedings, Proceedings of the Information Technology and Implementation (IT&I-2023), Kyiv, Ukraine, 20–21 November 2023; CEUR: Aachen, Germany, 2023; Volume 3624, Available online: https://ceur-ws.org/Vol-3624/Short_5.pdf#:~:text=1.%20Traditional%20Rule,learning%20tec-niques%2C%20such%20as%20Support (accessed on 28 April 2025).
- Samuel, F.; Stevenson, M. A Semantic Similarity Approach to Paraphrase Detection. 2009. Available online: https://www.researchgate.net/publication/228616213_A_Semantic_Similarity_Approach_to_Paraphrase_Detection (accessed on 8 May 2025).
- Kim, R.; Kotsenko, A.; Andreev, A.; Bazanova, A.; Aladin, D.; Todua, D.; Marushchenko, A.; Varlamov, O. Evaluation of Bert and CHATGPT Models in Inference, Paraphrase and Similarity Tasks. E3S Web Conf. 2024, 515, 03016. [Google Scholar] [CrossRef]
- Andrianos, M.; Clematide, S.; Opitz, J. PARAPHRASUS: A Comprehensive Benchmark for Evaluating Paraphrase Detection Models. arXiv 2024, arXiv:2409.12060. [Google Scholar] [CrossRef]
- Zhou, C.; Qiu, C.; Liang, L.; Acuna, D.E. Paraphrase identification with deep learning: A review of datasets and methods. IEEE Access 2025, 13, 65797–65822. [Google Scholar] [CrossRef]
- Nie, Z.; Feng, Z.; Li, M.; Zhang, C.; Zhang, Y.; Long, D.; Zhang, R. When Text Embedding Meets Large Language Model: A Comprehensive Survey. arXiv 2025, arXiv:2412.09165. [Google Scholar]
- Wu, Y.; Schuster, M.; Chen, Z.; Le, Q.V.; Norouzi, M.; Macherey, W.; Krikun, M.; Cao, Y.; Gao, Q.; Macherey, K.; et al. Google’s neural machine translation system: Bridging the gap between human and machine translation. arXiv 2016, arXiv:1609.08144. [Google Scholar]
- Taku, K.; Richardson, J. Sentencepiece: A simple and language independent subword tokenizer and detokenizer for neural text processing. arXiv 2018, arXiv:1808.06226. [Google Scholar] [CrossRef]
- Rico, S.; Haddow, B.; Birch, A. Neural machine translation of rare words with subword units. arXiv 2015, arXiv:1508.07909. [Google Scholar]
- Philip, G. A new algorithm for data compression. C Users J. 1994, 12, 23–38. [Google Scholar]
- Tedo, V.; Meštrović, A. Corpus-based paraphrase detection experiments and review. Information 2020, 11, 241. [Google Scholar] [CrossRef]
- You, K. Semantics at an Angle: When Cosine Similarity Works Until It Doesn’t. arXiv 2025, arXiv:2504.16318. [Google Scholar]
- Pooling and Attention: What are Effective Designs for LLM-based Embedding Models? arXiv 2024, arXiv:2409.02727. Available online: https://arxiv.org/html/2409.02727v2 (accessed on 10 May 2025). [CrossRef]
- Aslam, M.A.; Khan, K.; Khan, W.; Khan, S.U.; Albanyan, A.; Algamdi, S.A. Paraphrase detection for Urdu language text using fine-tune BiLSTM framework. Sci. Rep. 2015, 15, 15383. [Google Scholar] [CrossRef]
- Tsinganos, N.; Fouliras, P.; Mavridis, I. Applying BERT for early-stage recognition of persistence in chat-based social engineering attacks. Appl. Sci. 2022, 12, 12353. [Google Scholar] [CrossRef]
- Vrbanec, T.; Meštrović, A. Comparison study of unsupervised paraphrase detection: Deep learning—The key for semantic similarity detection. Expert Syst. 2023, 40, e13386. [Google Scholar] [CrossRef]
- Iqbal, H.R.; Maqsood, R.; Raza, A.A.; Hassan, S.-U. Urdu paraphrase detection: A novel DNN-based implementation using a semi-automatically generated corpus. Nat. Lang. Eng. 2024, 30, 354–384. [Google Scholar] [CrossRef]
- Antonio, S.; Ponti, A.; Candelieri, A.; Giordani, I.; Archetti, F. A Bayesian approach for prompt optimization in pre-trained language models. arXiv 2023, arXiv:2312.00471. [Google Scholar] [CrossRef]
- Perez, G.; Mostaccio, C.; Maltempo, G.; Antonelli, L. Evaluation of natural language processing models to measure similarity between scenarios written in Spanish. Cad. Do IME-Série Informática 2024, 50. [Google Scholar] [CrossRef]
- Ahmed, A.; Huang, D. A semi-supervised Multi-View Siamese Network with dual-contextual attention and knowledge distillation for cross-lingual low-resource paraphrase detection. Eng. Appl. Artif. Intell. 2025, 158, 111441. [Google Scholar] [CrossRef]
- Regilan, S.; Gajalakshmi, P.; Weslin, D.; Vijay, J.; Kadhiravan, D.; Jenitha, J. Benchmarking AI-Driven Resume Screening: An Evaluation of Precision and Efficiency. In Proceedings of the 2025 11th International Conference on Communication and Signal Processing (ICCSP), Melmaruvathur, India, 5–7 June 2025; IEEE: Piscataway, NJ, USA, 2025; pp. 783–788. [Google Scholar]
- Efron, B. Bootstrap methods: Another look at the jackknife. Ann. Stat. 1979, 7, 1–26. [Google Scholar] [CrossRef]
- Efron, B.; Tibshirani, R. An Introduction to the Bootstrap; Chapman & Hall/CRC: Boca Raton, FL, USA, 1993. [Google Scholar]
- Good, P. Permutation Tests: A Practical Guide to Resampling Methods for Testing Hypotheses; Springer: Berlin/Heidelberg, Germany, 2005. [Google Scholar]
- Ernst, M.D. Permutation methods: A basis for exact inference. Stat. Sci. 2004, 19, 676–685. [Google Scholar] [CrossRef]
Disclaimer/Publisher’s Note: The statements, opinions and data contained in all publications are solely those of the individual author(s) and contributor(s) and not of MDPI and/or the editor(s). MDPI and/or the editor(s) disclaim responsibility for any injury to people or property resulting from any ideas, methods, instructions or products referred to in the content. |
© 2025 by the authors. Licensee MDPI, Basel, Switzerland. This article is an open access article distributed under the terms and conditions of the Creative Commons Attribution (CC BY) license (https://creativecommons.org/licenses/by/4.0/).