Abstract
Lighting Systems (LSs) are a key component of modern cities. Across the years, thousands of articles have been published on this topic; nevertheless, a map of the state of the art of the extant literature is lacking. The present review reports on an analysis of the network of the co-occurrences of the authors’ keywords from 12,148 Scopus-indexed articles on LSs published between 1995 and 2024. This review addresses the following research questions: (RQ1) What are the major topics explored by scholars in connection with LSs within the 1995–2024 time frame? (RQ2) How do they group together? The investigation leveraged VOSviewer, an open-source software largely used for performing bibliometric analyses. The number of thematic clusters returned by VOSviewer was determined by the value of the minimum number of occurrences needed for the authors’ keywords to be admitted into the business analysis. If such a number is not properly chosen, the consequence is a set of clusters that do not represent meaningful patterns of the input dataset. In the present study, to overcome this issue, the threshold value balanced the score of four independent clustering validity indices against the authors’ judgment of a meaningful partition of the input dataset. In addition, our review delved into the impact that the use/non-use of a thesaurus of the authors’ keywords had on the number and composition of the thematic clusters returned by VOSviewer and, ultimately, on how this choice affected the correctness of the interpretation of the clusters. The study adhered to a well-known protocol, whose implementation is reported in detail. Thus, the workflow is transparent and replicable.
1. Introduction
Lighting Systems (LSs) are everywhere: inside cities, in homes, in offices, in public buildings, and along streets and highways. The advent of LSs has sped-up human progress, improving, at the same time, the quality of life [1]. Both industry and academia are engaged in the advancement of this relevant category of applications. From the industry side, it can be observed that the lighting industry worldwide is expected to reach a projected revenue of USD 223.3 million by 2030. A compound annual growth rate of about 7.0% is expected for the worldwide lighting industry from 2025 to 2030 (source: https://www.grandviewresearch.com/horizon/outlook/lighting-market-size/global, accessed on 20 March 2025). From the academic side, it can be observed that the research domain of LSs has been active for many years, and this has produced a huge number of studies published in journals, conference proceedings, and book chapters [2].
Bibliometric Analysis (BA) is a popular and rigorous method for exploring and analyzing large volumes of scientific data (hundreds, if not thousands) [3,4,5]. BA comprises two complementary techniques: Performance analysis and Science mapping. The present work focuses on keyword co-occurrence analysis, which is one of the pillars of Science mapping [6,7,8]. Co-keyword analysis, combined with network analysis, can uncover the knowledge produced by research in a given scientific field [9]. The VOSviewer open-source software is used to construct easy-to-interpret bibliometric networks [10]. VOSviewer is largely used in bibliometric studies [11,12,13,14,15,16,17,18,19,20].
The present study has the following merits:
- It provides a map of the state of the art of research in the domain of LSs, within a 1995–2024 time frame. The reported bibliometric research is somewhat urgent because, as will be proven subsequently, the extant literature about LSs is becoming huge; nevertheless, as far as we know, our research is the first study in such a category. In recent years, a recurrent refrain has been that the Internet of Things (IoT) and Artificial Intelligence (AI) are the technologies to rely on, so that traditional LSs can make a qualitative leap by becoming smart and at the same time sustainable. This study highlights that the state of the art of LSs confirms this widespread thinking, but at the same time it tells us that the relevance of AI is still marginal. Such a conclusion confirms previous reports from both academia and industry.
- It meets the rigor requirement for this type of literature review. This objective was pursued by adopting a well-known protocol, whose implementation is reported in full detail. Thus, the investigation is transparent and replicable.
- It delves into the impact that the use/non-use of a thesaurus of authors’ keywords had on the number and composition of the thematic clusters returned by VOSviewer and, ultimately, on how this choice affected the correctness of the interpretation of the clusters. Published articles adopting keyword co-occurrence analysis can be split in two groups: the smaller group mentions the usage of a thesaurus of authors’ keywords [9,11,17,18,21,22,23], while the larger group does not. References [7,12,15,16,20,24,25,26,27,28,29]. Among the seven works belonging to the first group, references [11,17,23] just mentioned that a thesaurus was used, reference [22] focused on the relevance of adopting a thesaurus for data clean-up, finally, references [9,18,21] detailed the steps needed to build a thesaurus of authors’ keywords that complies the VOSviewer’s format. Ref. [18] listed, in addition, the 34 terms which comprised the thesaurus.
- The choice of the number of clusters of authors’ keywords was obtained by balancing the numerical value of four independent methods belonging to the family of so-called “clustering validity approaches” [30,31,32,33,34] with what the experts (the authors on this occasion) judged to be a meaningful partition of the input dataset. Such an approach was recommended in [35,36] for overcoming the issue pointed out in ref. [37]. In the latter work, the authors observed the absence of a reason behind their choice, common to most published articles talking about bibliometric analyses, of the value of the minimum number of occurrences for an authors’ keyword to be included in the BA.
- Regarding the latter two points, it follows that the present study also gives two recommendations from a methodological perspective. First, it points out that keyword co-occurrence analyses must be driven by a robust thesaurus of keywords. Second, the VOSviewer parameters must be optimized.
The remaining part of this work is structured as follows: Section 2 introduces the background necessary to delve into later sections. Section 3 describes the Research Method adopted in the study. Section 4 presents the results of the bibliometric analysis and then replies to the research questions. Section 5 analyses potential threats to the validity of the findings of the present study, while Section 6 concludes the paper. Two appendices complete this paper. Abbreviations lists the used acronyms, while Appendix A shows the entire thesaurus of authors’ keywords entered as input to VOSviewer.
2. Background
This section first recalls the major features of the VOSviewer software, then it focuses on methods that previous research suggested as necessary to accomplish a correct estimation of the number of clusters of authors’ keywords.
2.1. VOSviewer Terminology [38]
This software allows one to create, visualize, and explore networks. A network is composed of nodes and links. Nodes are the objects of interest (authors’ keywords in the present study), while links express a co-occurrence between pairs of nodes. VOSviewer provides a Network Visualization, an Overlay Visualization, and a Density Visualization. Below, we spend a few words about the first two visualization categories.
In Network Visualization, nodes are represented by a circle (the default) and by their label (i.e., the name of the keyword). Nodes are grouped into non-overlapping clusters, labeled as positive numbers. Clusters are colored, the color of a node is the same of the cluster it belongs to. This type of visualization is drawn according to the values of three numeric weight attributes: Links, Total link strength, and Occurrences. The Occurrences attribute denotes the number of papers in which a keyword occurs. The value of this attribute for a node indicates the relevance of the latter in the network. In the visualization, nodes (as well as the associated label) with higher Occurrences are larger than nodes with lower Occurrences. Let us call n a generic node, the value of the Links and Total link strength attributes indicate, respectively, the number of links involving n and the total strength of those links. VOSviewer represents the strength of a link as a positive numerical value. The higher this value, the stronger the link. The thickness of the link between two nodes represents the strength of the link. The strength of a link indicates the number of publications in which two keywords occur together. VOSviewer takes a distance-based approach to visualizing bibliometric networks. The distance between two nodes/keywords in the visualization roughly indicates the relatedness of the keywords in terms of co-occurrence links. In general, the closer two keywords are located to each other, the stronger their relatedness.
The Overlay Visualization depicts a network structurally identical to the previously described network, except that nodes are differently colored. In VOSviewer, by default, colors range from blue (lowest score) to green to yellow (highest score). Colors are shown in the bar located in the bottom right corner of the visualization. The colors are determined by the value of three numeric score attributes: Avg.pub.year, Avg.citations, and Avg.norm.citations. (The latter two attributes are not relevant to the present BA, therefore they are ignored). When Avg.pub.year is selected in the Scores drop down list in the right-hand panel of VOSviewer, then the color of a node/keyword indicates the average publication year of the articles in which that keyword occurs, with yellow indicating terms that mainly occur in recent publications and blue indicating terms that mainly occur in older publications.
2.2. On the Choice of the Number of Clusters
Selecting an appropriate number of clusters (let us call this ) ensures that similar data points are grouped together, without overfitting or underfitting. A poorly chosen may result in clusters that do not represent meaningful patterns in the data. In the case of networks of keyword co-occurrences, the output of the clustering stage is determined by the value of the minimum number of occurrences (briefly, the threshold) for a keyword to be admitted to the BA. Most published articles on bibliometric analysis do not provide any explanation about the rationale behind the choice of . The explanations in these works often look like the following: “the minimum occurrence threshold of authors’ keywords was set at […]” [39] or other equivalent sentences [8,40]. Lim et al. [9] suggested adjusting the value in order to have a network at least of 20 nodes/keywords, but no theoretical foundation was provided to justify their proposal. Frequently, the value changes with the study. For example, in the three articles just mentioned, was equal to 10, 30, and 3, respectively. Such a variety of choices denotes that there is no one-size-fits-all case, which, in turn, raises the issue of how the value should be set. To overcome this issue, in the present study, four independent methods were considered. They are briefly recalled in the following:
- Elbow method [41]This method first measures the Within-Cluster Sum of Squares (WCSS) for a varying cluster number, then it selects the cluster for which the change in WCSS starts to decrease. The mathematical definition of WCSS may be found in [33]. In simple words, we can say that WCSS measures how well the data points are clustered around their respective centroids. With respect to leveraging the Elbow method, it is necessary to note that it provides a starting point, but since, in some cases, the Elbow point may not be distinctly visible, a subjective interpretation is then required. In addition, it is useful to remember that such a method is specifically tailored for centroid-based clustering algorithms like KMeans, so it does not necessarily work well for other methods [36].To reinforce the clustering decision, the Davies–Bouldin index, the Silhouette score, and the Calinski–Harabasz index [33] are frequently adopted, either individually or together.
- Davies–Bouldin Index [42]The Davies–Bouldin (DB) index is defined as the ratio between the intra-cluster distance and the inter-cluster distance. The former distance is calculated as the mean distance between each element in a cluster to the centroid of that cluster. (It offers insights into how closely grouped the elements within a single cluster are); while the latter distance measures how far apart each cluster’s centroid is from the other clusters. (The larger this distance, the more separated the clusters).A lower score of DB index signifies a better cluster formation, with zero being the absolute ideal score. It has been remarked [43] that relying solely on the DB index for cluster analysis would be imprudent, because such an index is only effective with clusters of convex shape. The DB index should be used in conjunction with other metrics for a more holistic evaluation.
- Silhouette score [44]The Silhouette score (Sscore) of an input dataset measures how dense and well separated the clusters are. The mathematical definition of this metric may be found in [35]. For the purposes of the present study, it is sufficient to recall the following: Sscore is defined as [(b − a)/max(a,b)], where “a” and “b” denote, respectively, the mean intra-cluster distance and the mean nearest-cluster distance for each sample in the input dataset. To clarify, b is the distance between a sample and the nearest cluster that the sample is not a part of. Sscore takes values in the range [−1, 1]. A higher score indicates better clustering. Values near 0 indicate overlapping clusters, while negative values generally indicate that a sample has been assigned to the wrong cluster.
- Calinski Harabasz Index [45]The Calinski–Harabasz (CH) index is calculated as the ratio of the sum of inter-cluster dispersion and the sum of intra-cluster dispersion for all clusters (where the dispersion is the sum of squared Euclidean distances). In simple words, the CH index measures how dense and well separated the clusters are. The mathematical definition of this metric may be found in [35]. A higher CH score means better clustering.
In conclusion, it can be said that the attention that should be given to the selection of a strategy for finding the value is well summarized in ref. [35]. In that article, the authors state that the selection of the value should be performed by balancing the suggestions from the application of cluster validity indices with what experts judge to be a meaningful partition of the specific dataset. The same recommendation ended the more recent ref. [36].
3. Research Method
The research methodology followed a well-established protocol [4,5] comprising the following stages:
- Definition of the research objectives.The present work is the outcome of a cooperation between the Department of Industrial & Information Engineering & Economics of University of L’Aquila (Italy) and an Italian SME (B2B S.r.l). Recently, B2B S.r.l stated a desire to obtain an unbiased map about the state of the art of LSs. Their interest originated within national IT projects that B2B S.r.l. is involved in. The aim of the research is represented by the two Research Questions (RQs) this study aimed to answer:RQ1. What are the major topics explored by scholars in connection with LSs in the 1995–2024 time frame?RQ2. How do they group together?
- Literature search and data collection.In ref. [4], it was clarified that it is not necessarily convenient to use more than one scientific database in bibliometric research. A more serious issue comes from the inevitable duplication of publications, which makes the findings of the analysis debatable. In the case of Scopus and Web of Science, for example, the percentage of duplicates tends to be large, because most of journals are scanned in both databases. A previous research work by Singh et al. [46] showed that about 99% of the journals indexed in Web of Science are also indexed in Scopus. Moreover, the integration of items belonging to files obtained by querying distinct databases is time consuming, since they provide article information in a different format. In the present study, we queried Scopus rather than Web of Science due to its significantly greater coverage of published literature in the field of LSs, as will be proven subsequently.In ref. [47], it was remarked that a search string can be either generic or specific. We opted for the first option, since generic search strings maximize the “recall” value (i.e., the fraction of the documents that are relevant to the query that are successfully retrieved). The search string was the following: (“Lighting system” OR “Light control”). These terms are directly related to the study RQs. Previous research has stressed that to extract the literature relevant to the review aim, the terms in the search string are crucial [4]. The above search string was restricted by adding filters for publication type (articles, conference papers, review, and book chapters) and language. These filters represent what in ref. [4] the authors called the inclusion/exclusion criteria to be applied in bibliometric research. The final search string, plus the filters as written by Scopus, were as follows:TITLE-ABS-KEY ((“Lighting system” OR “Light control”)) ANDPUBYEAR > 1994 AND PUBYEAR < 2024 AND (LIMIT-TO (DOCTYPE, “ar”) ORLIMIT-TO (DOCTYPE, “cp”) OR LIMIT-TO (DOCTYPE, “re”) ORLIMIT-TO (DOCTYPE, “ch”)) AND (LIMIT-TO (LANGUAGE, “English”))Scopus returned 12,148 documents, which were saved to the following file:Scopus12148.csv.
- Data screening and PreprocessingWhen multiple databases are queried, cleaning the output dataset is mandatory to ensure accuracy. Basically, it is necessary to remove duplicates and correct authors’ names. This effort was not required in our case, since we only queried Scopus. About the preprocessing, it first included the semi-automatic construction of a thesaurus of authors’ keywords, then the investigation of the best value. Section 4 discusses both these arguments in connection with the clustering effectiveness. In practical terms, this review answers a further relevant research question:RQ3. What is the impact of the thesaurus of authors’ keywords and the value on the clustering effectiveness?
- Selection of Bibliometric techniquesThe Scopus engine computes statistics for the “publication” and “citation” performance of authors, journals, institutions, and countries. These bibliometric indicators were developed by running a Performance analysis on the dataset output of the search [4]. To match the aim of the present review and, hence, to be able to answer the RQs, the Science Mapping analysis procedure was selected [4,5]. Specifically, keyword analysis was chosen, since this bibliometric method allows mapping relevant publications on a given topic ([3,25]) (in our case the LSs domain), because the authors’ keywords represented the major themes of the underlying publication (before delving into the investigation of its content through a systematic literature review). Moreover, such an analysis allows tracking the evolution of the reference research field over time, and hence recognizing emerging trends.
- Data analysis, Visualization, and ReportingData analysis and visualization were carried out leveraging VOSviewer. Preliminary, the authors entered the Scopus12148.csv file (returned by Scopus) into VOSviewer. The following options were selected in sequence: (a) create a map based on bibliographic data; (b) read data from the bibliographic database file. As the counting method, full counting was selected. The interpretation of the results is the subject of Section 4, where the three RQs are also answered.
4. Results
This section goes into detail about (a) data collection; (b) data preprocessing (i.e., thesaurus construction and computation of the number of clusters); (c) analysis of the network of the keyword co-occurrences without a thesaurus; and (d) analysis of the network of the keyword co-occurrences in the presence of the thesaurus. The latter argument is split into a node analysis, link analysis, and temporal evolution of the research topics. By summarizing the results, it will be possible to answer the three RQs (Section 6).
4.1. Data Collection
As mentioned in the previous section, the Scopus reply to the input search string was the Scopus12148.csv file composed of 12,148 documents. (Queried with the same search string, Web of Science returned 5577 items, i.e., less than half of the items returned by Scopus.) In addition, Scopus provided the following statistics (built by performing a Performance analysis on the .csv file): documents by year; documents per year by source; documents by author; documents by affiliations; documents by country or territory; document by type; documents by subject area; documents by funding sponsor. Table 1 and Table 2 show, respectively, “documents by year” and “documents venue” to provide an overview of the research performance in the LS domain.

Table 1.
Distribution of papers over the years.
Table 2.
Aggregation of papers by type.
4.2. About Data Preprocessing
As said in Section 3, the preprocessing of the Scopus12148.csv file was carried out in two sequential steps. They are described in the following:
4.2.1. The Thesaurus
In the LSs domain, there are no publicly available thesauri of terms, hence the need to create one. It has been noted that the semi-automatic construction of thesauri using bibliometric analysis tools produces good results and in less time than completely manual creation [48]. The approach followed in this work for the construction of the thesaurus of the authors’ keywords is in line with [48].
Initially, a thesaurus of the authors’ keywords was built. The construction was semi-automatic, as explained hereafter. Using VOSviewer, a network of keyword co-occurrences was built starting from the Scopus12148.txt file. VOSviewer returned 22,999 distinct keywords. Setting (similar values have been used in many previously published articles), 1096 keywords satisfied the constraints. Of these, 1089 were interconnected. We chose to limit our attention to these keywords. The 1089 keywords were copied into a word table. Then, the keywords column was sorted in ascending order and, subsequently a second column was added.
Eventually, the thesaurus was built manually and copied into a Thesaurus.txt file. The latter has the structure required by VOSviewer [10]. The contents of the Thesaurus.txt are given in Appendix A, which also shows the synonyms of each keyword in the thesaurus. Table 3 lists the 87 distinct keywords that are part of the built thesaurus, together with the number of synonyms of each keyword. By considering the synonyms, it turned out that the 87 keywords in the thesaurus covered 312 keywords (i.e., the 28.65%) in the text file returned by VOSviewer. The ignored 777 keywords were either too generic or outside of scope of the present BA. Table 4 shows examples of these two categories.
Table 3.
The distinct keywords in the thesaurus (NoS = Number of Synonyms).
Table 4.
Examples of ignored keywords.
In Section 1, it was remarked that despite use of a thesaurus of authors’ keywords being highly recommended (see, for instance, ref. [10]), its adoption is rare. Refs. [18,22] are the only two articles that we found where a thesaurus about authors’ keywords was not just mentioned but also built and used.
4.2.2. Computation of the Number of Clusters
Figure 1 shows the dataset of the 87 keywords returned by VOSviewer, starting from the 12,148 documents, plus the thesaurus. The points are very dense. This statement is confirmed by the negative result of the test for finding outliers performed by calling the LocalOutlierFactor function, which is part of sklearn.neighbors.
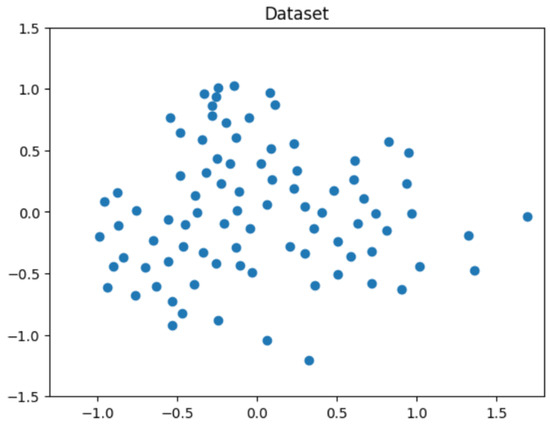
Figure 1.
The points corresponding to the 87 keywords returned by VOSviewer.
The computation of the four methods recalled in Section 2 was performed using the Colab hosted Jupyter Notebook service that provides free-of-charge access to computing resources (namely: CPU, Python, and a rich pool of ML libraries). Preliminary, the elbow method was applied to the input dataset (Figure 1). Figure 2 shows a plot of WCSS against the number of clusters. The point on the plot where the WCSS curve starts to flatten suggests that was the “optimal” number of clusters in our case. After this step, we made further measurements to consolidate the somehow subjective interpretation of the Elbow plot. Table 5 reports the results. As the value, we adopted 70. This value produced , which represented the best trade-off between the suggestion coming from the application for the three selected cluster validity indices and our judgment about a satisfactory partition of the input dataset (Section 2.2).
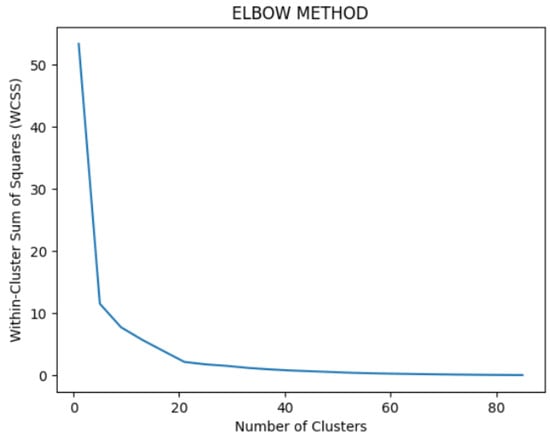
Figure 2.
WCSS against the number of clusters.
Table 5.
Summary of the measurements for varying values. (NoC = Number of Clusters; NoK = Number of Keywords; DB score = Davies–Bouldin score; Sscore = Silhoutte score; CH score = Calinski–Harabasz score).
The next two subsections discuss, in order, the keyword co-occurrence network in the absence and presence of the thesaurus of authors’ keywords.
4.2.3. Analysis of the Network of Keyword Co-Occurrences Without a Thesaurus
Initially, the analysis of the keyword co-occurrences was performed without the thesaurus, as done in a large number of published articles. It has already been mentioned that by submitting the Scopus12148.txt file to VOSviewer and setting , the software returned 1096 keywords, of which 1089 were linked to each other. The 1089 keywords were aggregated into 16 distinct thematic clusters. Table 6 shows the top five keywords of each cluster, according to the value of the VOSviewer Occurrences attribute. In [49], the authors also focused their discussion on the top five keywords. The table also shows, for each cluster, the number of involved keywords. Table 7 shows the top 30 keywords (2.7%), selected according to the decreasing value of the Occurrences attribute; while Figure 3 shows the network of the thematic clusters returned by VOSviewer.
Table 6.
The top five keywords of each cluster in the absence of a thesaurus of authors’ keywords. (NK = Number of keywords; Occ = Occurrences).
Table 7.
The top 30 authors’ keywords in the absence of a thesaurus.
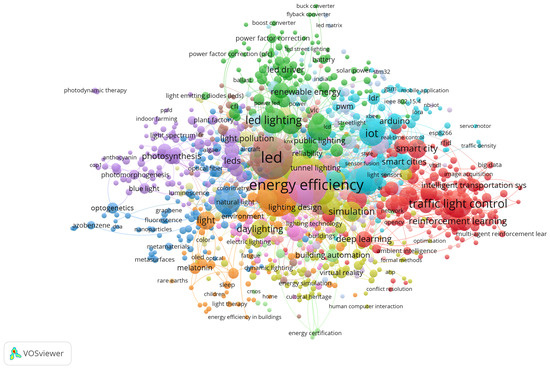
Figure 3.
The network of the thematic clusters returned by VOSviewer when .
Interpretation of the 16 thematic clusters returned by VOSviewer was difficult, due to the simultaneous presence of synonyms, out-of-scope keywords, and too-generic keywords. Let us look, for instance, at Cluster 1 (Figure 4 and Table 8). The following remarks can be made: Cluster 1 is composed of 160 heterogeneous keywords. Examining Table 8, it emerges that Cluster 1 is largely focused on traffic control and traffic light control. This is testified by the following elements:

Figure 4.
Cluster 1 in the absence of a thesaurus and .
Table 8.
The 160 keywords in Cluster 1. (Occ = Occurrences).
Table 9.
Some synonyms of keywords in Cluster 1.
Table 9.
Some synonyms of keywords in Cluster 1.
| Synonyms of … | Keyword | Synonyms of … | Keyword |
|---|---|---|---|
| adaptive traffic light control | Traffic light control | congestion | Traffic control |
| intelligent traffic light | intelligent traffic | ||
| intelligent traffic light control | pedestrian detection | ||
| intelligent traffic system | road traffic congestion | ||
| smart traffic light | simulation of urban mobility (SUMO) | ||
| smart traffic lights | smart traffic | ||
| traffic light | SUMO | ||
| traffic light control | traffic congestion | ||
| traffic light control (tlc) | traffic control | ||
| traffic light control system | traffic control systems | ||
| traffic light control systems | traffic flow | ||
| traffic lights | traffic management | ||
| traffic lights control | traffic monitoring | ||
| traffic signal control | traffic network | ||
| traffic optimization | |||
| traffic simulation | |||
| urban traffic | |||
| urban traffic control |
In addition, Cluster 1 contains keywords addressing transportation either directly (“intelligent transportation systems”, “intelligent transportation system”, “intelligent transport systems”, “intelligent transportation system”, “its”, “transportation”, “intelligent transportation”, “smart transportation”, and “vehicles”) or indirectly (“urban intersections”, “urban mobility”, “vehicle density”, “vehicular networks”, “camera”, “context-aware”, “vehicle detection”, “image acquisition”, and “image segmentation”). There was a further issue that made the interpretation of the thematic clusters returned by VOSviewer difficult in the absence of a thesaurus of keywords. In this latter case, it frequently happened that synonyms belonged to distinct thematic clusters. Table 10 shows a few examples. Last but not least, it is worth noting that most of the keywords mentioned above are outside the scope of the present BA that focused on LSs. In summary, Cluster 1 raises more questions than it answers.
Table 10.
Examples of synonyms belonging to distinct thematic clusters.
4.2.4. Analysis of the Network of the Keyword Co-Occurrences in Presence of the Thesaurus
Using VOSviewer, a keyword co-occurrence network was built starting from the Scopus12148.csv file, while providing the software with the Thesaurus.txt file as input. This time, (see Section 4.2.2). VOSviewer returned a network composed of 25 keywords. The 25 keywords were partitioned into three distinct thematic clusters (Figure 5). The study by Triantafyllopoulos et al. [37] adopted a thesaurus of authors’ keywords that was used together with the Elbow method to decide the number of thematic clusters. Incidentally, in that study, the authors also obtained clusters. As in all networks, keyword networks comprise nodes and links between pairs. Next, the nodes are analyzed.
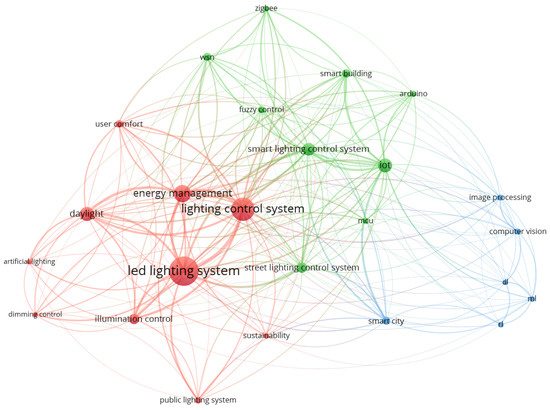
Figure 5.
The network of the keyword co-occurrences returned by VOSviewer for .
- Node analysis
Table 11 and Table 12 list the 25 keywords returned by VOSviewer for . In the first table, the rows are sorted by cluster number and, within each cluster, by decreasing value of the Occurrences attribute; in the second table, the 25 rows are sorted by decreasing value of the Occurrences attribute.
Table 11.
The 25 keywords returned by VOSviewer for , sorted by cluster number. (TLS = Total link strength; Occ = Occurrences).
Table 12.
The 25 keywords returned by VOSviewer for , sorted by Occ value. (Occ = Occurrences).
The following is devoted to analyzing the three clusters composing the keyword co-occurrence network (Figure 5) returned by VOSviewer in the presence of the thesaurus. The three clusters are represented in different colors (red, green, and blue, respectively) based on the link strength between the keywords. Figure 6 shows only the keywords/nodes of the network to better figure out the boundary of the clusters.
Figure 6.
The boundary of the three clusters for .
The keywords inside each cluster are arranged in a logical way to form statements that capture the essence of the research and scope of the clusters. This approach is becoming popular. Two examples of recent studies are [25,26]. The former study conducted a bibliometric investigation of the state of the art regarding entrepreneurship and religions; while the latter reported on the co-occurrence of keywords in the domain of customer engagement. In 2024, this an approach was called “sensemaking” [50]. Carrying out the sensemaking step enables developing a preliminary understanding of the field’s intellectual structure, highlighting the connection of various research topics, before delving into a reading of the full papers (i.e., before starting a systematic literature review). It has been remarked ([3,25]) that keyword co-occurrence analysis reflects the present of the research domain under investigation. In this specific case, through the present BA, this review aimed to answer RQ1 and RQ2 (Section 3).

Figure 7.
Cluster 1 for .
Figure 7.
Cluster 1 for .
The “led lighting system” keyword stood out in Cluster 1, since its value for the Occurrences VOSviewer attribute was the highest among the 25 keywords (oc = 1282). This assertion is confirmed by the findings in [2,51], where the authors stated that LSs are predominantly LED-based today. Moreover, from the cluster, it was reveled that lots of research has been devoted to “lighting control system(s)” (oc = 862) with the aim of reducing energy consumption by mixing “daylight” with “artificial lighting” to make the public LSs of cities more sustainable, ([52,53]) increasing user comfort at the same time [51].

Figure 8.
Cluster 2 for .
Figure 8.
Cluster 2 for .
The nine keywords that compose Cluster 2 tell us that, so far, a lot of papers have investigated the adoption of IoT technology for the development of smart LSs, both for outdoors (the public domain) and indoors (i.e., the smart building domain). Refs. [2,51] confirm this a claim. The fifth keyword in the ranking (i.e., “WSN”) finds an explanation in the review by Gupta et al. [54], where the authors clarified that IoT technology, when incorporated with WSNs, extends its communication capabilities. The adoption of fuzzy logic for smart lighting control (i.e., “fuzzy control”) dates to 2000, when Wu et al. [55] proposed a fuzzy-logic-driven converter for photovoltaic-powered LS applications. More recently, Mohandas et al. [56] investigated a fuzzy logic controller finalized to control the light luminance level in street LSs based on human presence and light condition. Lighting sensors were used as input. The solution combined fuzzy logic with the ANN model. The seventh and eighth keywords refer to the hardware largely used in IoT-based LSs, while “zigbee” is one of the most widely used communication protocols, since it enables low-cost and low-power wireless IoT networks.
Figure 9.
Cluster 3 for .
Figure 9.
Cluster 3 for .
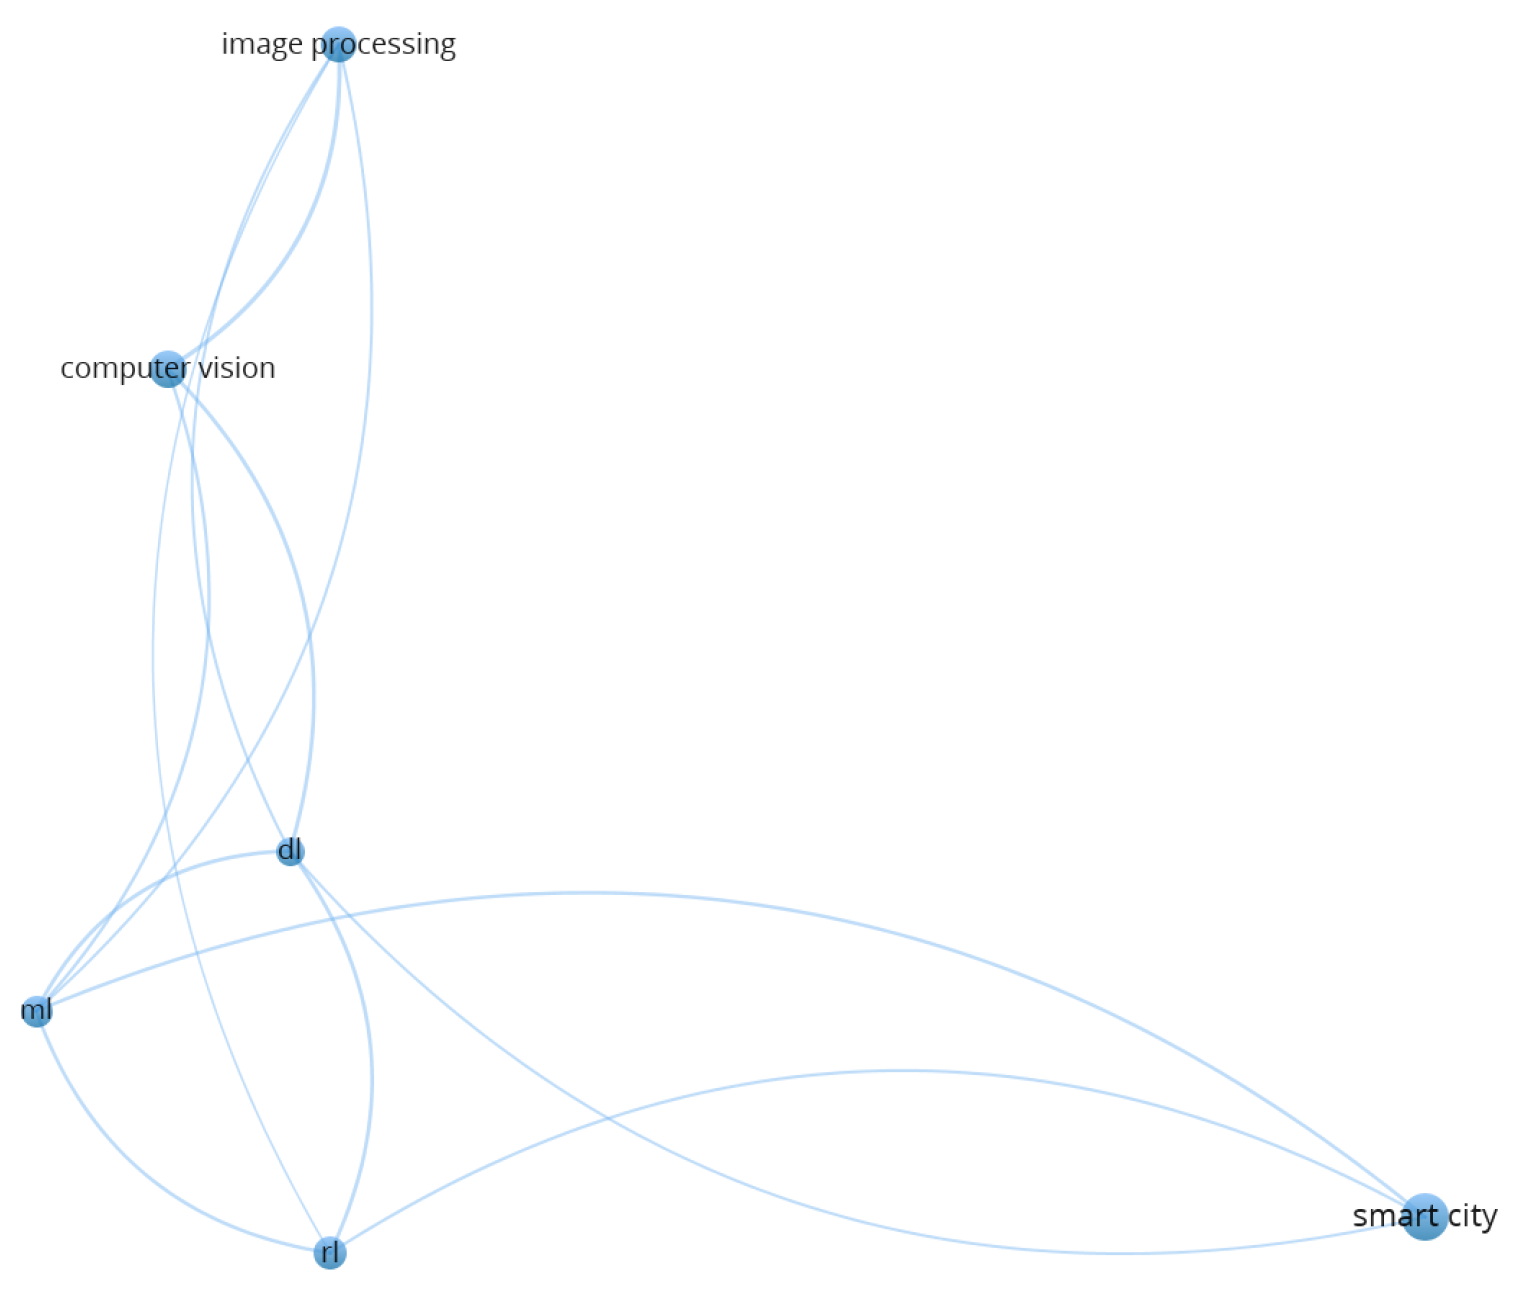
The six keywords in Cluster 3 tell us that to implement future smart cities, both academia and industry are investigating strategies to leverage AI methods (i.e., “computer vision”, “image processing”, and “ML”). This claim is in line with the findings in [2,51].
In light of the above considerations, the following it can be said: The reduced number of keywords and their thematic cohesion allow us to identify, for each of the three clusters, the basic theme that unites the research described by the authors’ keywords in the cluster. Cluster 1 is characterized by research adopting LED-based smart LSs, both for outdoor and indoor applications. Cluster 2 collects studies that propose solutions leveraging IoT technology. Lastly, the third cluster emphasizes the role of Artificial Intelligence in the implementation of smart cities. As a synthesis, it can be said that, from the BA, it emerges that most of the research efforts describe ways to deploy sustainable smart LSs in our cities by combining three technologies, namely LED, IoT, and AI (Figure 10). This finding is in line with the conclusions of two recent systematic literature reviews [2,51].

Figure 10.
The three main topics characterizing the state of the art on the LSs of sustainable cities.
- Link analysis
After commenting on the nodes of the network of authors’ keyword co-occurrences, it is worth spending a few words on the links among them. Table 13 lists the 25 keywords returned by VOSviewer for , in decreasing order of the value of the Links attribute. From graph theory, we know that a graph with 25 nodes can comprise at most 300 edges (25 × 24/2). From Table 13, it emerges that the total number of links among the 25 keywords is 420. After removing repetitions, the number of distinct links becomes 210. Therefore, the degree of completeness of the keyword co-occurrence network is 70%. This means that, on average, each keyword co-occurs with the 70% of the remaining keywords. Of course, there are keywords above the average and keywords below the average. The following considers the nine top keywords in Table 13:
Table 13.
Number of links among the 25 keywords.
“Lighting control system”, “energy management”, and “IoT” are linked with all the remaining 24 keywords, hence they are also linked to each other. This tells us that all the articles returned by the Scopus engine (and mentioning these three keywords) adopted an IoT-based architecture to control lights, with the final aim of managing their energy consumption. The next three keywords are linked to 91.7% of the remaining keywords. This value reaffirms that almost all the selected studies referred to LED-based smart street lighting control systems. The next three keywords affirm that, in about 80% of instances, “illumination control” included daylight in order to implement “smart buildings”. An examination of the bottom side of Table 13 tells us that, so far, the number of studies proposing the adoption of AI/ML is not optimal. Accentuating research in which IoT and AI are the pillars of future LSs is a priority, both for industry and academia, to speed up the development of sustainable cities.
- Temporal evolution of the research topics
Below, we complete the discussion of the results (returned by the analysis of the co-occurrences of authors’ keywords) by examining the temporal evolution of the research topics in the articles about LSs. This information comes to light by reading column Avg.pub.year in Table 14, where the values of the Avg.pub.year score attribute are sorted in ascending order. As described in Section 2.1, the generic value of this attribute denotes the average publication year of the articles in which the keyword on the same row of Table 14 occurs, with yellow indicating terms that mainly occur in recent publications. Therefore, for example, it can be observed that the research topics on lighting control systems initially focused on the use of LEDs (Avg.pub.year = 2016) and also making use of “daylight” (Avg.pub.year = 2016), with the primary intent of containing the energy consumption of such systems (“energy management”; Avg.pub.year = 2017). Then, research turned towards the production of “street lighting control systems” (Avg.pub.year = 2017), “smart buildings” (Avg.pub.year = 2018), and “smart cities” (Avg.pub.year = 2020). The use of the IoT was consolidated in the same period (Avg.pub.year = 2020). Regarding the presence of AI in the LS domain, the overlay visualization (Figure 11) shows that “image processing” (Avg.pub.year = 2015) and “computer vision” (Avg.pub.year = 2016) were investigated first, while ML (Avg.pub.year = 2021), RL (Avg.pub.year = 2021), and DL (Avg.pub.year = 2022) came later.
Table 14.
The average publication year of the articles included in the BA (AVG = Avg.pub.Year).

Figure 11.
Overlay visualization centered on the “lighting control system” keyword.
Table 15 shows the link strength of the “lighting control system” keyword (which represents the heart of the investigation domain of the present work) with the other 24 keywords. The strength of a link indicates the number of publications in which two keywords occur together (Section 2.1). In this case, one of the two keywords was “lighting control system”. The rows of Table 15 are sorted by decreasing values of the VOSviewer Link strength attribute. A comment restricted to the first three rows of the table follows: In the extant literature about LSs, there is a consolidated connection between the “lighting control system” keyword and LED technology to limit energy consumption. Such a goal has been largely investigated by combining artificial light with “daylight”.
Table 15.
Link strength of the “lighting control system” keyword with the remaining 24 keywords.
4.2.5. Comparison of the Two Paths
Hereafter, Path 1 denotes the approach without the thesaurus, while Path 2 is the approach with the thesaurus. The comparison of the two paths with respect to the number of thematic clusters and the number of keywords that composed the thematic network returned by VOSviewer is given as follows: 16 clusters (Path 1) vs. 3 clusters; and 1089 keywords (Path 1) vs. 25 keywords. The strong reduction in the number of keywords in Path 2 with respect to Path 1 differently impacted on the values of the Links and Occurrences VOSviewer attributes (Table 16). Indeed, in the second case compared to the first, the value of the Links attribute dropped considerably, while the value of the Occurrences attribute increased significantly. The explanation of these numbers is given in the previous two sub-sections.
Table 16.
Comparison of the 20 top authors’ keywords in the two paths. (Occ = Occurrences).
5. Limitations
The present BA suffers from two limitations. Firstly, the conclusions were shaped by the bibliometric data retrieved from the Scopus database that it relied upon. The reasons behind such a choice have been explained in Section 3 and supported by prior works; nevertheless, the possibility of missing out LS articles that may have been published in locations not indexed by Scopus cannot be excluded. The other limitation came from restricting the BA to the co-occurrences of the authors’ keywords. The latter technique, by definition, misses information about future research directions. This shortcoming is not relevant from the perspective of the stakeholders of the present study, while it is often an integral part of BAs.
6. Conclusions
The Scopus database was queried to reveal the research on LSs within the 1995–2024 time frame. A total of 12,148 items were retrieved. To map this huge production of knowledge, a co-occurrence analysis of the authors’ keywords was conducted. Three thematic clusters were returned by VOSviewer. Their interpretation allowed answering the following two research questions.
RQ1. What are the major topics explored by scholars in connection with LSs in the 1995–2024 time frame?
RQ2. How do they group together?
Inspired by previous research, this review also aimed to answer a third relevant research question:
RQ3. What is the impact of a thesaurus of authors’ keywords and the value on clustering effectiveness?
The summary of the key findings of the present work follows:
- (Answer to RQ1) The trade-off between the numerical value of four independent methods belonging to the family of clustering validity approaches and the authors’ evaluation of a meaningful partition of the input dataset resulted in three independent clusters, collecting 25 authors’ keywords. The most relevant topics in Cluster 1 were “led lighting system” and “energy management”; while the most relevant topics in Cluster 2 were “IoT”, “smart building”, “street light control system”, “WSN”, “Arduino”, and “MCU”. Finally, the most relevant topics in Cluster 3 were “smart city, “computer vision”, “image processing”, “ML”, “DL”, and “RL”.
- (Answer to RQ2) Most of the research about LSs within the 1995–2024 time frame was devoted to proposing ways to deploy sustainable smart LSs by combining LED technology with the IoT and AI. This finding is in line with the conclusions of two recent systematic literature reviews [2,51].
- (Answer to RQ3) It was proven that, in absence of a thesaurus of authors’ keywords, the interpretation of the thematic clusters returned by VOSviewer became difficult due to the simultaneous presence of synonyms, out of scope keywords, and too-generic keywords. The only way to prevent this situation consisted in making use of the thesaurus. Regarding the choice of the value, this work implemented recommendations from previous research in the field of clustering validity approaches.
- Regarding the construction of the thesaurus, it is worth noting that this is an iterative process. The factors to be taken into account in the workflow are the following: It is fundamental to keep the value low, in order to include a large number of documents. In the present review, the authors started from 12,148 documents retrieved from Scopus. Here, the issue that must be addressed is making the realization of a thesaurus manageable, since the task is not fully automatic. In the present study, was set to 5. By setting = 3, the number of keywords to be considered in the construction of the thesaurus rose from 1096 to 4693, which made the manual work much more tedious and error-prone.
Author Contributions
Conceptualization, P.D.F. and G.P.; methodology, P.D.F. and G.P.; validation, A.P., R.P. and J.C.; formal analysis, P.D.F.; investigation, P.D.F., G.P., A.P., R.P. and J.C.; data curation, F.P.; writing—original draft preparation, P.D.F. and F.P.; visualization, R.P. and F.P.; supervision, F.P. and G.P.; funding acquisition, G.P. All authors have read and agreed to the published version of the manuscript.
Funding
This research received no external funding.
Data Availability Statement
The data presented in this study are available from the authors.
Conflicts of Interest
Author Gaetanino Paolone, Andrea Piazza, and Jacopo Camplone are employed by the company B2B S.r.l. Author Francesco Pilotti and Romolo Paesani are employed by the company Gruppo SI S.c.a.r.l. The remaining author declares that the research was conducted in the absence of any commercial or financial relationships that could be construed as a potential conflict of interest.
Abbreviations
The following abbreviations are used in this manuscript:
| AI | Artificial Intelligence |
| ANN(s) | Artificial Neural Network(s) |
| CNN | Convolution NN |
| CV | Computer Vision |
| DNN | Deep Neural Network |
| DL | Deep Learning |
| DRL | Deep Reinforcement Learning |
| FL | Federated Learning |
| IoT | Internet of Things |
| LDR | Light Dependent Resistor |
| LED | Light Emitting Diode |
| LS(s) | Lighting System(s) |
| MCU | Microcontroller Unit |
| ML | Machine Learning |
| MQTT | Message Queuing Telemetry Transport |
| NN(s) | Neural Network(s) |
| PIR | Passive Infrared |
| PSO | Particle swarm optimization |
| RF | Random Forest |
| RL | Reinforcement Learning |
| RNN(s) | Recurrent Neural Network(s) |
| SME | Small and Medium-sized Enterprise |
| SML | Supervised ML |
| WSN | Wireless Sensor Network |
Appendix A. The Thesaurus
| label | replace by |
| 2D code | |
| 2D code | |
| 2D materials | |
| 3D display | |
| 3D printing | |
| 3D reconstruction | |
| 6lowpan | |
| absorption | |
| accident prevention | |
| active clamp circuit | |
| adaptive | |
| adaptive control | |
| adaptive driving beam | |
| adaptive front-lighting system | |
| adaptive lighting | |
| adaptive lighting system | |
| adaptive optics | |
| adaptive systems | |
| adaptive traffic light control | |
| adaptive traffic signal control | |
| additive manufacturing | |
| afs | |
| agriculture | |
| ahp | |
| ai | |
| aircraft | |
| airfield lighting | |
| airports | |
| algae | |
| algorithm | |
| algorithms | |
| ambient intelligence | |
| android | |
| android application | android application |
| ansys | |
| anthocyanin | |
| antioxidant | |
| antioxidant capacity | |
| application | |
| applications | |
| approach lighting system | |
| arabidopsis | |
| arabidopsis thaliana | |
| architectural lighting | |
| architecture | |
| arduino | arduino |
| arduino microcontroller | arduino |
| arduino nano | arduino |
| arduino uno | arduino |
| arm | |
| artificial intelligence | artificial intelligence |
| artificial light | artificial lighting |
| artificial light at night | artificial lighting |
| artificial lighting | artificial lighting |
| artificial lighting system | |
| artificial neural network | ANN |
| artificial neural networks | ANN |
| artificial neural networks (anns) | ANN |
| augmented reality | |
| automatic control | |
| automation | |
| automotive | |
| automotive lighting | |
| automotive lighting system | |
| autonomous distributed control | |
| autonomous vehicles | |
| availability | |
| azobenzene | |
| ballast | |
| battery | |
| beam shaping | |
| behavior | |
| behaviour | |
| bidirectional converters | |
| big data | |
| bi-level optimization | |
| biodynamic lighting | |
| biomass | |
| blue light | |
| bluetooth | bluetooth |
| boost converter | |
| bright light | |
| brightness | |
| broiler | |
| buck converter | |
| buck-boost converter | |
| building | |
| building automation | Smart building |
| building energy | building energy management |
| building energy consumption | building energy management |
| building energy efficiency | building energy management |
| building energy management | building energy management |
| building energy management system | building energy management |
| building energy saving | building energy management |
| building envelope | |
| building information modeling | |
| building performance simulation | |
| building simulation | |
| buildings | |
| calibration | |
| camera | |
| can bus | |
| carbon emission reduction | |
| carbon emissions | |
| carbon footprint | |
| carotenoids | |
| case studies | |
| case study | |
| cc2530 | |
| cct | |
| cellular automata | |
| cfd | |
| cfl | |
| charge controller | |
| children | |
| chlorophyll | |
| chlorophyll fluorescence | |
| chromaticity coordinates | |
| circadian | |
| circadian clock | |
| circadian light | |
| circadian lighting | |
| circadian rhythm | |
| circadian rhythms | |
| circadian stimulus | |
| classification | |
| climate change | |
| cloud | cloud computing |
| cloud computing | cloud computing |
| clustering | |
| cmos | |
| co2 emission | |
| co2 emissions | |
| color | |
| color control | lighting control system |
| color mixing | lighting control system |
| color rendering | lighting control system |
| color rendering index | lighting control system |
| color temperature | lighting control system |
| colorimetry | lighting control system |
| colour | |
| colour temperature | lighting control system |
| comfort | User comfort |
| commercial buildings | |
| communication | |
| compact fluorescent lamp | |
| compact fluorescent lamp (cfl) | |
| component | |
| computational fluid dynamics | |
| computational fluid dynamics (cfd) | |
| computer simulation | |
| computer vision | computer vision |
| conflict resolution | |
| congestion | |
| connected lighting | |
| connected lighting systems | |
| conservation | |
| construction | |
| consumption | |
| context-aware | |
| control | |
| control algorithm | |
| control circuit | |
| control network | |
| control strategies | |
| control strategy | |
| control system | |
| control systems | |
| controlled environment | |
| controlled environment agriculture | |
| controller | |
| controlling | |
| controls | |
| convolutional neural network | CNN |
| convolutional neural networks | CNN |
| cooling | |
| cop1 | |
| correlated color temperature | lighting control system |
| correlated color temperature (cct) | lighting control system |
| correlated colour temperature | lighting control system |
| cost | |
| cost analysis | |
| cost benefit analysis | |
| COVID-19 | |
| cri | |
| cryptochrome | |
| cultivation | |
| cultural heritage | |
| cyanobacteria | |
| cyber-physical systems | |
| daily light integral | daylight |
| dali | |
| data fusion | |
| data-driven | |
| daylight | daylight |
| daylight factor | Daylight |
| daylight harvesting | Daylight |
| daylight simulation | Daylight |
| daylighting | Daylight |
| dc lighting | |
| dc/dc converters | |
| dc-dc converter | |
| dc-dc converters | |
| dc-dc power conversion | |
| dc-dc power converters | |
| decision making | |
| deep learning | DL |
| deep neural networks | DL |
| deep q-learning | deep q-learning |
| deep q-network | deep q-learning |
| deep reinforcement learning | DRL |
| deep reinforcement learning (drl) | DRL |
| defect detection | |
| degradation | |
| delirium | |
| demand response | |
| demand side management | |
| dementia | |
| design | |
| development | |
| dialux | |
| dialux evo | |
| dialux evo software | |
| diffraction | |
| diffuser | |
| diffusers | |
| digital control | |
| digital twin | Digital twin |
| dimmer | |
| dimming | dimming control |
| dimming control | dimming control |
| dimming level | dimming control |
| direct current | |
| discomfort glare | |
| discontinuous conduction mode (dcm) | |
| displays | |
| distributed control | |
| distributed generation | |
| distributed systems | |
| dna | |
| domotics | |
| driver | |
| driving simulator | |
| dynamic control | |
| dynamic light | lighting control system |
| dynamic light control | lighting control system |
| dynamic lighting | lighting control system |
| dynamic traffic light control | |
| economic analysis | |
| economic evaluation | |
| edge computing | edge computing |
| edge detection | |
| eeg | |
| efficacy | |
| efficiency | |
| efficiency evaluation | |
| efficient lighting | energy management |
| electric lighting | |
| electrical energy | |
| electrical lighting | |
| electricity | |
| electricity consumption | energy management |
| electrochromism | |
| electroluminescence | |
| electrolytic capacitor | |
| electromagnetic interference | |
| electromagnetic interference (emi) | |
| electronic ballast | |
| electronic ballasts | |
| embedded system | embedded system |
| embedded systems | embedded system |
| emergency lighting | emergency lighting |
| emergency vehicle | |
| emergency vehicles | |
| emission | |
| emission reduction | |
| emissions | |
| energy | |
| energy audit | |
| energy certification | |
| energy conservation | |
| energy consumption | |
| energy conversion | |
| energy demand | |
| energy efficiency | |
| energy efficiency in buildings | |
| energy efficient | |
| energy efficient lighting | energy management |
| energy harvesting | energy management |
| energy management | energy management |
| energy management system | energy management |
| energy modeling | |
| energy optimization | energy management |
| energy performance | energy management |
| energy policy | |
| energy retrofit | |
| energy saving | energy management |
| energy savings | energy management |
| energy simulation | |
| energy storage | |
| energy use | energy management |
| energy use efficiency | energy management |
| energy-efficiency | |
| energyplus | |
| energy-saving | energy management |
| environment | |
| environmental monitoring | environmental sustainability |
| environmental protection | environmental sustainability |
| environmental sustainability | environmental sustainability |
| esp8266 | |
| ethernet | |
| evaluation | |
| experimental measurements | |
| experimental study | |
| face recognition | face recognition |
| fatigue | |
| fault detection | |
| fault tolerance | |
| feedback | |
| feedback control | |
| fiber optic | |
| fiber optic lighting | |
| fiber optics | |
| field study | |
| flavonoids | |
| flicker | |
| flowering | |
| fluorescence | fluorescent lamp |
| fluorescent | fluorescent lamp |
| fluorescent lamp | fluorescent lamp |
| fluorescent lamps | fluorescent lamp |
| flyback | |
| flyback converter | |
| fog computing | fog computing |
| formal methods | |
| formal verification | |
| fpga | FPGA |
| freeform optics | |
| fresnel lens | |
| fuzzy control | fuzzy control |
| fuzzy controller | fuzzy control |
| fuzzy logic | fuzzy control |
| fuzzy logic controller | fuzzy control |
| gallium nitride | |
| game theory | |
| gas exchange | |
| gene expression | |
| genetic algorithm | genetic algorithm |
| genetic algorithms | genetic algorithm |
| genetic code expansion | genetic algorithm |
| germination | |
| gis | |
| glare | |
| glass | |
| gold nanoparticles | |
| gprs | |
| gps | |
| graphene | |
| graphical user interface | |
| green building | green building |
| green buildings | green building |
| green energy | |
| green light | Daylight |
| green lighting | Daylight |
| green technology | |
| green wave | |
| greenhouse | green building |
| greenhouse gases | |
| greenhouses | green building |
| growth | |
| growth chamber | |
| gsm | |
| gsm module | |
| harmonic | |
| harmonics | |
| haul road | |
| headlamp | |
| headlamps | |
| health | |
| heat sink | |
| heat transfer | |
| heating | |
| hid | |
| hid lamps | |
| high power led | LED |
| high pressure sodium | high pressure sodium lamp |
| high pressure sodium lamp | high pressure sodium lamp |
| high-pressure sodium lamp | high pressure sodium lamp |
| highway | |
| historical building | |
| historical buildings | |
| holography | |
| home | |
| home automation | home automation |
| home energy management system | Smart building |
| horticulture | |
| hospitals | |
| hps | |
| hps lamp | |
| human centric lighting | human centric lighting |
| human computer interaction | |
| human detection | motion detection |
| human-centric lighting | human centric lighting |
| hvac | |
| hy5 | |
| hybrid lighting | hybrid lighting system |
| hybrid lighting system | hybrid lighting system |
| hybrid system | |
| hydroponics | |
| hyperspectral imaging | |
| ieee 802.15.4 | |
| illuminance | illumination control |
| illuminance distribution | illumination control |
| illuminance level | illumination control |
| illuminance sensor | illumination sensor |
| illuminance uniformity | illumination control |
| illumination | illumination control |
| illumination control | illumination control |
| illumination design | illumination control |
| illumination sensing | illumination sensor |
| illumination system | illumination control |
| image acquisition | image processing |
| image analysis | image processing |
| image processing | image processing |
| image segmentation | image processing |
| incandescent | |
| india | |
| indoor air quality | |
| indoor environment | |
| indoor environmental quality | |
| indoor farming | |
| indoor lighting | indoor lighting system |
| indoor lighting system | indoor lighting system |
| indoor localization | |
| industrial lighting | industrial lighting |
| industry | |
| infrared | |
| infrared sensor | infrared sensor |
| infrared sensors | infrared sensor |
| integrative lighting | |
| intelligent | |
| intelligent building | |
| intelligent buildings | |
| intelligent control | |
| intelligent light | Smart lighting control system |
| intelligent lighting | Smart lighting control system |
| intelligent lighting control | Smart lighting control system |
| intelligent lighting system | Smart lighting control system |
| intelligent lighting systems | Smart lighting control system |
| intelligent street lighting | Smart lighting control system |
| intelligent system | |
| intelligent systems | |
| intelligent traffic | |
| intelligent traffic control | |
| intelligent traffic light | |
| intelligent traffic light control | |
| intelligent traffic system | |
| intelligent transport system | |
| intelligent transport systems | |
| intelligent transportation | |
| intelligent transportation system | |
| intelligent transportation system (its) | |
| intelligent transportation systems | |
| intensity | |
| interaction design | |
| interactive lighting | |
| interface | |
| interior lighting | Indoor lighting system |
| interior lighting system | Indoor lighting system |
| internet of things | IoT |
| internet of things (iot) | IoT |
| internet of vehicles | |
| internet-of-things | IoT |
| intersection | |
| intersections | |
| inverter | |
| iot | IoT |
| ir sensor | PIR sensor |
| irradiance | |
| its | |
| junction temperature | |
| knx | |
| label | |
| labview | |
| lamp | |
| lamps | |
| laser | |
| laser diode | |
| lca | |
| lcd | |
| ldr | LDR sensor |
| ldr sensor | LDR sensor |
| led | LED lighting system |
| led (light emitting diode) | LED lighting system |
| led array | LED lighting system |
| led dimming | LED lighting system |
| led driver | LED lighting system |
| led drivers | LED lighting system |
| led illumination | LED lighting system |
| led lamp | LED lighting system |
| led lamps | LED lighting system |
| led light | LED lighting system |
| led light source | LED lighting system |
| led lighting | LED lighting system |
| led lighting control | LED lighting system |
| led lighting system | LED lighting system |
| led lighting systems | LED lighting system |
| led lights | LED lighting system |
| led luminaire | LED lighting system |
| led luminaires | LED lighting system |
| led matrix | LED lighting system |
| led street lighting | LED lighting system |
| led system | LED lighting system |
| led systems | LED lighting system |
| led technology | LED lighting system |
| leds | LED lighting system |
| leni | |
| lenses | |
| lettuce | |
| library | |
| life | |
| life cycle assessment | |
| life cycle cost | |
| life cycle cost analysis | |
| life-cycle assessment | |
| lifetime | |
| li-fi | |
| light | |
| light control | lighting control system |
| light control film | |
| light control system | lighting control system |
| light controller | |
| light dependent resistor | LDR sensor |
| light dependent resistor (ldr) | LDR sensor |
| light dimming | Dimming control |
| light distribution | |
| light emitting diode | LED lighting system |
| light emitting diode (led) | LED lighting system |
| light emitting diodes | LED lighting system |
| light emitting diodes (leds) | LED lighting system |
| light environment | |
| light guide | |
| light intensity | |
| light pipe | |
| light pollution | |
| light quality | |
| light regulation | lighting control system |
| light scattering | |
| light sensor | light sensor |
| light sensors | light sensor |
| light shelf | |
| light signaling | |
| light source | |
| light sources | |
| light spectrum | |
| light therapy | |
| light-control | |
| light-emitting diode | LED lighting system |
| light-emitting diode (led) | LED lighting system |
| light-emitting diodes | LED lighting system |
| light-emitting diodes (led) | LED lighting system |
| light-emitting diodes (leds) | LED lighting system |
| lighting | |
| lighting comfort | User comfort |
| lighting conditions | lighting control system |
| lighting control | lighting control system |
| lighting control system | lighting control system |
| lighting control systems | lighting control system |
| lighting controls | lighting control system |
| lighting design | |
| lighting efficiency | energy management |
| lighting energy | energy management |
| lighting quality | lighting control system |
| lighting retrofit | |
| lighting simulation | |
| lighting simulations | |
| lighting system | lighting control system |
| lighting system design | |
| lighting systems | lighting control system |
| lighting technology | |
| lights | |
| linear programming | |
| liquid crystal | |
| liquid crystal display | |
| liquid crystals | |
| localization | |
| long lifetime | |
| lonworks | |
| lora | LoRa |
| lorawan | |
| low power consumption | energy management |
| lumen maintenance | |
| luminaire | |
| luminaires | |
| luminance | |
| luminescence | |
| luminous efficacy | User comfort |
| luminous environment | |
| luminous flux | |
| luminous intensity | |
| lux | |
| m2m | |
| machine learning | ML |
| machine vision | Computer vision |
| maintenance | maintenance |
| management | |
| management system | |
| markov decision process | |
| matlab | |
| maximum power point tracking | |
| mcu | MCU |
| measurement | |
| melanopsin | |
| melatonin | |
| mesopic vision | |
| metamaterials | |
| metasurface | |
| metasurfaces | |
| microalgae | |
| microcontroller | MCU |
| microcontrollers | MCU |
| microgrid | |
| micropropagation | |
| mobile application | mobile application |
| mobility | |
| model | |
| model checking | |
| model predictive control | |
| modeling | |
| modelling | |
| monitoring | |
| monitoring system | |
| motion detection | motion detection |
| motion sensor | |
| mppt | MPPT |
| mqtt | MQTT |
| multi agent system | multi agent system |
| multi-agent | multi agent system |
| multi-agent reinforcement learning | multi agent system |
| multi-agent system | multi agent system |
| multi-agent systems | multi agent system |
| multi-objective optimization | |
| multiple intersections | |
| museum | |
| museum lighting | museum lighting system |
| myopia | |
| nanocrystals | |
| nanomaterials | |
| nanoparticles | |
| nanophotonics | |
| natural convection | |
| natural light | Daylight |
| natural lighting | Daylight |
| natural ventilation | |
| nb-iot | NB-IoT |
| negotiation | |
| network | |
| neural network | NN |
| neural networks | NN |
| nitric oxide | |
| nodemcu | |
| node-red | |
| nonimaging optics | |
| non-imaging optics | |
| nonlinear optics | |
| non-visual effects of light | |
| numerical simulation | |
| object detection | computer vision |
| occupancy | occupant behavior |
| occupancy and daylight adaptation | occupant behavior |
| occupancy detection | motion detection |
| occupancy sensing | occupant behavior |
| occupancy sensors | occupant behavior |
| occupant behavior | occupant behavior |
| occupant behaviour | occupant behavior |
| off-grid | |
| office | |
| office building | |
| office buildings | |
| office environment | |
| office lighting | office lighting |
| offices | |
| oled | |
| oleds | |
| open source | |
| opencv | |
| optical | |
| optical communication | |
| optical communications | |
| optical design | |
| optical fiber | |
| optical fibers | |
| optical properties | |
| optical system | |
| optics | |
| optimal control | |
| optimisation | |
| optimization | |
| optochemical biology | |
| optoelectronics | |
| optogenetics | |
| organic light emitting diodes | |
| outdoor lighting | outdoor lighting system |
| packaging | |
| par | |
| particle swarm optimization | PSO |
| pattern recognition | |
| payback period | |
| pedestrian | |
| pedestrian crossing | |
| pedestrian detection | motion detection |
| pedestrian safety | |
| perception | |
| performance | |
| performance evaluation | |
| pervasive computing | ubiquitous computing |
| petri net | |
| petri nets | |
| phenolic compounds | |
| phosphor | |
| phosphors | |
| photobiology | |
| photobioreactor | |
| photocatalysis | |
| photochemistry | |
| photodynamic therapy | |
| photoluminescence | |
| photometry | |
| photomorphogenesis | |
| photonic crystal | |
| photonics | |
| photoperiod | |
| photopharmacology | |
| photoreceptor | |
| photoreceptors | |
| photosensors | |
| photosynthesis | |
| photosynthetic photon flux density | |
| photosynthetically active radiation (par) | |
| phototaxis | |
| photovoltaic | |
| photovoltaic (pv) | |
| photovoltaic cell | |
| photovoltaic cells | |
| photovoltaic system | |
| photovoltaic systems | |
| photovoltaics | |
| phytochrome | |
| pic microcontroller | PIC MCU |
| pir | PIR sensor |
| pir sensor | PIR sensor |
| plant factory | |
| plant growth | |
| plant lighting | plant lighting |
| plants | |
| plasmonics | |
| plc | |
| poe | |
| polarization | |
| polarized invisible code | |
| polarized light control | |
| polymer-dispersed liquid crystal | |
| position estimation | |
| poultry | |
| power | |
| power consumption | |
| power electronics | |
| power factor | |
| power factor correction | |
| power factor correction (pfc) | |
| power led | |
| power leds | |
| power line communication | |
| power management | energy management |
| power quality | |
| power saving | energy management |
| ppfd | |
| precision agriculture | |
| prediction | |
| predictive control | |
| predictive maintenance | predictive maintenance |
| principal component analysis | |
| privacy | |
| production | |
| productivity | |
| public lighting | public lighting system |
| public lighting system | public lighting system |
| pulse width modulation | |
| pulse width modulation (pwm) | |
| pv | |
| pv panel | |
| pv system | |
| pwm | |
| pwm dimming | |
| python | python |
| q-learning | q-learning |
| quality | |
| quality control | |
| quantum dots | |
| radar | |
| radiance | |
| radiated emission | |
| radiometry | |
| rare earths | |
| raspberry pi | raspberry pi |
| ray tracing | |
| reactive oxygen species | |
| reactive power | |
| real-time | |
| real-time control | |
| real-time monitoring | |
| real-time systems | |
| red light | |
| reflectance | |
| reflection | |
| reflective | |
| reflector | |
| refractive index | |
| regression analysis | regression analysis |
| regulation | |
| reinforcement learning | RL |
| reinforcement learning (rl) | RL |
| relays | |
| reliability | |
| remote control | remote monitoring |
| remote monitoring | remote monitoring |
| remote sensing | |
| renewable energies | |
| renewable energy | |
| renewable energy sources | |
| renovation | |
| requirements engineering | |
| retina | |
| retrofit | |
| retrofitting | |
| return on investment | |
| rfid | |
| rgb | |
| risk | |
| road lighting | Public lighting system |
| road safety | |
| road traffic congestion | |
| road tunnel | |
| roadway lighting | Public lighting system |
| robustness | |
| rural electrification | |
| safety | |
| saving energy | energy management |
| scada | |
| scattering | |
| scheduling | |
| school buildings | public building |
| secondary metabolites | |
| secondary optics | |
| security | security |
| segmentation | |
| self-assembly | |
| self-powered | |
| sensitivity analysis | |
| sensor | |
| sensor fusion | |
| sensor network | |
| sensor networks | |
| sensors | |
| servo motor | |
| shading | |
| signal control | |
| signal transduction | |
| signalized intersection | |
| simulation | |
| simulation of urban mobility (sumo) | |
| simulink | |
| single chip microcomputer | |
| single intersection | |
| single stage | |
| skyglow | |
| sleep | |
| sleep quality | |
| smart | |
| smart building | smart building |
| smart buildings | smart building |
| smart cities | smart city |
| smart city | smart city |
| smart control | |
| smart environments | |
| smart grid | smart grid |
| smart grids | smart grid |
| smart home | smart building |
| smart homes | smart building |
| smart light | |
| smart lighting | smart lighting control system |
| smart lighting control | smart lighting control system |
| smart lighting system | smart lighting control system |
| smart lighting systems | smart lighting control system |
| smart lights | smart lighting control system |
| smart meters | |
| smart street light | smart street lighting system |
| smart street lighting | smart street lighting system |
| smart street lighting system | smart street lighting system |
| smart street lights | smart street lighting system |
| smart streetlight | smart street lighting system |
| smart systems | |
| smart traffic | |
| smart traffic light | |
| smart traffic lights | |
| smart transportation | |
| smart window | |
| smart windows | |
| smartphone | |
| soft-switching | |
| software | |
| software goniophotometer | |
| solar | |
| solar cell | |
| solar cells | |
| solar collector | |
| solar concentrator | |
| solar energy | Daylight |
| solar lighting | Daylight |
| solar lighting system | Daylight |
| solar panel | |
| solar photovoltaic | |
| solar power | |
| solar radiation | Daylight |
| solar street lighting | smart street lighting system |
| solid state lighting | |
| solid-state lighting | |
| spatial light modulator | |
| spectral power distribution | |
| spectrum | |
| stability | |
| stadium | |
| standards | |
| statistical analysis | |
| stm32 | STM32 |
| stray light | |
| stray light analysis | |
| stray light control | lighting control system |
| street lamp | |
| street light | street lighting control system |
| street light control system | street lighting control system |
| street lighting | street lighting control system |
| street lighting control | street lighting control system |
| street lighting system | street lighting control system |
| street lighting systems | street lighting control system |
| street lights | street lighting control system |
| streetlight | street lighting control system |
| streetlights | street lighting control system |
| stress | |
| structured light | |
| style | |
| sumo | |
| sunlight | daylight |
| supercapacitor | |
| supplemental lighting | |
| surface plasmon resonance | |
| surgical lighting | |
| survey | |
| sustainability | sustainability |
| sustainable building | smart building |
| sustainable development | sustainability |
| sustainable energy | energy management |
| sustainable lighting | energy management |
| switched-mode power supply | |
| synthetic biology | |
| system | |
| system design | |
| system reliability | |
| technology | |
| telescope | |
| temperature | |
| temperature sensor | |
| temporal light modulation | |
| thd | |
| thermal analysis | |
| thermal comfort | |
| thermal conductivity | |
| thermal design | |
| thermal management | |
| thermal resistance | |
| thin films | |
| thingspeak | |
| tomato | |
| total harmonic distortion | |
| total harmonic distortion (thd) | |
| total internal reflection | |
| tracking | |
| traffic | |
| traffic congestion | |
| traffic control | |
| traffic control systems | |
| traffic density | |
| traffic flow | |
| traffic light | |
| traffic light control | |
| traffic light control (tlc) | |
| traffic light control system | |
| traffic light control systems | |
| traffic light controller | |
| traffic light system | |
| traffic lights | |
| traffic lights control | |
| traffic management | |
| traffic monitoring | |
| traffic network | |
| traffic optimization | |
| traffic safety | |
| traffic signal | |
| traffic signal control | |
| traffic simulation | |
| transcription | |
| transfer learning | |
| transition metal dichalcogenides | |
| transmittance | |
| transportation | |
| triboelectric nanogenerator | |
| tunable | |
| tunnel lighting | tunnel lighting system |
| tunnel lighting system | tunnel lighting system |
| tunnel management | |
| uav | |
| ubiquitous computing | ubiquitous computing |
| ultrasonic sensor | |
| ultraviolet | |
| ultraviolet radiation | |
| unidirectional observation | |
| unified glare rating | |
| uniform illumination | User comfort |
| uniformity | |
| urban intersections | |
| urban lighting | Public lighting system |
| urban mobility | |
| urban traffic | |
| urban traffic control | |
| urbanization | |
| user comfort | User comfort |
| user experience | |
| user interaction | |
| user satisfaction | User comfort |
| uv-b | |
| validation | |
| vanet | |
| vehicle density | |
| vehicle detection | |
| vehicle safety | |
| vehicles | |
| vehicular communications | |
| vehicular networks | |
| ventilation | |
| vertical farming | |
| vertical illuminance | |
| vhdl | |
| virtual prototyping | |
| virtual reality | |
| visibility | |
| visible | |
| visible light | |
| visible light communication | |
| visible light communication (vlc) | |
| visible light communications | |
| vision | |
| visual comfort | User comfort |
| visual fatigue | |
| visual inspection | |
| visual perception | |
| visual performance | User comfort |
| visualization | |
| vlc | |
| voltage regulation | |
| waiting time | |
| waste | |
| wavefront shaping | |
| wavelength | |
| welfare | |
| well-being | |
| white led | |
| white leds | |
| white light | |
| wi-fi | |
| wind energy | |
| window signage | |
| windows | |
| wireless | |
| wireless communication | wireless communication |
| wireless network | Wsn |
| wireless networks | Wsn |
| wireless sensor | Wsn |
| wireless sensor and actuator network | Wsn |
| wireless sensor network | Wsn |
| wireless sensor networks | Wsn |
| wireless sensors | wsn |
| wsn | wsn |
| xbee | |
| yield | |
| yolo | |
| zigbee | zigbee |
| zigbee network | zigbee |
| zigbee technology | zigbee |
The thesaurus keeps the distinction between the strings “lighting control system” and “smart lighting control system”. The former refers to authors’ keywords that do not mention the adjectives intelligent or smart to describe the lighting system, while the latter do. The terms smart or intelligent are largely used to refer to lighting control systems that combine the IoT technology with some form of AI [2]. It can certainly be said that the “smart lighting control system” term is more recent than the other term.
References
- de Kort, Y.; Michalos, A.C. Light and Quality of Life. In Encyclopedia of Quality of Life and Well-Being Research; Springer: Berlin/Heidelberg, Germany, 2014; pp. 3615–3620. [Google Scholar] [CrossRef]
- Paolone, P.; Paesani, R.; Pilotti, F.; Camplone, J.; Piazza, A.; Di Felice, P. Smart Lighting Systems: State-of-the-Art in the Adoption of the EdgeML Computing Paradigm. Future Internet 2025, 17, 90. [Google Scholar] [CrossRef]
- Donthu, N.; Kumar, S.; Mukherjee, D.; Pandey, N.; Lim, W.M. How to conduct a bibliometric analysis: An overview and guidelines. J. Bus. Res. 2021, 133, 285–296. [Google Scholar] [CrossRef]
- Öztürk, O.; Kocaman, R.; Kanbach, D.K. How to design bibliometric research: An overview and a framework proposal. Rev. Manag. Sci. 2024, 18, 3333–3361. [Google Scholar] [CrossRef]
- Passas, I. Bibliometric Analysis: The Main Steps. Encyclopedia 2024, 4, 1014–1025. [Google Scholar] [CrossRef]
- Khan, G.F.; Wood, J. Information technology management domain: Emerging themes and keyword analysis. Scientometrics 2015, 105, 959–972. [Google Scholar] [CrossRef]
- Pesta, B.; Fuerst, J.; Kirkegaard, E.O.W. Bibliometric Keyword Analysis across Seventeen Years (2000–2016) of Intelligence Articles. J. Intell. 2018, 6, 46. [Google Scholar] [CrossRef] [PubMed]
- Narong, D.K.; Hallinger, P. A Keyword Co-Occurrence Analysis of Research on Service Learning: Conceptual Foci and Emerging Research Trends. Educ. Sci. 2023, 13, 339. [Google Scholar] [CrossRef]
- Lim, W.M.; Kumar, S.; Donthu, N. How to combine and clean bibliometric data and use bibliometric tools synergistically: Guidelines using metaverse research. J. Bus. Res. 2024, 182, 114760. [Google Scholar] [CrossRef]
- Van Eck, N.; Waltman, L. Manual for VOSviewer Version 1.6.20; Universiteit Leiden and CWTS: Leiden, The Netherlands, 2023; Available online: https://www.vosviewer.com/documentation/Manual_VOSviewer_1.6.20.pdf (accessed on 20 February 2025).
- Ghani, N.A.; Teo, P.-C.; Ho, T.C.F.; Choo, L.S.; Kelana, B.W.Y.; Adam, S.; Ramliy, M.K. Bibliometric Analysis of Global Research Trends on Higher Education Internationalization Using Scopus Database: Towards Sustainability of Higher Education Institutions. Sustainability 2022, 14, 8810. [Google Scholar] [CrossRef]
- Allam, Z.; Sharifi, A. Research Structure and Trends of Smart Urban Mobility. Smart Cities 2022, 5, 539–561. [Google Scholar] [CrossRef]
- Ali, I.; Balta; Papadopoulos, M.T. Social media platforms and social enterprise: Bibliometric analysis and systematic review. Int. J. Inf. Manag. 2023, 69, 102510. [Google Scholar] [CrossRef]
- Bukar, U.A.; Sayeed, M.S.; Razak, S.F.A.; Yogarayan, S.; Amodu, O.A.; Mahmood, R.A.R. A method for analyzing text using VOSviewer. MethodsX 2023, 11, 102339. [Google Scholar] [CrossRef]
- Kirby, A. Exploratory Bibliometrics: Using VOSviewer as a Preliminary Research Tool. Publications 2023, 11, 10. [Google Scholar] [CrossRef]
- Tripathy, P.; Jena, P.K.; Mishra, B.R. Systematic literature review and bibliometric analysis of energy efficiency. Renew. Sustain. Energy Rev. 2024, 200, 114583. [Google Scholar] [CrossRef]
- Anggraini, W.; Ranggaini, D.; Ariyani, A.P.; Sulistyowati, I. World Trends in Dental Ergonomics Research: A Bibliometric Analysis. Int. J. Environ. Res. Public Health 2024, 21, 493. [Google Scholar] [CrossRef]
- Viola, A.; Hauge, J.B.; Bugár, G.; Uckelmann, D.; Romagnoli, G. Moving from the Internet of Things to the Industrial Metaverse: A Systematic Literature Review. In Proceedings of the 2024 IEEE International Conference on Engineering, Technology, and Innovation (ICE/ITMC), Funchal, Portugal, 24–28 June 2024; pp. 1–7. [Google Scholar] [CrossRef]
- Bukar, U.A.; Sayeed, M.S.; Amodu, O.A.; Razak, S.F.A.; Yogarayan, S.; Othman, M. Leveraging VOSviewer approach for mapping, visualisation, and interpretation of crisis data for disaster management and decision-making. Int. J. Inf. Manag. Data Insights 2025, 5, 100314. [Google Scholar] [CrossRef]
- Krabokoukis, T. Technology Tools in Hospitality: Mapping the Landscape Through Bibliometric Analysis and Presentation of a New Software Solution. Digital 2023, 3, 81–96. [Google Scholar] [CrossRef]
- Shen, X.; Wang, L. Topic evolution and emerging topic analysis based on open-source software. J. Data Inf. Sci. 2020, 5, 126–136. [Google Scholar] [CrossRef]
- Brzozowska-Rup, K.; Nowakowska, M. Bibliometric Studies on Renewable Energy—Poland Compared to Other EU Countries. Energies 2022, 15, 4577. [Google Scholar] [CrossRef]
- Destriana, N.; Zulfikar, R.; Mulyasari, W.; Ismawati, I. Financial Sustainability for a Sustainable Future: A Bibliometric Analysis. Int. J. Sustain. Dev. Plan. 2024, 19, 4653–4662. [Google Scholar] [CrossRef]
- Hisyam; Lin, S.W. Bibliometric analysis of social enterprise literature: Revisit to regroup. J. Innov. Knowl. 2023, 8, 100411. [Google Scholar] [CrossRef]
- Lim, W.M.; Rasul, T.; Kumar, S.; Ala, M. Past, present, and future of customer engagement. J. Bus. Res. 2022, 140, 439–458. [Google Scholar] [CrossRef]
- Kumar, S.; Sahoo, S.; Lim, W.M.; Dana, L. Religion as a social shaping force in entrepreneurship and business: Insights from a technology-empowered systematic literature review. Technol. Forecast. Soc. Change 2022, 175, 121393. [Google Scholar] [CrossRef]
- Alaeddini, M.; Hajizadeh, M.; Reaidy, P. A Bibliometric Analysis of Research on the Convergence of Artificial Intelligence and Blockchain in Smart Cities. Smart Cities 2023, 6, 764–795. [Google Scholar] [CrossRef]
- Lampropoulos, G.; Garzón, J.; Misra, S.; Siakas, K. The Role of Artificial Intelligence of Things in Achieving Sustainable Development Goals: State of the Art. Sensors 2024, 24, 1091. [Google Scholar] [CrossRef] [PubMed]
- Taquia-Faustino, A.; Alvitez-Temoche, D.; Mauricio, F.; Medina, J.; Espinoza-Carhuancho, F.; Mayta-Tovalino, F. Trends, Collaborative Networks, and Impact of Infrared Thermography and Thermal Therapies in Dentistry: A Bibliometric Study. J. Contemp. Dent. Pract. 2024, 25, 803–808. [Google Scholar]
- Unlu, R.; Xanthopoulos, P. Estimating the number of clusters in a dataset via consensus clustering. Expert Syst. Appl. 2019, 125, 33–39. [Google Scholar] [CrossRef]
- Jose-Garcia, A.; Gómez-Flores, W. A survey of cluster validity indices for automatic data clustering using differential evolution. In Proceedings of the Genetic and Evolutionary Computation Conference (GECCO ’21), Lille, France, 10–14 July 2021. [Google Scholar] [CrossRef]
- Yuan, M.; Zobel, J.; Lin, P. Measurement of clustering effectiveness for document collections. Inf. Retr. J. 2022, 25, 239–268. [Google Scholar] [CrossRef]
- Rachwal, A.; Poplawska, E.; Gorgol, I.; Cieplak, T.; Pliszczuk, D.; Skowron, L.; Rymarczyk, T. Determining the Quality of a Dataset in Clustering Terms. Appl. Sci. 2023, 13, 2942. [Google Scholar] [CrossRef]
- Ioannou, I.; Christophorou, C.; Nagaradjane, P.; Vassiliou, V. Performance Evaluation of Machine Learning Cluster Metrics for Mobile Network Augmentation. In Proceedings of the 2024 International Conference on Wireless Communications Signal Processing and Networking (WiSPNET), Chennai, India, 21–23 March 2024; pp. 1–7. [Google Scholar] [CrossRef]
- Gagolewski, M.; Bartoszuk, M.; Cena, A. Are cluster validity measures (in) valid? Inf. Sci. 2021, 581, 620–636. [Google Scholar] [CrossRef]
- Schubert, E. Stop using the elbow criterion for k-means and how to choose the number of clusters instead. ACM SIGKDD Explor. Newsl. 2023, 25, 36–42. [Google Scholar] [CrossRef]
- Triantafyllopoulos, L.; Paxinou, E.; Feretzakis, G.; Kalles, D.; Verykios, V.S. Mapping How Artificial Intelligence Blends with Healthcare: Insights from a Bibliometric Analysis. Future Internet 2024, 16, 221. [Google Scholar] [CrossRef]
- Waltman, L.; vanEck, N.J.; Noyons, E.C.M. A unified approach to mapping and clustering of bibliometric networks. J. Inf. 2010, 4, 629–635. [Google Scholar] [CrossRef]
- Panday, A.; Ray, T.; Jalandharachari, A.S.; Gopinath, G. Insights into blended learning research: A thorough bibliometric study. Discov. Educ. 2025, 4, 50. [Google Scholar] [CrossRef]
- Baffa, M.A.; Mustaffa, Z.; Ahmad, N.R.; El-Atroush, M.E.; Aliyu Yaro, N.S.; Seghier, M.E.A.B. Performance of geothermal energy piles in buildings: A bibliometric analysis and systematic review. Energy Build. 2025, 331, 115357. [Google Scholar] [CrossRef]
- Thorndike, R.L. Who belongs in the family? Psychometrika 1953, 18, 267–276. [Google Scholar] [CrossRef]
- Davies, D.L.; Bouldin, D.W. A Cluster Separation Measure. IEEE Trans. Pattern Anal. Mach. Intell. 1979, PAMI-1, 224–227. [Google Scholar] [CrossRef]
- Favati, P.; Menchi, O. An internal validity index for arbitrarily shaped clusters. Expert Syst. Appl. 2024, 235, 121124. [Google Scholar] [CrossRef]
- Rousseeuw, P.J. Silhouettes: A graphical aid to the interpretation and validation of cluster analysis. J. Comput. Appl. Math. 1987, 20, 53–65. [Google Scholar] [CrossRef]
- Calinski, T.; Harabasz, J. A dendrite method for cluster analysis. Commun. Stat. 1974, 3, 1–27. [Google Scholar] [CrossRef]
- Singh, V.K.; Singh, P.; Karmakar, M.; Leta, J.; Mayr, P. The journal coverage of Web of Science, Scopus and Dimensions: A comparative analysis. Scientometrics 2021, 126, 5113–5142. [Google Scholar] [CrossRef]
- Tran, H.K.V.; Börstler, J.; Ali, N.B.; Unterkalmsteiner, M. How good are my search strings? Reflections on using an existing review as a quasi-gold standard. e-Inform. Softw. Eng. J. 2022, 16, 220103. [Google Scholar] [CrossRef]
- Schneider, J.W.; Borlund, P. Introduction to bibliometrics for construction and maintenance of thesauri: Methodical considerations. J. Doc. 2004, 60, 524–549. [Google Scholar] [CrossRef]
- Montecchi, M.; Plangger, K.; West, D.C. Supply chain transparency: A bibliometric review and research agenda. Int. J. Prod. Econ. 2021, 238, 108152. [Google Scholar] [CrossRef]
- Lim, W.M.; Kumar, S. Guidelines for interpreting the results of bibliometric analysis: A sensemaking approach. Glob. Bus. Organ. Excell. 2024, 43, 17–26. [Google Scholar] [CrossRef]
- Putrada, A.G.; Abdurohman, M.; Perdana, D.; Nuha, H.H. Machine Learning Methods in Smart Lighting Toward Achieving User Comfort: A Survey. IEEE Access 2022, 10, 45137–45178. [Google Scholar] [CrossRef]
- Goyal, S.B.; Bedi, P.; Rajawat, A.S.; Shaw, R.N.; Ghosh, A. Smart Luminaires for Commercial Building by Application of Daylight Harvesting Systems. In Advanced Computing and Intelligent Technologies. Lecture Notes in Networks and Systems; Bianchini, M., Piuri, V., Das, S., Shaw, R.N., Eds.; Springer: Singapore, 2022; Volume 218. [Google Scholar] [CrossRef]
- Mohagheghi, A.; Moallem, M. An Energy-Efficient PAR-Based Horticultural Lighting System for Greenhouse Cultivation of Lettuce. IEEE Access 2023, 11, 8834–8844. [Google Scholar] [CrossRef]
- Gupta, A.; Gulati, T.; Bindal, A.K. WSN based IoT applications: A Review. In Proceedings of the 2022 10th International Conference on Emerging Trends in Engineering and Technology–Signal and Information Processing (ICETET-SIP-22), Nagpur, India, 29–30 April 2022; pp. 1–6. [Google Scholar] [CrossRef]
- Wu, T.-F.; Chang, C.-H.; Chen, Y.-H. A fuzzy-logic-controlled single-stage converter for PV-powered lighting system applications. IEEE Trans. Ind. Electron. 2000, 47, 287–296. [Google Scholar] [CrossRef]
- Mohandas, P.; Dhanaraj, J.S.A.; Gao, X.-Z. Artificial Neural Network based Smart and Energy Efficient Street Lighting System: A Case Study for Residential area in Hosur. Sustain. Cities Soc. 2019, 48, 101499. [Google Scholar] [CrossRef]


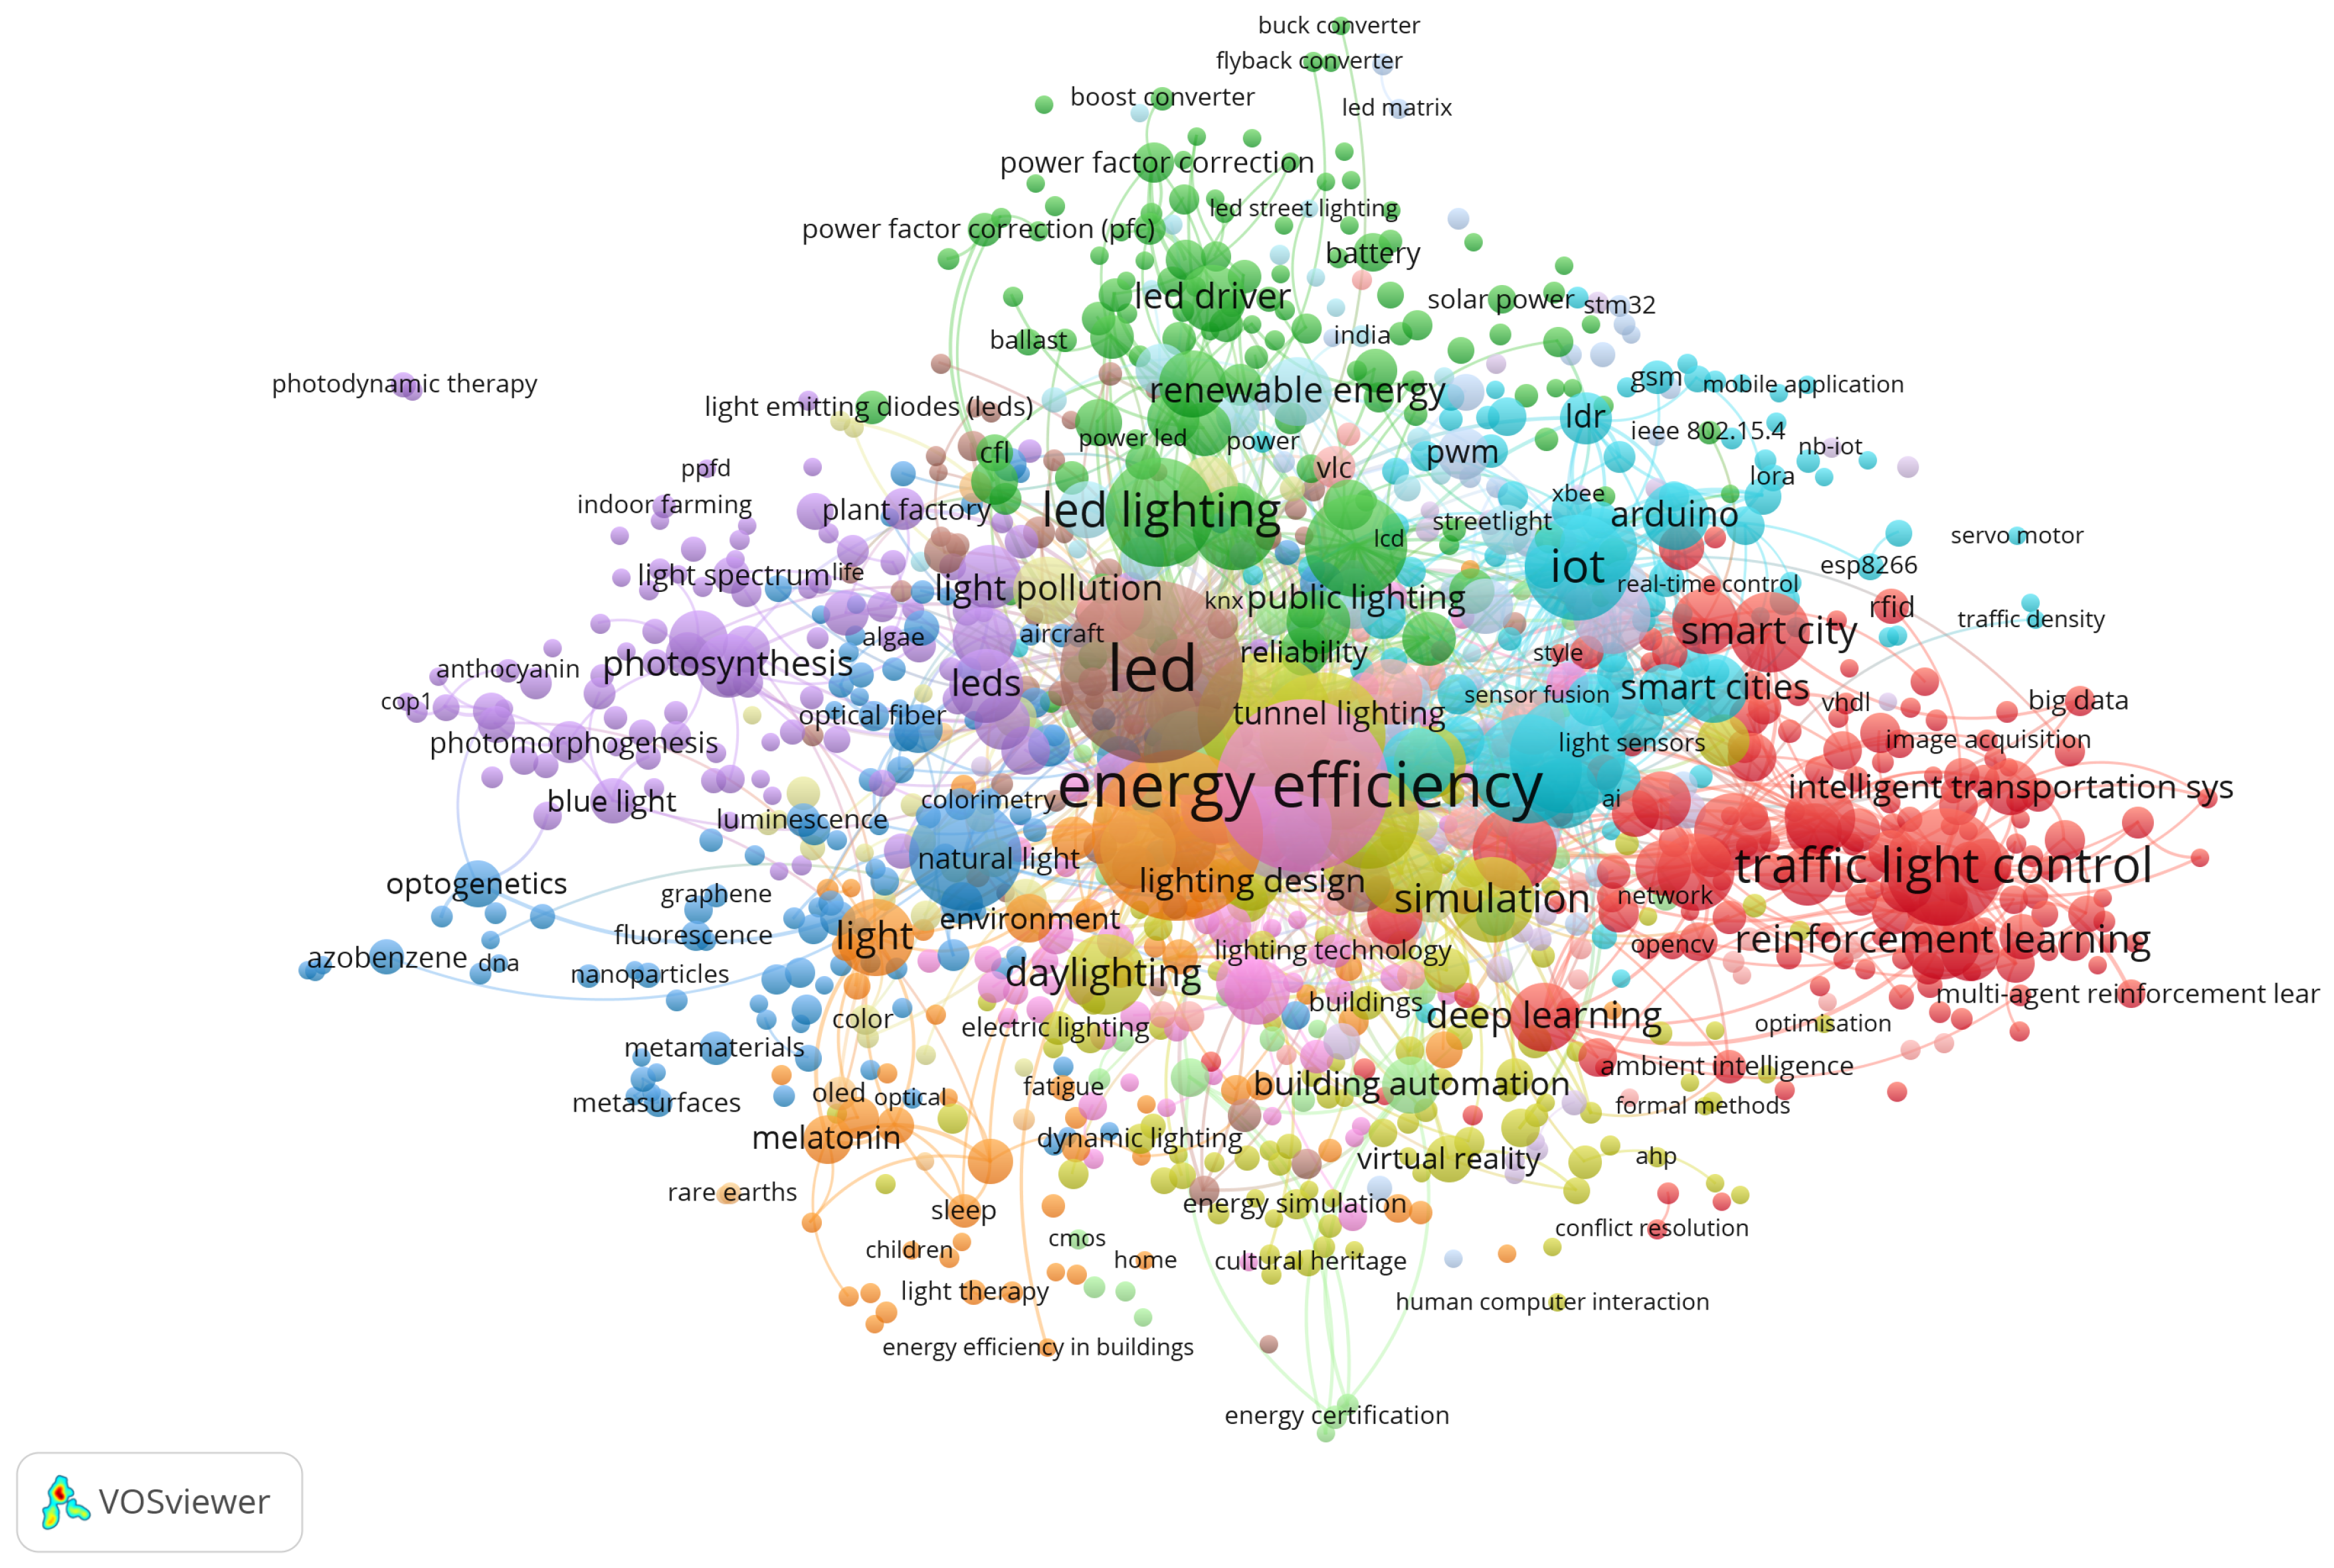
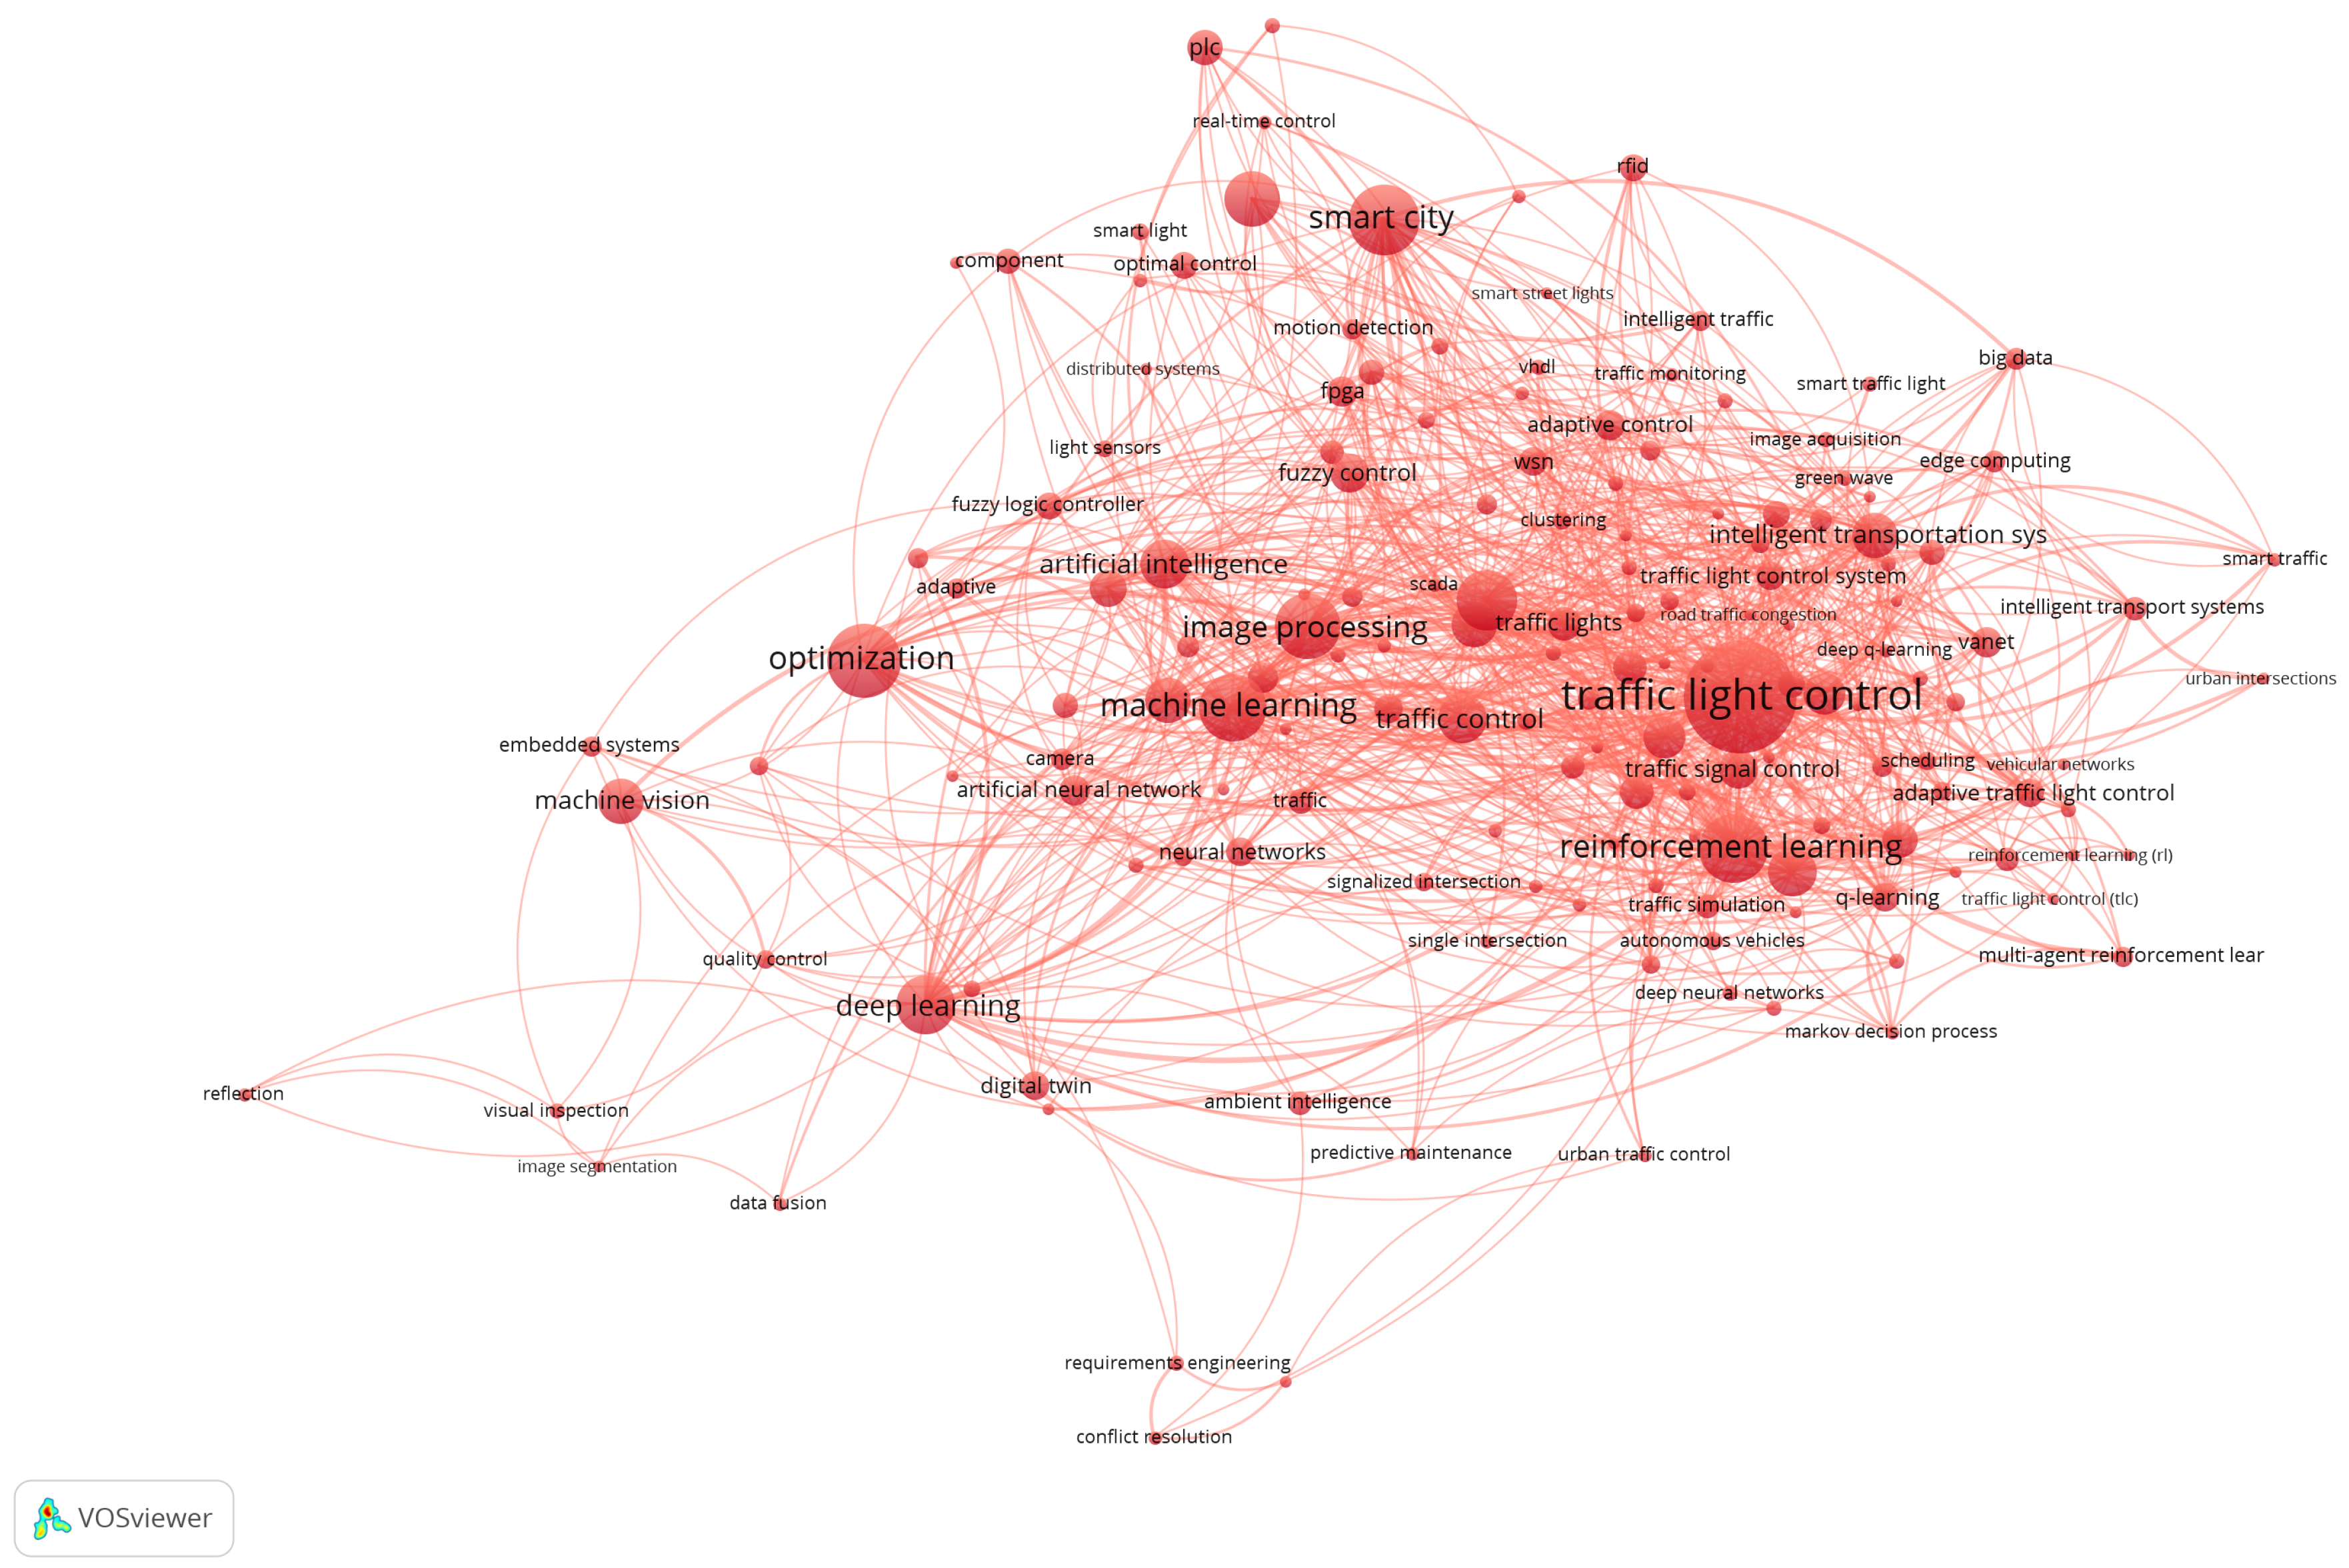
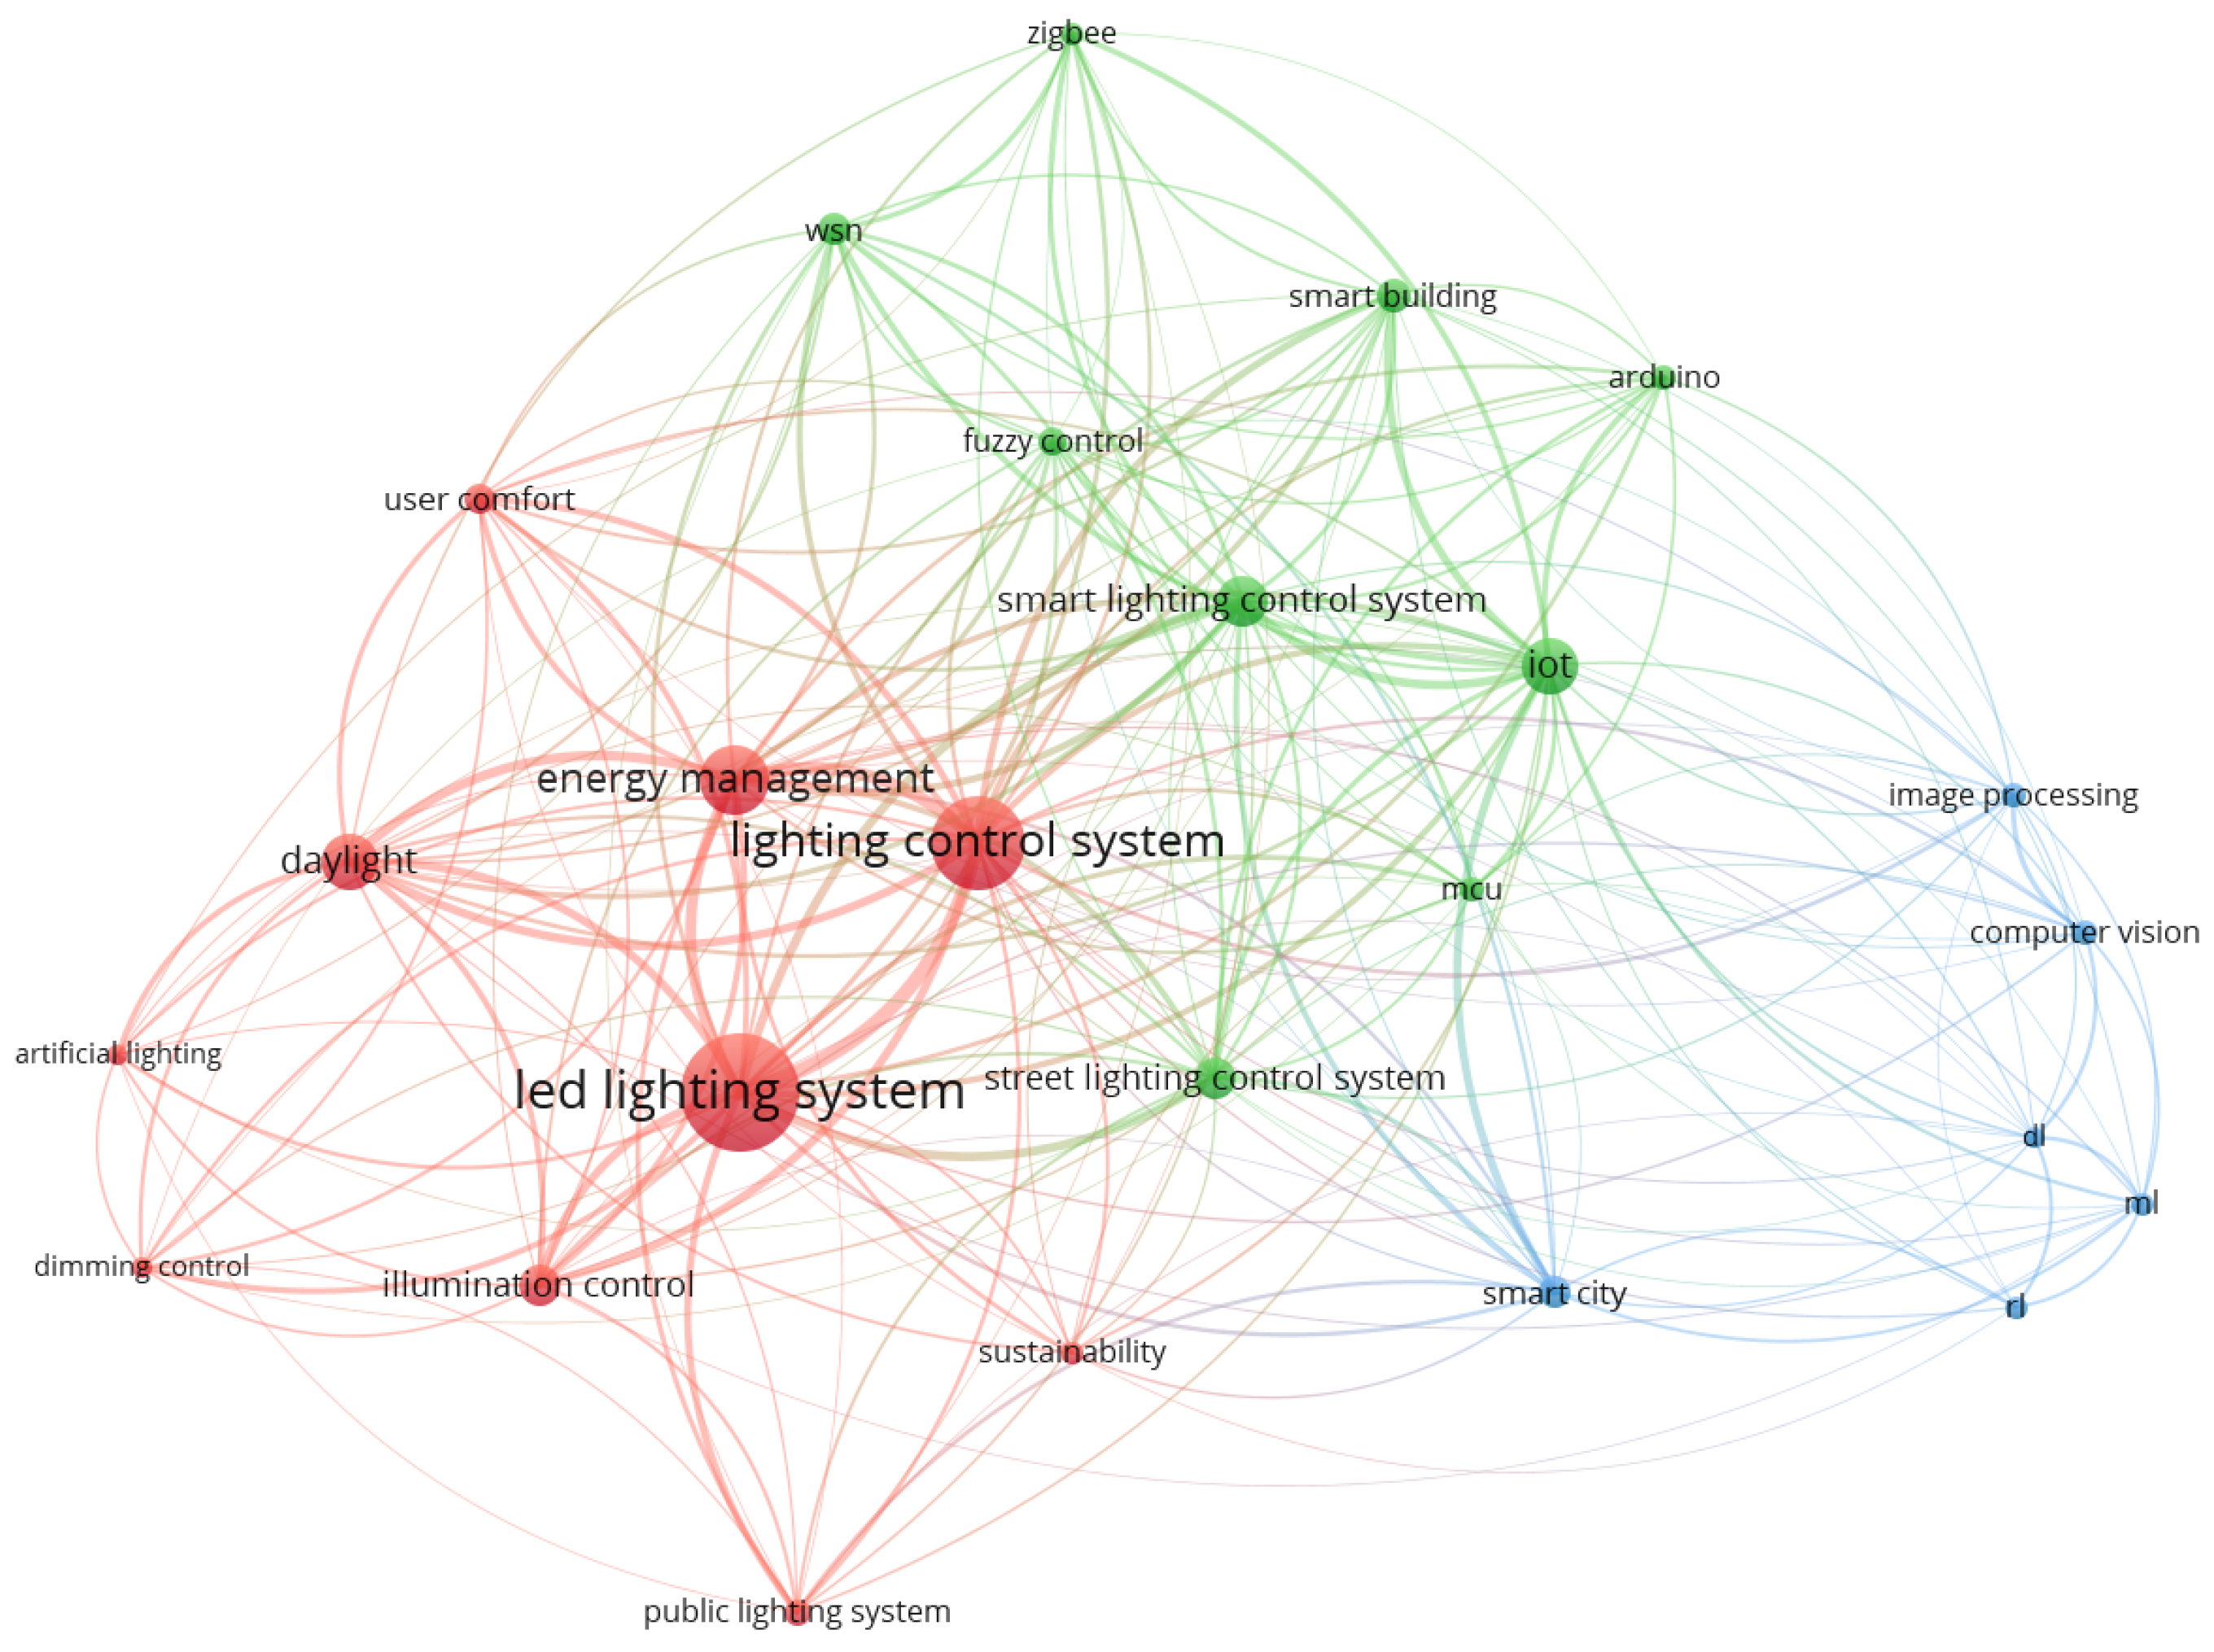
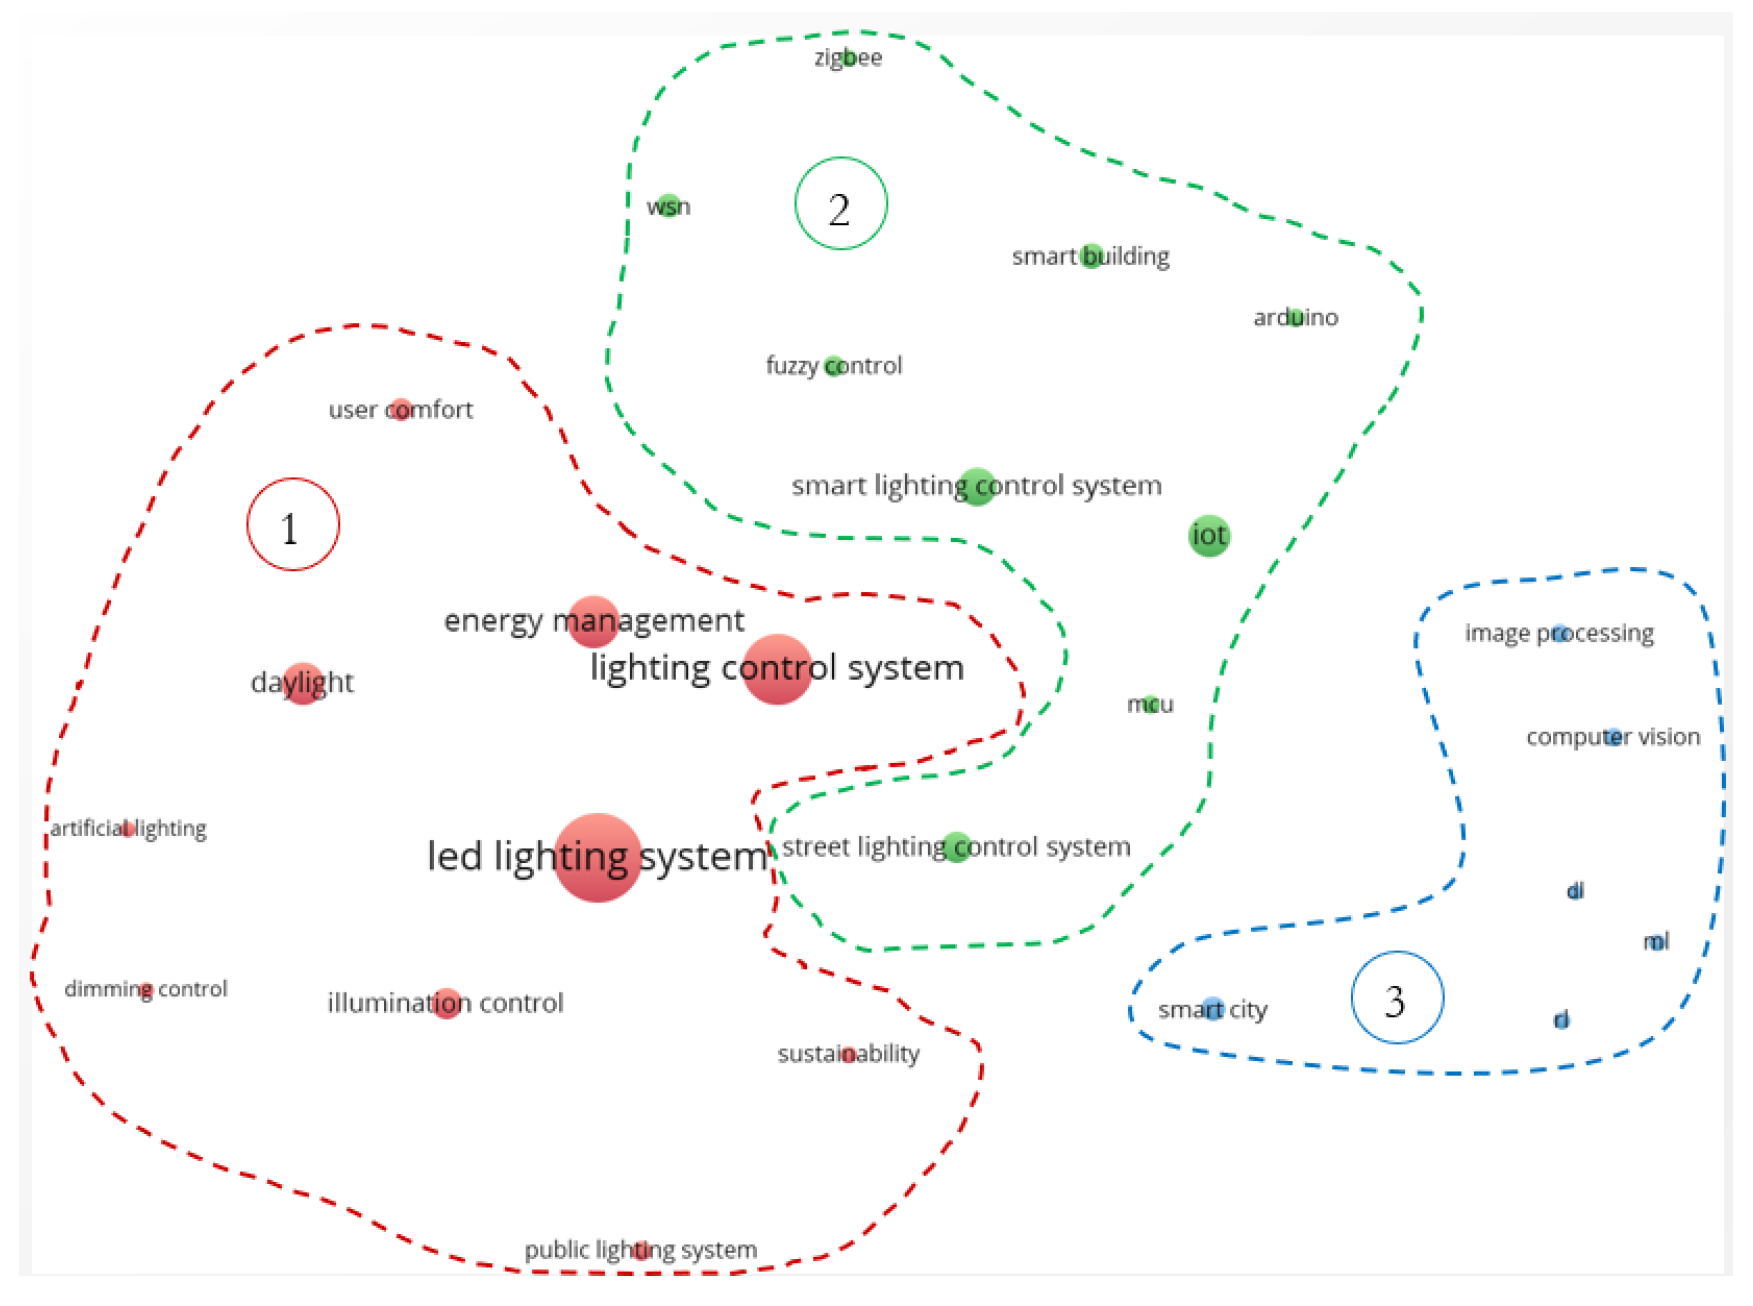
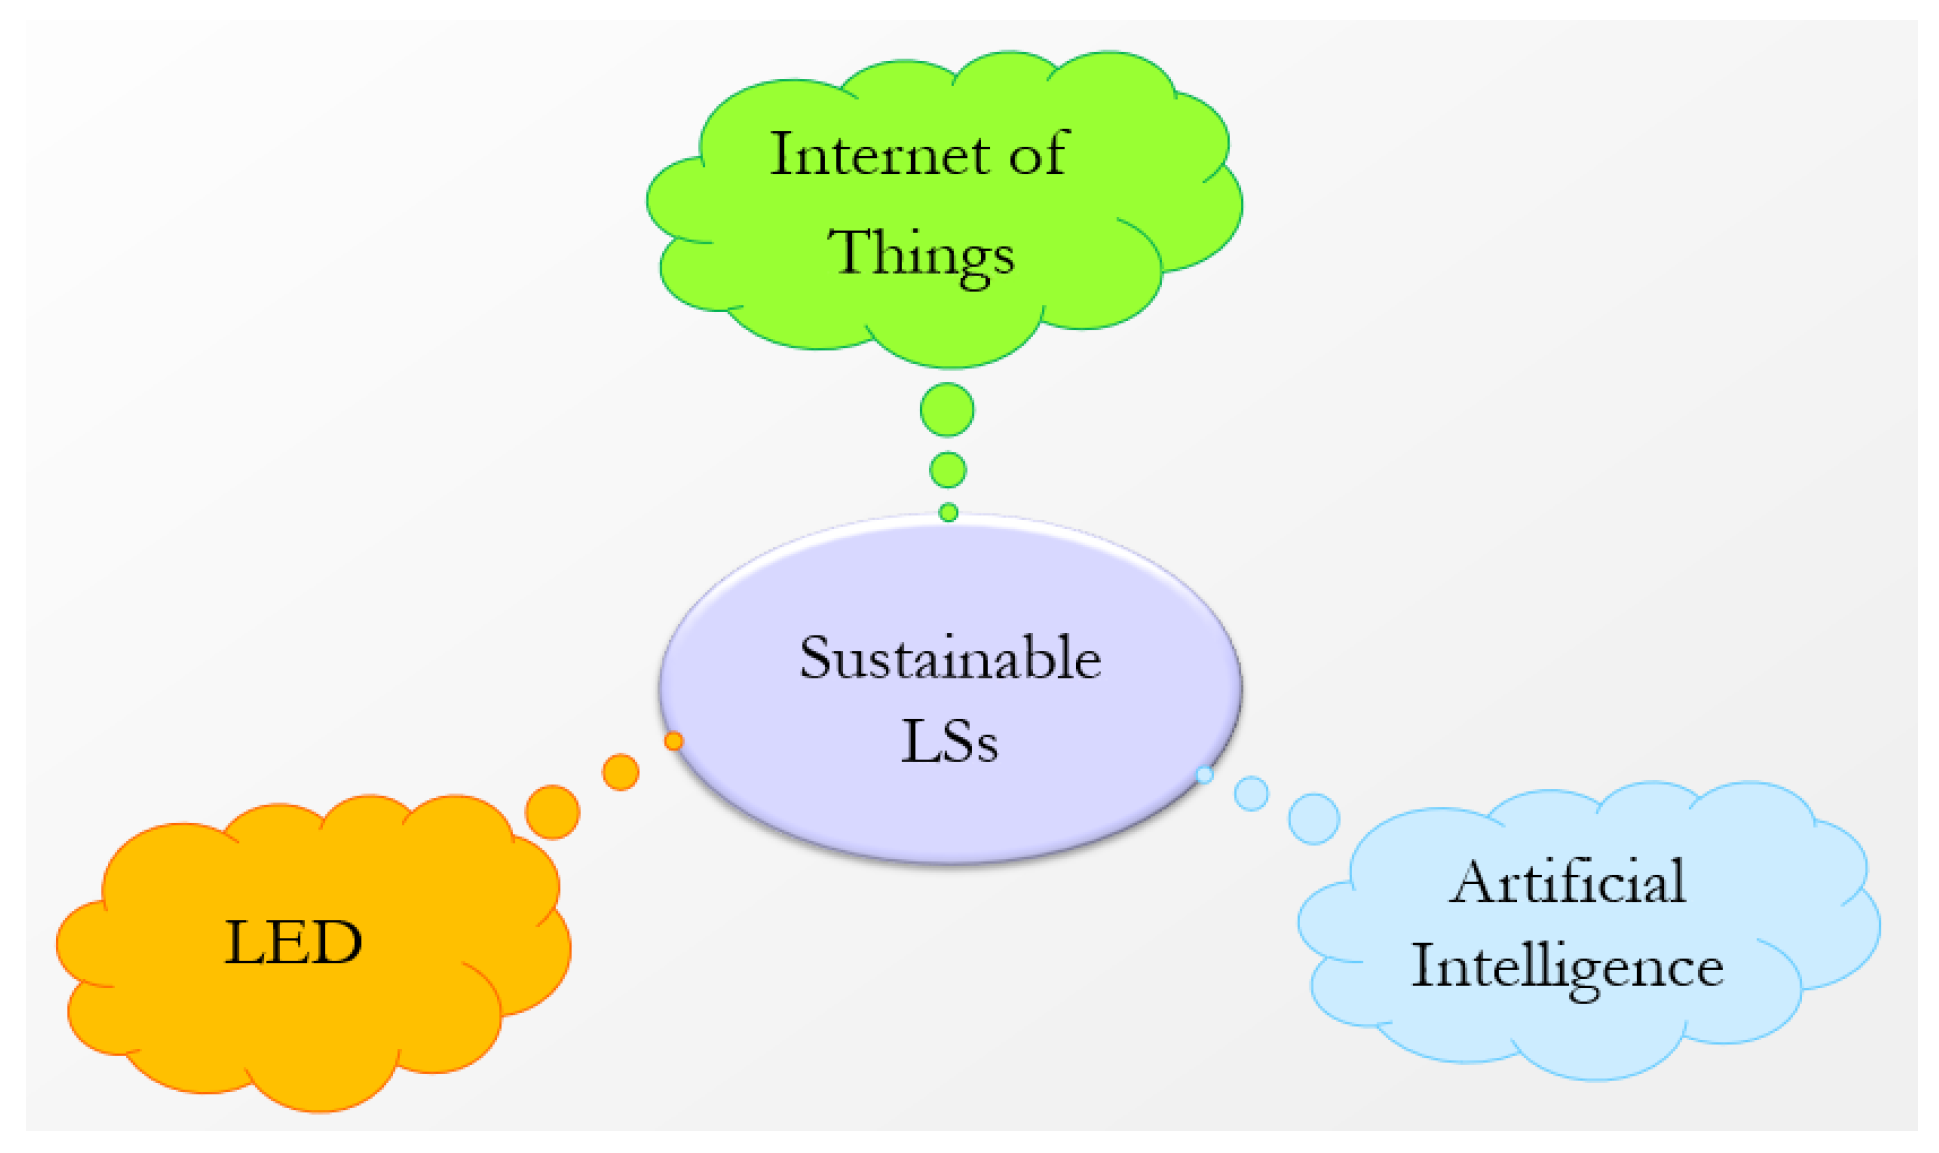
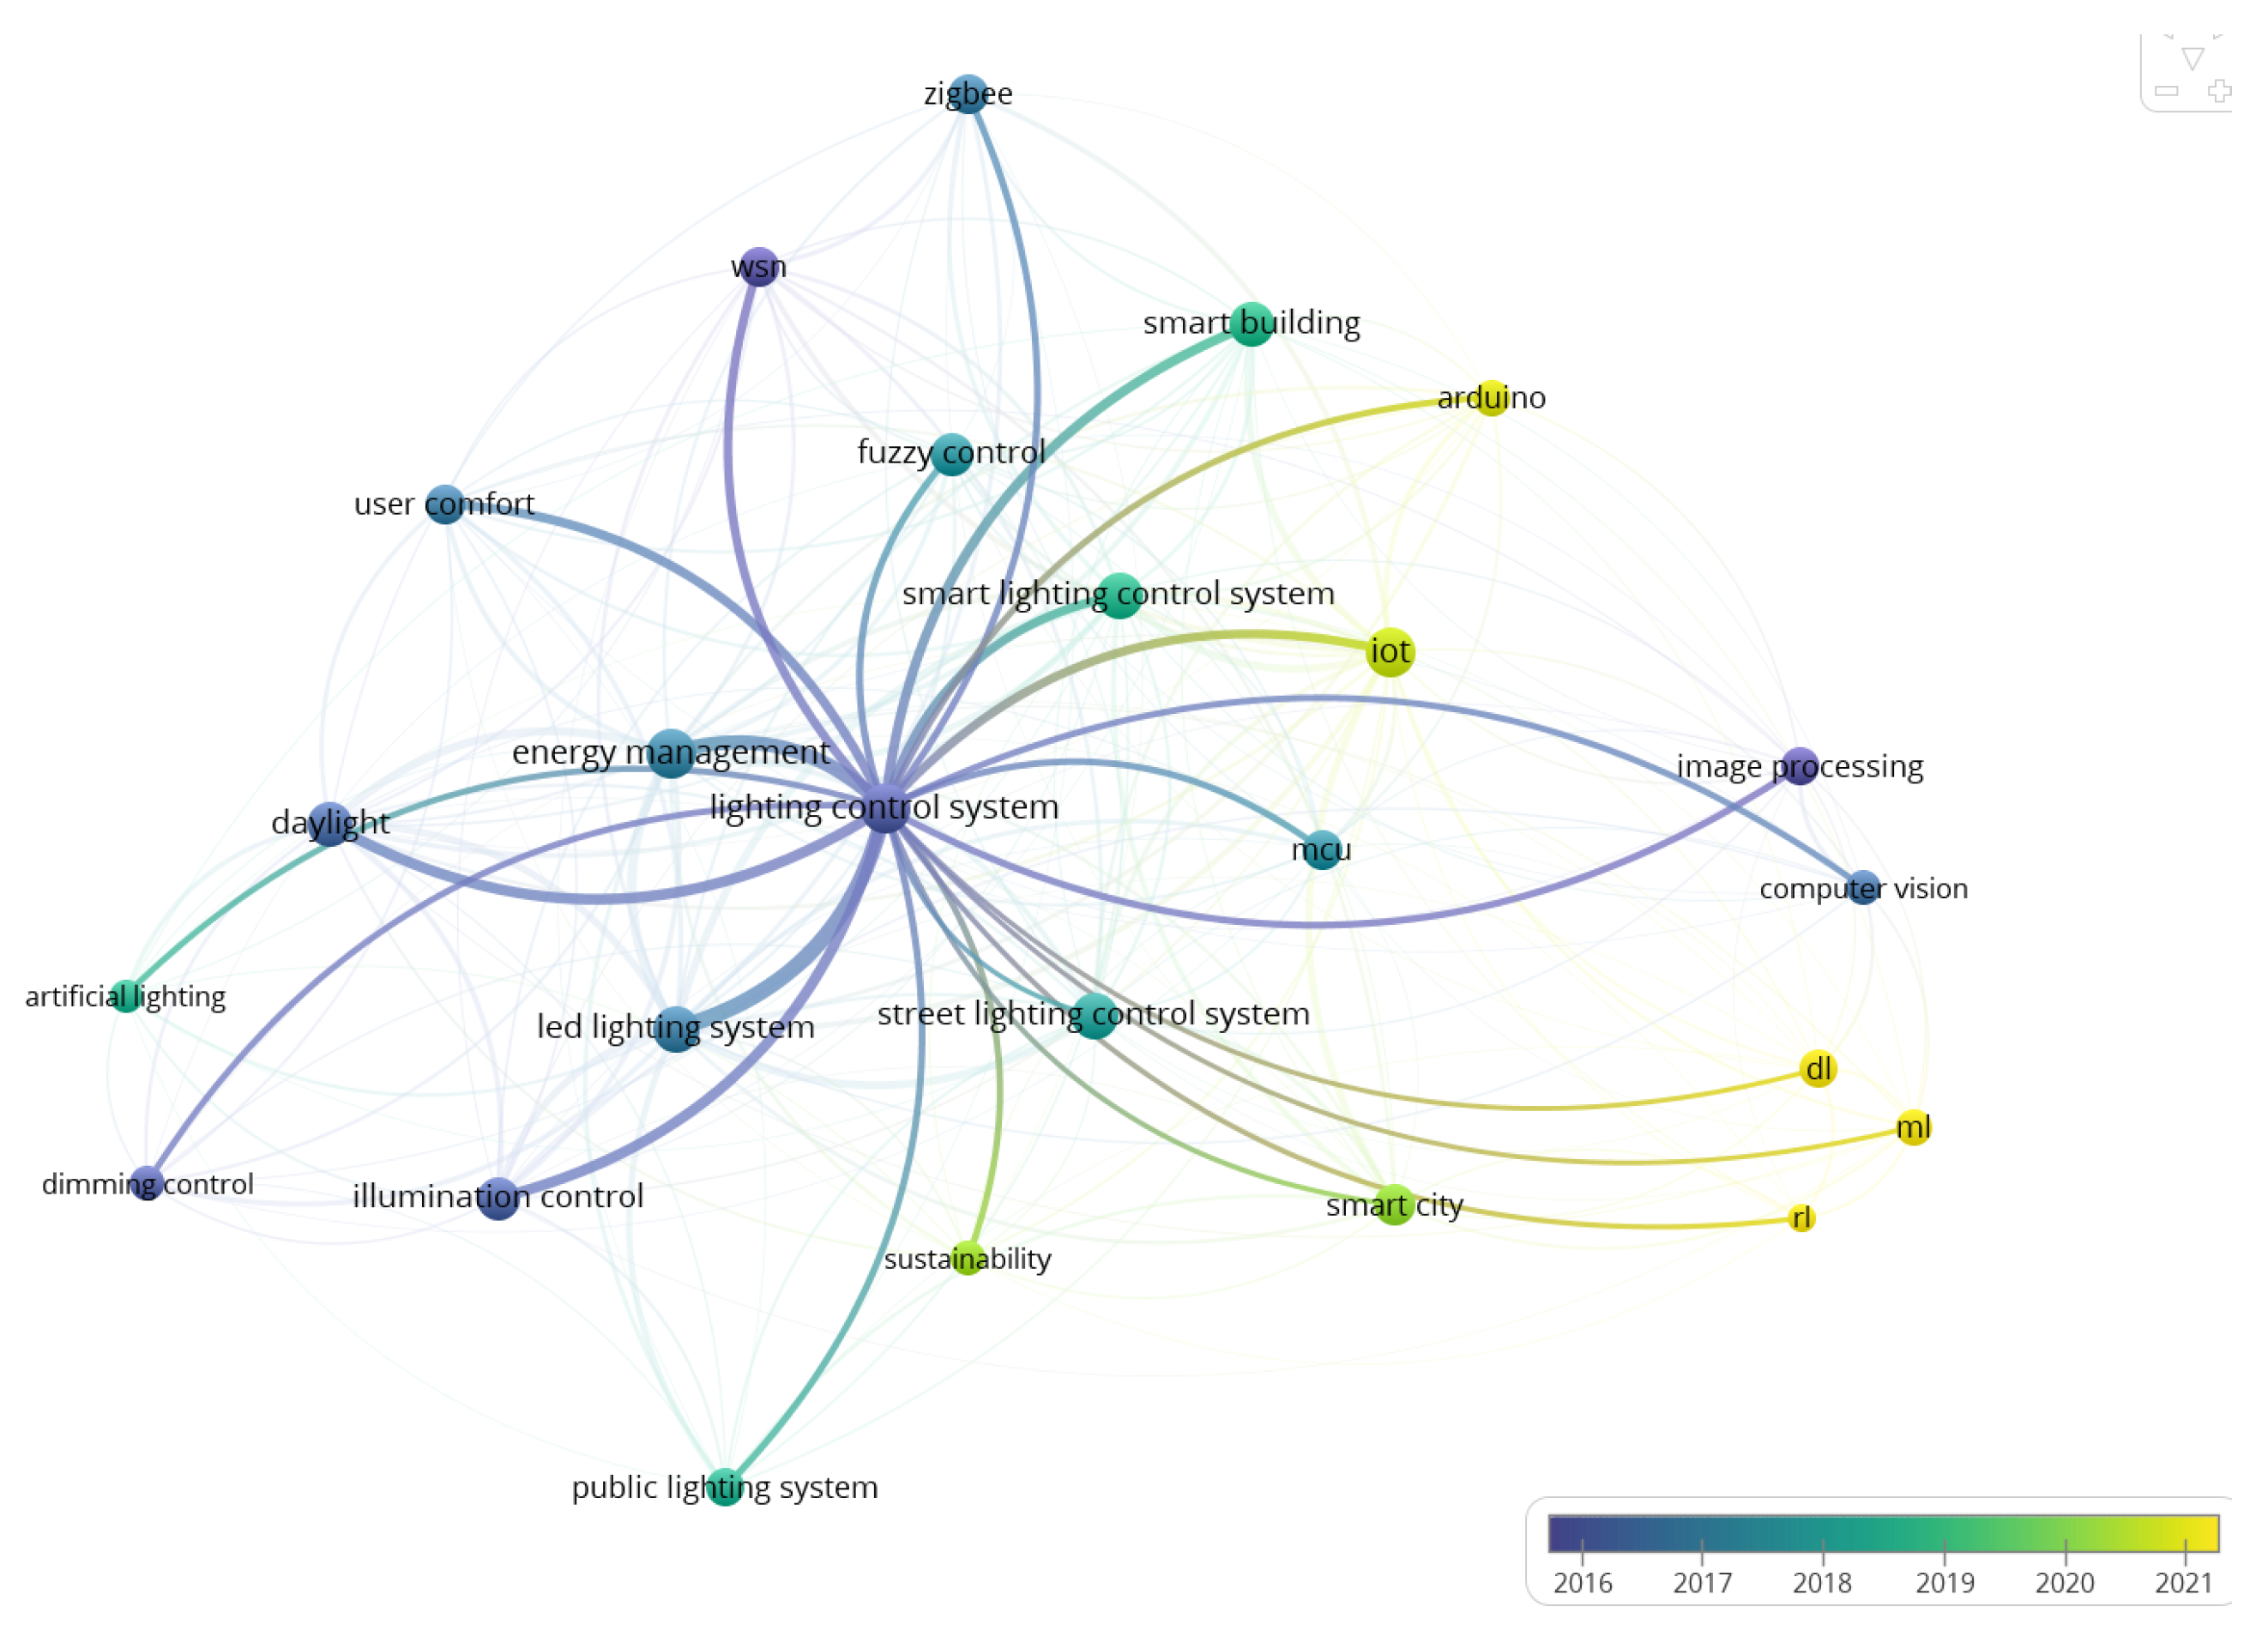
Disclaimer/Publisher’s Note: The statements, opinions and data contained in all publications are solely those of the individual author(s) and contributor(s) and not of MDPI and/or the editor(s). MDPI and/or the editor(s) disclaim responsibility for any injury to people or property resulting from any ideas, methods, instructions or products referred to in the content. |
© 2025 by the authors. Licensee MDPI, Basel, Switzerland. This article is an open access article distributed under the terms and conditions of the Creative Commons Attribution (CC BY) license (https://creativecommons.org/licenses/by/4.0/).