Abstract
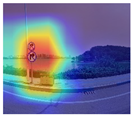
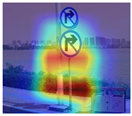
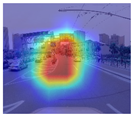
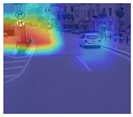
This paper presents a traffic sign recognition (TSR) system based on the deep convolutional neural network (CNN) architecture, which proves to be extremely accurate in recognizing traffic signs under challenging conditions such as bad weather, low-resolution images, and various environmental-impact factors. The proposed CNN is compared with other architectures, including GoogLeNet, AlexNet, DarkNet-53, ResNet-34, VGG-16, and MicronNet-BF. Experimental results confirm that the proposed CNN significantly improves recognition accuracy compared to existing models. In order to make our model interpretable, we utilize explainable AI (XAI) approaches, specifically Gradient-weighted Class Activation Mapping (Grad-CAM), that can give insight into how the system comes to its decision. The evaluation of the Tsinghua-Tencent 100K (TT100K) traffic sign dataset showed that the proposed method significantly outperformed existing state-of-the-art methods. Additionally, we evaluated our model on the German Traffic Sign Recognition Benchmark (GTSRB) dataset to ensure generalization, demonstrating its ability to perform well in diverse traffic sign conditions. Design issues such as noise, contrast, blurring, and zoom effects were added to enhance performance in real applications. These verified results indicate both the strength and reliability of the CNN architecture proposed for TSR tasks and that it is a good option for integration into intelligent transportation systems (ITSs).
1. Introduction
Road signs play an important role in keeping drivers informed about speed limitations, potential hazards, and the laws that must be followed, thus acting as a reminder to maintain their safety. TSR, the process of detecting and reading traffic signs, is a crucial part of any Advanced Driving Assistance Systems (ADASs) and fully autonomous driving systems as our transportation systems evolve towards automation and autonomy. Automated systems and human operators in complex traffic situations require the accurate real-time detection and identification of traffic signals [1,2]. However, the misinterpretation or lack of recognition of these signals can result in dangerous injuries and traffic violations, highlighting the importance of robust and accurate TSR implementations.
Although CNNs have shown good performance, TSR still has many challenges to overcome in practical applications. Traffic signs are frequently exposed to hostile environmental aspects like varying illuminations (glare and shadow), severe meteorological conditions (rain and fog), obstructions (e.g., signage hidden by vegetation or vehicles), and mechanical damage (faded and broken signage). Such factors can adversely affect the accuracy and reliability of TSR systems, especially when the training datasets are not sufficiently representative of such scenarios [3].
Data augmentation (DA) has been shown to successfully resolve these challenges. Training datasets are artificially enriched with the addition of some modifications to the images such as flipping, rotating, scaling, random cropping, intensity scaling, or noise addition [4]. It helps the system generalize better, maintaining high performance in actual scenarios by exposing the model to a wider range of visual transformations during training. This robustness is important to allow TSR systems to recognize traffic signs consistently even in adverse conditions [5].
Improving recognition accuracy is only one side of the equation, but equally important is understanding the mechanisms of decision-making involved in model outcomes. This is where the need for XAI methods arises.
Novelty of Proposed Framework
This study presents an innovative integration of a CNN and Grad-CAM to create a resilient TSR system that operates efficiently in varied and difficult conditions. The CNN is trained on the comprehensive and intricate TT100k dataset, using several data augmentation approaches to replicate real-world situations and improve performance. In accordance with XAI concepts, Grad-CAM is utilized to improve the interpretability of the model by offering visual explanations that emphasize the key variables affecting predictions. This methodology seeks to improve the precision, resilience, and clarity of the recognition and identification of traffic signs, thus promoting confidence and dependability in practical applications.
The main contributions of this work can be summarized as follows:
- To simulate various real-world conditions, we prepare the dataset using data augmentation techniques. The prepared dataset contains a large amount of noisy images and obscured traffic signs.
- Using a novel combination of a CNN model with superior performance and Grad-CAM for explainability, this approach highlights key features influencing predictions, improving transparency, and user confidence through XAI.
- We perform a comparative performance analysis of ML and DL approaches, including GoogLeNet, AlexNet, DarkNet-53, ResNet-34, VGG-16 and MicronNet-BF.
- Using XAI approaches, we improve the interpretability of the TSR model by highlighting the salient aspects that impact predictions and providing visual explanations of the model’s results using Grad-CAM.
- We evaluate the model using the GTSRB dataset to ensure generalization across diverse traffic sign conditions.
The remainder of this paper is structured as follows: Section 2 presents an overview of the approaches utilized in TSR. Section 2.3 outlines the Methodology in detail. Section 4 discusses the Experiments and Results. Finally, Section 5 provides the Conclusion and outlines the direction for future work.
2. Related Work
In this section, we present an overview of existing TSR systems. Table 1 summarizes the approaches used in the papers studied. TSR has been approached using various methods, which can be categorized into three classes: traditional ML methods, DL methods and Application Programming Interface (API) methods. In addition, we offer a summary of popular data augmentation techniques used in TSR.

Table 1.
A summary of the methods for TSR.
2.1. Traditional Machine Learning Methods
In the field of traditional ML, a focus has been incorporated on the efficient and precise creation of traffic sign recognition systems with minimum computational durations. Escalera et al. [6] conducted a study in which Support Vector Machines (SVMs) were used for classification, along with preprocessing algorithms such as image processing, Euclidean distance measurement, thresholding, and image thinning. All these measures were expected to provide better feature extraction and a shorter computation time. Evaluated with an extensive dataset of road sign images, this model yielded an exceptional identification rate of 93% for small masks and demonstrated the capacity of the SVMs and preprocessing combined to represent an accurate and cost-effective TSR solution.
In another study, Wali et al. [7] introduced a three-step approach to the detection and recognition of traffic signs. First, Regions of Interest (ROIs) are found using color segmentation. Then, the invariant geometric moments approach is used to classify the distinct types of traffic signs (i.e., triangular, circular, and rectangular). In the final step, recognition is carried out by the random forest (RF) algorithm. The method was tested on a custom dataset, obtaining an accuracy of 94.85%. Weng and Chiu [8] proposed a two-stage TSR execution. The detection stage detects candidate traffic signs using Single-Pass Connected Component Labeling (CCL) and the normalized RGB color transform. An HOG was used to extract sign descriptors in the recognition stage, and an SVM was used for classification. The method was tested with the GTSRB and yielded results with a 90.85% recognition rate.
Traffic signs vary across countries. Several works have focused on developing TSR systems that account for the particularities of traffic signs in specific countries. Namyang and Phimoltares [9] proposed a classification and recognition method specifically designed for Thai traffic signs. The method employs advanced feature extraction techniques, namely a Histogram of Oriented Gradients (HOG) and a Color Layout Descriptor (CLD), followed by two combined classifiers: an SVM and RF. The proposed method achieves a high accuracy score of 93.98%. Similarly, Soni et al. [10] designed a novel TSR adapted to Chinese traffic signs. The system used an HOG and Local Binary Patterns (LBPs) as feature extraction methods followed by Principal Component Analysis (PCA) to reduce the complexity of the feature set. Finally, traffic sign classification was performed using an SVM. The performance of the proposed system, with different combinations of techniques, was evaluated with the Chinese Traffic Sign Database (CTSD). The best accuracy of 84.44% was achieved using LBPs, PCA and the SVM classifier.
2.2. Deep Learning Methods
Recently, DL algorithms have gained considerable prominence due to their ability to autonomously extract visual information from unprocessed images. The exceptional results of DL techniques, especially CNNs, in various computer vision applications have inspired their utilization for text recognition systems.Several academics have examined various DL architectures to create dependable and accurate TSR systems.
In [16], the authors proposed a novel framework that combines two DL components: a deep CNN for object classification and Fully Convolutional Network (FCN) guided traffic sign proposals. They improved EdgeBoX, the object proposal technique, by incorporating a trained front-end neural network to ensure the generation of more discriminative candidates. This FCN-guided object proposal contributed to the overall fast and accurate detection system.
Serna and Ruichek [13] created the European Traffic Sign Dataset (ETSD) to address some of the issues posed by the type inconsistencies of traffic signs in several European countries. The ETSD includes a total of 82,476 images from six European countries classified into 164 categories based on four main types. They performed a comparative analysis on five CNN models, LeNet-5, IDSIA, an asymmetric CNN, and an eight-layer CNN. In summary, the eight-layer CNN was the top performer, reaching an accuracy of 99.37% on the GTSRB and 98.99% on the ETSD. The model architecture of the CNN contained three symmetric and six asymmetric convolution processes, which resulted in competitive results. In order to handle regional differences in traffic signs, Bhatt et al., in their work [17], they proposed a CNN-based TSR model, which they trained on a hybrid dataset that was created by merging the GTSRB dataset with a self-compiled Indian traffic sign dataset. They used eleven layers in total: two pooling layers, four convolutional layers, one flattening layer, and four FCL layers. This gave the model an accuracy of 91.08% on the Indian dataset, which increased to 95.45% on the hybrid dataset.
To address the real-time and computational challenges of TSR, researchers are focusing on developing efficient and lightweight models that balance accuracy with processing speed and resource constraints. Bangquan et al., in ref. [18], proposed a real-time embedded TSR approach that integrates a lightweight classification network known as ENet (efficient network) and a detection network called EmdNet (efficient operation- and multiscale-based depthwise separable convolution network). The proposed method integrates data mining and multiscale operations for better accuracy and generalization ability and applies depthwise separable convolution (DSC) to accelerate processing efficiency. Despite this significant finding, the proposed networks may still be influenced by differences between real-world scenarios and the natural noise present in datasets. Khan et al. proposed a lightweight convolutional neural network framework in [19] for TSR for urban roads, addressing the challenges of computing efficiency. Using fewer parameters, their model achieved an accuracy of 98.41% on the GTSRB and 92.06% on the Belgium Traffic Sign (BelgiumTS) dataset. The high accuracy scores obtained underline the effectiveness of the proposed CNN architecture for practical use cases. To reduce the number of parameters in the model, Fang et al.’s MicronNet-BN-Factorization (MicronNet-BF) [14] is an improved CNN for time series classification that exploits the strengths of (1) the ultra-space-efficient MicronNet [20], (2) batch normalization, and (3) factorization to boost accuracy. Based on the GTSRB dataset, MicronNet-BF outperformed the original MicronNet accuracies of 98.9% and 99.38% and with a training time of less than 1.41 s.
Derived from the classical LeNet-5-inspired architecture [21] which has been a common choice, like classical networks, due to it being an elegant architecture with a low number of layers and parameters compared to more modern architectures, several studies have proposed variants of it dedicated specifically for use in TSR. They have proposed a new algorithm for the detection and recognition of traffic signs [22]. This algorithm improves detection by applying spatial threshold segmentation using the HSV color space and detecting the traffic sign based on shape features. The proposed algorithm detects the highest salient feature of the sign and applies an augmented LeNet-5 algorithm (by adding Gabor kernels, batch normalization, and an Adam optimizer) to classify the detected signs. In experiments on the GTSRB dataset, the recognition accuracy further improved to 99.75%, with an average processing time 5.4 ms, basically achieving both improved accuracy and an increased real-time effect. Zaibi et al. [12] proposed a lightweight CNN for traffic sign categorization using a modified version of the LeNet-5 architecture. It consists of only 0.38 million parameters and achieved remarkably high classification accuracy, with scores of 99.84% for the GTSRB dataset and 98.37% for the BTSD. The high accuracy offered by the lightweight design makes the model suitable for online TSR.
Several studies have implemented multiple well-known CNN-based architectures for high TSR. In their research, Li and Wang [11] proposed a novel real-time TSR approach where they combined the Faster R-CNN [23] and MobileNet [24] architectures to achieve accurate detection with high efficiency. The latter contributes to recognizing small traffic signs that are often difficult to precisely locate. They proposed a CNN with asymmetric kernels as very effective traffic indicator classifiers. Their proposed method, evaluated with the GTSRB dataset, achieved improved detection accuracy over state-of-the-art methods, with a mean average precision (mAP) of 84.5% and a recall of 97.81%. The results also showed an exceptional classification performance with a 99.66% accuracy and 0.26 ms prediction time per image. Another work was proposed by N. Youssouf [25], where the authors proposed TSR in which the CNN classification combination is lightweight and fast, accompanied by the Faster-RCNN and YOLOv4 for detection. The CNN presented achieved an outstanding accuracy of 99.20% on the GTSRB dataset. The Fater-RCNN model achieved a mean average precision (mAP) of 43.26% at a rate of six frames per second (FPS); however, the YOLOv4 model produced a greater mAP, achieving 59.88%, but at a higher speed of 35 FPS; thus, it is better suited to real-time applications. In general, this research demonstrates the availability of the accurate and fast detection of traffic signs with the help of these models, which is essential to facilitate the advancement of autonomous driving systems. Xiaomei Li et al. [26] introduced an improved fast R-CNN model for the detection of traffic signs. The optimized model utilizes all the new components that are discussed such as the ResNet50-D feature extractor and Attention-guided Context Feature Pyramid Network (ACFPN). These improvements significantly increased the ability of the model to learn the context and the loss clamps. Moreover, using transfer learning and AutoAugment technologies for data augmentation further improved the model training process. For the CCTSDB dataset, the mAP achieved by the improved Faster R-CNN was 99.5%.
The YOLO (You-Only-Look-Once) model is one of the most popular and effective models for real-time object detection, and it is widely used in ITS applications. Many studies have proposed methods for TSR based on YOLO architectures. Wan et al. To overcome the problems of detecting the traffic sign under bad conditions, TS-Yolo [27], which is based on Yolov5. It has a suggested model which uses Mixed Depth-wise Convolution (MixConv) and will capture diverse patterns at different resolutions and uses Attentional Feature Fusion (AFF) to enhance feature extraction by allowing the network to focus on relevant features across layers. The experimental results showed remarkable performance with precision at 74.53% and mAP_0.5 at 83.73%.
Zhang et al. [28] examined the shortcomings of traditional TSR systems that depend on color and shape. These approaches have potential because their efficiency is threatened by variations in illumination and meteorological conditions. To overcome these challenges, the authors proposed an improved YOLOv5 model that integrates the Segmented Intersection over Union (SIoU) loss function, the Convolutional Block Attention Module (CBAM) for improved feature extraction, and Adaptive Convolutional Neural Network (ACONC) for dynamic activation. Substantial performance improvements were shown on the TT100k dataset by experiments, where precision grew from 73.2% to 81.9%, recall grew from 74.2% to 77.2%, mAP grew from 75.7% to 81.9%, and accuracy sat at 69.8%. Nath et al. [29] proposed a TSR system using YOLOv3 that was able to classify different types of traffic signs in different illuminations and meteorological conditions, as well as estimating their distance from the vehicle. Trained and validated on the GTSRB dataset, the model was able to reach a staggering 98.5% accuracy rate when tested over live input. In addition, a heuristic-based method was used to ensure accurate distance measurement between the traffic sign and the vehicle’s monocular camera. Li et al. [30] proposed a new traffic sign small object identification method based on YoLov7. The improvements carried by the SANO-YOLOv7 comprise a tiny object detection layer, the application of self-attention and convolutional mix modules (ACmix), and the introduction of omni-dimensional dynamic convolution (ODConv), in order for it to become less sensitive to small object center positioning errors and improve the accuracy of small target recognition, the normalized Gaussian Wasserstein distance (NWD) metric was proposed. The SANO-YOLOv7 algorithm achieved an accuracy of 88.7% on the challenging public dataset TT100K, outperforming the baseline model YOLOv7 by 5.3%.
In the traffic sign classification solution presented in [15], Kuros et al. integrate Deep Neural Networks (DNNs) with Quantum Neural Networks (QNNs) by using quantum convolution layers. When tested on the GTSRB dataset, the DNNs achieved a 99.86% accuracy, while the QNNs achieved a respectable 94.40% accuracy. In fact, QNNs have not yet outperformed conventional CNNs but appear to be very promising with an accuracy as high as 90%. The work in [15] highlights the opportunity that QNNs have to improve computer vision applications but also the limitations that currently remain.
2.3. Data Augmentation in TSR
Data augmentation is a technique used to increase the number and diversity of data available for training models by applying some transformations to the images in the training set. Diversity augmentation is significantly important in time-series regression because it increases the variability of the training data, improves the model’s generalizability, and reduces overfitting. This improves the robustness and accuracy of traffic sign detection in many real-world scenarios. Common data augmentation techniques include translation, zooming, rotation, brightness, and scale modifications [14,31]. Many works have focused on designing data augmentation methods specifically for TSR. A research by Ge [32] introduced an innovative domain adaptation approach using the standard of traffic signs. The method, known as TSR dataset augmentation, addresses the issue of imbalanced datasets where some classes of traffic signs do not possess adequate examples for effective model training. Applying the proposed TSR dataset augmentation to TT110k improved the usability of the dataset for training models based on fewer examples. This method was validated with many generations of the dataset. The results showed the ability of the proposed method to improve the performance of the models, despite unbalanced class instances being a challenge.
In contrast, a previous study [33] instead explored using new traffic sign images for data augmentation using the pix2pix GAN architecture. GAN-based data augmentation improved the classification accuracy of triangular-type traffic signs by 2% (from 93.8% to 95.3%) while circular-type traffic signs achieved a 2% increase in classification accuracy from 92.1% to 94.0%. Nonetheless, many conventional augmentation strategies can outperform GAN DA.
Other research has explored different data augmentation methods such as adding white rectangles and changing the point of view to further improve training data. In fact, data augmentation is a crucial tool for enhancing the performance of time series regression models, and researchers continue to explore new techniques to generate additional training data.
3. Methodology
This section describes the structure of our study, including the dataset, suggested CNN, and comparative models. Each stage of the procedure is carefully designed to improve understanding of the factors that affect TSR and to increase the efficiency of the prediction of the model. The detailed investigation process is shown in Figure 1.
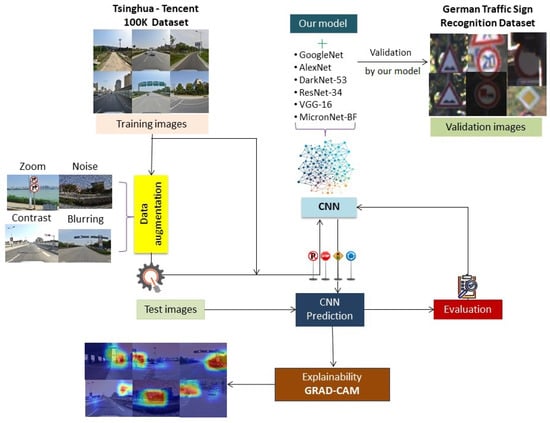
Figure 1.
Flowchart with all method steps.
3.1. Dataset
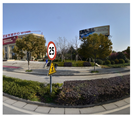
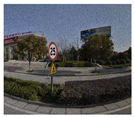
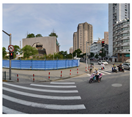
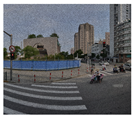
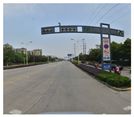
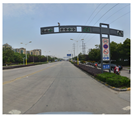
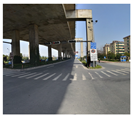
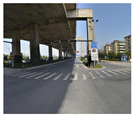
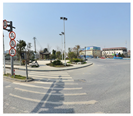
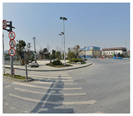
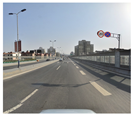
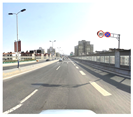
Tsinghua University and Tencent YouTu Lab worked together to create the notable benchmark dataset, TT100K. It is one of the most widely used datasets in traffic sign detection and recognition research. While it includes different international traffic signs, TT100k mainly focuses on Chinese traffic signs. The dataset consists of over 100,000 images, of the size 2048 × 2048, captured in various real-world conditions. With a focus on real-world small object detection, it accounts for wide variations in weather and illumination. Images are taken at different times of the day, in various seasons, under various weather circumstances (such as cloudy, sunny, cloudy, and nighttime), and in intricate situations like those with partial occlusion, shade, or objects resembling traffic signs surrounding them. Examples of different image conditions are illustrated in Figure 2.
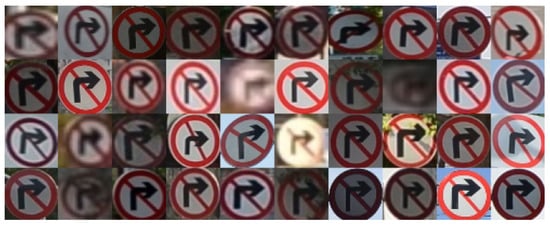
Figure 2.
Different weather conditions, different daytime hours, and intricate situations.
Each image within the dataset comes with detailed annotations that include the bounding box coordinates of the TS, its class label, and pixel mask. Annotations are available in the COCO format, a commonly used standard for organizing and annotating large-scale image datasets. Besides its large size, the TT100k dataset is known for the wide variety of traffic signs it covers, including prohibitory signs (e.g., speed limit, stop, yield), warning signs (e.g., pedestrian crossing, school zone), and mandatory signs. Figure 3 shows the types of traffic signs on TT100k and their corresponding labels.
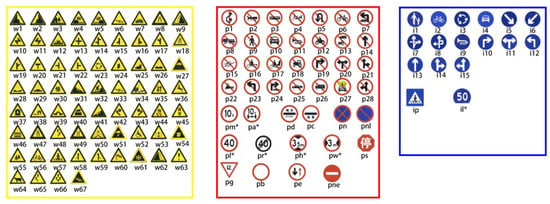
Figure 3.
A list of traffic signs and their labels in the TT100K dataset [34], grouped according to their classification (red, blue, and yellow denote prohibitory, mandatory, and warning signs, respectively).
As seen in Figure 4, the TT100K dataset consists of 201 traffic sign classes in total. The distribution of instances per class exhibits a significant imbalance. The majority of classes contain relatively few instances, while only a small subset has a large number of samples. Specifically, 84 classes have fewer than 10 instances, making them highly underrepresented in the dataset. Furthermore, 62 classes have between 10 and 75 instances, and 10 classes have fewer than 100 instances, further demonstrating the class imbalance issue.
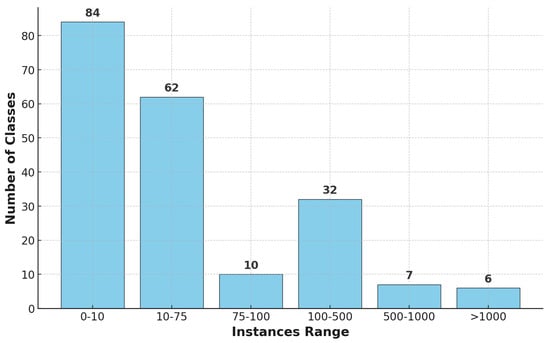
Figure 4.
Distribution of classes by instances range.
On the other hand, only 45 classes contain more than 100 instances, with just 6 of them exceeding 1000 instances. This discrepancy in the class distribution poses challenges for model generalization, particularly in recognizing underrepresented categories. To ensure a reliable evaluation and mitigate the impact of data scarcity, we restricted our study to the 45 classes that have a sufficient number of instances, allowing for more robust training and performance assessment. Figure 5 displays the distribution of the classes considered.
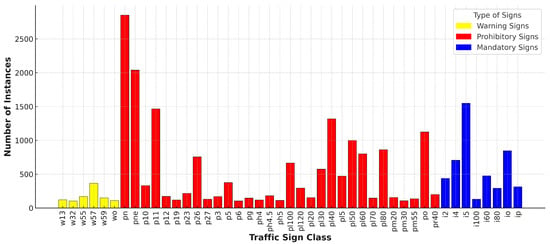
Figure 5.
Distribution of traffic sign instances by class.
3.2. Data Preprocessing
To guarantee homogeneity across all samples and compliance with the CNN architecture, we executed many preprocessing procedures:
- Image Scale: All images were resized to 64 × 64 pixels. This size was a compromise between computational efficiency and sufficient detail that we needed for sign recognition.
- Normalization: Each image pixel value was divided by 255 in order to scale the input to a [0–1] value range. When implemented, this normalization decreased variability across different pixel intensity values, which in turn allowed the model to focus more on learning features during the training process as gradients became more stable.
- Data Augmentation: Although the large TT100K dataset contains a lot of variations, such as in lighting, scale, and orientation, data augmentation techniques could help improve the model robustness. Different augmentation methods were employed, and some of them are outlined in Table 2 along with the parameters used. Examples of techniques applied to the data are displayed in Figure 6.
 Table 2. Applied data augmentation techniques.
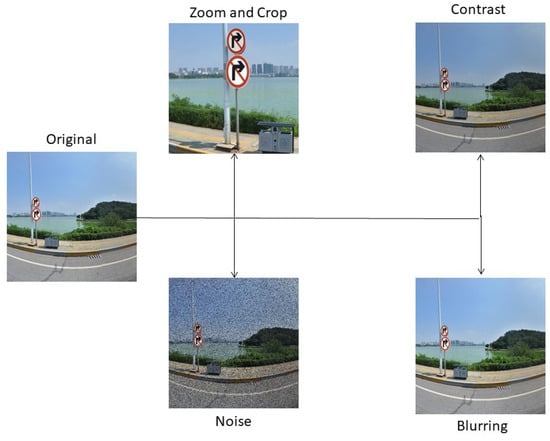 Figure 6. Examples of data augmentation techniques.
 - Data Splitting: The dataset was divided into training (80%) and testing (20%) subsets. Data augmentation was performed only on the training subset of data to improve the diversity of data and to prevent the model from overfitting. The testing set did not change to guarantee a fair final evaluation of the model’s performance.
3.3. TSR Classification
3.3.1. The Proposed CNN
The CNN architecture proposed for TSR aims to achieve a balance between computing efficiency and feature extraction, which empowers the accurate classification of traffic signs. The third convolutional layer allows the model to be non-linear, applying Rectified Linear Unit (ReLU) activation function after every layer. The first two convolutional layers use 3 × 3 kernels with a stride of 1 to capture the spatial features of input images. During the training process, for the purpose of stabilization and acceleration of the training process, batch normalization is applied after each convolutional layer.
After every second and third convolutional layers, a max-pooling layer is added to reduce the spatial size and retain the important features. This downsampling step decreases the parameters in the network, increasing computing efficiency, which is crucial for real-time applications. The last output of the max-pooling layer is then flattened and passed through two fully connected layers (FCLs). This first FCL applies ReLU activation to facilitate the process of feature coupling, and the final FCL applies a softmax activation function for the multiclass classification of traffic signs.
To prevent overfitting and therefore improve the network’s ability to generalize to new data, dropout layers are placed between the FCLs. The complete architecture illustrated in Figure 7 shows the layer configurations, their corresponding output dimensions, kernel sizes, and the activation functions used. This architecture effectively balances precision and efficiency, making it particularly suitable for real-world TSR tasks.
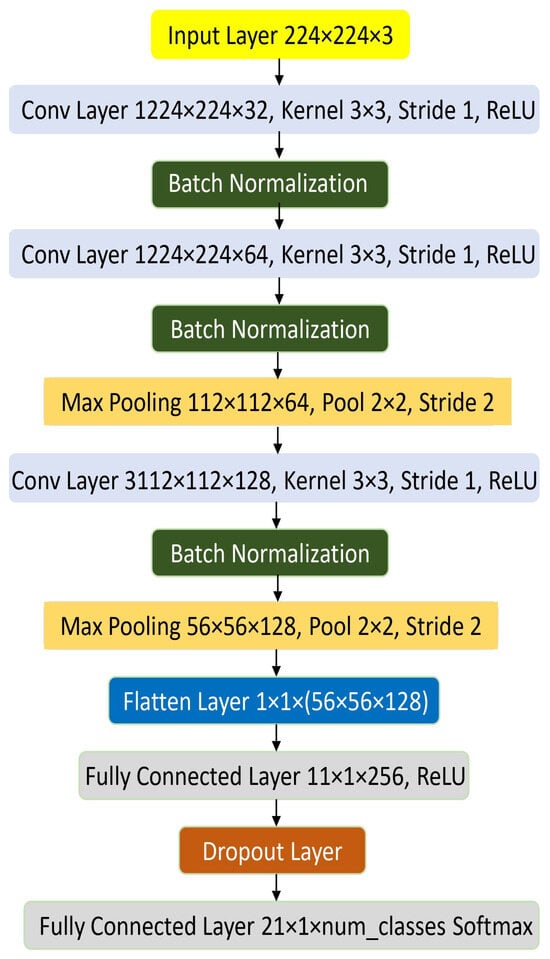
Figure 7.
CNN Architecture for TSR.
3.3.2. Architectures Compared
We conducted a comparison to evaluate the CNN’s performance against several prominent DL architectures, including GoogLeNet, AlexNet, DarkNet-53, ResNet-34, VGG-16, and MicronNet-BF. A concise summary of each of these models is presented in the following sections.
- GoogLeNet, founded on the Inception architecture [35], comprises a deep network with 22 layers that employ Inception modules to utilize convolutional filters of varying widths. This model attained significant success in the ILSVRC 2014 image classification challenge, exhibiting substantially reduced error rates relative to its predecessors. GoogLeNet excels in several tasks, including picture classification, object identification, and facial detection and recognition. Its capacity to effectively manage diverse aspects while sustaining few computing expenses renders it especially appropriate for TSR. The model’s demonstrated efficacy and versatility in computer vision applications highlight its capabilities for real-time traffic sign identification.
- AlexNet is a CNN architecture that attained significant success in the 2012 ImageNet Challenge. This model consists of eight layers, incorporating both convolutional and fully connected layers [36]. It employs grouped convolutions to facilitate effective training across several graphics processing units (GPUs). AlexNet specializes in extracting hierarchical features, including edges and forms, rendering it extremely appropriate for TSR, where the accurate detection of complex patterns is crucial. Its capacity to manage large datasets and its efficacy on GPUs provide real-time and dependable recognition inside traffic safety systems.
- DarkNet-53 is a 53-layer deep CNN that serves as the core architecture for the YOLOv3 object identification system. Its exceptional speed and efficiency render it particularly advantageous for real-time applications, like TSR. The integration of residual connections enhances gradient flow, allowing for the training of deeper networks without facing vanishing gradient problems. Moreover, its optimized and efficient architecture enhances precision in identifying and recognizing traffic signs, even in settings with constrained processing resources. These characteristics render DarkNet-53 an ideal selection for the real-time detection and identification of traffic signs.
- ResNet-34 is a 34-layer deep CNN belonging to the ResNet (Residual Network) architecture, particularly engineered for image categorization applications. The ResNet design introduces residual learning, which effectively addresses the vanishing gradient problem, thereby enabling the training of deeper and more complex neural networks. ResNet-34, pre-trained on the ImageNet dataset of over 100,000 pictures over 200 categories, is renowned for its outstanding performance and efficiency in computer vision applications [37]. TSR’s strong architecture and capacity to learn residual mappings enable it to effectively handle intricate patterns in traffic sign pictures, providing accurate classification despite fluctuations in illumination and backdrops.
- VGG-16 is a notable CNN architecture known for its efficacy and exceptional performance in picture classification and recognition tasks [38]. The designation “16” denotes its architecture, with 16 weight layers that employ 3 × 3 convolutional filters with a stride of 1 to extract intricate features, augmented by 2 × 2 max-pooling layers with a stride of 2 to diminish spatial dimensions. VGG-16, pre-trained on the ImageNet dataset of over one million pictures over 1000 categories, is widely utilized in both general and specialist applications. Within the framework of TSR, the profound design of VGG-16, along with its ability to extract complex information from photos, renders it exceptionally proficient in differentiating diverse traffic signs, thus guaranteeing elevated accuracy and resilience.
- MicronNet is an exceptionally efficient deep CNN designed for real-time traffic sign classification in embedded systems [20]. It attains improved performance by employing batch normalization and factorization methods, which decrease the parameter count while concurrently enhancing accuracy. The network design consists of two fully connected layers, one softmax layer, and five convolutional layers. ReLUs are utilized as activation functions to reduce computing requirements. These key enhancements establish MicronNet as an ideal option for embedded applications, where the dual imperatives of speed and precision are critical. The small architecture enables the rapid processing and efficient real-time identification of traffic signs on resource-constrained devices.
3.4. Model Interpretability
Model interpretability is an essential prerequisite for safety-critical applications such as TSR. In these systems, model transparency is crucial to cultivating trust and enabling users to fully understand the decision-making process. Visual explanations are especially beneficial for the explainability of TSR systems, as they emphasize the areas of the input image that influence the model’s decision. These visualizations are crucial for comprehending the model’s behavior and validating its reliability in real-world scenarios.
We utilized Grad-CAM [39] for the XAI approach to ensure the transparency of our TSR model. Grad-CAM enhances a CNN’s transparency by providing class-discriminative localization maps that are instructive as to where in the image a CNN is making its decisions. Using the gradient information of the final convolutional layer, it produces heat maps that detail the areas significantly impacting model predictions, thus capturing spatial and feature-level importance. Grad-CAM integrates with CNN-based TSR such that the results obtained ensure the interpretability of the model and that the prediction can be easily understood by human expectations.
4. Experiments and Results
The experiments were performed on a machine with an Ubuntu 20.04 operating system and an NVIDIA GTX 1080 Ti GPU with a boost clock frequency of 1582 MHz. All models were implemented in Tensorflow, which is one of the most popular open-source DL libraries that can run parts of the code in parallel, as well as utilize GPU in an easy way. Through the use of CUDA programming, TensorFlow utilizes the parallel computing capabilities of NVIDIA graphics processing units (GPUs), making efficient use of available GPU resources for faster training. The equipment was sourced from NVIDIA, located in Santa Clara, USA.
4.1. Evaluation Metrics
To evaluate and assess the performance of the models studied, we use a set of well-known evaluation metrics, which are defined based on the following:
- TPs (True Positives): instances where the model correctly identifies a traffic sign as belonging to a specific class.
- TNs (True Negatives): instances where the model correctly predicted an area as not belonging to a specific class.
- FPs (False Positives): instances where the model incorrectly identifies an area as belonging to a specific class when it does not belong.
- FNs (False Negatives): instances where the model fails to identify an area as belonging to a specific class when it does belong.
Based on these prediction outcomes, the following evaluation metrics are defined:
- Accuracy (1) evaluates the overall correctness of a model by determining the proportion of accurate predictions relative to the total number of predictions made.
- Precision (2) measures the efficacy of a model in accurately recognizing positive instances by evaluating the ratio of true positive (TP) predictions to the overall number of positive predictions.
- Recall (3) assesses the effectiveness of a model in recognizing all positive instances by determining the ratio of TP to the total number of actual positives.
- The F1-score (4) integrates both precision and recall into a unified metric by computing their harmonic mean. This score offers a comprehensive evaluation of the model’s performance, making it especially valuable when seeking a trade-off between precision and recall.
4.2. Performance Results
The suggested CNN was thoroughly tested against a number of well-known architectures, such as GoogLeNet, AlexNet, DarkNet-53, ResNet-34, VGG-16, and MicronNet-BF, as previously noted. The results of the various models, both with and without data augmentation, are shown in Table 3. Using the original dataset without data augmentation, our model achieved exceptional performance in all metrics, achieving a precision of , a recall of , an F1-score of , and an accuracy of . The findings illustrate the effectiveness of CNN suggested in analyzing the TT100K dataset, attaining accurate and reliable recognition of traffic signs and outperforming other models such as GoogLeNet, AlexNet, DarkNet-53, ResNet-34, and VGG-16. Upon implementing data augmentation, the model preserved its superior performance, attaining a precision of , a recall of , an F1-score of , and an accuracy of . Upon comparing the scores of the analyzed models before and after data augmentation, a marginal decrease in performance was observed in most models. Legacy systems like GoogLeNet and AlexNet showed marginal improvements with enriched data. This may have resulted from their architectural design; AlexNet minimizes overfitting through dropout layers, whereas the inception modules of GoogLeNet effectively utilize the heterogeneity supplied by enriched data. Notwithstanding these enhancements, their performance continued to fall short of that of our suggested CNN. This illustrates the resilience and versatility of our paradigm, since it maintains efficacy in both augmented and non-augmented contexts. This adaptability makes it especially suitable for real-world TSR, where adverse circumstances can significantly affect model performance.

Table 3.
A comparative table of results obtained by different models with and without data augmentation.
To gain a greater understanding of the performance of the model, we examined the scores according to the class of traffic signs. Table 4 illustrates that the suggested model, utilizing data augmentation, had commendable performance in most classes. Several classes, including , , , and , achieved near-perfect accuracy rates of , indicating strong classification proficiency. In contrast, the class had a reduced accuracy of , indicating that the model struggled to differentiate this specific category, maybe due to insufficient data or overlap with other classifications. The model exhibited consistently high accuracy in many complicated or less common classes, including , , , and , with accuracy rates between about and . Although the overall performance of the model was praiseworthy, subsequent research will concentrate on improving accuracy for more difficult classes such as by narrowing class borders or further supplementing the dataset. These findings highlight the crucial contribution of data augmentation to improving model effectiveness, while also suggesting areas for further improvement.

Table 4.
Our proposed model’s performance by class.
4.3. Model Validation
In order to validate our proposed model, we performed a 10-fold cross-validation. Table 5 includes the performance results of a small selection of neural networks, with highlights for the mean averages and standard deviations across each model. The proposed method outperformed most neural network-based state-of-the-art models, with the highest mean average accuracy of with a very small standard deviation of . The corresponding result indicates that our model not only could achieve high accuracy but also had stable performance in multiple training iterations, which is particularly suitable for real-world applications that rely on stability and accuracy. Whereas GoogLeNet () and AlexNet () clearly performed well in comparison, their lower accuracy and higher SDs ( and ) were distinct. MicronNet-BF also yielded competitive results with a mean average of , but our model outperformed it in terms of both precision and robustness.

Table 5.
Cross-validation results of the studied models.
In contrast, DarkNet-53 ( and VGG-16 ( demonstrated a much lower average performance with increased variability, as shown by their increased standard deviations ( and ). This means that, although these models could perform well in many settings, they are not best suited for this task. These results also clarify the crucial role of architectural and training decisions in producing the best performances.
Our comparative study demonstrates the efficiency of the proposed method and that it outperforms existing models in terms of accuracy and robustness. The outcomes present strong promise for applications in practical scenarios that require extreme precision and stability.
4.4. Validation Using GTSRB Dataset
In order to assess the generalizability of the proposed model, experiments were performed on the GTSRB dataset [40], a well-known benchmark for TSR. The GTSRB dataset consists of more than 50,000 high-resolution images across 43 distinct traffic sign categories, encompassing a variety of challenges such as fluctuating lighting conditions and different orientations. These intricacies make the GTSRB an exemplary platform for assessing the efficacy and generalizability of recognition models. Our model demonstrated a very good performance on the GTSRB dataset, achieving an accuracy of , a precision of , a recall of , and an F1-score of , even without employing DA. As presented in Table 6, these metrics underscore the inherent ability of the model to handle complex and diverse traffic sign scenarios, making it a highly robust and reliable solution for real-world intelligent transportation systems.

Table 6.
Performance of our model on GTSRB dataset without DA.
In comparison to other datasets such as TT100K, where our model achieved better scores, the slight decrease in performance on the GTSRB can be attributed to the increased complexity of the dataset. Nevertheless, the ability to achieve such elevated results without augmentation emphasizes the model’s intrinsic robustness and adaptability. This characteristic sets it apart from other existing models that require extensive preprocessing or augmentation to effectively address dataset challenges. Moreover, the model’s consistent performance across both TT100K and the GTSRB illustrates its scalability and appropriateness for implementation in ITS. By sustaining high levels of accuracy and reliability under diverse conditions, our model emerges as a significant asset for real-world applications, facilitating precise and efficient TSR, which is vital for safety and effectiveness in contemporary transportation networks.
4.5. Comparison with State-of-the-Art Models
To understand and measure the robustness of diverse CNN models, it is important to assess their performance in challenging environments. This part of our evaluation provides a comparison of our model versus previous TSR methods, focusing mostly on CNN-based models. We represent this comparison in Table 7. As shown in the table, our model demonstrated significant improvements, achieving an accuracy of 99.06% (DA) and 99.62% (without DA) in the challenging and heterogeneous TT100k dataset. This shows that our method is robust and versatile, even in challenging real-world scenarios.

Table 7.
A comparison of the obtained performance with state-of-the-art methods.
Evaluation using the GTSRB dataset revealed that our model outperformed the CNNs proposed in [13] (99.37% without DA). While the CNN in [25] achieved a 99.2% accuracy on the GTSRB with data augmentation, its reliance on a relatively less diverse dataset could limit its generalizability relative to our network. ENet from [18] achieved a competitive accuracy (98.6%), while it still performed worse than our proposed model.
One of the lightweight CNNs, proposed by Khan et al. in [19], obtained an accuracy of 98.41% using the GTSRB dataset. However, its restricted ability to handle more diverse and complicated scenarios was demonstrated by the experiment on the BelgiumTS dataset (92.06%). The CNN illustrated in [17] achieved lower accuracies of 91.08% with a self-constructed dataset for the Indian traffic sign dataset and 95.45% when combined with the GTSRB data, implying possible challenges in the gereralizability of the model for different datasets. The comparative results show that our model outperformed state-of-the-art models on the challenging TT100k dataset, confirming the effectiveness of the proposed CNN architecture and highlighting the importance of data augmentation for the TSR task.
4.6. Model Explainability
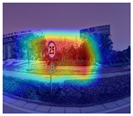
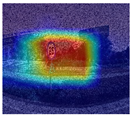
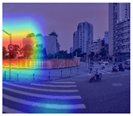
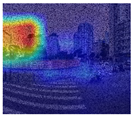
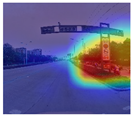
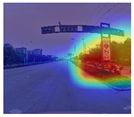
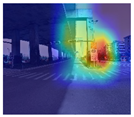
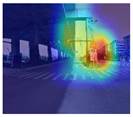
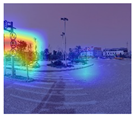
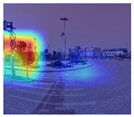
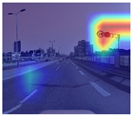
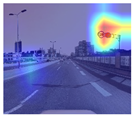
To improve the interpretability of the proposed CNN model, we used Grad-CAM to visualize the regions of the input images that contributed significantly to making predictions. Grad-CAM generates heatmaps by calculating gradients for the target class in the last convolutional layer, highlighting the spatial regions the model relies on. This visualization is overlaid on the original image, thereby clarifying the decision-making process. The application of Grad-CAM on the dataset showed that the highlighted regions corresponded to important features, such as traffic signs and text elements, thereby ensuring the reliability of the model’s attention while predicting. As shown in Table 8, Grad-CAM visualizations demonstrate the model’s capability to consistently identify critical features for different classes of traffic signs.

Table 8.
Grad-CAM visualization of traffic sign images and their corresponding augmentation.
In Table 8, we show the Grad-CAM visualization of eight original photos, all representing a different traffic sign class, and their augmented counterparts that were generated using noise addition, blurring, contrast adjustment, and zooming techniques. The Grad-CAM heatmaps successfully highlight such significant regions focused on the classification task, suggesting that the model was robust to input perturbations, even with augmentations. This comparative study showed that Grad-CAM had the ability to support the predictions made by the model with interpretable representation, specifically for the class. The method ensures openness and fosters trust in the model’s operation, particularly for safety-critical applications such as TSR.
5. Conclusions and Future Work
This study presents a CNN TSR system that exhibits resilience in adverse situations, including changing weather, lighting variations, and low-resolution images. It was trained on the large and challenging TT100k dataset. The robustness of the model was improved by the implementation of data augmentation techniques, such as the introduction of noise, blurring, contrast adjustments, and zooming. A substantial amount of experiments were conducted to compare the suggested models with standard designs. To improve transparency and interpretability, Grad-CAM was employed to provide insight into the decision-making process and the focal areas within the model, enhancing the trust and comprehension of the model’s behavior by highlighting this study’s approach to XAI. To further ensure generalization, we evaluated our model on the GTSRB dataset, demonstrating its ability to perform well on diverse traffic sign conditions. The results demonstrate that the suggested model excelled in several scenarios, suggesting its applicability to real-world TSR.
In further research, we will concentrate on tackling a few important issues that might aid in expanding the model’s applicability. The first improvement will focus on data; in order to boost performance in Arabic-speaking nations, large datasets especially adapted to Arabic traffic signs are necessary. Another area for improvement is improving the model’s efficacy in managing partially or completely obscured traffic signs. This will involve incorporating advanced image processing techniques such as handling partial occlusion and training the model to recognize traffic signs under various environmental conditions like rain, fog, or low-light scenarios. A primary issue lies in enhancing AI explanations and diversifying their forms to facilitate the deeper integration of XAI in trustworthy and responsible AI frameworks. Addressing these difficulties can substantially improve the reliability and efficiency of TSR systems, facilitating the development of safer and more adaptable autonomous driving technology. In addition, we will explore methods to reduce computational cost and resource requirement for real-time applications in resource-constrained environments.
Author Contributions
I.B. designed the model framework and performed the experiments. A.B. and I.B. wrote the manuscript with input from all authors. A.Z. supervised the project. All authors read and approved the final manuscript.
Funding
This research received no external funding.
Institutional Review Board Statement
Not applicable.
Informed Consent Statement
Not applicable.
Data Availability Statement
The datasets used in this study are publicly available. TT100K can be accessed from http://cg.cs.tsinghua.edu.cn/traffic-sign/ (accessed on 1 February 2025), and the GTSRB dataset is available from http://benchmark.ini.rub.de/?section=gtsrb&subsection=dataset (accessed on 01 February 2025).
Conflicts of Interest
The authors declare no conflicts of interest.
Abbreviations
The following abbreviations are used in this manuscript:
| API | Application Programming Interface |
| CCL | Connected Component Labeling |
| CLD | Color Layout Descriptor |
| CTSD | Chinese Traffic Sign Database |
| DA | Data Augmentation |
| DL | Deep Learning |
| ENet | Efficient Network |
| ETSD | European Traffic Sign Dataset |
| FCL | Fully Connected Layers |
| FCN | Fully Convolutional Network |
| FPS | Frames Per Second |
| GPU | Graphics Processing Unit |
| Grad-CAM | Gradient-Weighted Class Activation Mapping |
| GTSRB | German Traffic Sign Recognition Benchmark |
| HOG | Histogram of Oriented Gradient |
| ITS | Intelligent Transportation System |
| LBP | Local Binary Patterns |
| MAP | Mean Average Precision |
| MicronNet-BF | MicronNet-BN-Factorization |
| ML | Machine Learning |
| PCA | Principal Component Analysis |
| ReLu | Rectified Linear Unit |
| RF | Random Forest |
| ROI | Region of Interest |
| SVM | Support Vector Machine |
| TSR | Traffic Sign Recognition |
| TT100K | Tsinghua–Tencent 100K |
| XAI | Explainable AI |
References
- Triki, N.; Karray, M.; Ksantini, M. A real-time traffic sign recognition method using a new attention-based deep convolutional neural network for smart vehicles. Appl. Sci. 2023, 13, 4793. [Google Scholar] [CrossRef]
- Zhu, Y.; Yan, W.Q. Traffic sign recognition based on deep learning. Multimed. Tools Appl. 2022, 81, 17779–17791. [Google Scholar] [CrossRef]
- Seraj, M.; Rosales-Castellanos, A.; Shalkamy, A.; El-Basyouny, K.; Qiu, T.Z. The implications of weather and reflectivity variations on automatic traffic sign recognition performance. J. Adv. Transp. 2021, 2021, 5513552. [Google Scholar] [CrossRef]
- Shorten, C.; Khoshgoftaar, T.M. A survey on image data augmentation for deep learning. J. Big Data 2019, 6, 1–48. [Google Scholar] [CrossRef]
- Chen, Z.; Yang, J.; Kong, B. A robust traffic sign recognition system for intelligent vehicles. In Proceedings of the 2011 Sixth International Conference on Image and Graphics, Hefei, China, 12–15 August 2011; pp. 975–980. [Google Scholar]
- Escalera, S.; Moreno, X.; Pujol, O.; Radeva, P. Road sign detection and recognition based on support vector machines. IEEE Trans. Intell. Transp. Syst. 2011, 12, 377–386. [Google Scholar] [CrossRef]
- Wali, S.B.; Hannan, M.A.; Abdullah, S.; Hussain, A.; Samad, S.A. Shape matching and color segmentation based traffic sign detection system. Threshold 2015, 90, 255. [Google Scholar] [CrossRef][Green Version]
- Weng, H.M.; Chiu, C.T. Resource efficient hardware implementation for real-time traffic sign recognition. In Proceedings of the 2018 IEEE International Conference on Acoustics, Speech and Signal Processing (ICASSP), Calgary, AB, Canada, 15–20 April 2018; pp. 1120–1124. [Google Scholar]
- Namyang, N.; Phimoltares, S. Thai traffic sign classification and recognition system based on histogram of gradients, color layout descriptor, and normalized correlation coefficient. In Proceedings of the 2020—5th International Conference on Information Technology (InCIT), Chonburi, Thailand, 21–22 October 2020; pp. 270–275. [Google Scholar]
- Soni, D.; Chaurasiya, R.K.; Agrawal, S. Improving the Classification Accuracy of Accurate Traffic Sign Detection and Recognition System Using HOG and LBP Features and PCA-Based Dimension Reduction. In Proceedings of the Proceedings of International Conference on Sustainable Computing in Science, Technology and Management (SUSCOM), Amity University Rajasthan, Jaipur, India, 26–28 February 2019. [Google Scholar]
- Li, J.; Wang, Z. Real-time traffic sign recognition based on efficient CNNs in the wild. IEEE Trans. Intell. Transp. Syst. 2018, 20, 975–984. [Google Scholar] [CrossRef]
- Zaibi, A.; Ladgham, A.; Sakly, A. A Lightweight Model for Traffic Sign Classification Based on Enhanced LeNet-5 Network. J. Sens. 2021, 2021, 8870529. [Google Scholar] [CrossRef]
- Serna, C.G.; Ruichek, Y. Classification of traffic signs: The european dataset. IEEE Access 2018, 6, 78136–78148. [Google Scholar] [CrossRef]
- Fang, H.F.; Cao, J.; Li, Z.Y.; Zhang, X.; Wang, Y.; Liu, J.; Chen, L.; Zhang, Q.; Zhao, L.; Zhou, M. A small network MicronNet-BF of traffic sign classification. Comput. Intell. Neurosci. 2022, 2022, 3995209. [Google Scholar] [CrossRef]
- Kuros, S.; Kryjak, T. Traffic sign classification using deep and quantum neural networks. In Proceedings of the International Conference on Computer Vision and Graphics, Warsaw, Poland, 19–21 September 2022; Springer: Berlin/Heidelberg, Germany; pp. 43–55. [Google Scholar]
- Zhu, Y.; Zhang, C.; Zhou, D.; Wang, X.; Bai, X.; Liu, W. Traffic sign detection and recognition using fully convolutional network guided proposals. Neurocomputing 2016, 214, 758–766. [Google Scholar] [CrossRef]
- Bhatt, N.; Laldas, P.; Lobo, V.B. A Real-Time Traffic Sign Detection and Recognition System on Hybrid Dataset using CNN. In Proceedings of the 2022 7th International Conference on Communication and Electronics Systems (ICCES), Coimbatore, India, 22–24 June 2022; pp. 1354–1358. [Google Scholar]
- Bangquan, X.; Xiong, W.X. Real-time embedded traffic sign recognition using efficient convolutional neural network. IEEE Access 2019, 7, 53330–53346. [Google Scholar] [CrossRef]
- Khan, M.A.; Park, H.; Chae, J. A Lightweight Convolutional Neural Network (CNN) Architecture for Traffic Sign Recognition in Urban Road Networks. Electronics 2023, 12, 1802. [Google Scholar] [CrossRef]
- Wong, A.; Shafiee, M.J.; Jules, M.S. MicronNet: A highly compact deep convolutional neural network architecture for real-time embedded traffic sign classification. IEEE Access 2018, 6, 59803–59810. [Google Scholar] [CrossRef]
- LeCun, Y.; Bottou, L.; Bengio, Y.; Haffner, P. Gradient-based learning applied to document recognition. Proc. IEEE 1998, 86, 2278–2324. [Google Scholar] [CrossRef]
- Cao, J.; Song, C.; Peng, S.; Xiao, F.; Song, S. Improved traffic sign detection and recognition algorithm for intelligent vehicles. Sensors 2019, 19, 4021. [Google Scholar] [CrossRef]
- Ren, S.; He, K.; Girshick, R.; Sun, J. Faster R-CNN: Towards real-time object detection with region proposal networks. IEEE Trans. Pattern Anal. Mach. Intell. 2016, 39, 1137–1149. [Google Scholar] [CrossRef]
- Howard, A.G. Mobilenets: Efficient convolutional neural networks for mobile vision applications. arXiv 2017, arXiv:1704.04861. [Google Scholar]
- Youssouf, N. Traffic sign classification using CNN and detection using faster-RCNN and YOLOV4. Heliyon 2022, 8, e11792. [Google Scholar] [CrossRef]
- Li, X.; Xie, Z.; Deng, X.; Wu, Y.; Pi, Y. Traffic sign detection based on improved faster R-CNN for autonomous driving. J. Supercomput. 2022, 78, 7982–8002. [Google Scholar] [CrossRef]
- Wan, H.; Gao, L.; Su, M.; You, Q.; Qu, H.; Sun, Q. A novel neural network model for traffic sign detection and recognition under extreme conditions. J. Sens. 2021, 2021, 9984787. [Google Scholar] [CrossRef]
- Zhang, R.; Zheng, K.; Shi, P.; Mei, Y.; Li, H.; Qiu, T. Traffic Sign Detection Based on the Improved YOLOv5. Appl. Sci. 2023, 13, 9748. [Google Scholar] [CrossRef]
- Nath, G.S.; Acharjee, J.; Deb, S. Traffic sign recognition and distance estimation with yolov3 model. In Proceedings of the 2021 International Conference on Innovation and Intelligence for Informatics, Computing, and Technologies (3ICT), Zallaq, Bahrain, 29–30 September 2021; pp. 154–159. [Google Scholar]
- Li, S.; Wang, S.; Wang, P. A small object detection algorithm for traffic signs based on improved YOLOv7. Sensors 2023, 23, 7145. [Google Scholar] [CrossRef] [PubMed]
- Lim, X.R.; Lee, C.P.; Lim, K.M.; Ong, T.S.; Alqahtani, A.; Ali, M. Recent Advances in Traffic Sign Recognition: Approaches and Datasets. Sensors 2023, 23, 4674. [Google Scholar] [CrossRef]
- Ge, J. Traffic Sign Recognition Dataset and Data Augmentation. arXiv 2023, arXiv:2303.18037. [Google Scholar]
- Soufi, N.; Valdenegro-Toro, M. Data augmentation with symbolic-to-real image translation GANs for traffic sign recognition. arXiv 2019, arXiv:1907.12902. [Google Scholar]
- Zhu, Z.; Liang, D.; Zhang, S.; Huang, X.; Li, B.; Hu, S. Traffic-Sign Detection and Classification in the Wild. In Proceedings of the IEEE Conference on Computer Vision and Pattern Recognition (CVPR), Las Vegas, NV, USA, 27–30 June 2016. [Google Scholar]
- Szegedy, C.; Liu, W.; Jia, Y.; Sermanet, P.; Reed, S.; Anguelov, D.; Erhan, D.; Vanhoucke, V.; Rabinovich, A. Going deeper with convolutions. In Proceedings of the IEEE Conference on Computer Vision and Pattern Recognition, Boston, MA, USA, 7–12 June 2015; pp. 1–9. [Google Scholar]
- Krizhevsky, A.; Sutskever, I.; Hinton, G.E. Imagenet classification with deep convolutional neural networks. Adv. Neural Inf. Process. Syst. 2012, 25. [Google Scholar] [CrossRef]
- He, K.; Zhang, X.; Ren, S.; Sun, J. Deep residual learning for image recognition. In Proceedings of the IEEE Conference on Computer Vision and Pattern Recognition, Las Vegas, NV, USA, 27–30 June 2016; pp. 770–778. [Google Scholar]
- Simonyan, K.; Zisserman, A. Very deep convolutional networks for large-scale image recognition. arXiv 2014, arXiv:1409.1556. [Google Scholar]
- Selvaraju, R.R.; Cogswell, M.; Das, A.; Vedantam, R.; Parikh, D.; Batra, D. Grad-cam: Visual explanations from deep networks via gradient-based localization. In Proceedings of the IEEE International Conference on Computer Vision, Venice, Italy, 22–29 October 2017; pp. 618–626. [Google Scholar]
- Stallkamp, J.; Schlipsing, M.; Salmen, J.; Igel, C. The German traffic sign recognition benchmark: A multi-class classification competition. In Proceedings of the 2011 International Joint Conference on Neural Networks, San Jose, CA, USA, 31 July–5 August 2011; pp. 1453–1460. [Google Scholar]
Disclaimer/Publisher’s Note: The statements, opinions and data contained in all publications are solely those of the individual author(s) and contributor(s) and not of MDPI and/or the editor(s). MDPI and/or the editor(s) disclaim responsibility for any injury to people or property resulting from any ideas, methods, instructions or products referred to in the content. |
© 2025 by the authors. Licensee MDPI, Basel, Switzerland. This article is an open access article distributed under the terms and conditions of the Creative Commons Attribution (CC BY) license (https://creativecommons.org/licenses/by/4.0/).
