Abstract
Modern on-premises threat detection increasingly relies on deep learning over network and system logs, yet organizations must balance infrastructure and resource constraints with maintainability and performance. We investigate how adopting MLOps influences deployment and runtime behavior of a recurrent-neural-network–based detector for malicious event sequences. Our investigation includes surveying modern open-source platforms to select a suitable candidate, its implementation over a two-node setup with a CPU-centric control server and a GPU worker and performance evaluation for a containerized MLOps-integrated setup vs. bare metal. For evaluation, we use four scenarios that cross the deployment model (bare metal vs. containerized) with two different versions of software stack, using a sizable training corpus and a held-out inference subset representative of operational traffic. For training and inference, we measured execution time, CPU and RAM utilization, and peak GPU memory to find notable patterns or correlations providing insights for organizations adopting the on-premises-first approach. Our findings prove that MLOps can be adopted even in resource-constrained environments without inherent performance penalties; thus, platform choice should be guided by operational concerns (reproducibility, scheduling, tracking), while performance tuning should prioritize pinning and validating the software stack, which has surprisingly large impact on resource utilization and execution process. Our study offers a reproducible blueprint for on-premises cyber-analytics and clarifies where optimization yields the greatest return.
1. Introduction
Detection of malicious activity using machine learning methods is becoming increasingly more common not only in research but also in real-world enterprise settings. The authors recently published a paper proposing such an approach based on a deep LSTM neural network [] to streamline the detection of malicious activity in log event sequences and perform it earlier than the traditional approach based on IDS/IPS. Depending on the data, it is capable of detecting malicious activity in network log sequences using only as little as 20% of the original sequence length. However, development of a model is only an initial part of a usable solution. The complex nature of developing and deploying artificial intelligence systems has led to the emergence of machine learning operations (MLOps) as a structured approach to streamline the machine learning lifecycle. Although cloud-based MLOps solutions have gained significant attention, many organizations face constraints that require on-premise deployments, particularly in domains that handle sensitive data or operate under resource limitations []. Cyberthreat detection through log analysis represents one such domain where effective MLOps practices can significantly impact operational efficiency and system reliability.
This article significantly improves our previous paper [] by focusing on the deployment of the developed model using MLOps principles for efficient cybersecurity detection and evaluating several deployment scenarios. To the authors’ best knowledge, there is no research systematically evaluating feasibility of the MLOps approach for cybersecurity threat detection in enterprise environments with limited resources and comparing performance of bare-metal and containerized deployment scenarios with different versions of software libraries. Unlike other papers, such as, for instance, research by Khan et al. [] that deals with differences in cloud-based and on-premise environments of labs for cybersecurity education, in our research, we tested the deployment of the detection model we previously created on bare metal as well as in a containerized environment on the MLOps platform using different versions of software libraries to evaluate various factors influencing performance. Our main contributions are as follows:
- comparison of open source MLops platforms and selection of the most suitable one for our use case representing deployment in a small to mid-size organization requiring high level of data privacy, security, and limited hardware and personnel capacities
- evaluating suitability of deployment on selected MLops platform
- examining the influence of various factors, particularly the deployment platform and version of software libraries, on overall performance of the solution evaluated through various metrics such as runtime and CPU, RAM, and GPU utilization
After developing a model that produced very promising results, we decided to deploy it in a real environment to work as an additional detection method. Cyberthreat detection plays a crucial role in improving the organization’s security posture and overall cyber resilience. Its effectiveness and demands on system resources fundamentally affect the possibilities of detecting threats and the subsequent application of reactive measures. Its efficiency and system resource requirements fundamentally affect the ability to detect threats and subsequently apply reactive measures. Therefore, a systematic approach to exploring deployment options can bring positive results in the form of maximizing performance and effective cost savings, as well as enriching knowledge for the research community.
Our study represents a unique work focusing on deploying a model for detecting malicious activity using MLOps principles in an enterprise environment with limited resources and high demands on the level of security and data privacy, which is very common in many organizations today, especially those involving the government sector, and faces specific challenges different from other enterprise environments. We perform a detailed comparison of open source MLOps platforms and evaluate deployment of the selected one in four different scenarios consisting of various software libraries versions (PyTorch 1.10.2/CUDA 10.2 vs. PyTorch 2.6.0/CUDA 11.8) and bare metal as well as containerized environments.
In Section 2, we provide a background on MLOps in general, including its core principles and maturity models defined by both Google and Microsoft. To separate the general knowledge regarding MLOps, its emergence, and current state from the domain-specific application, on which we focus in this article, we provide the relevant information in distinct Section 3 and Section 4, accordingly. Section 3 analyzes the use of MLOps specifically for the detection of cyber threats and describes our model based on the LSTM neural network capable of detecting malicious activity earlier than using conventional methods based on manually defined rules. In Section 4, we compare the open source MLOps platforms available for our use case and select the most suitable one. The methodology of our experiments is described in Section 5. Our results are shown in Section 6, and in Section 7, we conclude our article and outline possible further research directions.
2. Background
2.1. DevOps Core Principles and MLOps Integration
DevOps is a set of software engineering practices that combine software development (Dev) and IT operations (Ops) to shorten the development life cycle. DevOps practices include continuous integration (CI), continuous delivery/deployment (CD), infrastructure automation, and close collaboration between development and operations teams []. In a DevOps workflow, code changes are frequently merged, automatically tested, and deployed to production through an automated pipeline. This allows faster release cycles and more reliable software updates []. Version control (e.g., Git) here plays the central role, and artifacts (binaries or containers) are versioned and promoted through stages (dev, staging, production). The CI/CD pipeline automates the build, test, and deploy steps, and the monitoring mechanisms serve to detect and fix any issues in production.
In later years, the significantly growing field of machine learning (ML) has reached the point where a similar approach should be used for the ML model development, however, with additional steps: Sculley et al. [] notes that ML systems have all the maintenance problems of traditional software, plus additional ML-specific issues (such as data dependencies, model staleness, and training/serving skew). Thus, MLOps was created.
Machine learning operations (MLOps) applies DevOps principles to the machine learning lifecycle (Figure 1), integrating practices from machine learning, software engineering, and data management. As DevOps served to close the gap between development and operations, MLOps does the same for model development and operations through automation, standardization, and monitoring []. Not only that, but MLOps also extends DevOps concepts to address the additional challenges posed by data and models. While deploying traditional software via DevOps is relatively straightforward [], deploying ML models is more complex due to the need to handle data ingestion, model training, validation, and monitoring of model performance over time []. The core principles of MLOps include the following:
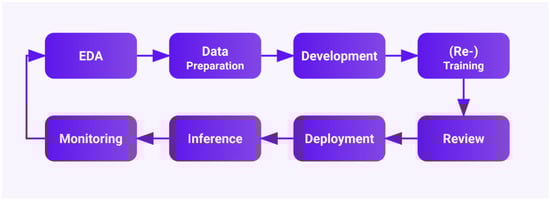
Figure 1.
The Comprehensive Lifecycle of MLOps: From Exploratory Data Analysis, through Data Preprocessing and Model Training, to Model Deployment and Monitoring.
- CI/CD adapted for ML workflows. In MLOps, CI means not only running unit tests on software but also running model training and validation tests automatically on each code change. Similarly, CD means automatically deploying trained models to production after validation []. An ideal MLOps CI/CD pipeline might work as follows:
- code and/or data changes trigger a pipeline run;
- data validation and preprocessing steps are executed;
- the model is evaluated against test datasets;
- if metrics meet criteria, the model is packaged and deployed to a production serving environment;
- the model performance in production is continuously monitored for concept drift or anomalies.
- Additional versioning. Unlike DevOps, which primarily versions source code, MLOps must handle dataset versioning and model versioning in addition to code, since the behavior of a model depends both on code and data []. The MLOps practice incorporates tools like data version control (DVC), Pachyderm, or platform-specific solutions (e.g., ClearML Data, MLflow’s model registry) to track dataset versions and model binaries. ClearML, for example, tags each dataset and model with a unique ID and retains lineage (which data and code produced which model), enabling teams to roll back to an earlier model or dataset if needed. This is analogous to Git for code but applied to large binary data. Moreover, model versioning in MLOps includes storing model metadata such as training parameters and evaluation metrics alongside the model file, often in a model registry. This registry concept (e.g., SageMaker Model Registry or MLflow Model Registry) integrates with CI/CD so that a certain model version can be automatically deployed or compared.
- Automated testing and validation. MLOps requires testing of model quality in addition to code functionality, ensuring the model’s predictions are accurate [], usually by testing against specific metrics. For example, an MLOps pipeline might include a step to compute the model’s accuracy, precision/recall, or false-positive rate on a hold-out security test set.
- Continuous monitoring and feedback loops. Because ML models can degrade over time as data distributions shift, MLOps emphasizes continuous monitoring of model prediction distributions, data drift, and performance metrics []. For example, in the context of cyberthreat detection, this means that if the model performance drops (detection rate falls below defined threshold), the MLOps pipeline can alert engineers or start retraining with the latest data on available threats.
Also, with time, a broader MLOps domain was separated into additional specialized subfields:
- DataOps—focuses on data engineering operations, addressing challenges in data quality, preparation, and pipeline automation [].
- ModelOps—concentrates on the lifecycle management of analytical models in production environments [].
- AIOps—describes AI systems in IT operations, though in industry, the MLOps terminology is used the most since about 2021 [].
2.2. MLOps Maturity Models
Organizations implementing MLOps typically progress through different stages of maturity, characterized by increasing levels of automation and integration. Two widely adopted maturity models have been proposed by Google and Microsoft []:
Google’s MLOps maturity model defines three progressive levels:
- Level 0: Manual processes dominate model development and deployment, with limited automation and reproducibility.
- Level 1: Partial automation exists within the ML pipeline, typically focusing on either training or deployment processes.
- Level 2: Full CI/CD pipeline automation integrates all ML components, enabling continuous training, testing, and deployment of models.
Microsoft’s framework proposes a more granular five-level progression:
- Level 1: No MLOps implementation; processes remain ad hoc and manual.
- Level 2: DevOps practices exist for software development, but they are not extended to ML components.
- Level 3: Automated model training capabilities are established.
- Level 4: Automated model deployment supplements the automated training process.
- Level 5: Complete automation throughout the ML lifecycle incorporates continuous training, deployment, and monitoring with feedback loops.
2.3. Architectural Approaches in MLOps
Modern MLOps systems mostly implement pipeline-based designs that separate data, model, and code from each other, while still allowing them to function together seamlessly. Standard architectures use three primary components: data pipelines for ingestion and preparation, ML pipelines for model development and validation, and DevOps pipelines for deployment and monitoring []. Modern implementations use containerization and microservices to provide more scalability and make the final solution portable. A notable example of this is Kubeflow, which utilizes Kubernetes container orchestration to manage ML workflows across different computing environments []. Research has documented four archetypes of MLOps architectures []: basic online inference systems, training-optimized architectures, continuous learning systems, and hybrid approaches, and 35 distinct architectural components, usually implemented in production ML systems, ranging from data stores and feature engineering modules to model registries and monitoring subsystems. Those components and architectures allow specialists to build their MLOps systems according to organizational needs.
3. MLOps for Cyberthreat Detection
In this study, we evaluate MLOps deployment of system for cyberthreat detection through log analysis using deep learning. For that purpose, we utilize the LSTM-based model and its presumably existing base of normal and malicious log event sequences, from which the patterns of attacks are derived. Further details are provided in Section 3.3.
3.1. Challenges in Threat Detection Through Log Analysis
Scalability and Volume. Modern software systems generate massive volumes of log data, which creates scalability challenges for threat and anomaly detection models. Logs from large-scale services can produce overwhelming numbers of events, stressing storage and real-time processing capabilities [].
Complexity of Log Data. System logs are semi-structured and often mixed up from different simultaneously running tasks, making them complex to analyze. Logs often lack consistent formats or standards, further complicating their parsing and the extraction of relevant characteristics [].
Limited Labeled Anomaly Data. Genuine anomalies are rare and often hard to identify, creating a deficiency of anomaly labels in training data. In addition, security engineers report that many log events cannot be clearly classified as normal or abnormal, and organizational policies can restrict access to logs needed for labeling. This lack of ground-truth data creates the need for unsupervised or semi-supervised detection techniques [].
Evolving Adversary Tactics and Respective Log Patterns (Concept Drift). Threats evolve with time; thus, log patterns of their attacks change over time as systems are updated or reconfigured. Not only that, but log patterns themselves might evolve with time due to technology development, software and protocol updates, etc. Models trained on historical data can become stale and obsolete when concept drift occurs, so continuous learning or periodic retraining become necessary [] while maintaining the ability to mitigate historical threats alongside the new ones; otherwise, the polar type of concept drift may occur.
Production Deployment Constraints. Detection models must operate under real-time constraints and integrate with existing monitoring pipelines. The threat decision threshold tuned in offline experiments requires continuous re-calibration in production environments [].
3.2. MLOps Requirements for Threat Detection Systems
Data Pipelines and Ingestion. Effective threat detection systems require robust data pipelines to handle continuous ingestion and processing of raw logs and telemetry. Well-designed pipelines include data validation and removing invalid or corrupt entities to ensure quality input to models []. For these purposes, real-time data flow platforms, such as Apache Kafka or Flink, are used.
Feature Extraction and Engineering. Raw log data must be transformed into meaningful features via parsing, key attribute extraction (event types, timestamps, error/warning codes, etc.), and creation of statistical or semantic features. Inconsistent or poor quality log data (for example, missing context or not converted to a single standard/formatting) make the parsing system difficult to design and use [].
Model Retraining and Continuous Learning. To solve both concept drift [] and new threats, models need mechanisms for periodic retraining or online updating. MLOps emphasize continuous learning: scheduling model retraining at regular intervals or when significant data drift is detected []. For the same cyberthreat example, this could mean automatically retraining the anomaly detection model weekly, when the volume of new log events exceeds a defined threshold, or if model performance metrics degrade lower than a certain degree of reliability.
Deployment and Integration Considerations. Models might be deployed as microservices or within existing security infrastructure and must handle data in real time. Low-latency processing here is very important; the system should raise alerts as quickly as possible when threats are detected []. In addition, the quality output of the ML detectors might be fed back into security information and event management (SIEM) or incident response systems to provide more information regarding potential threats and, at the same time, enrich the base for future training of threat prediction models.
Monitoring and Model Performance Tracking. The ML-based detection system must be continuously monitored to ensure performance. This includes tracking metrics such as detection rates, false positive/negative rates, and resource usage in production [].
Feedback and Human-in-the-Loop Mechanisms. Security analysts review alerts flagged by the system and provide feedback on their correctness. Through active learning, the model can retrain using these labeled data, continuously reducing error rates [].
3.3. Model for Cyberthreat Detection
In order to evaluate different deployment scenarios, we used a model for detecting malicious activity as well as dataset construction and preprocessing described in detail in []. It was inspired by previously published concepts by Du et al. [] and Meng et al. [], originally intended for anomaly detection in log files, but was modified to detect malicious log sequences based on previously recorded ones.
For data cleaning and pre-processing, several steps are performed (as illustrated in Figure 2). First, the logs are parsed to extract relevant attributes such as timestamps, source and destination IPs, and potentially other relevant information. This process transforms the raw logs into a structured format suitable for further analysis. Next, mapping is required to group related events together. Finally, a grouping strategy is chosen, and valid features are extracted to build the detection model.
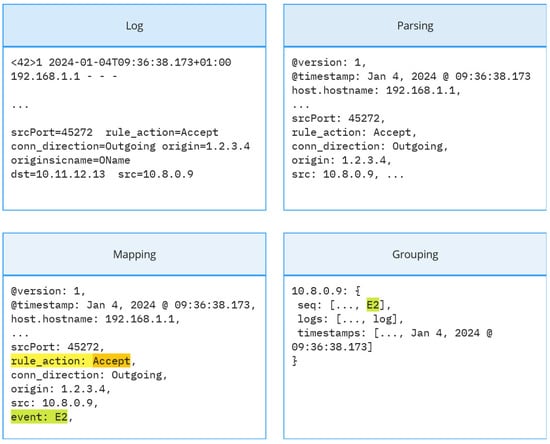
Figure 2.
Preprocessing steps for sample log sequence. Logs are first parsed to key–value pairs, then mapping to one of several event types is performed, and finally, log events are grouped into sequences using external IP addresses.
This approach is common in deep learning for anomaly detection applied to log data [,,]. Extracting informative features that incorporate contextual information can further enhance the model’s explainability.
Once network IPS logs are collected from the two sources—SIEM and Elastic—they undergo preprocessing. This initial stage begins with an organized set of logs, denoted as . A portion of these logs requires parsing, a process that extracts relevant information and transforms each log for each log . The parsed logs typically contain key–value pairs that represent the extracted parameters, structured as .
The parsing step focuses on extracting events from logs. An event represents the type of log. The parsed log () is therefore mapped to one of the events (). During our experiments, we identified relevant attributes to the type of log as typical actions with values like “Allow”, “Deny”, “Inline”, etc. The subsequent step involves the logical organization of events into groups for individual analysis. In our approach, we decided to group logs based on the IP address. This grouping allows for individual analysis of user connections based on a unique identifier. From each group of events (parsed logs related to a specific IP), event sequences can be extracted. These sequences represent the chronological order of events associated with a particular user.
In our experiments, we used a dataset that contained a total of 17,272,630 logs. These logs are classified into two classes: malicious activity and benign activity. The dataset breakdown is as follows:
- Malicious activity: 4,550,022 logs (26.34% of the dataset)
- Benign activity: 12,722,608 logs (73.66% of the dataset)
A total of 202,723 sequences were constructed from the dataset. Among these, only around 12,000 are used in experiments depending on the minimum window size. Malicious activity was represented in around 83% of the sequences.
To minimize information loss for individual connections, we utilize sliding windows with the constant step of a single log. This ensures a thorough analysis for each connection while retaining the identified session boundaries [].
Feature extraction involves transforming pre-processed events into numerical representations suitable for anomaly detection models. We considered primarily sequential and quantitative vectors; however, our previous experiments indicated a limited additional effectiveness of using quantitative vectors to detect malicious activities; therefore, we focused on sequential vectors.
There are two important parameters to consider when configuring our detection model: window size h and the most probable candidates k [].
The window size parameter h determines the number of preceding events considered to predict the next event in a session. This parameter influences the model’s ability to capture temporal patterns within session data. A larger window size means that we will discard shorter sessions until they reach the required number of events.
The most probable candidates k represent the most probable events identified by the model for the next event in the sequence. The selection of the appropriate number of candidates to consider for detection is crucial.
In our approach, we utilize a constant step size of 1 for the sliding window within each session. This minimizes information loss by ensuring that the model considers every single event within a session.
The optimal values of k and h were determined experimentally. We first tried to establish a baseline for what an optimal window size might be. We figured out that models tended to perform better with a smaller window size, but that can be a side effect of removing sequences shorter than minimum window size, thus, changing the ratio for classes. In general, the’ performance of the models was very similar regardless of the window size. Having established a baseline, we experimented with different top k values for the prediction of the next event. Based on our experiments, we found that using lower values for k results in very high false positives (manifested as low specificity). Even with k = 2, the specificity remains low. However, using k = 3 results in a model that can very well identify benign activity and achieves perfect precision and specificity. The trade-off for this is a very low recall, meaning that the model misses a lot of malicious activity, but since this is only an additional detection method, it does not pose a problem.
Since we are working with sessions that were previously captured, we have defined another metric, early detection rate (EDR). Ref. [] EDR measures the proportion of the sequence length (denoted by ) that the model needs to analyze (denoted by A) before making an accurate prediction. In other words, it indicates how much of the sequence the model needs to see on average to correctly detect malicious activity.
To calculate the EDR for the entire dataset, we first compute the EDR for each TP instance. Then, we sum these individual EDR values for all TP instances and divide by the total number of TP instances.
where
- is the early detection rate for the entire dataset.
- is the early detection rate for the i-th true positive instance.
- is the total number of true positive instances.
4. On-Premise Deployment and MLOps Technologies
4.1. Overview of Current MLOps Software Ecosystem
The MLOps technology landscape comprises diverse tools and platforms addressing specific aspects of the machine learning lifecycle. Open-source frameworks such as MLflow, Kubeflow, ClearML, Weights and Biases, and Polyaxon offer varying capabilities for experiment tracking, pipeline orchestration, and model deployment. Cloud providers, on their behalf, have also developed native services, including AWS SageMaker, Google Vertex AI, and Azure Machine Learning, that provide integrated environments within their own ecosystems [].
Comparative analysis [] shows that no single platform fully addresses all MLOps requirements as an ideal “all-in-one” solution. Each tool has a specific focus and strengths, such as experiment tracking, model versioning, or deployment automation, while potentially lacking capabilities in other areas. Due to that, the selection of appropriate tools depends on organizational requirements, existing infrastructure, and specific use cases.
Common deployment patterns today involve combinations of complementary tools, for example using MLflow for experiment tracking and model registry while implementing Kubeflow for training pipelines and a specialized serving framework for deployment. This modular approach allows organizations to construct their own customized MLOps stacks [].
4.2. Comparison of MLOps Platforms for On-Premise Deployment
Although many cloud-based MLOps platforms exist and offer a high degree of maturity, in our study, we focus on on-premise MLOps implementations, as they present distinct requirements compared to cloud-based deployments. Despite a number of undeniable advantages of cloud-based solutions (including areas such as cybersecurity education []), many organizations often prioritize data privacy, security, integration with existing infrastructure, and cost considerations [] and therefore prefer on-premise solutions. Open-source frameworks provide viable options for on-premise implementation:
- Kubeflow offers comprehensive capabilities, but requires substantial infrastructure expertise and Kubernetes proficiency []
- ClearML provides simplified deployment procedures while maintaining robust experiment tracking and orchestration capabilities []
- MLflow [] and OpenShift can be integrated to construct complete pipelines
The comparison of individual platforms is shown in Table 1 and Table A1 in Appendix A. A significant limitation of cloud-native MLOps services is their restricted functionality or unavailability for on-premise deployment. Although some providers offer hybrid solutions, these frequently lack the unified experience required to support a wide variety of specific deployment scenarios, particularly in resource-constrained environments []. Recent research [] has emphasized the need for deployment-agnostic MLOps architectures that enable consistent workflows across the on-premise infrastructure and various cloud providers.

Table 1.
Comparison of four Open Source MLOps platforms—MLFlow, KubeFlow, ClearML, and Red Hat OpenShift (continuation in Table A1).
The platforms in question are MLFlow, Kubeflow, ClearML, and Red Hat OpenShift.
- -
- MLflow is an open-source platform for managing the ML lifecycle, including experimentation, reproducibility, deployment, and model registry.
- -
- Kubeflow is a Kubernetes-native platform for orchestrating ML workflows with dedicated services for training, pipelines, and notebook management
- -
- ClearML is a unified platform for the entire ML lifecycle with modular components for experiment tracking, orchestration, data management, and model serving
- -
- OpenShift is an Enterprise Kubernetes platform with MLOps capabilities through integrations with Kubeflow and other ML tools.
Based on our analysis and the comprehensive comparison provided in Table 1 and Table A1, we have chosen the ClearML platform to deploy our model. It is sufficiently simple to install and deploy; works as an all-in-one tool for general MLOps; enables orchestration, experiment tracking, dataset protection and versioning, and sufficiently detailed monitoring; and allows for its own way of creating automated pipelines. Unlike custom modular installation of Kubernetes and other independent MLOps components, which would be an overkill for our deployment scenario, the all-in-one tool like ClearML is a much more suitable solution.
On behalf of the organization, the evaluation of platforms for on-premise deployment should consider installation complexity, resource requirements, integration capabilities, learning curve, and operational overhead. For example, small organizations or ones that implement MLOps in resource-constrained environments benefit from lightweight solutions that provide essential functionality without imposing excessive infrastructure demands [] or a steep learning curve for respective tools.
4.3. ClearML and Its Capabilities for On-Premise Deployment
ClearML represents an open-source MLOps platform designed to address the complete machine learning lifecycle through a modular architecture that balances functionality with simplicity of deployment. Its primary components include experiment tracking, orchestration, data management, and model serving capabilities, making it particularly well-suited for on-premise environments with limited resources []. For example, Neural Guard (a security screening company) used ClearML to deploy its X-ray threat detection models to production as scalable services []. ClearML’s unified platform (tracking, orchestration, serving) allowed Neural Guard to accelerate its AI pipeline from research to deployment, while maintaining on-premise control over data and models.
4.3.1. Architecture and Components
ClearML implements a client–server model with separation between the control plane and execution engines. Its architecture centers around the ClearML Server (control plane) and multiple ClearML Agents (workers). The ClearML Server functions as a central hub for storing experiment metadata, models, and workflow configurations, accessible via a web UI, and it can be deployed on-premise or in the cloud. By default, this server is available as a managed hosted service or as a self-hosted solution (including air-gapped on-premise deployments) for enterprise needs.
ClearML Agents serve as distributed workers receiving commands from the server []. These agents are lightweight processes that orchestrate and execute tasks on any machine (VMs, containers, or bare metal). Each agent reproduces the exact environment of a recorded experiment (including code, dependencies, and parameters) and then runs it, reporting the results back to the server [,]. Agents poll a central task queue, offering distribution and scalability—adding more agents (workers) allows parallel execution of multiple experiments or pipeline steps across an on-premise cluster or cloud nodes []. This design provides a flexible orchestration layer that supports integration with Kubernetes, Slurm, or plain machines to schedule jobs [].
Finally, for model deployment, a special type of ClearML Agents—ClearML Serving—provides dedicated inference capabilities with support for real-time prediction and monitoring [].
The platform’s technical requirements are relatively modest compared to Kubernetes-based alternatives, such as Kubeflow or Red Hat Openshift. A standard ClearML Server deployment requires approximately 4 CPUs, 8 GB RAM, and 100 GB storage (these are similar to the candidates mentioned above, only the RAM requirement being significantly lower, since Kubeflow and Openshift might usually require 16 GB), but the requirements of the ClearML Agent vary according to and corresponding to the required workload, making it much more suitable for resource-constrained environments []. Unlike Kubeflow or OpenShift, which require substantial Kubernetes expertise beforehand, ClearML provides direct installation through Docker containers that can be orchestrated via docker-compose, significantly reducing operational complexity [].
Experiment Tracking and Version Control. ClearML provides both experiment tracking and data versioning, including the metadata storage, to address the prior requirement in MLOps: MLOps must handle versioning of data and models, as well as code. Thus, its experiment tracking capabilities automatically capture code, dependencies, their versions, hyperparameters, metrics, and artifacts without requiring extensive code modifications. The platform can capture Git commits and local modifications, ensuring that the exact code version for a model is recorded []. ClearML addresses data versioning via its ClearML Data module, which manages datasets with lineage and version identifiers. This provides a single source of truth for experiments, supporting collaborative ML development in which teams can reproduce results and compare model variants [].
4.3.2. Orchestration and Pipelines
ClearML provides a workflow engine to define and automate ML pipelines using a directed acyclic graph (DAG) for chaining of tasks (such as data preprocessing -> model training -> evaluation -> deployment). Each step in a pipeline can be an existing experiment/task or a code function, which ClearML can schedule via its agents []. The ClearML Agent ensures that pipeline steps run in the correct environment and sequence. The ClearML orchestration module (also known as the MLOps/automation module) integrates with the underlying compute infrastructure; for example, it can dispatch jobs to Kubernetes clusters or handle them on bare-metal servers, giving flexibility in how workloads are executed []. The platform’s queue system allows users to assign pipeline steps to specific execution queues (e.g., GPU vs. CPU queues), with multiple agents working on the same queue to scale parallel tasks.
This achieves a form of CI/CD for machine learning: when code or data changes are pushed, pipeline tasks can be automatically re-run through the queue []. Thus, reproducibility is built in at each stage, since the agents recreate the exact environment for every run. In addition, the ClearML web interface provides real-time monitoring of pipeline execution and resource utilization between agents (a live orchestration dashboard) [].
4.3.3. Model Serving and Deployment
ClearML provides two distinct approaches for inference: agent-based execution for batch inference and dedicated serving containers for real-time prediction. The first approach is mostly self-explanatory, as those are just worker containers that run a specified triggered task once, while providing the output for it, if it was programmed inside the task itself (for example, matplotlib artifacts, text file outputs inside the Python script, etc.).
The serving component, on the other hand, is created for a live streaming inference. It is a cloud-ready and scalable engine that supports customizable preprocessing and post-processing logic, horizontal scaling, and integrated monitoring []. It allows users to take a model from the ClearML repository and deploy it to an HTTP endpoint (or other interface), typically through CLI commands or via the user interface. ClearML Serving also provides out-of-the-box model monitoring, logging requests, and performance metrics for each deployed model []. This helps in tracking drift or degradation in a model’s performance in the field.
Under the hood, ClearML’s serving relies on containerized backends, which support both CPU and GPU workloads (supporting NVIDIA CUDA); also, it provides integration with NVIDIA Triton to optimize runtime performance on GPU hardware []. This enables serving of deep learning models with support of Triton’s optimizations (batching, concurrent model execution). However, the drawback is that ClearML Serving has no other mechanism to run deep learning models: it can support scikit-learn and other traditional ML libraries in its different serving engines, but no other option for deep learning and AI exists.
For on-premise deployments, ClearML’s serving can be installed behind the firewall without cloud dependencies. Organizations can deploy ClearML Agents on production servers to host model services that continuously listen for inference requests [].
5. Materials and Methods
5.1. Implementation Framework
Our implementation architecture addresses the specific requirements of on-premise cyberthreat detection while effectively utilizing available hardware resources. The system follows a distributed model with clear separation between computational nodes to optimize resource utilization. The architecture of our setup is shown in Figure 3.
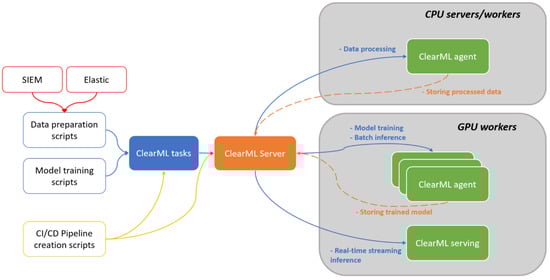
Figure 3.
Architecture of experimental setup consists of two nodes (CPU and GPU worker) and data are being obtained from SIEM and Elastic. Subsequently data are ingested and processed by ClearML Agent using GPU. Additional GPU worker nodes can be added in the future.
The central component is a CPU/RAM-rich server hosting the ClearML Server components (orchestration dashboard, experiment tracking, artifact storage). A dedicated GPU server functions exclusively as a worker, performing computationally intensive tasks that include model training, validation, and inference. The inference infrastructure implements both batch inference via ClearML Agent and real-time detection via ClearML Serving.
Communication between components utilizes default ClearML APIs and shared storage mechanisms, while containerization via Docker provides isolation and reproducibility across all system components. The architecture is designed to accommodate future expansion, with additional GPU workers capable of seamless integration through the same connection methodology.
5.2. Experimental Setup
Our experimental evaluation used a two-server hardware configuration representative of resource-constrained on-premise environments: a primary server with multi-core CPU processors and substantial RAM but no GPU acceleration and a secondary server with dedicated NVIDIA GPU resources. The exact description of the hardware configuration is given in Table 2.
Table 2.
Hardware configuration of two nodes used for experimental setup.
We evaluated two distinct implementation approaches:
- A traditional methodology without MLOps integration, using direct Python script execution and manual artifact management;
- A ClearML-integrated pipeline with orchestration and Agent tasking.
Additionally, in order to measure the dependence of the model performance on the software, we used two distinct versions of frameworks:
- A version of PyTorch and NVIDIA CUDA for which our model was initially developed—PyTorch 1.10.2/CUDA 10.2;
- The substantially newer version that still supported the original source code—PyTorch 2.6.0/CUDA 11.8.
With this, we had 4 distinct scenarios to execute by combining the environment types and framework versions:
- bare metal with older framework
- bare metal with newer framework
- containerized execution with older framework
- containerized execution with newer framework;
Our ClearML implementation used Docker Compose for server deployment, with agents on both CPU and GPU servers connected to the central orchestration point. Datasets, model training code, and inference logic were the same to compare the resource requirements and performance metrics for both approaches fairly.
We compared traditional and ClearML-integrated approaches, both for model training and inference, across several metrics:
- Overall time of process execution in seconds;
- Average CPU utilization (%);
- Maximum CPU utilization (%);
- RAM usage (MB);
- Peak GPU Memory Utilization (MB).
6. Results and Discussion
6.1. Comparison of Traditional and ClearML-Integrated Approaches in Hardware Resource Utilization
We perform the demo run for training and inference of a cyberthreat detection model based on log event sequence analysis. During this run, as mentioned in Section 5, we measured the utilization of system resources in the plain host environment (bare metal) and inside a ClearML agent container on the same worker. Both training and inference were successfully conducted with NVIDIA CUDA GPU acceleration.
The overall dataset consisted of approximately 230,000 entries, and the inference test dataset was limited to a fraction of 30,000 entries. Training was also limited to 20 epochs instead of a much larger production cycle, as our preliminary tests have shown that proportions and relativity of metrics remain the same for both manually limited fractions of epochs and source data and for their full versions.
The results are shown in Table 3 (training) and Table 4 (inference), but to provide a more visually comfortable comparison, we also created the plots for each metric separately during both training and inference in Figure 4. In addition, as we tried to minimize resources in general, we created a radar chart and we aim for footprint minimization. These charts are shown in Figure 5 and Figure 6.
Table 3.
Comparison of performance for training. The utilization of CPU is higher when using PyTorch 1.10.2 with CUDA 10.2 leading to shorter processing time.
Table 4.
Comparison of performance for inference. The difference between CPU utilization is lower, but memory efficiency is more different.
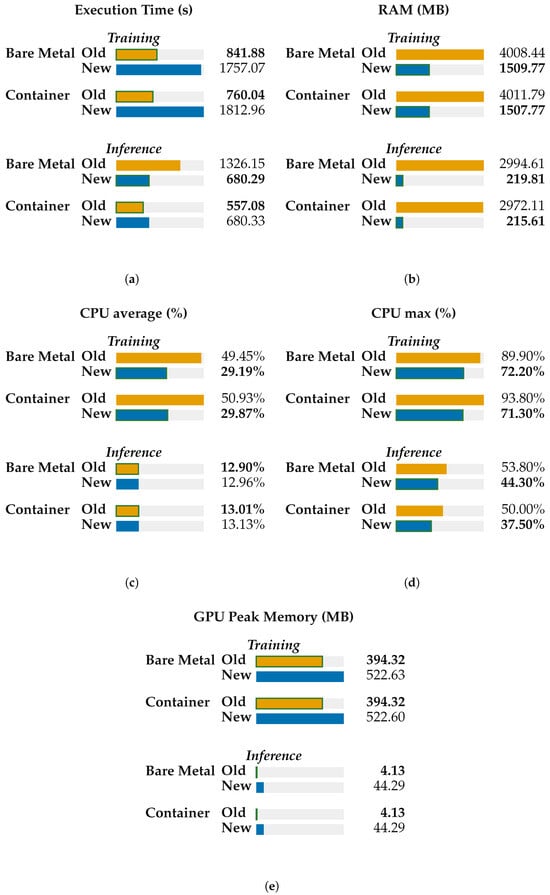
Figure 4.
Comparison of various metrics for both training and inference. Old version stands for PyTorch 1.10.2 with CUDA 10.2; new is for PyTorch 2.6.0, CUDA 11.8 (a) Execution time. (b) RAM usage. (c) Average CPU average usage. (d) Maximum CPU usage. (e) GPU Peak Memory.
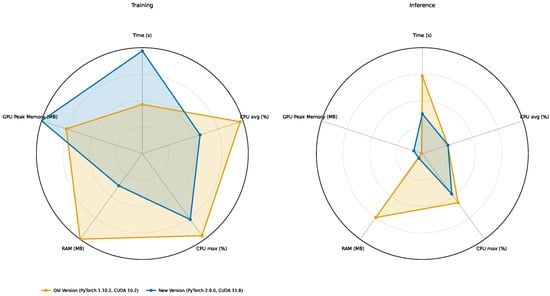
Figure 5.
Performance difference on bare metal. Shift to higher CPU utilization efficiency for PyTorch 1.10.2 with CUDA 10.2 stack is apparent, especially for training.
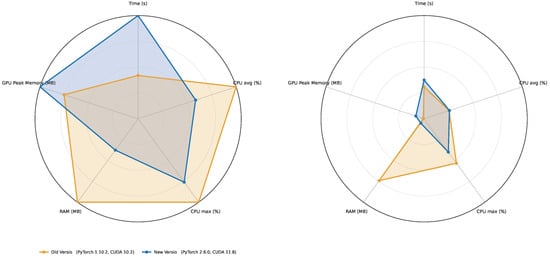
Figure 6.
Performance difference in container. Results are similar to performance on bare metal, making software stack a much stronger factor influencing performance.
From these data, we might derive some interesting conclusions:
- Deployment vs. runtime. Containerization does not uniformly outperform bare metal. For training, the container is faster only with PyTorch 1.10.2/CUDA 10.2 (∼9.7% faster); with PyTorch 2.6.0/CUDA 11.8, it is slightly slower (∼3.2%). For inference, the container is much faster with PyTorch 1.10.2 (∼58.0%), while with PyTorch 2.6.0, the container and the bare metal are at parity (∼0% difference). The framework version exerts a larger influence on runtime than the deployment model.
- Resource utilization across deployments. At a fixed framework version, containers and bare metal show near-identical resource profiles.
- CPU: During training, the average CPU utilization falls from ∼50% (1.10.2) to ∼29% (2.6.0) in both deployments (a ∼41% drop); the maximum CPU also decreases (by 20–24%). During inference, the average CPU remains ∼13% for all cases; container CPU maxima are lower than the bare metal by ∼7% (1.10.2) and ∼15% (2.6.0).
- Host RAM: Moving from 1.10.2 to 2.6.0 significantly reduces RAM consumption in both deployments (training: ∼4.0 GB → ∼1.5 GB, ∼62% reduction; inference: ∼3.0 GB → ∼0.22 GB, ∼93% reduction). In a fixed version, the differences between container and bare-metal RAM are within ∼2%.
- GPU peak memory: In a fixed version, container and bare metal are effectively identical. Across versions, 2.6.0 increases peak GPU memory (training: ∼+33%; inference: ∼10.7×), independent of deployment.
- Version dominance. Changing the framework from PyTorch 1.10.2/CUDA 10.2 to PyTorch 2.6.0/CUDA 11.8 has the largest effect: the training time more than doubles (+109–139% depending on deployment). For inference, the upgrade nearly halves the time on bare metal (∼49% faster) but increases the execution time in containers (∼22% slower).
- Container parity and possible advantage. When controlling for version, containers stay within a few percent of bare metal for training (−9.7% to +3.2%) and range from parity (2.6.0) to large gains (1.10.2) for inference. There is no systematic container-induced slowdown or resource penalty.
- The fastest vs. leanest configurations. The lowest observed times for both training and inference occur with the Container (PyTorch 1.10.2/CUDA 10.2). If minimizing host RAM is the priority, PyTorch 2.6.0 (either deployment) would be preferable; under 2.6.0, inference latencies are at parity between deployments.
- CPU vs. GPU bottlenecks. The marked slowdown in training under 2.6.0 coincides with lower average CPU utilization (to ∼29%), indicating GPU-side kernel behavior, synchronization, or possibly, library-level factors rather than host–CPU saturation.
6.2. Theoretical Scalability
A key question for any MLOps-driven system is how it scales with additional compute workers. Theoretically, if the workload is perfectly parallelizable with no overhead, the use of n workers should provide a p-fold speedup (often called linear scaling) []. However, in practice, there are diminishing returns as p grows. Amdahl’s Law provides a model for such a speedup: if a fraction k of the process can be parallelized (and the rest 1 − k must remain serial), the maximum speedup with p workers is
This implies a saturation point—once p is large enough that the serial portion dominates, adding more workers gives little to no improvement [].
For example, if 80% of the pipeline is parallel (data processing and inference on independent inputs) and 20% is serial (aggregation, I/O, etc.), then the theoretical speedup with p = 6 workers would be
With p = 10 workers, it would be
So, even with 10 workers, the speedup would plateau below 4× in this scenario (because the serial fraction of 20% becomes the bottleneck).
Thus, in the real case, we might observe near-linear scaling at low p and then sub-linear improvements as p increases. For example, Chen et al. [] achieved a 4–6× speedup with 7 threads in a parallelized network intrusion detection workload. In their experiments, a single-threaded intrusion detection system (IDS) processing network packets was compared to a multi-threaded version (Para-Snort), and at 7 worker threads, the throughput reached roughly 6× the single-thread performance []. This indicates about 85–90% parallel efficiency in 7 workers, with some overhead due to thread coordination and shared resources. Although evaluation of scaling was not the main focus of our research, other papers [] indicate that vertical scaling is a very good method to enhance performance while applying the federated learning approach.
6.3. Limitations of the Study
As we considered a scenario of deployment in a small organization with a limited amount and quality of hardware available, we were not able to utilize the hardware resources sufficient for a large enterprise environment or multi-node GPU clusters. Therefore, we were unable to test or scale our solution on a given software stack on larger environments. In large enterprise environments, the traditional approach of modular Kubernetes, its add-ons, and stand-alone MLOps components might be more beneficial than establishing a tight-bound ecosystem of ClearML with unclear performance bottlenecks arising in large environments. In this work, we focused on enabling the possibilities of flexible MLOps with our limited resources with the possibility of future scaling in mind.
7. Conclusions and Future Work
In our research, we focus on improvement in cyberthreat detection capabilities in a small-enterprise scenario with limited resources but high level of data security privacy requirements. We examine various aspects of deploying a previously created detection model in an operational environment as a complementary cyberthreat detection mechanism to perform detection better and more efficiently, making the best use of available system resources.
We conducted in-depth analysis and comparison of MLOps platforms suitable for on-premise deployment in resource-constrained enterprise environments, and ClearML emerged as the winner that best met the criteria. Our on-premise evaluation of MLOps orchestration and containerized execution with ClearML framework shows that deployment model alone (container vs. bare metal) is not a reliable predictor of performance or resource use. When the framework version is held constant, containers exhibit near-parity with bare metal in training and inference times and in CPU, RAM, and GPU peak memory. The dominant factor is the version of the software stack: moving from PyTorch 1.10.2/CUDA 10.2 to PyTorch 2.6.0/CUDA 11.8 more than doubles the training time, nearly halves the bare-metal inference time, sharply reduces the host RAM, and increases the maximum GPU memory, irrespective of deployment.
Practically, for this workload, the lowest training and inference times were observed with the containerized PyTorch 1.10.2/CUDA 10.2 setup, whereas PyTorch 2.6.0 (either deployment) minimized host RAM usage with inference latency at parity between deployments. These findings indicate that version selection and configuration tuning should precede decisions about the deployment model.
We caution against attributing performance gains to generic “container optimizations.” When software stacks are matched, our measurements indicate that runtime differences are driven by framework/CUDA versions rather than by the deployment medium itself. In a fixed version, containers do not exhibit a systematic resource penalty relative to bare metal. Accordingly, the choice of deployment should be guided by organizational constraints (operations, cost, maintainability), workload characteristics, and model-specific optimization needs—especially the requirement to lock in framework/driver combinations that materially affect performance—rather than by expectations of intrinsic container speedups.
Regarding general organizational implications, lightweight open-source MLOps solutions may remain attractive for small, resource-constrained teams due to ease of installation and lower operational complexity; however, this is a contextual consideration.
Future work in this field might include the data processing and measurements of CPU-heavy processes as well as more detailed and thorough resource utilization and performance monitoring both inside the agent containers and on its hosts or to use GPU profiling to find the reasons for high memory usage. Alternatively, a thorough investigation of PyTorch and CUDA changelogs may uncover the reason for high memory usage (i.e., new optimization or caching requires more GPU memory). In addition, parallel execution across a larger number of workers might be another important measurement, as parallel and federated machine learning is also a notable and rapidly growing concept in the modern world. Improvement of the detection model is also an option for future work. We plan to evaluate state-of-the-art architectures, such as transformers, to perform detection. Furthermore, adaptation of a large language model to detect malicious log event sequences could be an interesting research work as well.
Author Contributions
Conceptualization, A.R. and D.S.; methodology, A.R.; software, D.S.; validation, I.K., D.S. and A.R.; formal analysis, D.S.; investigation, D.S. and A.R.; resources, A.R.; data curation, D.S. and A.R.; writing—original draft preparation, D.S. and A.R.; writing—review and editing, I.K.; visualization, D.S.; supervision, I.K.; project administration, A.R.; funding acquisition, I.K. All authors have read and agreed to the published version of the manuscript.
Funding
This research was funded by the EU NextGenerationEU through the Recovery and Resilience Plan for Slovakia under the project No. 09I05-03-V02-00012. This project was partially supported by project KEGA No. 004ZU-4/2024 “Improving the quality of education in the field of cyber security”.
Data Availability Statement
Source code, scripts, and Ansible playbooks used for the experiments will be made available by the authors on request. The datasets used in this article were obtained from GOV CERT SK unit and are not readily available because they originate from critical infrastructure and are subject to confidentiality. Requests to access the datasets should be directed to the National Agency for Network and Electronic Services of Slovak Republic.
Acknowledgments
We would like to thank the GOV CERT SK unit of the National Agency of Network and Electronic Services for granting access to the necessary data and infrastructure, which were critical to this project. During the preparation of this manuscript, the authors used tool ChatGPT version 4 and 5.1 for the purposes of generation of charts and Writefull for grammar correction. The authors have reviewed and edited the output and take full responsibility for the content of this publication.
Conflicts of Interest
The authors declare no conflicts of interest.
Abbreviations
The following abbreviations are used in this manuscript:
| SIEM | Security information and event management |
| LSTM | Long short-term memory |
| IDS | Intrusion detection system |
| IPS | Intrusion prevention system |
| CI | Continuous integration |
| CD | Continuous delivery/deployment |
| ML | Machine learning |
| DVC | Data version control |
| EDR | Early detection rate |
| RAM | Random access memory |
| GPU | Graphics processing unit |
| CPU | Central processing unit |
| CUDA | Compute unified device architecture |
| DAG | Directed acyclic graph |
| OS | Operating system |
Appendix A
Table A1.
Comparison of MLOps platforms-continued.
Table A1.
Comparison of MLOps platforms-continued.
| Feature | MLflow | Kubeflow | ClearML | Red Hat OpenShift |
|---|---|---|---|---|
| Software Requirements | Python 3.6+, optional database | Kubernetes v1.14+, Docker, Linux | Python 3.6+, Docker (for server deployment), MongoDB, Elasticsearch, Redis (come preinstalled in ClearML Server Docker images) | Kubernetes platform; RHEL/CentOS/Fedora CoreOS; Docker/CRI-O runtime. |
| Core Components | Tracking, Model Registry, Projects, Models | Pipelines, Notebooks, Training Operators, KServe, Katib, Metadata | Experiment Manager, MLOps/LLMOps Orchestration, Data Management, Model Serving | Container orchestration, CI/CD, DevOps integration, OpenShift AI |
| Architecture | Modular components with Python APIs and UI interfaces | Kubernetes-based microservice architecture | Three-layer solution with Infrastructure Control, AI Development Center, and GenAI App Engine | Kubernetes-based container platform with enterprise enhancements |
References
- Ralbovský, A.; Kotuliak, I. Early Detection of Malicious Activity in Log Event Sequences Using Deep Learning. In Proceedings of the 2025 37th Conference of Open Innovations Association (FRUCT), Narvik, Norway, 14–16 May 2025; pp. 246–253. [Google Scholar] [CrossRef]
- Kreuzberger, D.; Kühl, N.; Hirschl, S. Machine Learning Operations (MLOps): Overview, Definition, and Architecture. IEEE Access 2023, 11, 31866–31879. [Google Scholar] [CrossRef]
- Khan, A.; Mohamed, A. Optimizing Cybersecurity Education: A Comparative Study of On-Premises and Cloud-Based Lab Environments Using AWS EC2. Computers 2025, 14, 297. [Google Scholar] [CrossRef]
- Amazon. What Is MLOps?—Machine Learning Operations Explained—AWS. Available online: https://aws.amazon.com/what-is/mlops/ (accessed on 10 March 2025).
- Sculley, D.; Holt, G.; Golovin, D.; Davydov, E.; Phillips, T.; Ebner, D.; Chaudhary, V.; Young, M.; Dennison, D. Hidden Technical Debt in Machine Learning Systems. Adv. Neural Inf. Process. Syst. 2015, 28, 2494–2502. [Google Scholar]
- Horvath, K.; Abid, M.R.; Merino, T.; Zimmerman, R.; Peker, Y.; Khan, S. Cloud-Based Infrastructure and DevOps for Energy Fault Detection in Smart Buildings. Computers 2024, 13, 23. [Google Scholar] [CrossRef]
- Subramanya, R.; Sierla, S.; Vyatkin, V. From DevOps to MLOps: Overview and Application to Electricity Market Forecasting. Appl. Sci. 2022, 12, 9851. [Google Scholar] [CrossRef]
- Skogström, H. What Is The Difference Between DevOps And MLOps? Available online: https://valohai.com/blog/difference-between-devops-and-mlops/ (accessed on 10 March 2025).
- Bayram, F.; Ahmed, B.S. Towards Trustworthy Machine Learning in Production: An Overview of the Robustness in MLOps Approach. ACM Comput. Surv. 2025, 57, 1–35. [Google Scholar] [CrossRef]
- Key Requirements for an MLOps Foundation. Available online: https://cloud.google.com/blog/products/ai-machine-learning/key-requirements-for-an-mlops-foundation (accessed on 10 March 2025).
- Symeonidis, G.; Nerantzis, E.; Kazakis, A.; Papakostas, G.A. MLOps—Definitions, Tools and Challenges. In Proceedings of the 2022 IEEE 12th Annual Computing and Communication Workshop and Conference (CCWC), Virtual, 26–29 January 2022; pp. 453–460. [Google Scholar] [CrossRef]
- Hewage, N.; Meedeniya, D. Machine Learning Operations: A Survey on MLOps Tool Support. arXiv 2022, arXiv:2202.10169. [Google Scholar] [CrossRef]
- Amou Najafabadi, F.; Bogner, J.; Gerostathopoulos, I.; Lago, P. An Analysis of MLOps Architectures: A Systematic Mapping Study. In Proceedings of the Software Architecture: 18th European Conference, ECSA 2024, Luxembourg, 3–6 September 2024; pp. 69–85. [Google Scholar] [CrossRef]
- Chen, Z.; Liu, J.; Gu, W.; Su, Y.; Lyu, M.R. Experience Report: Deep Learning-based System Log Analysis for Anomaly Detection. arXiv 2022, arXiv:2107.05908. [Google Scholar] [CrossRef]
- Partida, D. Integrating Machine Learning Techniques for Real-Time Industrial Threat Detection. Available online: https://gca.isa.org/blog/integrating-machine-learning-techniques-for-real-time-industrial-threat-detection (accessed on 10 March 2025).
- Togbe, M.U.; Chabchoub, Y.; Boly, A.; Barry, M.; Chiky, R.; Bahri, M. Anomalies Detection Using Isolation in Concept-Drifting Data Streams. Computers 2021, 10, 13. [Google Scholar] [CrossRef]
- Markevych, M.; Dawson, M. A Review of Enhancing Intrusion Detection Systems for Cybersecurity Using Artificial Intelligence (AI). Int. Conf. Knowl. Based Organ. 2023, 29, 2023. [Google Scholar] [CrossRef]
- Du, M.; Li, F.; Zheng, G.; Srikumar, V. DeepLog: Anomaly Detection and Diagnosis from System Logs through Deep Learning. In Proceedings of the Proceedings of the 2017 ACM SIGSAC Conference on Computer and Communications Security, New York, NY, USA, 30 October–3 November 2017; pp. 1285–1298. [Google Scholar] [CrossRef]
- Meng, W.; Liu, Y.; Zhu, Y.; Zhang, S.; Pei, D.; Liu, Y.; Chen, Y.; Zhang, R.; Tao, S.; Sun, P.; et al. Loganomaly: Unsupervised detection of sequential and quantitative anomalies in unstructured logs. In Proceedings of the Proceedings of the 28th International Joint Conference on Artificial Intelligence, Macao, China, 10–16 August 2019; pp. 4739–4745. [Google Scholar]
- Yang, L.; Chen, J.; Wang, Z.; Wang, W.; Jiang, J.; Dong, X.; Zhang, W. Semi-Supervised Log-Based Anomaly Detection via Probabilistic Label Estimation. In Proceedings of the 2021 IEEE/ACM 43rd International Conference on Software Engineering (ICSE), Madrid, Spain, 22–30 May 2021; pp. 1448–1460. [Google Scholar] [CrossRef]
- Kubeflow Documentation. Available online: https://www.kubeflow.org/docs/ (accessed on 10 March 2025).
- ClearML Documentation. Available online: https://clear.ml/docs/latest/docs/ (accessed on 10 March 2025).
- Documentation. Available online: https://mlflow.org/docs/latest/index.html (accessed on 13 March 2025).
- Boyang, Y. MLOPS in a multicloud environment: Typical Network Topology. arXiv 2024, arXiv:2407.20494. [Google Scholar] [CrossRef]
- Scanning AI Production Pipeline—Neural Guard. Available online: https://clear.ml/blog/scanning-ai-production-pipeline-neural-guard (accessed on 10 March 2025).
- ClearML. ClearML Agent Documentation. Available online: https://github.com/allegroai/clearml-docs/blob/main/docs/clearml_agent.md (accessed on 10 March 2025).
- ClearML GitHub Repository. Available online: https://github.com/clearml/clearml (accessed on 10 March 2025).
- ClearML Agents and Queues Documentation. Available online: https://clear.ml/docs/latest/docs/fundamentals/agents_and_queues (accessed on 10 March 2025).
- Research Computing Services: Parallel Computing—Speedup Limitations. Available online: https://researchcomputingservices.github.io/parallel-computing/02-speedup-limitations/ (accessed on 10 March 2025).
- Chen, X.; Wu, Y.; Xu, L.; Xue, Y.; Li, J. Para-Snort: A Multi-Thread on Multi-Core IA Platform. In Proceedings of the IASTED International Conference on Parallel and Distributed Computing and Systems (PDCS), Cambridge, MA, USA, 2–4 November 2009. [Google Scholar]
- Bak, C.D.; Han, S.J. Efficient Scaling on GPU for Federated Learning in Kubernetes: A Reinforcement Learning Approach. In Proceedings of the 2024 International Technical Conference on Circuits/Systems, Computers, and Communications (ITC-CSCC), Okinawa, Japan, 2–5 July 2024; pp. 1–6. [Google Scholar] [CrossRef]
Disclaimer/Publisher’s Note: The statements, opinions and data contained in all publications are solely those of the individual author(s) and contributor(s) and not of MDPI and/or the editor(s). MDPI and/or the editor(s) disclaim responsibility for any injury to people or property resulting from any ideas, methods, instructions or products referred to in the content. |
© 2025 by the authors. Licensee MDPI, Basel, Switzerland. This article is an open access article distributed under the terms and conditions of the Creative Commons Attribution (CC BY) license (https://creativecommons.org/licenses/by/4.0/).