1. Introduction
Recent progress in scanning and printing technology, while beneficial to many aspects of human life, have led to various security challenges. These technologies have inadvertently facilitated the replication of codes, making them less expensive and easier to counterfeit and harder to detect, ultimately undermining efforts to ensure product authenticity. This challenge has directly contributed to financial losses. It has been reported that 5% to 8% of global sales of branded products experience huge losses due to duplication (
https://www.oecd.org/gov/risk/counterfeits-and-the-uk-economy.pdf (accessed on 1 August 2022)). Various technologies have been developed to detect counterfeits. Past works have focused on a range of solutions, including UV ink, holograms, and optical variable devices (OVDs). UV ink, applied to a product, remains invisible until it is exposed to ultraviolet light [
1]. Holograms, available in different designs and integrated into products, serve as unique identifiers to verify their authenticity [
2]. Likewise, OVDs, which exhibit altered appearances based on factors like rotation and tilting, have been extensively employed [
3]. However, these technologies are typically costly and require intricate construction processes.
Various products have employed 2D codes (such as QR codes and bar codes) embedded in products containing either public data or a specific URL linked to a product’s serial number. This solution is popular mostly due to its simplicity and affordability. However, these advantages come at a price: 2D codes are generally easier to duplicate or replicate. Researchers are actively investigating methods to develop a secure anti-counterfeit 2D code. Several security measures have been employed in these efforts, such as encryption, which involves converting plain text into an unreadable coded format that can only be deciphered with a decryption key. Watermarking is another technique used, where an invisible code is added to the image, making it challenging for counterfeiters to replicate the code accurately. Additionally, digital signatures are utilized, employing mathematical algorithms to verify the code’s authenticity and ensure it has not been tampered with. These measures aim to enhance the security and integrity of the 2D codes in order to combat counterfeiting.
The aim of this paper is to investigate copy-detection patterns (CDPs) attached to the 2D code [
4]. This CDP is generated using a combination of raw data embedded in the 2D code and a secret code stored in a server, ensuring the integrity of the CDP itself. Each time the 2D code is scanned and reprinted, some information within the CDP is lost, taking advantage of the image quality degradation. Despite great interest in the CDP technique, previous researchers utilized black-and-white elements (tiny black-and-white squares) in the CDP, which limited the sensitivity of the binary CDP to image quality degradation. This made it easier for counterfeiters to reproduce and counterfeit the code. The present study focuses on investigating the use of grayscale gradation elements in CDP images to address this limitation. The main contributions of this paper are as follows:
We provide a comprehensive examination of grayscale gradation in CDPs and utilize the distribution of grayscale histograms as a feature to assess the image quality degradation;
We investigate additional features in spatial and frequency domains using correlation and distance metrics;
We generate six datasets representing diverse environmental settings;
Finally, the performance of the proposed approach is compared to a recent and highly relevant paper, specifically the work in [
5].
The structure of the paper is outlined as follows. In
Section 2, we present a comprehensive review of previous studies focused on enhancing authenticity, with a particular emphasis on techniques such as the copy detection pattern (CDP) and watermarking. The experimental setup is described in
Section 3, followed by the presentation of the experiment’s results and a subsequent discussion in
Section 4. Finally, a summary of our work is provided in
Section 5.
2. Related Work
Several works aimed to improve the confidentiality and integrity of 2D codes. One example involved visual cryptography, as reported in [
6]. In this work, an image was divided into sub-images (transparencies). The sub-images did not contain any information, thus keeping confidentially. Another approach was proposed in [
7]. This approach makes use of the distance and angle variable between a QR code and its scanner to improve safety. Information from the code can only be retrieved once these variables match certain pre-defined values. The authors of [
8] performed a simple symmetric encryption. The key used for the encryption process was attached to the QR code.
In the case of a QR code, the authenticity measure of the code is more important than confidentiality, as the code is designed to provide public information, such as a public URL or a unique serial number of a product. To this end, some researchers have proposed techniques to detect duplication. For instance, some have developed methods to detect counterfeiting attacks where a copied QR code is affixed to a fake item, as if it is the original one [
9]. Examples of these works include CDP (copy detection pattern) methods, as reported in [
4], or a more recent version combining CDP and QR codes [
10,
11]. Another line of work focused on employing the watermarking technique [
12]. The principle of this technique is that the print-and-scan process creates pixel divergence and geometric distortion.
Various aspects of the CDP technique have been explored. For example, evaluation features have been used to measure the efficiency of restoring algorithms. Recently, Zhang et al. [
13] proposed new features, denoted as the ‘486 feature-type’, extracted from a CDP image. This showed superior performance compared to existing features, such as, entropy, wavelet domain sharpness, prediction error metric, Fourier domain sharpness, and the features outlined in [
14]. The evaluation and comparison of these features were conducted using five restoration algorithms, including constrained least squares filtering, Wiener filtering, the filter method, the Lucy–Richardson algorithm, and the smart sharpen filter in Photoshop. These algorithms act as an “attack” to the CDP by making the fraudulent CDP indistinguishable from the authentic one. Each algorithm was evaluated using each of the five metrics, resulting in an error rate for each attack–metric pair. The 486 feature-type exhibited the lowest error rate across all attack methods, except for constrained least squares filtering and Wiener filtering. The authors developed a novel classifier based on the support vector domain description (SVDD) and evaluated its performance using the 486 features. The performance was evaluated based on three aspects: the false positive to positive sample ratio (FR), the false negative to negative sample ratio (FA), and the error rate (PE). The proposed SVDD classifier attained an FR of 16.67%, an FA of 6.85%, and a PE of 7.15% when using all 486 features. When using only 15 selected features, the classifier attained an FA of 8.54%, an FR of 6.67%, and a PE of 8.48%.
In another recent work, Chaban et al. compared two estimation methods, i.e., a binarization method based on Otsu’s adaptive thresholding and a template estimation, which was developed using the LDA algorithm [
15]. The Hamming distance for binary images (HAMMING), structural similarity index (SSIM), Jaccard index (JACCARD), and normalized cross-correlation (CORR) similarity metrics were used to assess the effectiveness of those procedures. The test was carried out across a variety of code densities in order to more accurately reflect the method’s overall performance. A dataset’s density was used with lower and higher entropy values. The actual dataset was produced using two sets of print-and-scan equipment. The proposed estimation achieved probabilities of 6.17% and 7.57% for the dataset with the maximum density tested (50%) using the Hamming distance. The results were less than the two baseline approaches, i.e., the LDA method’s 15.24% and 16.34% and the Otsu method’s 18.13% and 20.01%. In order to attain the desired performance, the authors evaluated the efficacy of the proposed approach through metric pairing. In this experiment, the HAMMING and SSIM techniques emerged as the top performers, registering the lowest miss and FA rates at 5.05% and 6.88%, respectively.
Khermaza et al. collected the CDP dataset, containing a digital template, original P&S, and fake CDP [
5]. An experiment with several different types of data choices was performed. The data choices included the printed unique CDP (consisting of 5000 original CDPs, their templates, and 10,000 copies) and the printed CDP per batch (consisting of 2500 original CDPs, their templates, and 10,000 copies). The authors utilized a normalized cross-correlation score as a feature and neural networks as classifiers with various architectures. The original images were split into patches measuring 13 × 13. Two architectures were proposed. The first one employed a fully connected layer consisting of two, three, and four hidden layers, respectively, where the size of each layer was set to be the input size (169). The second architecture employed a bottleneck DNN (BN DNN) model using two fully connected hidden layers of 128 and 64 dimensions, respectively, at the encoder and decoder parts, and leveraged a latent representation of size 32. These architectures were based on an earlier work by Taran et al. [
16]. The training parameters were set at 25 epochs with a batch size of 128. The activation function, the loss function, and the optimizer employed were ReLu, MSE (mean squared error), and Adam [
17], with a learning rate of
, respectively. The best-performing method, having the lowest BER percentage, was shown to be the BN DNN method. It produced a mean BER of 23.27% for unique estimation attacks and 18.47% for batch estimation attacks.
Taran et al. regenerated original digital codes from printed ones by utilizing deep neural networks [
16]. The neural network models learned digital codes and printed codes in the training phase. The models then generated estimated binary codes via a simple thresholding method. The estimated code was then printed and scanned on the corresponding equipment. To determine the authenticity of the code, the Pearson correlation and normalized Hamming distance were utilized. The findings demonstrated that the integration of modern machine learning technologies in the system made it more challenging for defenders to detect fakes. Taran et al., in their recent publication, examined the effectiveness of QR code authentication in real-life conditions using mobile phones [
18]. To simulate real-life conditions, they printed the digital codes and captured images of the printed codes using a mobile phone with automatic settings. The phone was positioned parallel to the printed code at a distance of 11 cm. To create counterfeit copies, two standard copy machines were used on white and gray papers. The fake images were acquired in the same environment and with the same settings. The authors then employed machine learning techniques to authenticate the original codes and the counterfeits. The findings indicate that the classifier demonstrated a high level of accuracy when distinguishing between the original codes and the counterfeits, with a classification error of approximately 0.28%. Further, the classifier was capable of distinguishing fakes from different copy machines, but the study encountered a limitation in effectively distinguishing between counterfeit codes printed on white paper and those printed on gray paper.
The summarized works are presented in
Table 1. The authors’ primary objective was to differentiate between original and fake codes generated by a simple duplication or by predicting original templates through image processing or machine learning approaches. To differentiate counterfeit codes, a common thresholding approach was employed to normalized correlation measures like the Pearson correlation. In this research, additional features were introduced in both the spatial and frequency domains. Moreover, by exploring grayscale gradation in watermark images, changes in grayscale histogram distribution were utilized as indicators of counterfeit codes. Multiple machine learning techniques were implemented and validated using six distinct datasets collected from diverse sources. Lastly, a comparison was made between the proposed technique and the approach suggested by Khermaza et al. [
5].
3. Methodology
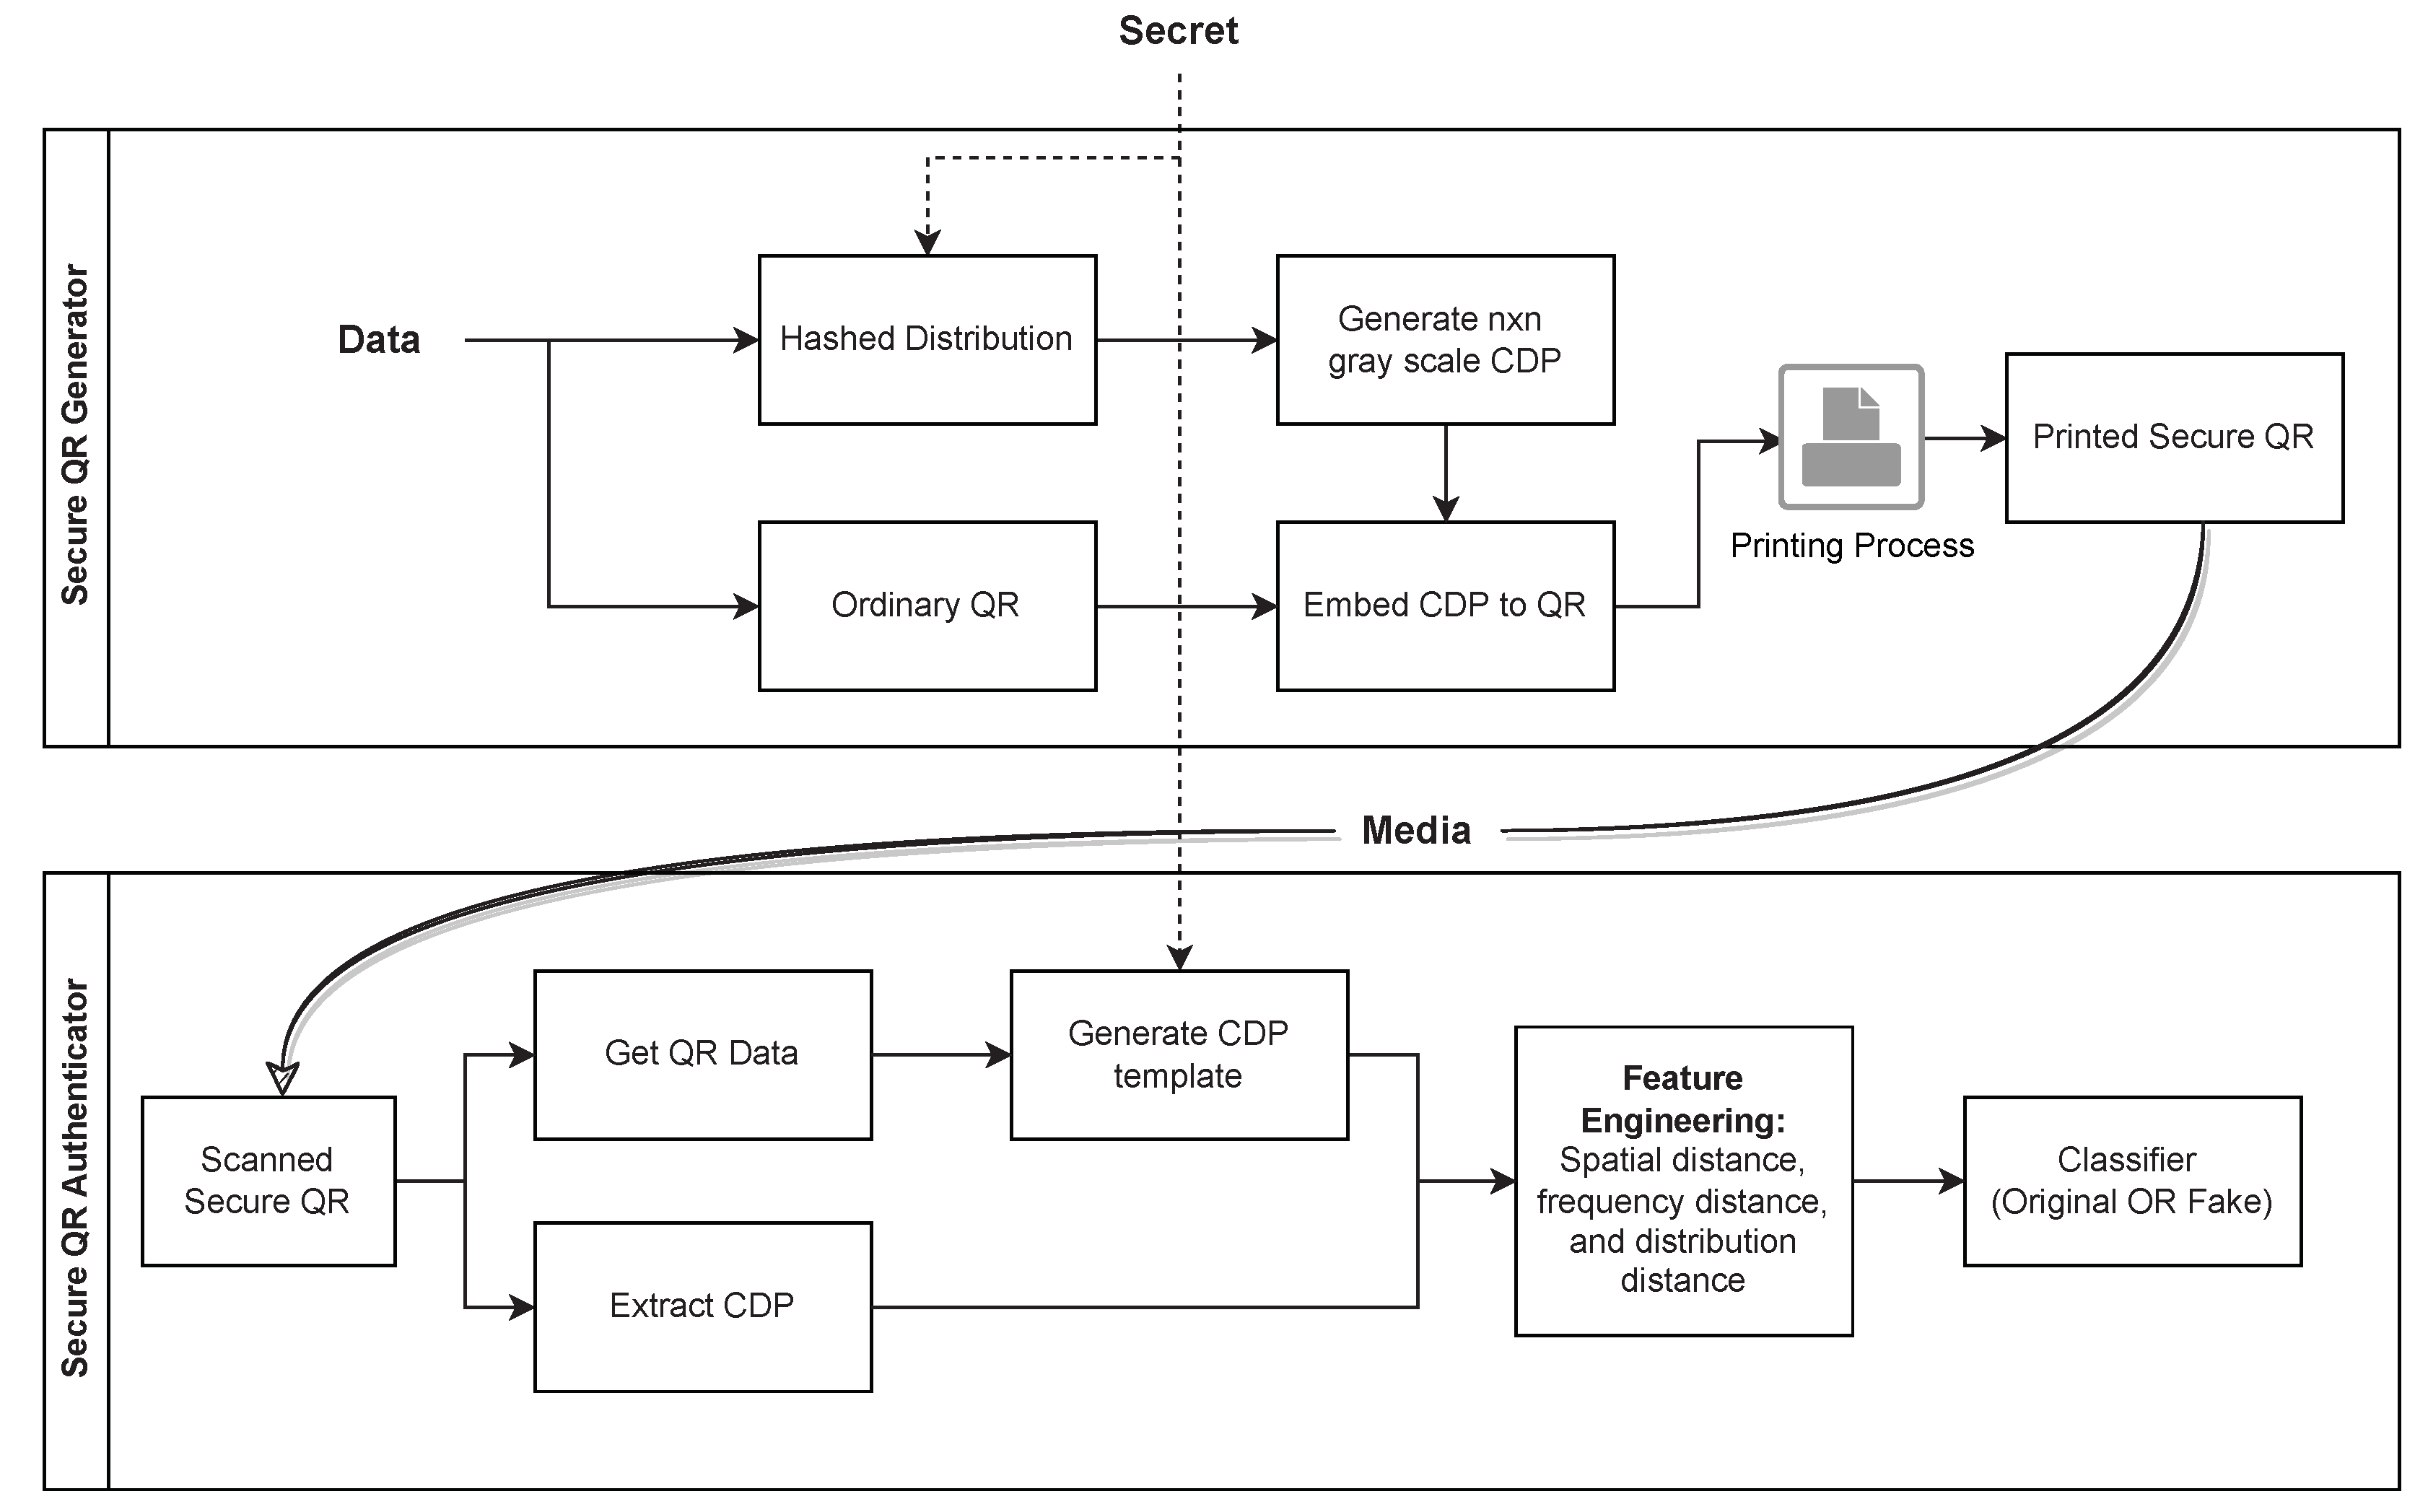
In this section, we discuss the proposed 2D secure code approach to prevent counterfeiting. The system consists of a SQR generator and authenticator, as shown in
Figure 1.
3.1. Secure QR Generator
The proposed secure QR (SQR) code is based on a CDP. The CDP is a pseudo-random digital image that contains high-frequency information, embedded in the QR code for counterfeit detection.
To construct CDP, we initially computed grayscale distribution based on QR data and a secret. While the QR data are public data stored in the 2D code, the secret is a private key stored in a central server. Thus, we generate a multinomial distribution
and its gray-level values
, where L is the quantization number determined by a hashing function. We opted for an
level grayscale quantization because a two-level intensity is deemed insufficiently secure against estimation attacks, as reported in [
5]. We generate
CDP, such that
where
is the intensity level of the
i-th row and
j-th column. A static random number generator (RNG) in (
1) is used to ensure that the unique generation of the hashing function results in the same CDP every time it is generated for a given set of
d and
s values, which corresponds to the data and secret respectively. Finally, the generated CDP is embedded into the SQR code and is ready to attach to a product. In our case, the CDP is generated with a size of
and a symbol size
, printed on 0.14 mm for each symbol.
3.2. Dataset
We collected six datasets, each possessing unique characteristics based on the used P&S devices, such as the camera type, printer type, and lighting conditions. We invited six volunteers to print and capture our generated QR codes as original sets. We then asked them to reprint the sets and recapture them to create fake copies. These datasets were subsequently loaded into our detector. The summary of our dataset is shown in
Table 2.
The datasets were collected under various environmental settings, resulting in variations in quality and style due to different devices and lighting conditions. The SQR data for the original and copied images in each dataset are presented in
Table 3. Dataset 1, dataset 3, and dataset 6 demonstrate a higher degree of consistency in terms of the lighting quality between the original and copy SQR images, where the intensity differences are smaller. Moreover, dataset 1 and dataset 6 exhibit higher levels of lighting compared to the other datasets, with the mean intensity of the whitespace border approaching a value of 255.
To assess the performance of the proposed method, 10-fold cross-validation is performed on each dataset. Finally, all datasets are combined into a single dataset and evaluated using the same procedure as the individual sets of data.
3.3. Secure QR Authenticator
Given a product with SQR, one may authenticate it by scanning the code. As the sizes of the scans may be different, scaling and resizing might be needed. The authenticator then extracts CDP and generates the CDP template based on the QR data (d) and secret key (s). This approach enhances the challenge for potential attackers attempting to forge counterfeit CDPs, as the template will differ for every unit item or product even with the same type of product, contingent on the QR data (i.e., serial number of the unit). The authenticator then extracts several features and classifies the code to show the originality states.
3.3.1. Scaling Methods
The scanned CDP and template are resized to the same dimensions so that the features can be measured. The original resolution of the CDP template is pixels. This template is resized to be four times bigger, reaching pixels. As the resolution of the scanned QR code (and the scanned CDP, correspondingly) might be different, we resize the scanned CDP to the same size as the scaled CDP template. The resized factors are different depending on the scanner or camera resolution.
Furthermore, since we encompass eight distinct gray intensity levels, it is necessary to estimate or generate intermediate gray-level values by considering the existing values of adjacent pixels when we scale the image. To achieve this, we employ both linear and non-linear interpolation techniques. In the former, we estimate the gray value between two given data points by projecting the values equidistantly between them, while in the latter, we interpolate the gray value between two known data points by assuming that the interpolation follows a polynomial function of degree 3.
3.3.2. Watermark localization
The watermark is placed in the center of a QR code. Thus, we need to extract the watermark from the image using the localization technique. In practice, the SQR image is not always aligned horizontally or vertically, it could be subject to rotation or affine transformations due to camera variations.
A four-point homography transformation is employed to align the QR image, ensuring it maintains a perfect square dimension. The homography transformation is described as the following equation,
where
represents the transformed coordinates and
represents the original coordinates. The homography matrix is denoted by
and has the following form:
To compute the homography matrix, we need to solve a system of equations using the four corresponding points in the original and transformed coordinate systems [
19]. After the transformation, the extraction of the watermark is straightforward due to its central positioning within the image, with its dimensions being proportionate to the QR code’s size, as depicted in
Figure 2. We utilize the OpenCV library to implement this transformation with its default interpolation technique, i.e., linear interpolation.
3.3.3. Feature Engineering
We utilize three feature representations of the CDP images: the spatial domain, frequency domain, and the grayscale distribution. An image can be represented in both the spatial and frequency domains. The spatial domain refers to the actual pixel values of an image, where each pixel is assigned a specific intensity value. On the other hand, the frequency domain represents the image in terms of its frequency components. This representation transforms the image from the spatial domain to the frequency domain using techniques such as the Fourier transform. In our case, discrete cosine transform (DCT) is used. The result involves a set of coefficients, describing the image’s frequencies. In the frequency domain, low-frequency components represent the image’s general structure and large-scale features, while high-frequency components represent fine details and small-scale structures. Analyzing an image in the frequency domain makes it possible to identify patterns and features that are not easily noticeable in the spatial domain representation. Specifically, the high frequency pertains to the existence of swiftly changing or fluctuating pixel values within the image. Within the DCT, high-frequency elements symbolize intricate details like distinct or sharp edges, textures, or swift pixel-intensity transitions in the image. On the other hand, lower frequencies depict the image’s general structure or gradual variations. As shown by Schulze et al. [
20], photocopied images and the first printing show different representations in the frequency domain. Such a representation offers superior performance in detecting copied documents compared to spatial features.
The grayscale distribution of an image refers to the distribution of gray-level values or pixel intensities in an image. In a grayscale image, each pixel is assigned an intensity value ranging from 0 (black) to 255 (white), with intermediate values representing shades of gray. The grayscale distribution of an image describes the distribution of these intensity values across the entire image.
The grayscale distribution can be visualized using a histogram, which is a graph that shows the frequency of occurrence of each intensity value in the image. The histogram of a grayscale image typically has a bell-shaped curve that reflects the most common intensity values in the image. The shape of the histogram can reveal information about the image’s contrast, brightness, and overall tonality. When a document is copied, the details will be degraded and the images will be visually blurred. As a result, the grayscale distribution will also be affected. Lim et al. [
21] illustrated the difference in the histogram distribution between blurred and sharpened images, demonstrating that the histogram can detect texture loss in an image.
This study incorporates multiple distance metrics to assess the similarity between extracted features from a sample and a reference template for each feature representation (i.e., histogram, and spatial and frequency domains). Four distance metrics, namely Euclidean distance, Cosine distance, Canberra distance, and correlation distance, are utilized. In addition, normalized cross-correlation is also employed, as described in [
22]. The classifier is then supplied with a total of 13 distance metrics, which encompass the 12 different distance metrics derived from 3 domains, along with the normalized cross-correlation.
3.3.4. Machine Learning Authenticator
The gradient boosting classifier is a widely adopted and powerful machine learning algorithm that excels at handling complex and non-linear problems, such as a classifier [
23]. By aggregating multiple weak models into a single strong model, it has the ability to effectively deal with multiple features and the intricate relationships among them, resulting in superior authentication performance. Additionally, the algorithm can manage noisy or irrelevant features, reducing the likelihood of overfitting and guaranteeing good generalization performance. These attributes make gradient boosting an ideal candidate for use as an authenticator in this study. Furthermore, our preliminary experiments on the CDP dataset demonstrated that gradient boosting is more stable than logistic regression and support vector machines (SVMs) in terms of performance.
In this study, we use the gradient boosting classifier with 100 estimators and a maximum depth of 1, creating an ensemble of 100 decision trees, where each tree has a maximum depth of 1. It starts by training the first tree on the data and updating weights based on prediction errors. Then, subsequent trees are trained to focus on the previously misclassified examples. The final prediction is made by aggregating the predictions of all the trees. This approach gradually learns complex patterns by combining multiple simple trees. The input consists of 13 features and the output classifies the CDP as either original or fake.
3.4. Metrics
The machine learning models are evaluated in terms of five metrics, namely, accuracy, precision, recall, F1 score, and specificity. These metrics are used to calculate the model performance based on 10-fold cross-validation results. Specifically, the model is trained on nine folds and tested on the remaining fold. This process is repeated 10 times, each time using a different fold as the testing set, and the results are averaged to obtain the final evaluation of the model.
3.4.1. Accuracy
The accuracy measures the number of predictions of original and fake QR codes that are correct as a percentage of the total number of predictions that are made.
3.4.2. Precision
The precision in detecting the original QR code is defined as the ratio of true positives (real original QR codes correctly identified) to the total number of QR codes classified as original. The
is defined as
3.4.3. Recall
The recall—in regard to detecting the original QR code—is defined as the ratio of true positives (original QR codes correctly identified) to the total number of actual original QR codes, regardless of whether they were detected as original or fake.
is defined as
3.4.4. Score
The
score is the harmonic mean of precision and recall with an equal weight.
3.4.5. Specificity
The specificity in detecting a fake QR code is defined as the ratio of the fake/copied QR code that is identified correctly (true negative) over the whole fake/copied QR codes, detected as fake or original QR codes. The
is defined as
4. Results and Discussion
We use the approach proposed by Khermaza et al. as a baseline for comparison in counterfeit detection [
5]. Thus, we present our proposed approach on the same datasets to assess its improvements.
4.1. Baseline
We adopt the single-feature cross-correlation technique introduced in [
5,
22]. Additionally, we investigate the effects of interpolation methods on the authentication performance.
Table 4 shows the experimental results, bold typeface indicates the a particular interpolation method is better. The ’all’ dataset row represents the results of the combined six datasets. In the baseline scenario, neither the linear nor third-degree polynomial interpolation shows significant enhancement in performance. Both methods yield a mere 2% difference, suggesting that neither scaling method demonstrates superiority when considering a single feature.
When considering counterfeit detection using a single feature, we can expect an accuracy range between 49% and 57% and an F1 score range between 48% and 65%. The dataset with the poorest performance is dataset 1, while dataset 2 exhibits the best performance in this setup. These discrepancies can primarily be attributed to the quality of the replicated data. As outlined in
Section 3.2, dataset 1 is collected under consistent lighting conditions, resulting in minimal visual variations between the original and copied SQR images (i.e., an intensity difference of 0.2). In contrast, the original and copied images in dataset 2 possess some degree of visual distinctiveness (i.e., an intensity difference of 13.0), resulting in improved classification outcomes. A similar pattern is observed in dataset 4, where the original and copied images exhibit visual distinctiveness (i.e., an intensity difference of 18.0). The variation in visual characteristics likely influences the differences in performance when detecting counterfeits in this dataset
Upon closer examination of dataset 2, it is apparent that the specificity is below 38%, whereas the F1 score reaches 65.90%. This outcome indicates a deficiency in the capability to detect counterfeit QR codes within the dataset. One potential explanation for this is that the single-feature cross-correlation approach is unable to differentiate between copied and fake QR codes, even when dealing with a dataset containing substantial intensity differences between the original and copied codes, as seen in dataset 2. Consequently, there is a notable occurrence of false positive detections (identifying false original QR codes) and a low detection rate for true negatives.
4.2. Multiple Features
The incorporation of multiple features has been proven to significantly improve the performance of authentication systems, as illustrated in
Table 5. Using the linear interpolation scaling method, the accuracy of the authentication system varies between 83% and 99%. Notably, when dealing with visually distinct data with intensity differences of more than 10, such as datasets 2, 4, and 5, the system exhibits excellent detection of original and copied QR codes, achieving F-measure scores of up to 99%. For the other three datasets, the system achieves a minimum F-measure of 83%. These positive results are also evident in the specificity metric, demonstrating the effectiveness of the proposed features in identifying original QR codes and minimizing the false detection of original QR codes.
Although the individual sets of data demonstrate high levels of accuracy, F-measure, and specificity, the same measures in the combined dataset (i.e., ’all’ datasets) decline to 77.88%, 78.05%, and 75.55%, respectively, due to the presence of diverse variations and styles across the datasets. Consequently, developing a model specifically tailored to a particular dataset or a specific P&S (print and scan) device yields better performance compared to a model trained on multiple datasets simultaneously. However, in certain cases, such as in supply chain management, it may be challenging to build separate anti-counterfeit models for each dataset or device, as multiple individuals are involved in the business process.
In addition to the proposal of incorporating more features, it is noteworthy that the linear interpolation method consistently outperforms the third-order polynomial interpolation scaling method across all evaluation metrics. This finding could be attributed to the fact that the higher-order polynomial interpolation method alters the curvature of high-frequency data, resulting in a smoother signal compared to the linear interpolation method. Further research is necessary to fully understand these implications and explore the potential for optimizing the performance of authentication systems through advanced interpolation methods.
5. Conclusions
Our study examined the effectiveness of different approaches in detecting counterfeit items by utilizing both single and multiple features. When focusing on a single feature, we observed accuracy ranging from 49% to 57% and F1 scores ranging from 48% to 65%. However, when incorporating multiple features, we observed a substantial improvement in the performance of the authentication system, with accuracy ranging from 84% to 99% and F1 scores ranging from 83% to 99%. These enhancements can be attributed to the effectiveness of the proposed features, specifically the utilization of grayscale distribution and image frequency, which significantly contribute to the classification process. It is worth noting that selecting appropriate interpolation methods in counterfeit detection systems may improve the performance of counterfeit detection. In our cases, linear interpolation mostly outperforms the third-order polynomial interpolation.
The classification performance in counterfeit detection is significantly influenced by the quality of the original and copied dataset. When the original and fake images are more similar, the classification process becomes more challenging. Dataset 2 consistently demonstrates the best performance, likely due to the visual distinctiveness between the original and copied images. Conversely, dataset 1 demonstrates the poorest performance, attributed to consistent lighting conditions that result in minimal visual variations.
While developing a model specifically tailored to a particular dataset yields superior performance, it may not always be practical in operational scenarios where images are captured by multiple individuals under various conditions. Our work demonstrates that a combined dataset (’all’ datasets) consisting of approximately 2000 QR images achieves an F-measure of 78% and a specificity of 75.55%.
In summary, our study highlights the importance of dataset quality, the impact of interpolation methods, and the effectiveness of multiple features in the spatial domain, frequency domain, and grayscale distribution. These findings contribute to the understanding and improvement of counterfeit detection systems. In future works, we will explore more advanced testing methods, including the use of post-processing techniques like visual enhancement or machine learning to generate fake images after reprinting; moreover, we will assess whether modifications to the proposed secure QR codes are necessary.


 ,
, 


