You are currently viewing a new version of our website. To view the old version click .
Computers
  • Editor’s Choice
  • Article
  • Open Access

27 October 2023

BigDaM: Efficient Big Data Management and Interoperability Middleware for Seaports as Critical Infrastructures

,
,
,
,
,
,
and
1
School of Electrical and Computer Engineering, National Technical University of Athens, 15773 Athens, Greece
2
Department of Communications, Universitat Politécnica de Valéncia, 46022 Valencia, Spain
3
IT Innovation Center OTE Group, 15124 Marousi, Greece
*
Authors to whom correspondence should be addressed.

Abstract

Over the last few years, the European Union (EU) has placed significant emphasis on the interoperability of critical infrastructures (CIs). One of the main CI transportation infrastructures are ports. The control systems managing such infrastructures are constantly evolving and handle diverse sets of people, data, and processes. Additionally, interdependencies among different infrastructures can lead to discrepancies in data models that propagate and intensify across interconnected systems. This article introduces “BigDaM”, a Big Data Management framework for critical infrastructures. It is a cutting-edge data model that adheres to the latest technological standards and aims to consolidate APIs and services within highly complex CI infrastructures. Our approach takes a bottom-up perspective, treating each service interconnection as an autonomous entity that must align with the proposed common vocabulary and data model. By injecting strict guidelines into the service/component development’s lifecycle, we explicitly promote interoperability among the services within critical infrastructure ecosystems. This approach facilitates the exchange and reuse of data from a shared repository among developers, small and medium-sized enterprises (SMEs), and large vendors. Business challenges have also been taken into account, in order to link the generated data assets of CIs with the business world. The complete framework has been tested in the main EU ports, part of the transportation sector of CIs. Performance evaluation and the aforementioned testing is also being analyzed, highlighting the capabilities of the proposed approach.

1. Introduction

Critical infrastructures (CIs) are systems, networks, and assets that are essential for the functioning of a society and its various sectors. They encompass sectors such as energy, transportation, water, communications, emergency services, financial services, healthcare, food and agriculture, government facilities, and information technology [1]. These infrastructures provide crucial services, and their disruption can have severe consequences [2]. It is safe to characterize critical infrastructures as the main cornerstones of the global economy. In terms of data production, critical infrastructures generate vast volumes of data on a daily basis. These data include information related to operations, monitoring, maintenance, security, and various other aspects. With the increasing digitization and interconnectedness of these infrastructures, the volume of data being generated continues to grow exponentially. Managing and leveraging these data effectively is crucial for optimizing operations, enhancing security, and making informed decisions to ensure the resilience and reliability of critical infrastructures.
To ensure proper management and handling of data volumes generated within the CI industry, there is a need to incorporate data-driven intelligence. This involves the aggregation of diverse data from the infrastructure itself and various stakeholders involved in its operations. Several CI domains present an extensive range of data sources, as seen in Figure 1. Such domains are the port infrastructures, part of the CI transportation sector. Additionally, with the emergence of Internet of Things (IoT) technology, there is a rapid adoption of smart logistics mechanisms and sensing systems within CI premises, resulting in the generation of large volumes of data. These data encompass a wide range of information, involving various communication, sensor systems, and control technologies. They facilitate real-time decision-making and information sharing among different stakeholders throughout the CI supply chain. Moreover, CI data collection occurs through various methods and is stored in different formats, with the harvested data being structured, semi-structured, or unstructured. Given the fact that there are sixteen different critical infrastructure sectors, one can easily comprehend the magnitude of the data being generated. Such big data have to be safeguarded and handled properly.
Figure 1. The 16 critical infrastructure sectors of global industry and economy [3].
However, several challenges of general big data management and analysis have to be taken into consideration before conducting research on CI-related big data solutions. Analyzing big data presents challenges that researchers and practitioners must address to derive meaningful insights and make data-driven decisions. These challenges can be broadly categorized into various aspects of data collection, storage, processing, analysis, and interpretation. Here is an analysis and listing of the main challenges in big data management and analysis:
  • Volume, Velocity, Variety, Veracity, and Value: Also known as the famous “5 Vs” of big data. Regarding Volume, big data sets are characterized by their sheer size, often comprising terabytes, petabytes, or even exabytes of data. Storing and processing such vast amounts of data can strain computing resources and require specialized infrastructure. As for Velocity, data are generated at an unprecedented speed, especially in fields like IoT (Internet of Things) and social media. Real-time or near-real-time analysis of streaming data can be challenging, as it requires low-latency processing capabilities. For Variety, big data is diverse and can come in various formats, such as structured, semi-structured, and unstructured data. This variety includes text, images, videos, sensor data, and more. Integrating and analyzing data from different sources and formats can be complex. Regarding Veracity, data quality and reliability can be questionable in big data. Inaccurate or incomplete data can lead to erroneous conclusions. Cleaning and validating data to ensure accuracy is a significant challenge. And as for Value, despite the vast amount of data available, extracting valuable insights is not guaranteed. Finding meaningful patterns, trends, and correlations often requires advanced analytics techniques, including machine learning and data mining.
  • Data Management and Infrastructure Challenges: Dealing with the exponential growth in data volume and ensuring systems can scale efficiently. Managing computational resources, such as CPU, memory, and storage, is complex and requires careful optimization. Efficiently storing, indexing, and retrieving data in distributed storage systems, especially with large-scale data, presents significant challenges. Balancing the performance requirements of big data analysis with the associated infrastructure costs is an ongoing concern.
  • Data Integration and Processing Challenges: Implementing and fine-tuning sophisticated algorithms and models for analyzing big data can be challenging, demanding expertise in machine learning, statistics, and data science. Combining data from diverse sources, each with its own structure and format, requires robust data integration tools and techniques. Gaining meaningful insights from large and complex datasets through data exploration and visualization is a complex task. Ensuring that different tools and systems used in big data analysis can work together seamlessly is a constant challenge.
  • Data Security, Ethics, and Governance Challenges: Storing and processing sensitive data in big data systems can pose significant security and privacy risks, requiring measures to ensure data confidentiality, integrity, and regulatory compliance (e.g., GDPR). Addressing ethical and legal concerns surrounding data analysis, such as data privacy, algorithmic bias, and responsible data usage, is crucial. Establishing robust data governance policies and practices is essential for maintaining data quality, security, and compliance. Additionally, overcoming the shortage of skilled data scientists and analysts who can work effectively with big data remains a significant challenge.
  • Environmental and Long-term Challenges: The energy consumption of large-scale data centers and computing resources used for big data analysis can have a significant environmental impact, making sustainability an important concern. Archiving and preserving big data for future analysis can be challenging, especially given rapidly evolving technologies and data formats, requiring long-term data preservation strategies and solutions.
Addressing these challenges requires a multidisciplinary approach involving computer science, data engineering, domain expertise, and collaboration across various stakeholders. As technology continues to evolve, new challenges may emerge, making it essential for researchers and practitioners to stay updated and adapt to the evolving landscape of big data analysis.
Based on the challenges of big data analysis, in order to grasp how massive the data volumes produced by critical infrastructures are, let us provide some examples. In the sector of energy, the power grid in the United States alone is used to generate about 100 to 1000 petabytes of data per year [4,5]. On a global scale, the energy sector generates a massive amount of data, with estimates ranging from 100 to 200 exabytes per year [6]. Energy-related data includes information on power generation, transmission, and distribution. It also includes data on weather conditions, equipment status, and customer usage patterns. Apart from the energy sector, the transportation systems sector generates several petabytes of data per year [7,8]. These data include information on traffic flow, vehicle emissions, and passenger travel patterns. The same goes for the telecommunications sector, whose data include information on call records, text messages, and internet usage [9]. The amount of data generated by critical infrastructures is only going to increase in the future. This is due to the increasing use of sensors, smart devices, and other connected technologies (like IoT devices mentioned before). As these technologies become more widespread, they will generate even more data that can be used to improve the efficiency and security of critical infrastructures.
The handling of large data volumes in critical infrastructures is essential for ensuring the security and resilience of these infrastructures. By collecting, storing, and analyzing large amounts of data, critical infrastructures can improve their operational efficiency, identify and mitigate risks, and respond to incidents more effectively. Applying big data techniques to process such a vast amount of data has the potential to equip critical infrastructures with essential tools for automating decision processes and managing job queues efficiently. By leveraging these techniques, many tasks within the CI workflow could become easier. For example, given a specific CI sector, the ability to incorporate not only operational data but also global data from various actors across its value chain could be a crucial factor in its growth and expansion as an industry element. As of today, no CI-oriented big data management framework has been proposed. The scientific literature lacks a solution that provides big data harmonization, interoperability, processing, filtering, cleaning, and storing, for data that come from critical infrastructure sectors. Several big data management systems have been published, but none combine management with harmonization and interoperability and have been specifically tested with CI-related data. This reality motivated the current research team to implement a new proposal, which aims to unlock the latent power of existing data derived from CI operations, leading to optimal resource and infrastructure utilization.
This research paper is organized to begin by presenting a critical infrastructure (CI) data management proposal. After that, it comprises seven main sections: “Related Work” provides context by reviewing existing research, “Business Model and Services” outlines economic and functional aspects, “Data Model and Interoperability” and “Data Processing and Virtualization” explore system architecture, “Performance Evaluation and Results” present key insights and results from the proposed framework’s testing, and “Conclusions” summarizes the paper, including future prospects.

2. CI Data Management Proposal

Despite the promising possibilities mentioned at the end of the Introduction section (Section 1), the current reality falls short of fully realizing this potential due to challenges related to data interoperability and efficient data management. The lack of seamless data integration hampers the adoption of data-driven solutions in CI production environments. This reason is the main motivation for the research conducted and presented in this article, as also mentioned at the end of the Introduction (Section 1). The gap between proper big data handling and their utilization by both CIs (from which they are generated) and external beneficiaries can be bridged by BigDaM, this journal’s proposal. It stands for the “Big Data Management” framework, and it is specialized to critical infrastructures. Conceptually, it is a middleware framework, consisting of a “Data Model and Interoperability” layer, as well as a “Data Processing and Virtualization” layer. BigDaM aims to relieve CIs from the time-consuming task of properly and wholly managing the data generated. Its development and implementation is the continuation of a previous work published as a paper in 2022 by the same authoring team [10]. The model proposed was based on the use case of smart ports (and therefore the CI transportation sector, in which ports belong to), studied within the context of DataPorts European Research Project [11]. This article expands the original approach and applies new improvements to the framework. It provides an in-depth analysis of the framework’s operation and evaluates its performance through thorough testing.
BigDaM can prove to be a vital assistant to CI sectors. It consists of two main layers, named “Interoperability” and “Data Processing and Virtualization”. The Interoperability layer enhances data interoperability, while the Data Processing and Virtualization layer implements proper data management practices for the incoming data. Thus, BigDaM can bring about significant positive impacts on critical infrastructures. By enabling seamless exchange and integration of data across different systems and components, CIs can achieve enhanced operational efficiency, real-time monitoring, and predictive maintenance capabilities. With improved interoperability, these infrastructures can optimize resource allocation, streamline decision-making processes, and ensure better coordination among various elements. Moreover, effective data management safeguards against data loss, cybersecurity threats, and system failures, bolstering overall reliability and resilience. Ultimately, these advancements foster safer, more sustainable, and cost-effective operations, empowering critical infrastructures to meet the ever-evolving demands of modern society while minimizing disruptions and ensuring continuity.
Additionally, BigDaM can augment the beneficiaries of the data generated by CIs, as stated before. This is why BigDaM has significant soundness in the business industry as well. Potential advantages of enhancing data interoperability and proper management extend beyond economic benefits for CI authorities. Various stakeholders can benefit from this improved data exchange, leading to service enhancements. Notably, telecommunications operators, harnessing their substantial data resources, play a vital role in this burgeoning data-driven market. By offering data or services via APIs, they furnish valuable insights for informed decision-making to external stakeholders, including public authorities, municipalities, shipping companies, transportation authorities, cultural and trade associations, and others. In a few words, data generated from one CI sector can be used by beneficiaries of another CI sector, creating a multi-CI network of dataflows. Nonetheless, integrating data streams from diverse sources can present challenges, thereby magnifying the overall benefit of achieving successful data interoperability.

4. Business Model and Services

Let us imagine the following scenario: On the day of their travel, passengers will utilize a mobile application that provides real-time information about the most optimal route to reach their local airport (one of the CIs main sectors) and catch their scheduled flight. By implementing this framework, the passenger flow can be orchestrated in an efficient manner, ensuring smooth boarding experiences. To make this scenario a reality, the system relies on both historical and real-time data available in the mobile application, as well as web services. This data-driven service can benefit various external stakeholders, some of whom might not have any prior affiliation with the airlines’ community. In Figure 2 above, some of these stakeholders are listed alongside the potential benefits they can receive from such data-driven services.
Figure 2. Potential beneficiaries by the data generated in ports, the transportation sector of CIs [10].
It is essential to understand that the dynamic business models will create value both for data providers and the data/service users. Figure 3 depicts the offerings of the services described in the scenario above through a Pains vs. Gains business model canvas from the data seller and the data user perspective. As already mentioned, several external stakeholders might be beneficiaries of such data-driven services. Some of them are without any previous relation with the shipping ports community.
Figure 3. Value proposition (Gains vs. Pains) for data sellers and users.
Five brief examples of stakeholder/benefit pairs are as follows:
  • The data consumer category may be interested in data and also have the ability to provide data. Cargo, transport, and logistics companies are highly interested in people’s and trucks’ mobility information. A road traffic optimization will lead to more efficient routing of cargo transferring and lead to a revenue increase. Such a category of data consumers may benefit not only by using data and services, but also benefit by offering their data in terms of transferring routes, container volumes, etc. This will result in even optimized traffic conditions. This is one case where the data consumer can be considered also as a data producer.
  • The research community and academia are in many cases the birthplace of new innovative services and algorithms. Therefore, their interest in using large volumes of data that are accurate, secured, and up to date, for them to train their algorithms and create AI-based services, positions them in a significant data consumer category. The services that may be produced by using the scenario’s available datasets could be offered as a service to a data-driven platform. This is also a case where the data consumer can be also considered as a data producer.
  • Universities is a category that can be combined with the research communities in terms of data available for research, obtained by the aforementioned scenario. These institutions can benefit from the use of the data and increase/improve their research exposure and additionally offer data in terms of data streams of their online courses in the aviation industry, logistics, etc. Once again, this is a case where the data consumer can be considered also as a data producer.
  • Startups and SMEs are considered among the highly developed innovators. They develop services by creating and using algorithms based on data availability. The number of startups and SMEs that are related to the aviation industry has rapidly increased over the last few years; therefore, the need to feed these companies with datasets will not only increase the revenue of the data providers but also create new innovative services that will be based on these datasets. Moreover, startups and SMEs are in pursuit of new markets to make an entrance and try to sell their products/services. Once more, this is a case where the data consumer can be considered also as a data producer.
  • Public Authorities in any form are always aiming to improve the services offered to the citizens and also improve their quality of file. In order to achieve this, they need information given by available data. In almost every subcategory of public authorities, the information that is most needed is the mobility of citizens, in order to have a better view of the region and therefore set proper policies. More specifically, they need data and analytics to define policies for the cases of overtourism, increase visitors and maximize their experience, improve services and facilities/public transportation, etc.
However, one vital issue that should be analyzed in the future, is how the framework would provide the aforementioned benefits to the stakeholders. Since BigDaM will handle and manage the data generated by various critical infrastructure sectors, it could play the role of the data provider to the stakeholders. However, additional expansion to the framework should take place, for a sophisticated User Interface to be implemented, through which the stakeholders will have the ability to request subsets of CI-oriented data.

5. Data Model and Interoperability

Interoperability is the ability to share data and services among different computer systems and depends on the ability of the involved systems to understand the structure and meaning of the data that they receive and present the data that they send in a way that can be interpreted by others. Semantic interoperability is based on the definition of an unambiguous way to interpret the data that is being exchanged among different computer systems. This can be achieved through the use of a common data model, which provides a vocabulary for a domain where the concepts are defined without any ambiguity and can be related to each other or organized according to different criteria. Hence, the definition of a common vocabulary provides a shared understanding of the domain of interest [29]. Another key element for interoperability is the provision of a standardized interface for accessing the data.

5.1. Data Modeling Methodology

However, in the case of CIs, enabling interoperability is not a trivial task because the different organizations in the CI sectors do not follow a common standard. Instead, they usually have their own vocabularies, which may have a poor definition of semantics (or no explicit semantic formulation at all). For this reason, the proper definition of a common vocabulary for CIs, following the appropriate guidelines and best practices, has been necessary to enable interoperability. Moreover, the actual needs of the market must be taken into account during the definition of such a common data model in order to be able to implement solutions that are valuable for the different stakeholders. The aim is that each message exchanged via the applications involved in the CIs follows the common data model. This way, the process of understanding the received data is simplified because there is no need to know the details of the underlying information system of each data provider.
The first step in the definition of the common data model was the identification and analysis of the different data sources as well as the existing components of the digital infrastructure of the CIs that had to be integrated with the proposed solution in order to identify the key concepts needed in the data model definition. This analysis considered the meaning and format of the data, as well as the storage and data management mechanisms. From this analysis, the main concepts of the vocabulary were identified and classified as possible classes, attributes, or relationships. The results of this analysis were then combined into a global high-level view of the data model. In addition, the identified classes were arranged into a set of domains and subjects.
Next, the existing ontologies and vocabularies related to the identified domains were studied in order to determine which definitions could be reused in the common data model. More concretely, the main ontologies and vocabularies that were analyzed are the following: Fiware Smart Data Models [30], IDSA Information Model [31], United Nations Centre for Trade Facilitation and Electronic Business (UN/CEFACT) model [32], Blockchain in Transport Alliance (BiTA) [33], DCSA Interface for track and trace (DCSA) [34], IPSO Smart Objects (OMA SpecWorks) [35] and Smart Applications REFerence (SAREF) ontology [36]. From those, the most relevant one is Fiware Smart Data Models because components of the Fiware ecosystem [37] have been selected as part of the platform. Whenever possible, concepts from the analyzed vocabularies were reused. The concepts from the identified vocabulary that were not found in the standard ontologies and vocabularies were defined based on the global high-level definition of the common data model following the Fiware Smart Data Models guidelines and taking into account the requirements of the different use cases. The last step was the definition of the detailed specifications of the common data model. These specifications follow the guidelines of the Smart Data Models initiative.
Regarding the Smart Data Models initiative, it is led by the Fiware Foundation in collaboration with other organizations and aims to offer an agile standardization mechanism that is both open and capable of accommodating real-world scenarios. This initiative provides a set of open definitions that are compatible with schema.org and several existing domain-oriented standards and real use cases. These definitions are provided as JSON schemas and JSON-LD context documents compatible with Fiware NGSI v2 and NGSI-LD APIs. The standard NGSI-LD [38], which is an evolution of NGSI v2 to support linked data, was defined by the European Telecommunications Standards Institute (ETSI) [39]. NGSI defines an information model and an interface for sharing context information, while the use of linked data enables the automatic association of the data with an ontology. In this way, the initiative aims to facilitate the development of interoperable smart solutions in different application domains through the provision of harmonized data formats and semantics.

5.2. Enabling Data Interoperability via the Adoption of Common Data Models

Making use of the previously described methodology, a common data model is created to accurately describe the reality of the elements and effectively address real-life use cases within CI domains. As a practical example, within the context of the European Research Project DataPorts [11], a data model for smart ports was defined to cover specific data modeling requirements in ports.
The data model definition process was initiated by taking into consideration the needs of two prominent European seaports (Valencia and Thessaloniki) along with two global use cases related to those ports, which involved smart containers and port event notifications. The data model was focused on different port domain verticals, such as cargo, customs, geofencing, land transport, mobility, port management, sea transport, or tracking. These verticals are included in a set of pilot scenarios focused on tracking transport operations, port authority data sharing, port analytics services, or vessel notifications. The data model includes mappings to relevant standard vocabularies of the considered ports, thus promoting seamless interoperability with other solutions. From an operative point of view, the common data model is hosted in a Github repository [40], following the specifications of Fiware Smart Data Models. The concepts of the common data model have been grouped under a set of subjects inside the smart ports domain. Each subject contains the corresponding NGSI-LD context document, which describes how the data is interpreted according to the data model, as well as other shared resources and information, and provides access to the different entity types that it contains. The representation of the entity types is described using JSON Schema. In addition, the specifications of each entity type and the corresponding examples in NGSI v2 and NGSI-LD, as well as in plain JSON and JSON-LD, are provided. Thus, the data model is fully compatible with the Fiware ecosystem and the Smart Data Models initiative.
The adoption of the Smart Data Models principles initiative plays a crucial role in enhancing data sharing and interoperability approaches while also providing a straightforward mechanism to define the data structure of the port domain. By adopting this common data model, the reuse and utilization of data in cognitive port applications is made possible while also facilitating the reusability of these applications. This approach ensures efficient data handling and empowers the port industry with enhanced data-driven solutions. In addition, from the perspective of cataloging and discovery, the publication of data sources is facilitated by referencing their specifications, and it enables the verification of a data source’s compliance through the data-sharing ecosystem’s standards. By embracing the common data model, stakeholders within the port domain can leverage the full potential of their data, unlocking valuable insights and opportunities for innovation. Specifically, the inclusion of the data model in specific scenarios of the ports demonstrates the effectiveness of this interoperability approach in enhancing the overall performance and effectiveness of port operations, fostering a more interconnected and cognitive port ecosystem.
Once published, the data model is public and can be updated with the needs identified by other ports or maritime actors that want to adopt it, making it possible to update the original specifications of the data model to improve it and foster its adoption by the whole community or work on an independent branch to cover the specific needs of a local scenario. This agile standardization is achieved through a series of agreements among the parties involved in the creation and use of the common data model.

5.3. Interoperability Layer

The Interoperability layer enables semantic interoperability between the different data providers and data consumers through the definition of a unified semantic model and interface to access the data. In addition to the common data model, the necessary mechanisms and enablers to provide access to the data from the existing data sources were implemented. These mechanisms are based on open-source components of the Fiware ecosystem.
This innovative Interoperability layer offers a comprehensive framework encompassing mechanisms, data models, and interfaces to streamline the common access and management of various data sources within critical infrastructures. Notably, its Interoperability layer stands out by unifying disparate data through standardized interfaces, while its adaptive standardized data model effectively homogenizes intricate information into domain-specific concepts. This approach greatly simplifies data integration, fostering better understanding and accessibility across different trending technologies, including cognitive services, blockchain, data governance, or data spaces. Moreover, the solution’s modular and scalable design is geared towards users’ specific requirements, offering the flexibility to expand with value-added tools and adapt to changing needs. Additionally, it substantially reduces the effort required for application development. The platform’s commitment to semantic interoperability further enhances its appeal, providing a pathway for seamless communication among critical infrastructures such as port platforms, systems, and applications. Lastly, the incorporation of a common data model, in the case of ports for European seaports, signifies a significant stride towards enabling harmonious data exchange and collaboration across applications and services in the context of a critical infrastructure complex ecosystem and its operations.
Firstly, due to the heterogeneous nature of the data sources, a set of agents was developed to access the data from the different sources and convert it into NGSI format following the common data model described in the previous section. When certain conditions are met, the agent retrieves the data from its corresponding data source, translates it, and sends it to the other components of the platform. As a result, the data sent to the analytics services built on top of the proposed solution and other data consumers that have the proper access permissions follow the same format and semantic model regardless of the particular aspects of the data source. Since the agents are tailored for each specific data source, the agents were implemented making use of a Python framework for agent development named pyngsi [41] in order to facilitate this task. Two types of agents were defined, namely, the publish/subscribe agents, which integrate near real-time data in the platform, and the on-demand agents, which make the historical datasets available for the Data Processing and Virtualization layer.
The publish/subscribe agents send the translated data to the Orion Context Broker [42] (Figure 4), which is the main component of a “Powered by Fiware” platform. Orion provides a common NGSI API to access the current values of the data from the different data sources. In the proposed solution, Orion manages the different data flows for near real-time data, enabling access to the data via push and pull mechanisms. Another key function of Orion in the platform is the management of the metadata definitions of the different data sources and agents (Figure 5) to make them available for the Data Processing and Virtualization layer. In particular, the data source metadata contains a machine-readable semantic description of the data provided by that data source and links it to the corresponding definitions in the common data model. The provision of these metadata definitions enables a shared meaning of the data and eases its use by the different components of the platform as well as the services built on top of it. Moreover, the use of metadata enables the creation of a data catalog, which in turn can be utilized as a base to define several functionalities such as data discovery, resource management, and access control.
Figure 4. Publish/subscribe NGSI agent [10].
Figure 5. Metadata management in the Interoperability layer.
Since Orion keeps only the last values of the data, a different mechanism was implemented to provide access to the historical datasets through the on-demand agents. Due to the volume of translated data that the agents of this type send to the platform, Fiware Cygnus [43] was integrated as part of the solution to help manage the historical data. Cygnus is a connector based on Apache Flume [44] that facilitates data persistence in a variety of third-party storage systems. The on-demand agents send batches of translated historical data to Cygnus, which reassembles the datasets and sends them to the selected backend to make them available for the Data Processing and Virtualization layer. This is also the final step that completes BigDaM’s flow, which can be seen in Figure 6 below:
Figure 6. BigDaM’s complete flow, as data make their way from Data Access, to Semantic Interoperability components, and finally enter the Data Processing and Virtualization layer, before being ready for potential recipients.

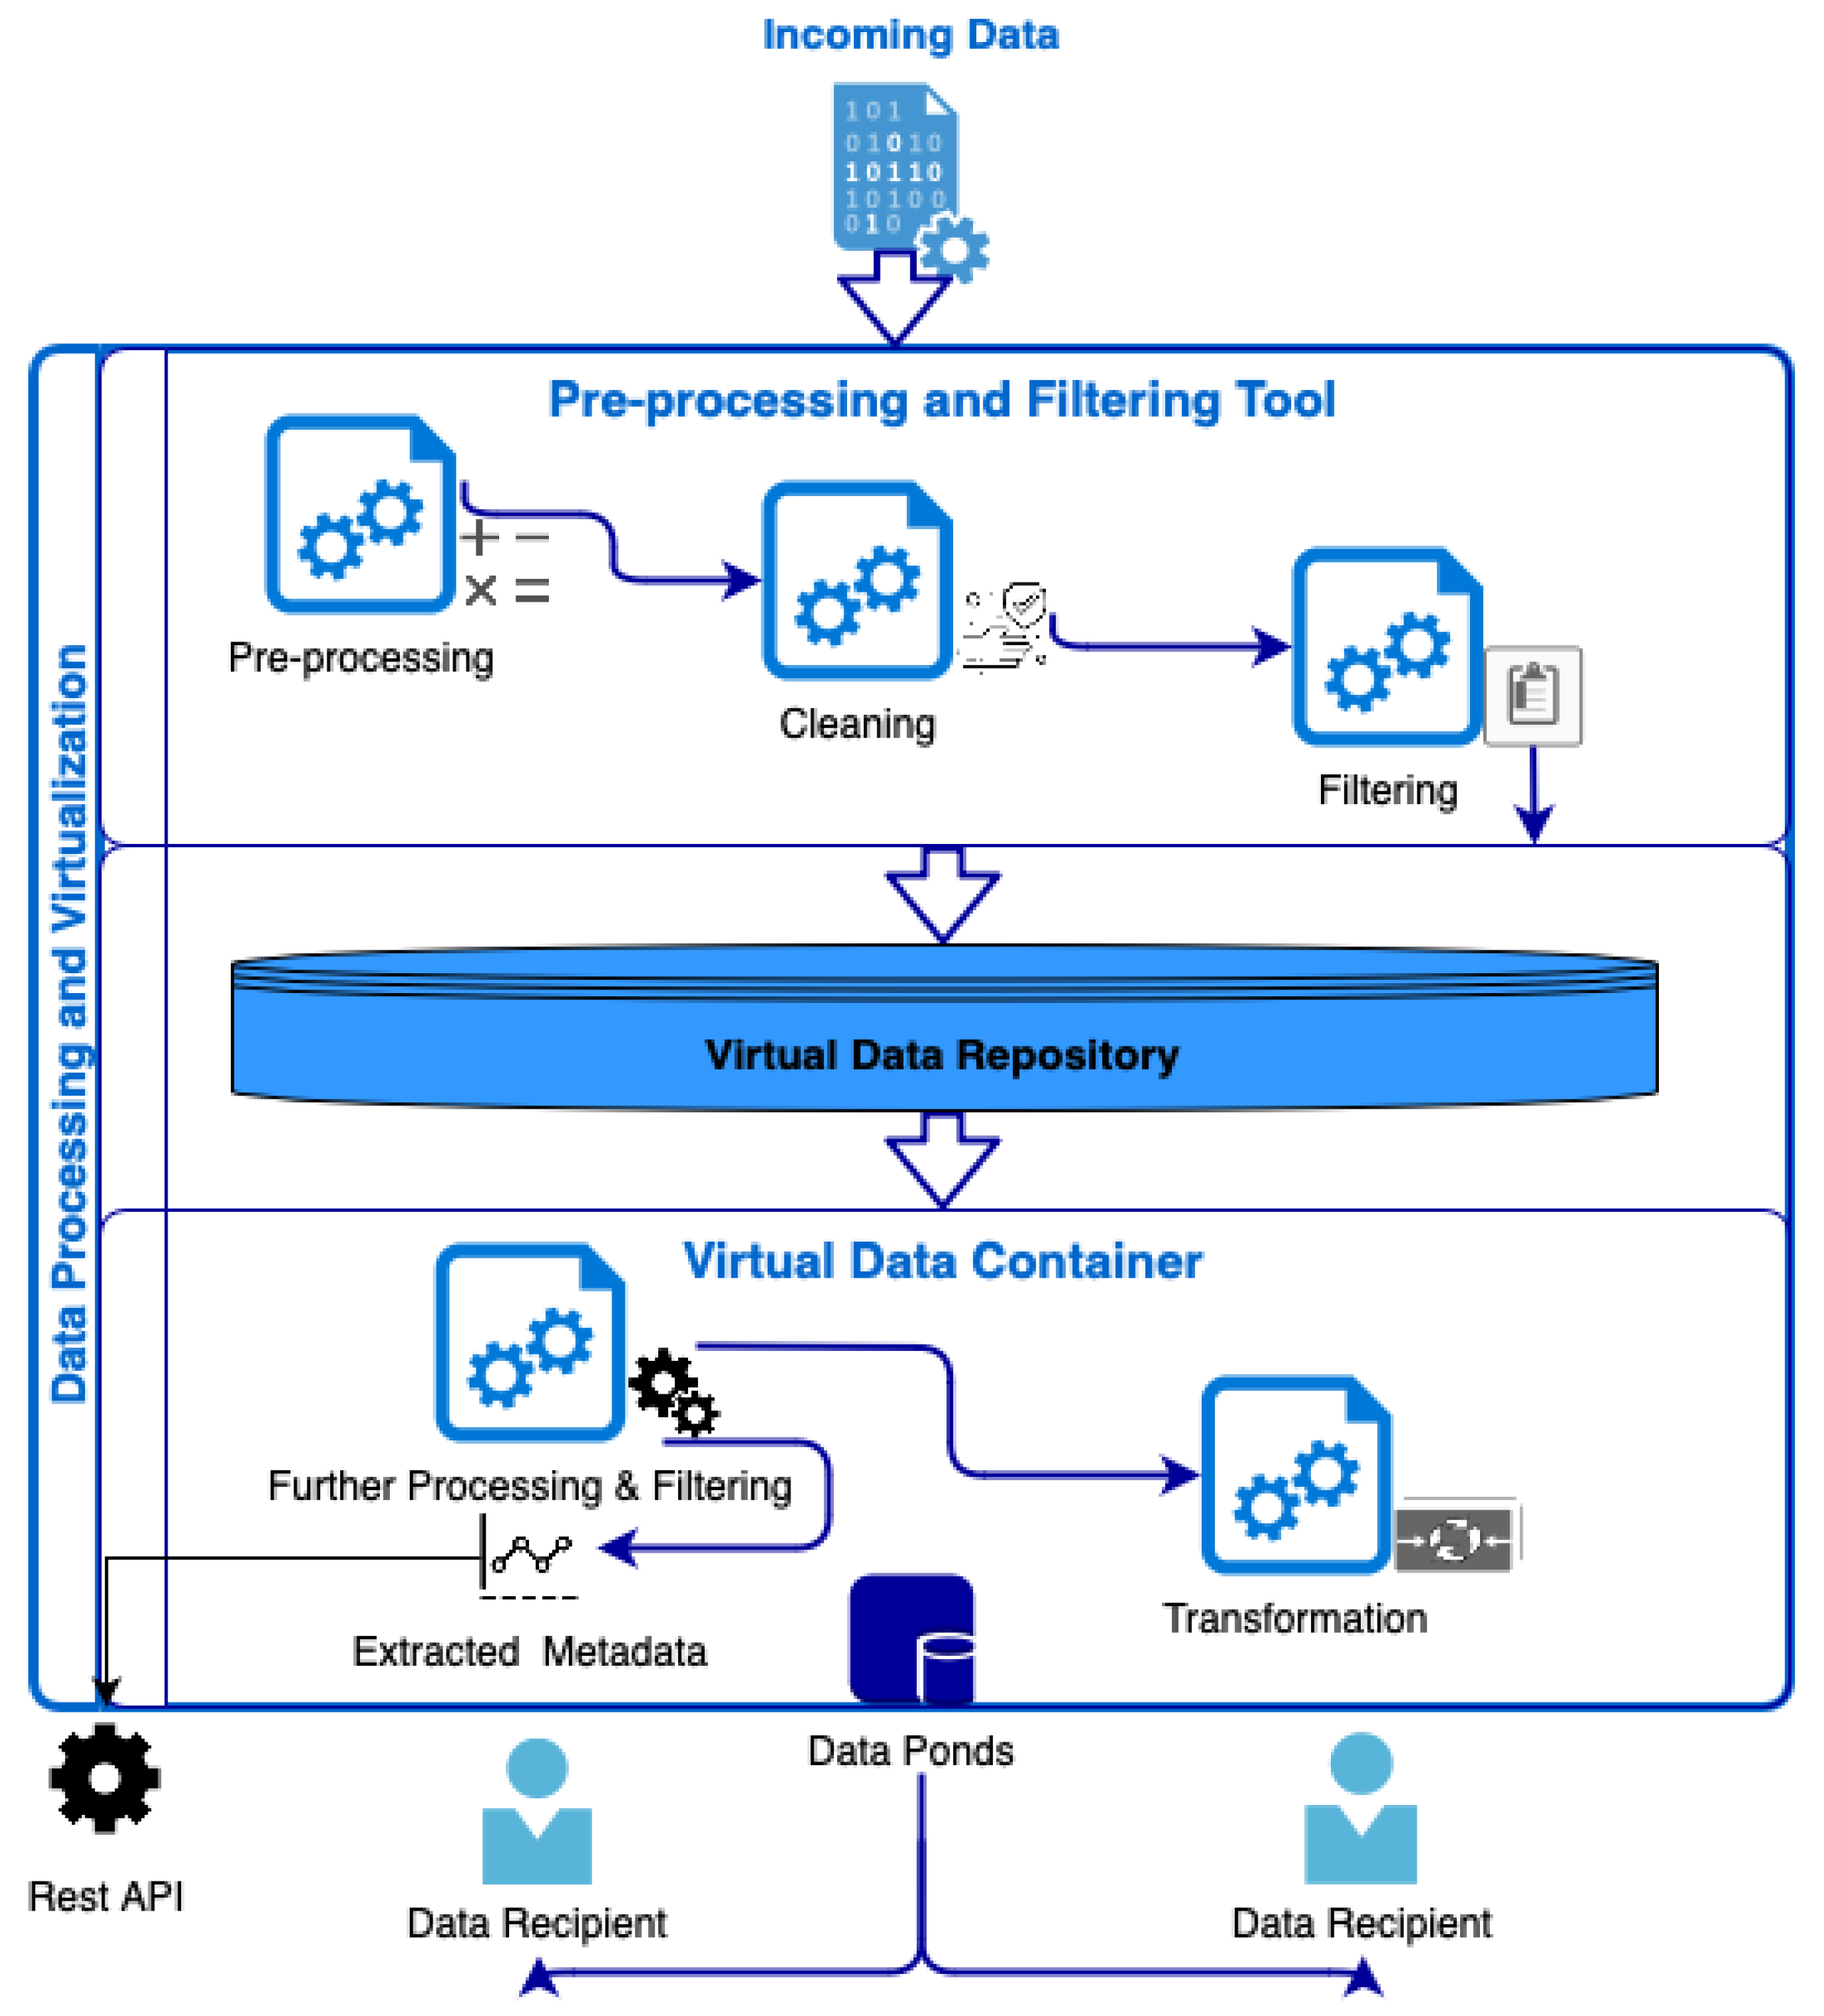
6. Data Processing and Virtualization

Once the data have been translated and standardized/harmonized following the data model outlined in the section above, the subsequent task involves offering these data as a service. This enables developers to construct cognitive, data-driven applications. To facilitate this process, a data processing and virtualization middleware is essential. It acts as an intermediary layer, bridging the gap between CI data providers and consumers, ensuring smooth and efficient interaction. This is where the Data Processing and Virtualization layer comes to play.
Data virtualization represents a data integration method that offers information access through a virtualized service layer, without taking account of the data sources’ physical locations. By doing so, it enables applications to retrieve data from various heterogeneous sources via a single endpoint, creating a unified and encapsulated view of the information for querying purposes. This approach also allows data transformation and processing to ensure the data are prepared for consumption. One of the main challenges faced in data virtualization is effectively managing different types of storage systems, such as key-value, document, or relational databases, all requiring integration. Moreover, data-intensive applications relying on virtualized data sources demand specific quality of service guarantees, including performance and availability, from the system. The Data Processing and Virtualization layer tackles these challenges and contributes to the platform’s data interoperability. Its primary focus lies in meeting each CI’s data quality requirements. Essentially, the layer is responsible for appropriately preparing data inputs from diverse sources within a generic given project’s architecture, maintaining metadata from all feeds, and making the “cleaned” and processed datasets available to potential clients. The primary source of load for the layer is persistent data streams, encompassing data that has already been collected and stored. The architecture and complete flow of the Data Processing and Virtualization layer can be seen in Figure 7 below:
Figure 7. Architectural view of the Data Processing and Virtualization layer, with its three subcomponents.
In regard to the data processing tools and technologies of the layer, Apache Spark [45] is the chosen framework due to its ability to support multiple programming languages, including Java, Scala, Python, and R. It boasts extensive documentation and has a vast community of users, making it a popular choice. Furthermore, Spark has the capability to produce advanced analytical results. Although other frameworks have their unique advantages and challenges, Spark stands out for its versatility. In addition, Spark demonstrates superior scalability and overall efficient runtimes [46]. The Data Processing and Virtualization layer comprises three primary subcomponents that collaborate and communicate to achieve its goals. These are the Pre-Processing and Filtering Tool, the Virtual Data Repository, and the Virtual Data Container.

6.1. Pre-Processing and Filtering Tool

Starting with the Pre-Processing and Filtering Tool, it serves as a subcomponent responsible for pre-processing datasets obtained from the Data Model and Interoperability layer. Given its generic nature, the tool (and the Data Processing and Virtualization layer in general) can accept various types of data and efficiently handle them. Upon receiving the incoming dataset in its entirety, the tool generates a dataframe, essentially forming a table that contains all the collected data. To ensure data consistency, the Pre-Processing and Filtering Tool analyzes the dataset’s metadata to determine the appropriate column types for each attribute. If necessary, it performs data type corrections, a crucial step since subsequent applications heavily rely on the dataset’s column integrity. Following this, the subcomponent proceeds with the cleaning and filtering phase, applying the following standard pre-processing techniques to the dataset:
  • Elimination of white spaces from all cells containing string-type data.
  • Conversion of empty cells and instances with ‘NULL’ string values to ‘nan’ (not a number) values across all cells.
  • Removal of records or rows from the dataset that lack datetime values or contain incorrect ones.
  • Conversion of correct datetime values to the UTC format for consistency and standardization purposes.
Before finalizing the process, the Pre-Processing and Filtering Tool undertakes the task of generating a correlation matrix that assesses the relationships between the columns within each dataset. This newly derived correlation data is then stored alongside the existing cleaned dataset within the Virtual Data Repository (which is described later on), where it can be analyzed at a later stage. Additionally, the subcomponent conducts outlier detection on numerical columns, resulting in the creation of supplementary columns that indicate whether a corresponding cell is identified as an outlier. For each numerical column that is subject to outlier detection, a new column is generated with “yes” or “no” values, signifying whether the corresponding cell is considered an outlier or not. The detection method employed involves utilizing “three standard deviations from the mean” as a threshold or cut-off radius. However, this method can be customized and adjusted to cater to the specific needs of the users or data recipients. It is worth noting that the primary codebase of the Pre-Processing and Filtering Tool is written in the Python programming language, as it is a Python Spark (PySpark) job.
In conclusion, the Pre-Processing and Filtering Tool accomplishes comprehensive pre-processing, cleaning, and filtering of each incoming dataset. During the pre-processing phase, the dataset is entirely collected and converted into a format compatible with Python code, ensuring a suitable column-row (tabular) structure. The cleaning process involves identifying and addressing “dirty” values, which encompass NULLs, empty fields, outliers, and incorrect entries. Subsequently, the dataset is thoroughly filtered to eliminate all identified “dirty” values, either through replacement or removal, along with their respective rows in the dataset/dataframe.

6.2. Virtual Data Repository

Moving to the second subcomponent of the Data Processing and Virtualization layer, the Virtual Data Repository (VDR) serves as the temporary storage for all pre-processed, cleaned, and filtered datasets received from the Pre-Processing and Filtering Tool. Once a dataset has undergone all necessary functions, it is stored in the VDR alongside its columns’ correlation matrix. To ensure efficiency standards within the layer, VDR utilizes MongoDB [47], which has been modified and configured to suit the layer’s specific requirements. MongoDB was chosen for its popularity as a document store. Additionally, MongoDB’s auto-scaling and sharding capabilities, along with the flexibility it offers for custom configurations, align well with Data Processing and Virtualization’s needs. Given that the layer’s core functionality revolves around data virtualization, the seamless integration of MongoDB with Kubernetes [48], a container management tool, is crucial. VDR is situated within a Kubernetes cluster, leveraging Kubernetes’ optimal load balancing, replication, scaling, and scheduling techniques.
The selection of MongoDB was a relatively easy one. Opting for a document-based NoSQL database appears to be the most optimal decision for implementing temporary data storage (VDR’s nature) within the Data Processing and Virtualization layer, aligning with the data’s inherent characteristics that necessitate handling. Indeed, this database variant proves to be well-suited for semi-structured data lacking a rigid schema while adhering to specific formatting rules like XML, JSON, and BSON. Conversely, a relational database would demand a comprehensive understanding of incoming dataset structures beforehand, thereby restricting the ability to accommodate datasets with diverse schemas. Given that the data used for testing are formatted in JSON, MongoDB (document-based storage) was selected due to its exceptional performance, adaptability, and scalability. When compared to key-value NoSQL databases, document-based options facilitate the support of various entity types and intricate queries, a vital feature expected from the layer.
The outcome is a modified MongoDB system, comprising multiple replicas to enhance its resilience and immunity against system failures. The level of robustness is contingent upon critical factors, such as the number of replicas and their distribution within the cluster. By employing more than one replica, VDR can effectively withstand the event of a MongoDB replica failure. In such cases, the remaining replicas ensure uninterrupted functionality of VDR, safeguarding all data and eliminating the risk of data loss or temporary unavailability. All Mongo Replicas are considered as a unified database. The Kubernetes platform plays a crucial role in this setup by performing load balancing and efficiently distributing data in a manner it deems most suitable. Consequently, from the perspective of the end user, the exact location (e.g., node or replica) where the queried response data are stored remains concealed, ensuring a seamless user experience. VDR’s implementation has been extensively analyzed by a publication in 2022 [49].

6.3. Virtual Data Container

The third and final subcomponent of the Data Processing and Virtualization layer is named the Virtual Data Container (VDC) and plays a crucial role in facilitating communication with data recipients, enabling them to access the data stored in VDR. The VDC serves as a versatile and generic subcomponent, responsible for further processing and filtering the data based on specific rules set by data consumers using HTTP POST requests. The filtering rules serve a dual purpose. First, they allow the datasets to be filtered, ensuring that only the relevant data of interest (to a particular user) is served, essentially creating a specific data pond tailored to their needs. Second, they are employed to identify and eliminate erroneous inputs, such as extreme outliers (e.g., outdoor temperatures at minus 100 degrees Celsius), which are likely due to sensor malfunctions. When a data consumer submits a POST request at VDC, they can define not only the filtering rules but also the desired format in which they want to receive the data, allowing for customizable data transformation. Additionally, VDC takes on the responsibility of providing useful metadata for each dataset stored in VDR. This metadata includes information on the dataset’s size, the number of rows and variables it contains, the timestamp of its last update, and more. The metadata are made accessible through a RESTful API, facilitating easy retrieval and utilization by data recipients. The information flow of the Virtual Data Container can be seen in Figure 8 below:
Figure 8. The information flow of the Virtual Data Container [10].
Concerning the foundation of VDC, Apache NiFi [50] stands as the preferred selection, serving as the platform to construct data flows, allowing the Data Processing and Virtualization layer to effectively present the cleaned and processed data to data consumers. The flow responsible for implementing the VDC Rules System (which handles data processing and filtering based on user-defined rules) is also introduced to the user through NiFi. The actual processing, filtering, and transformation of the data are executed by Spark. Regarding the selection of Apache NiFi as the best solution for the task, various elements have been taken into account before making the decision. However, the three main tools examined were Apache Flume [44], Kafka [51], and NiFi, based on their great performance, capacity for horizontal scalability, and incorporation of a plug-in framework that permits the expansion of functionalities through custom elements. The final choice revolved primarily around the components Apache Flume and Apache NiFi. On one hand, Flume is configured using configuration files, while on the other hand, NiFi provides a graphical interface for configuring and monitoring procedures. The ease of having a UI made NiFi the final choice, given the fact that it already was an efficient and scalable software tool.
As for the VDC’s rule structure, it is designed to be straightforward, consisting of three key elements for each rule: a “subject column ”, an “operator”, and the “object”. The expected format of the rules list is a JSON array, comprising rules represented as JSON objects, each containing these specific string values. The VDC interprets and implements the rules from this list onto the requested dataset.The architecture of the incoming rules JSON file is as follows:
  • A JSON object, which includes:
    -
    A string field denoting the dataset’s name, and another one for the dataset’s ID.
    -
    A JSON array containing the rules as individual JSON objects.
  • Each JSON object (rule) in the array contains:
    -
    A string field for its name.
    -
    Another JSON object representing the rule itself, comprising the “subject_column”, “operator”, and “object” fields.
    -
    If the “operator” is a disjunction (using the “or” expression), the “object” field should be a JSON array, containing two or more objects, each with single string “operator” and “object” fields.
By adhering to this structure, the VDC can effectively parse and apply the defined rules to the dataset, enabling efficient data filtering and transformation as per the data consumer’s requirements.
Figure 9 indicates the list of accepted operators that are available for use by the rules’ authors, including data scientists, application developers, and end-users. Any rule object that contains unknown operators is discarded during the processing. Moreover, the rules system is founded on two fundamental principles, which are designed to help users comprehend the nature of the rules:
  • The primary objective of a rule is to apply filters to one subject (column) at a time and not to combine multiple subjects (columns). If a rule involves more than one column as subjects, it might be seen as more of a “pre-processing” step rather than a direct “filtering” action. Additionally, modifying the content of specific rows/values or removing rows with specific value types falls under a lower-level operation, compared to what the rules’ system suggests.
  • The Data Processing and Virtualization layer, being a generic framework, is intended to be applicable to various datasets. Therefore, creating rules that exceed the standard “subject-operator-object” architecture would contradict the layer’s generic nature. Implementing basic pre-processing steps for specific datasets is relatively simple and can be achieved in just a few lines of code. However, such specific pre-processing steps may not be suitable for other datasets, given the layer’s flexibility to handle diverse data types. Consequently, data scientists would have to resort to conditional solutions like using “if the incoming dataset is X, then apply these selected lines of code”. While this may be an easy solution, it compromises the fundamental generic nature of the Data Processing and Virtualization layer.
Figure 9. Accepted operators by VDC’s Rules System.

7. Performance Evaluation and Results

First and foremost, the complete BigDaM framework has been tested in a cluster consisting of two virtual machines. Both virtual machines are in VMWare infrastructure on a VxRAIL cluster. The cluster consists of eight physical hosts (four in a primary computer room and four in a secondary computer room, in an active-active configuration), and is managed by vSphere version 7.0.3. The first virtual machine has 4 CPUs, 16 GB of RAM, and a 100 GB hard disk. It runs Ubuntu Linux 18.04. The second virtual machine also has 4 CPUs, 16 GB of RAM, and an 80 GB hard disk. It runs Ubuntu Linux 20.04. Since BigDaM is designed as a modular framework, evaluation and results will be shown for both the Interoperability and the Data Processing and Virtualization layers.

7.1. Interoperability

Starting with the Interoperability layer, as a middleware component, it assumes a crucial role in facilitating seamless interactions with the other components of a CI. Its main objective is to establish efficient and effective communication among all internal elements. This focus on achieving smooth information exchange becomes instrumental in preventing any potential bottlenecks that could otherwise impede the overall system’s performance.
The performance of the Interoperability layer was tested using Autocannon. For testing purposes, the solution took advantage of 8 CPU cores, 30 GB RAM, and an 80 GB SSD hard drive. The tests ran 10 simultaneous connections for 10 s, with a total of 4000 requests. Table 1 shows the use of hardware resources during the load test compared with the baseline. The statistics of the requests per second and the bytes per second transmitted during the load test are reported in Table 2, while the latency statistics are shown in Table 3.
Table 1. Use of hardware resources.
Table 2. Throughput statistics.
Table 3. Latency statistics.
Following the evaluation of the system’s performance in a deployment with moderate hardware specifications, it was determined that the expected performance requirements were met. Moreover, the component exhibits flexibility to theoretically be deployed on various platforms, including PC, server, cloud infrastructure, or Raspberry Pi, while still maintaining the desired level of performance to effectively manage the different data flows expected in a real scenario. The layer has not been tested on all the aforementioned systems, but it could be part of a future implementation.

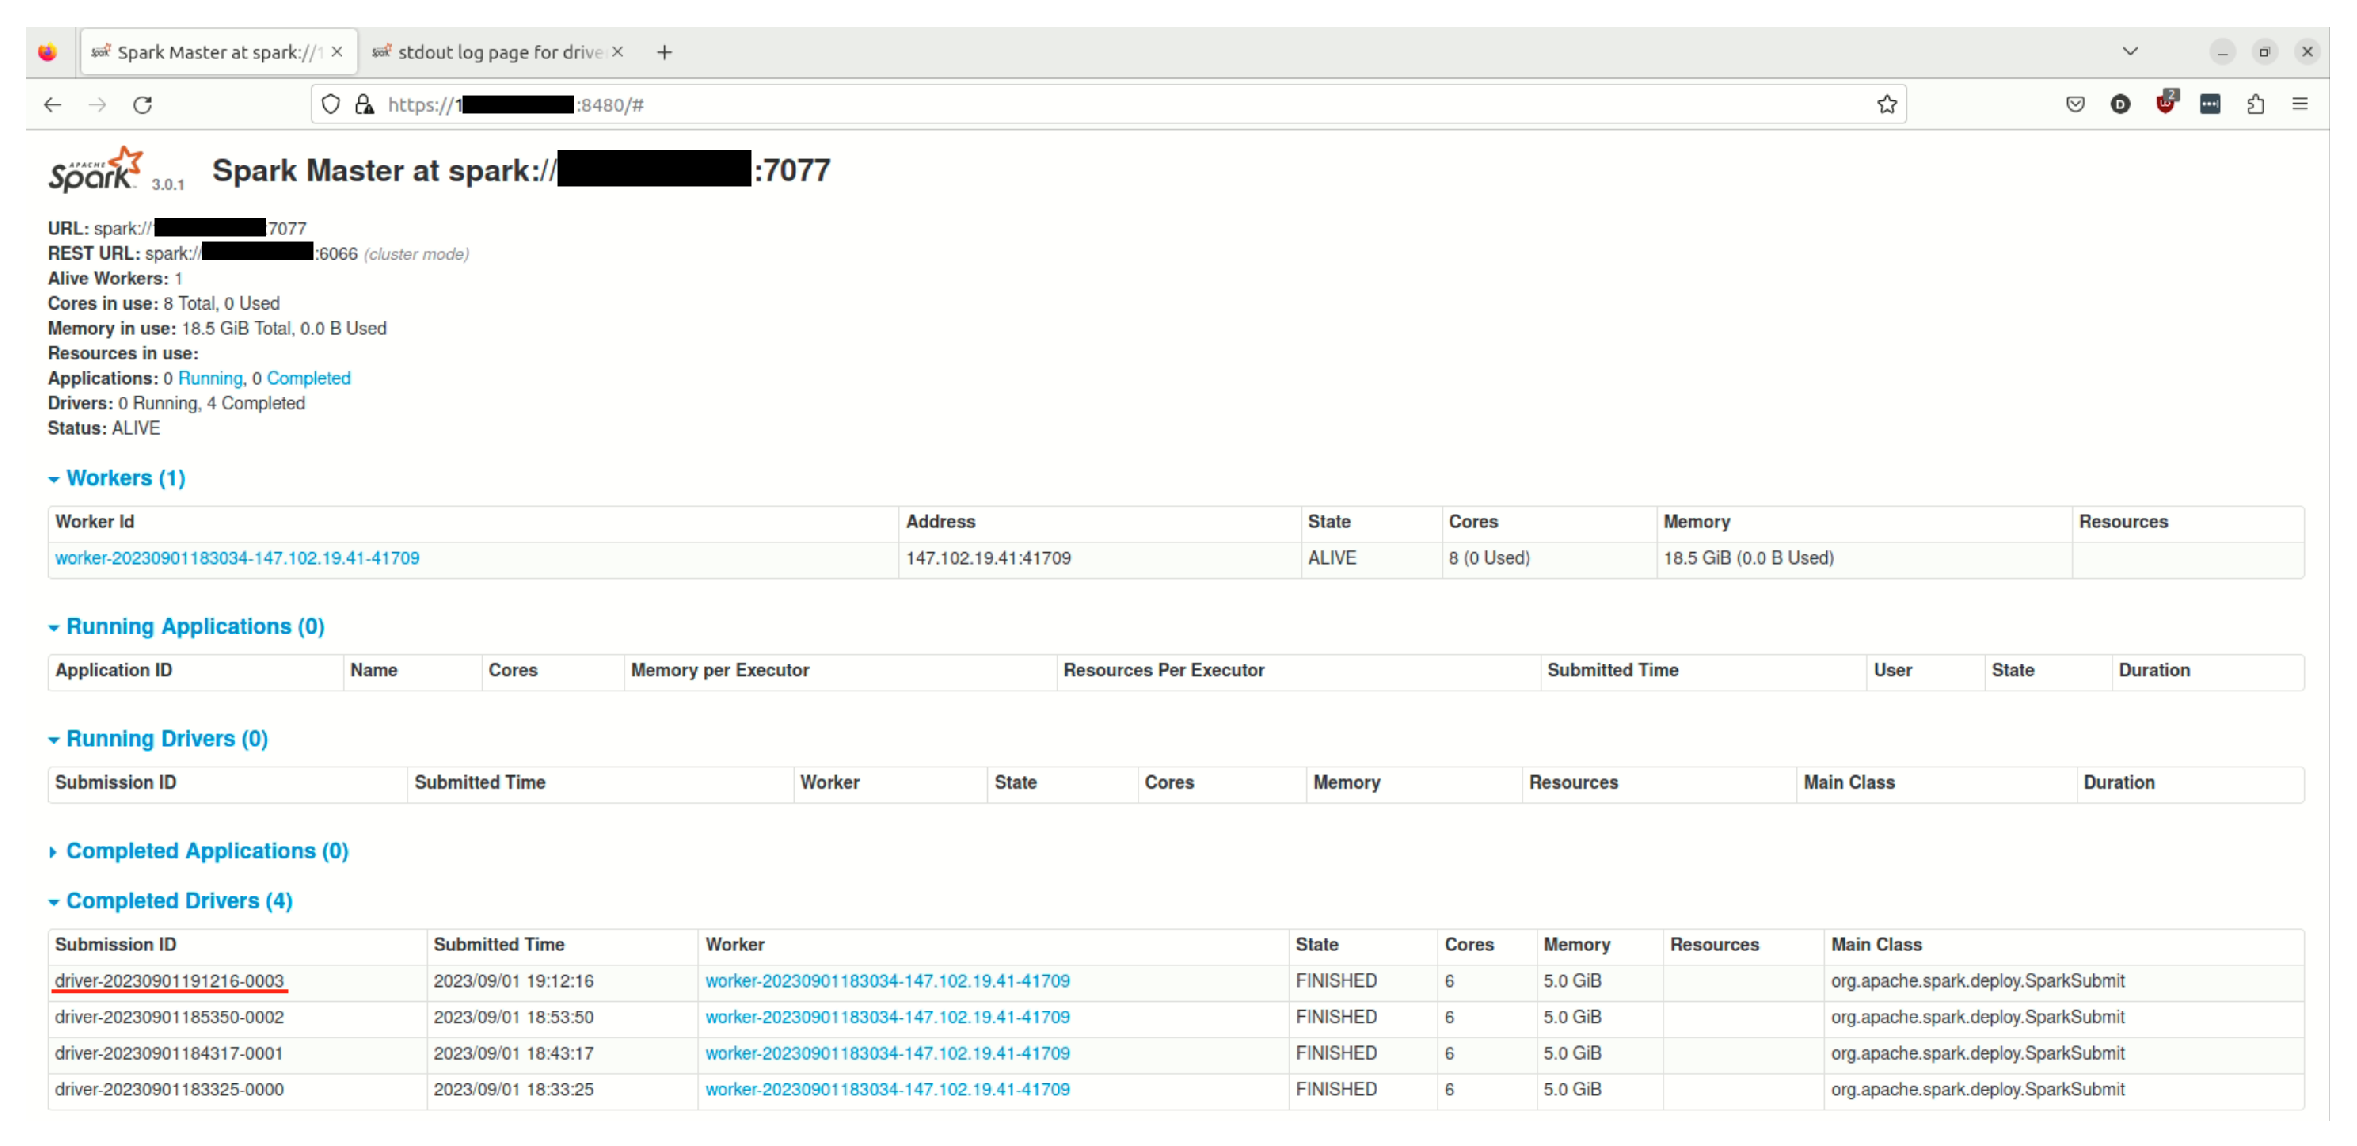
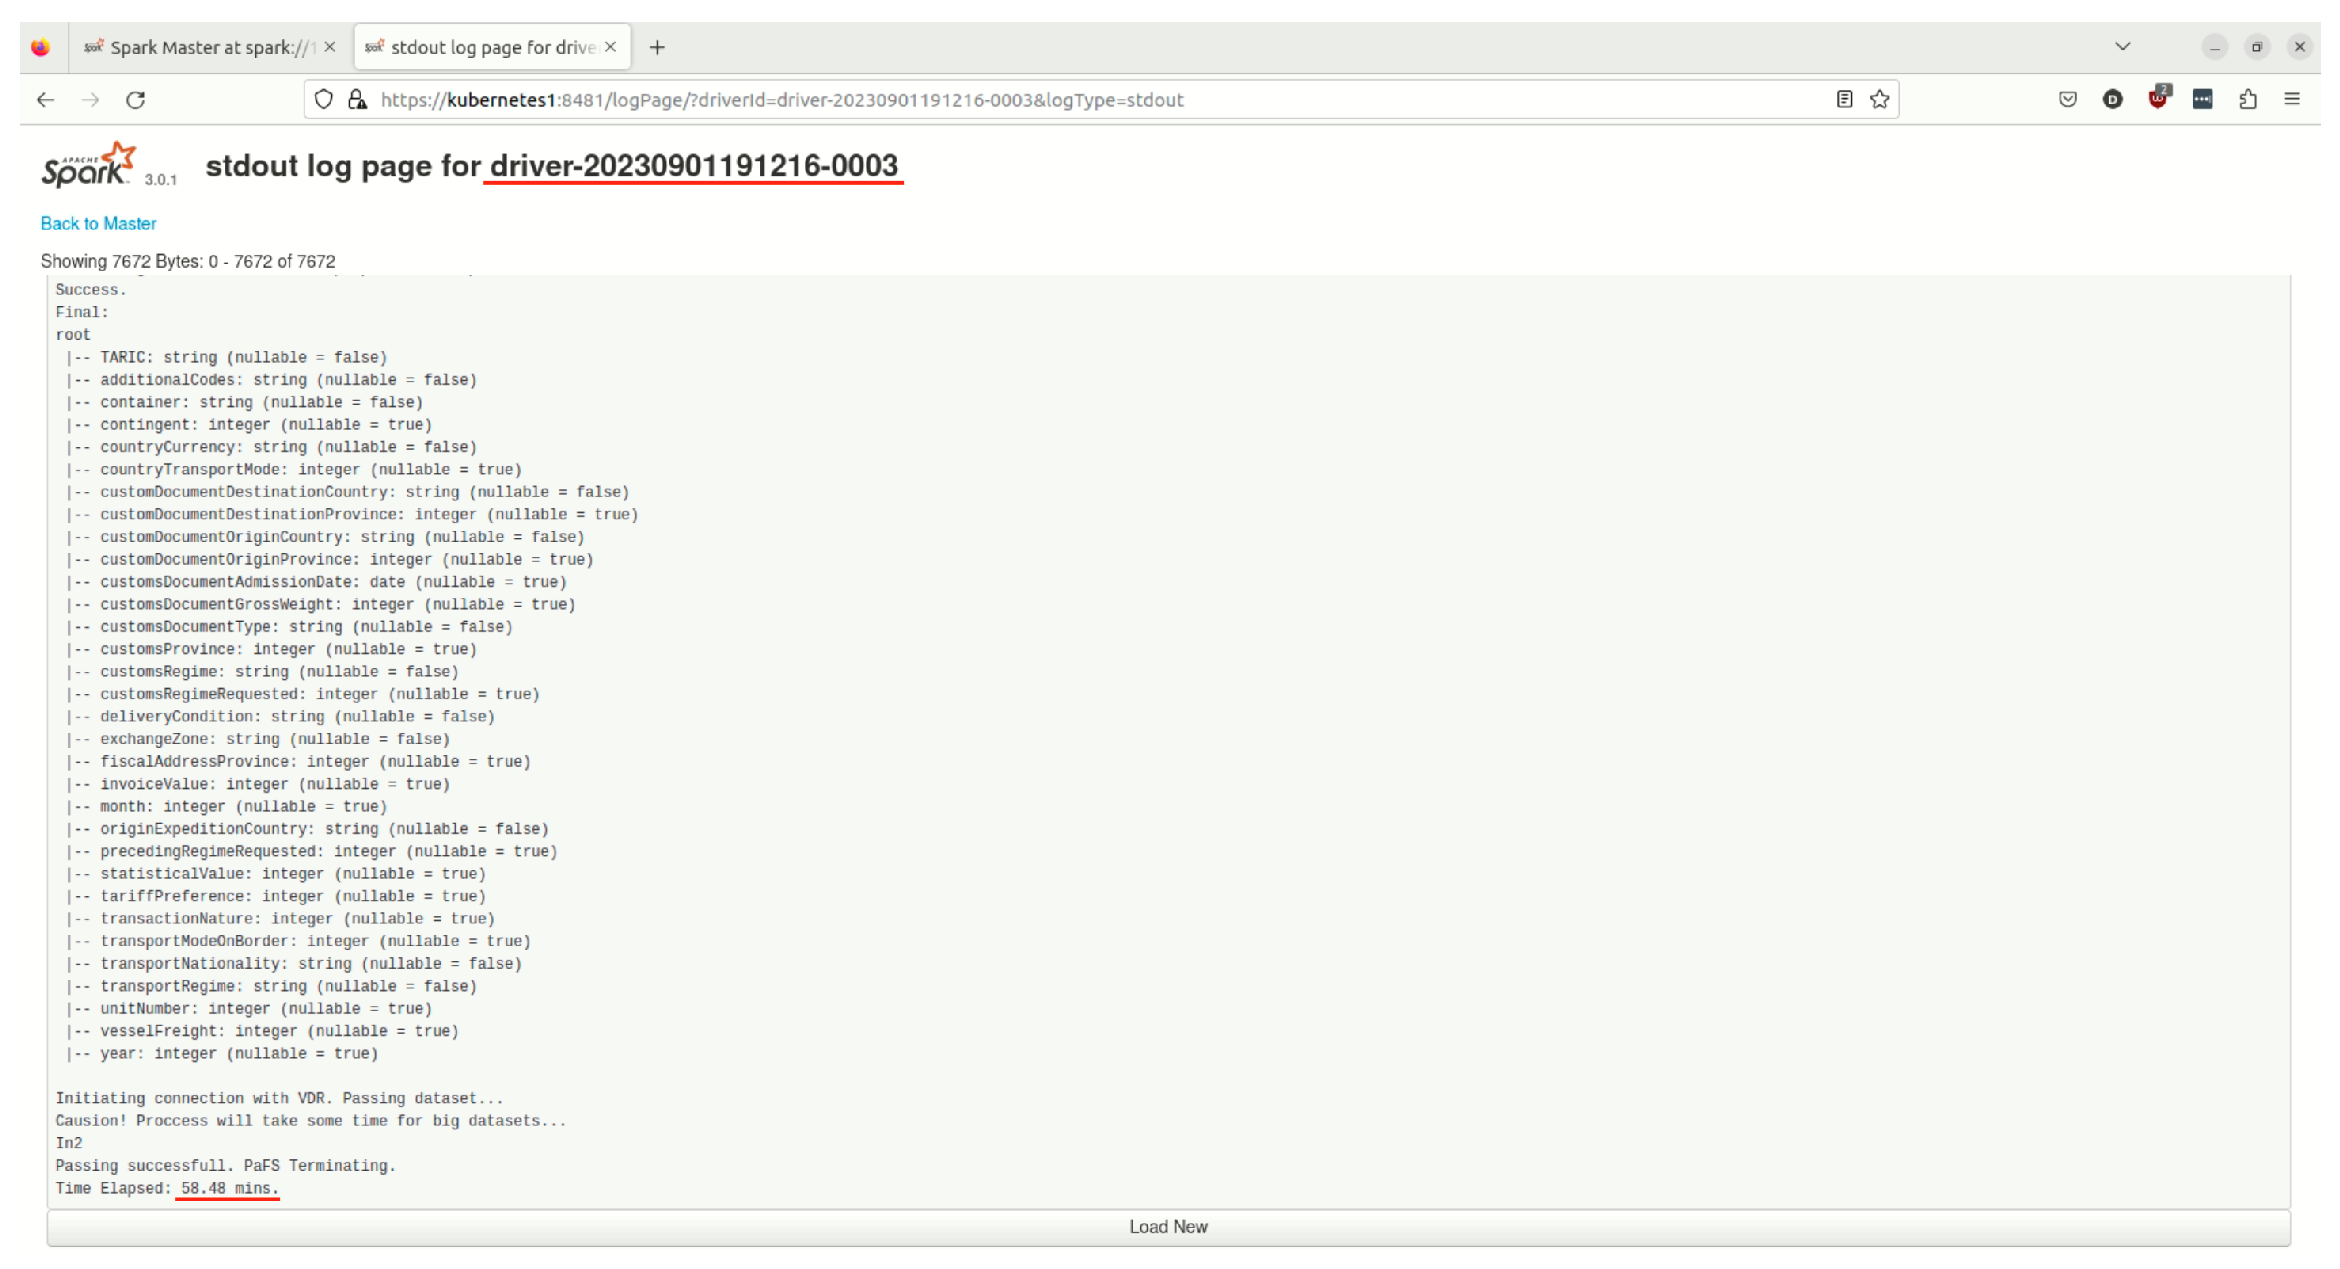
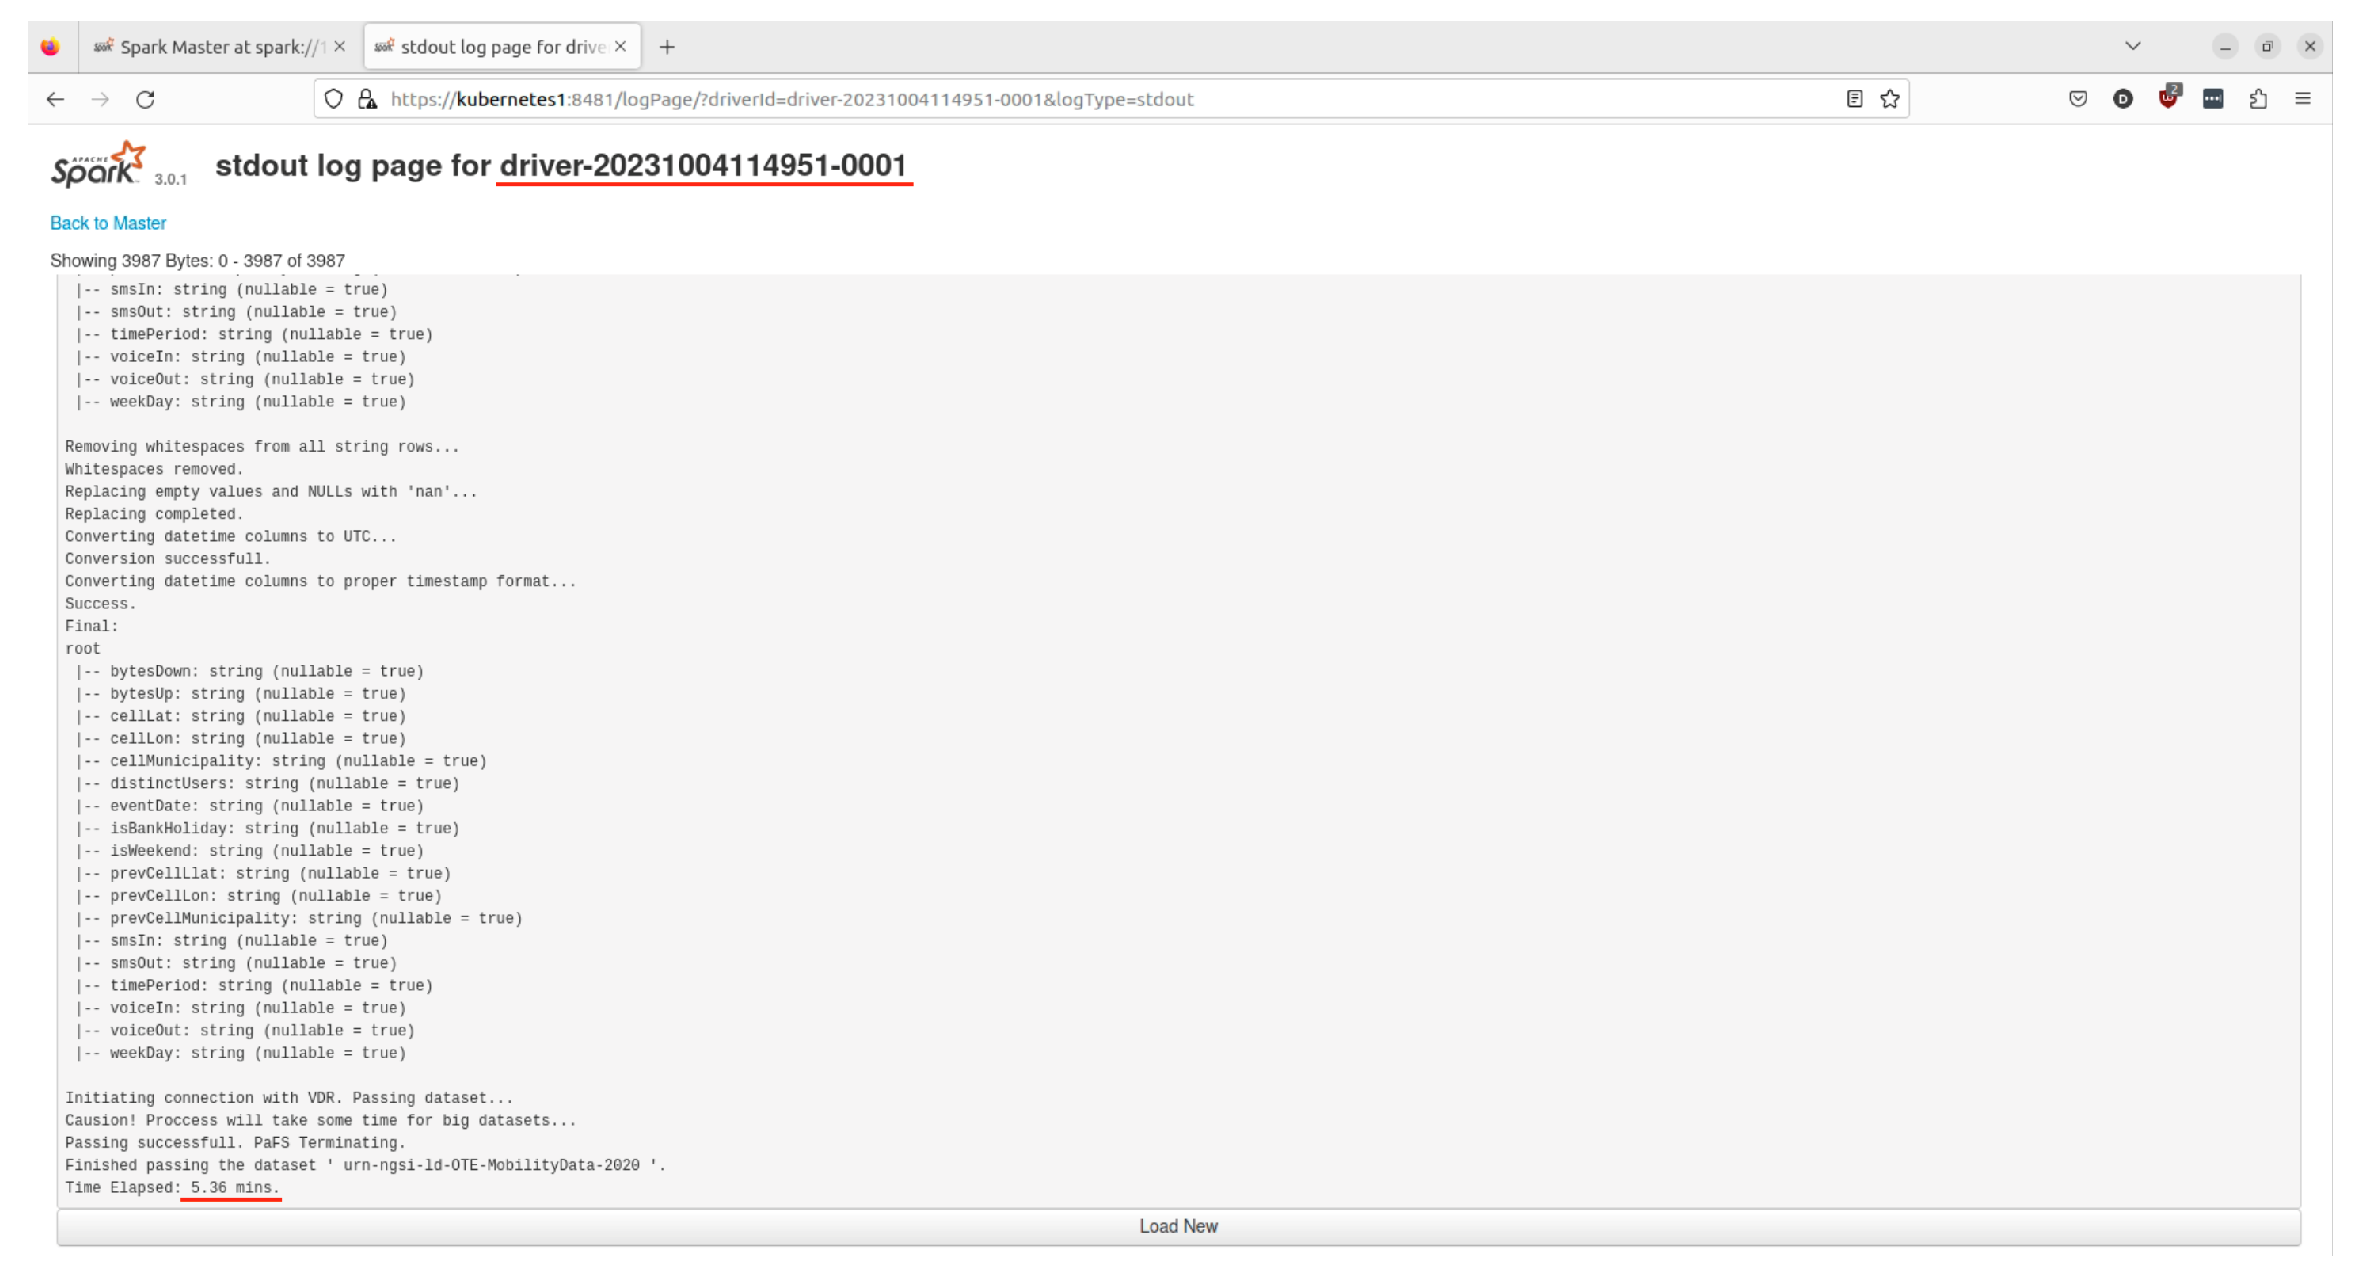
7.2. Data Processing and Virtualization

As for the Data Processing and Virtualization layer, it has been meticulously designed to facilitate the completion of the entire flow within a relatively short time window, contingent upon the volume of incoming datasets. The framework has been tested in the aforementioned architecture. The datasets used for evaluation are three: First, a small tabular dataset with approximately 31,200 documents was selected, aiming to emphasize the layer’s efficiency by showcasing its swift processing and storage capabilities. However, this dataset does not fall under the category of “big data”. For that reason, a second dataset was selected, with a total volume of 64.1 million JSON objects, and a total size of 55.4 GBs. The dataset is called “urn-ngsi-ld-ITI-Customs” and contains information on every item that passed through the customs of the port of Valencia, during given periods of time. In a few words, any given JSON object inside the dataset provides information for a specific item that made its way through the customs of the port. Each JSON object has the following format, as seen in Figure 10 below:
Figure 10. A JSON object that contains information for a specific item from the port’s customs. The full dataset contains 64.1 million JSON objects similar to that one.
In order to better evaluate the performance of the layer, tests will be conducted on both the complete Customs dataset and also three parts of it. The first part contains objects only from November of 2022 and has a size of 1.4 GB. The second part contains 6 million objects, with a size of 5.2 GB. The third part has exactly 11 million objects, with a size of 9.5 GB. In the end, the Data Processing and Virtualization layer gets tested with the full Customs dataset, with 64.1 million objects and 55.4 GB of size. The information provided for all four datasets can be seen in the screenshots below:
Computers 12 00218 i001
Computers 12 00218 i002
Additionally, for the Data Abstraction and Virtualization layer to be tested in an additional CI-sector-specific dataset, telecommunications company OTE group [52] provided three datasets, each covering an annual duration from 2019 to 2021, regarding the cellular network’s user mobility in the area of Thessaloniki, Greece. As a result, BigDaM is tested in ports (CI transportation sector) and telecommunication providers (CI communications sector). All three datasets have been subjects of extensive anonymization techniques performed by OTE’s data engineers. Each document/JSON object in the datasets contains information regarding a specific movement of a network user from one network cell to another. The amount of incoming/outgoing text messages and phone calls of the user are provided, as well as additional information, such as the potential holiday of the given timestamp or the current cell’s distinct users (in that particular timestamp). A random document/JSON object can be seen in Figure 11.
Each of the three datasets is named “urn-ngsi-ld-OTE-MobilityData-XXXX”, where the Xs are replaced by the corresponding year (2019, 2020, and 2021). The first dataset, that of 2019, contains 6.9 million documents and has a size of 2.8 GB. The second dataset of 2020, contains 10.1 million documents and takes 4.1 GB of disk space. As for the third dataset of 2021, it contains 5.7 million documents with 2.4 GB of size. However, a new (fourth) dataset has been created, by fusing all the aforementioned three. This dataset is used for performance evaluation purposes, in order to test BigDaM with an even larger set. The newly fused dataset contains 22.8 million documents and takes 9.2 GB of disk space. The information provided for each of the four datasets is evident through the screenshots below, beneath Figure 11.
Figure 11. A JSON object that contains information for a random-anonymized-OTE cellular network user in the area of Thessaloniki, Greece.
Computers 12 00218 i003
The testing process began with a small indicative dataset of 31,200 documents. The computing resources used by the layer and the obtained results are accessible through the layer’s Apache Spark Cluster WebUI, since the layer operates within an Apache Spark Cluster environment. Figure 12 provides an illustration of the Spark driver’s ID, timestamp, and the resources utilized by the driver during the execution of the Pre-Processing and Filtering Tool, the layer’s initial subcomponent responsible for processing, filtering, cleaning, and storing the dataset.
Figure 12. Screenshot from Data Processing and Virtualization layer’s Apache Spark Cluster WebUI.
As depicted in Figure 12, the driver with ID “driver-20230301132908-0011” was employed to load the Pre-Processing and Filtering Tool and execute the processing, filtering, cleaning, and storing of the dataset. The driver is triggered automatically, by an API call ready to be made by each CI’s software engineers, thus facilitating a seamless and continuous flow. Each subcomponent or software tool triggers the subsequent steps in the process. For this specific task, our Spark cluster driver utilized 6 CPU cores and 5 GB of RAM to execute the tool. The duration of the entire process can be observed in Figure 13, indicated within the driver’s logs.
Figure 13. Screenshot from Spark cluster driver’s logs.
The title of the log file confirms that we are examining the relevant driver’s information. Toward the end of the log, there is a record indicating the total time taken by the Pre-Processing and Filtering Tool to process, filter, clean, and store the designated dataset. The entire process was completed in 0.76 min, which roughly translates to 45 s. This short period of time is noteworthy, considering the series of tasks the tool executes on the dataset. As a result, the dataset is now stored securely and cleaned within the Virtual Data Repository, making it readily available for retrieval by any potential data recipient.
Moving on to the Customs datasets, the first testing took part on the smaller subset that contains data from November of 2022.
Same as before, the Spark cluster’s WebUI can assist in the process of monitoring the layer’s operation. As seen in Figure 14, a driver with ID “driver-20230901183325-0000” was generated by the system in order to load the Pre-Processing and Filtering Tool and execute the processing, filtering, cleaning, and storing of the subset. According to Figure 15, the Pre-Processing and Filtering Tool managed to complete the whole process, along with storing the subset in the Virtual Data Repository, in 2.1 min. Given the size of the dataset (1.4 GB and 1.4 million objects), it seems that the layer’s subcomponent did a good job in efficiently processing, cleaning, and storing it.
Figure 14. Screenshot from Apache Spark Cluster WebUI, for the November 2022 subset.
Figure 15. Screenshot from “driver-20230901183325-0000” Spark cluster driver’s logs, for the November 2022 subset.
Next comes the 6 million subset (of the complete 64 million Customs dataset), which is again monitored through the Spark cluster WebUI. The Pre-Processing and Filtering Tool has to apply all the aforementioned tasks to a set with a size of 5.4 GB, as stated earlier. The Spark driver running the job is named “driver-20230901184317-0001”, as seen in Figure 16 below:
Figure 16. Screenshot from Apache Spark Cluster WebUI, for the subset containing 6 million objects.
In the end, it took the driver (and therefore the Pre-Processing and Filtering Tool) 5.24 min to complete the whole process and eventually store the subset to the Virtual Data Repository (Figure 17). Similar to the test of November 2022’s subset, the framework finishes the job in a considerably low amount of time.
Figure 17. Screenshot from “driver-20230901184317-0001” Spark cluster driver’s logs, for the 6 million subset.
Before the complete Customs dataset comes the final subset of it, containing 11 million JSON objects and having a size of 9.5 GB. The driver generated by Spark in order to run the Pre-Processing and Filtering Tool is named “driver-20230901185350-0002” (Figure 18). It should complete the process in a short period of time, provided that it functions properly, and the system does not experience any bottlenecks or drops in the performance.
Figure 18. Screenshot from Apache Spark Cluster WebUI, for the subset containing 11 million objects.
As seen in the Spark driver’s logs in Figure 19, the Pre-Processing and Filtering Tool managed to apply all the aforementioned tasks in the subset and finally store it in about 10 and a half minutes. It is becoming evident that the framework’s time needed to complete the job follows a linear growth, in relation to the size and volume of the input.
Figure 19. Screenshot from “driver-20230901185350-0002” Spark cluster driver’s logs, for the 11 million subset.
The Data Processing and Virtualization layer’s following test was with the complete Customs dataset. A large JSON file containing 64.1 million objects, with a 55.4 GB size. When triggered by the aforementioned API call, Spark initiates the process with the generation of a driver, named “driver-20230901191216-0003” (Figure 20). The WebUI confirms that the process is now ongoing.
Figure 20. Screenshot from Apache Spark Cluster WebUI, for the complete Customs dataset.
As always, the layer’s Pre-Processing and Filtering Tool will have to process, filter, clean, and finally store the dataset in the Virtual Data Repository. The progress, along with the final completion time, can be seen through the driver’s logs (Figure 21):
Figure 21. Screenshot from “driver-20230901191216-0003” Spark cluster driver’s logs, for the complete subset.
The Pre-Processing and Filtering Tool managed to complete the whole job in under one hour. It took 58.48 min to effectively receive, process, and then store the Customs dataset in VDR. Once again, it seems almost certain that completion time grows linearly, in relation to the input. Next, the layer was tested with the OTE Group Mobility data of 2019–2021 in the area of Thessaloniki, Greece. The first dataset, that of 2019, comes first. As seen in Figure 22, the driver “driver-20231004114021-0000” carries the task of running the Pre-Processing and Filtering Tool to the dataset:
Figure 22. Screenshot from Apache Spark Cluster WebUI, for the Mobility dataset of 2019, with 6.9 million objects.
The layer completes the processing, filtering, cleaning, and storing of the dataset in about 3.7 min, as seen in the driver’s logs (Figure 23). This means that 2.8 GB and 6.9 million documents were parsed, edited and saved in under 4 min, which is a small amount of time, given the series of tasks involved in the process.
Figure 23. Screenshot from “driver-20231004114021-0000” Spark cluster driver’s logs, regarding the Mobility 2019 dataset.
Then, the layer is being tested with the Mobility dataset of 2020. The driver responsible for the completion of the whole process is named “driver-20231004114951-0001”. As always, the driver is triggered by an API call, known to the OTE Engineers who wish to initiate BigDaM. Figure 24 shows the Spark cluster WebUI’s state:
Figure 24. The Apache Spark Cluster WebUI, showing the driver “driver-20231004114951-0001” in running state, for the Mobility dataset of 2020.
From the driver’s logs (Figure 25), it can be seen that the 2020 Mobility dataset, containing 10.1 million documents and having a size of 4.1 GB, was properly pre-processed, filtered, cleaned, and stored in 5.3 min, which can be described as a very reasonable amount of time. BigDaM’s efficiency seems to be independent of the nature of each dataset. However, it is worth noting this applies to tabular datasets, since this is the type and form several critical infrastructure sectors generate their data on.
Figure 25. Screenshot from the logs of driver “driver-20231004114951-0001”, for the Mobility 2020 dataset.
Moving on to the Mobility dataset of 2021, this is the smallest of the Mobility ones, since it contains 5.7 million documents and takes 2.4 GB of disk space (as stated earlier). The driver responsible for the set’s appliance to the Pre-Processing and Filtering Tool is named “driver-20231004115659-0002”, as seen in Figure 26 below:
Figure 26. Screenshot from the Apache Spark Cluster WebUI, where the driver “driver-20231004115659-0002” is shown active, for the Mobility dataset of 2021.
The process is completed in about 3 and a half minutes, once again highlighting BigDaM’s efficiency (Figure 27). For the Mobility datasets, testing took part in chronological order, rather than ascending sizing order (similar to the Customs datasets before). This is because the datasets were tested in the same order they were received from OTE Group.
Figure 27. Screenshot from the logs of driver “driver-20231004115659-0002”, which handled the Mobility 2021 dataset.
Last but not least, the Data Abstraction and Virtualization layer was tested on the custom fused Mobility dataset, which included all the previous three. As a kind reminder, it includes 22.8 million documents and takes 9.2 GB of disk space. The driver that applied the Pre-Processing and Filtering Tool to our dataset is named “driver-20231004120403-0003”, as seen in Figure 28 below:
Figure 28. Screenshot from the Apache Spark Cluster WebUI, where the driver “driver-20231004120403-0003” is evidently active, for the custom Mobility dataset.
Based on the driver’s logs in Figure 29, the whole process was completed in under 11 min (10.78 to be exact). The result further highlights BigDaM’s efficient operation and points that it can be an optimal framework, regardless of the CI dataset source.
Figure 29. Screenshot from the driver’s “driver-20231004120403-0003”, as it completed the process for the custom fused dataset.
At this point, the performance evaluation phase is over. It is now evident that, throughout the testing period, the completion time grows linearly, in relation to the input. This can be seen in Figure 30, Figure 31 and Figure 32, where the results are presented in three scatter plots. The first plot presents the time taken (in minutes) for each of the ITI Customs and OTE Mobility datasets (in different lines), in relation to their sizes (in GB). The final Customs dataset of 55.4 GB is not included in this plot. The second plot includes all the same tests but in one plot line, whilst the third and final plot also includes the final Customs dataset. All three plots can be seen below:
Figure 30. First scatter plot with the tests of ITI Customs and OTE Mobility datasets in different plot lines.
Figure 31. Second scatter plot with all tests in the same plot line.
Figure 32. Third scatter plot which includes the final ITI Customs dataset.
The linear growth of completion time, related to the input can be confirmed. More specifically, it seems that with every minute that passes, about 1 GB of data are being processed, filtered, cleaned, and stored. As the size in GB increases, completion time (in minutes) increases linearly. This was also the “acceptance threshold” that was set as the main criteria for a successful implementation. If the framework was able to operate at a “1 Gigabyte per 1 min” completion speed, then it would meet the research team’s expectations, which came to be true. In addition, it should also be noted that the Data Processing and Virtualization layer did not experience any performance drops, nor did it fail to complete a task/test. Regardless of the input’s size, it kept being operational. It is also important to mention that each Spark driver used only 5 GB of RAM and 6 CPU cores from the system, highlighting the proposed architecture’s efficiency.

8. Conclusions

The unique characteristics of critical infrastructures highlight the necessity for a middleware that formulates data in a manner conducive to accurate analysis. Additionally, services should be refactored in advance to achieve the desired interoperability between interconnected components. The BigDaM proposal adopts a data-centric approach by design, offering a solution where SMEs, telecom operators, data providers, service content creators, transportation authorities, and other CI representatives can collaborate and coexist within a harmonious data-sharing environment. This achievement stands as the primary objective for frameworks aspiring to establish and populate an ecosystem capable of attracting companies, startups, and individual developers.
This paper’s proposal, BigDaM, is designed to address the critical challenges of data quality, harmonization, and efficiency that critical infrastructures face in the modern digital era. Leveraging two software layers that cooperate with each other and exploit each other’s capabilities (Data Interoperability and Data Processing and Virtualization layer), BigDaM employs sophisticated data cleansing techniques to ensure data accuracy, completeness, and consistency across various sources. Performance results in both the Data Interoperability and the Data Processing and Virtualization layers, tested in the port of Valencia (using real Customs datasets) and the metropolitan area of Thessaloniki (using anonymized cellular network Mobility data), prove that both models, and therefore BigDaM as a whole, can be evaluated in additional real-world scenarios. Since this current journal is a continuation of an existing work [10], as mentioned at the beginning of Section 2, it is safe to assume that it has achieved its goal of further expanding and exploring BigDaM’s potential as a big data management framework for critical infrastructures.
However, additional research must be conducted in order to further improve BigDaM and also prove that it can be used in more than one critical infrastructure sector (that is, apart from the ports). The proof-of-concept testing using telecommunications data from the OTE group further justifies this sentence. In addition, BigDaM should be tested in the industry section as well. Future work and implementations should focus on the long-term feasibility of incorporating frameworks like BigDaM in CI sectors and evaluate the overall impact. The European Union (through its research projects) should continue to focus on Big-Data-driven applications, but should also aim for more product-ready solutions. The same goes for any research team around the globe that wishes to explore the field of CI-generated big data management. Future frameworks should be thoroughly tested in several critical infrastructure sectors in order to make sure that such architectures are indeed capable of handling large amounts of data coming from different sources and varying (maybe greatly) in terms of structure, type, and format. The main current limitation of BigDaM is that it has not been structured for sets other than tabular data. This has to be further examined in the future, modifying the architecture and allowing for an opening in data types and formats, as mentioned before. Last but not least, BigDaM has shown that big data management frameworks can prove to be very useful, but only in a specific CI sector. This article’s authoring team shall continue to conduct research on big data management and analysis solutions by participating in the European Union’s “Datamite” research project [53]. It will seek to improve BigDaM and further test it in other CI infrastructures.
By seamlessly integrating disparate data sets, BigDaM enables a level of harmonization, empowering data specialists and other potential recipients to derive meaningful insights and make informed decisions with a holistic view of their operations. Moreover, the framework’s streamlined data processing pipelines and distributed computing architecture foster improved efficiency, enabling quality in data processing and analytics extraction. With BigDaM, CIs can explore the full potential of their data resources, unlocking new avenues for growth, innovation, and success in today’s data-driven world.

Author Contributions

Conceptualization, A.N., A.M., M.J.S. and A.B.P.; Methodology, A.N. and A.M.; Software, A.N., M.J.S. and A.B.P.; Formal analysis, M.J.S.; Investigation, A.B.P.; Resources, A.B.P., M.K. and K.N.; Data curation, M.K.; Writing—original draft, A.N.; Writing—review & editing, A.N., M.J.S. and A.B.P.; Visualization, M.J.S.; Supervision, A.N.; Project administration, T.V.; Funding acquisition, C.-A.G. and K.N. All authors have read and agreed to the published version of the manuscript.

Funding

This research received no external funding.

Data Availability Statement

Data available on request due to restrictions eg privacy or ethical. The data presented in this study are available on request from the corresponding author. The data are not publicly available due to limitations from the issuing authorities.

Acknowledgments

The research leading to these results has received funding from the European Commission under the H2020 Programme’s project DataPorts (Grant Agreement No. 871493).

Conflicts of Interest

The authors declare no conflict of interest.

References

  1. Rinaldi, S.M. Modeling and simulating critical infrastructures and their interdependencies. In Proceedings of the 37th Annual Hawaii International Conference on System Sciences, Big Island, HI, USA, 5–8 January 2004; p. 8. [Google Scholar]
  2. Moteff, J.D.; Copeland, C.; Fischer, J.W.; Resources, S.; Division, I. Critical Infrastructures: What Makes an Infrastructure Critical? Congressional Research Service, Library of Congress: Washington, DC, USA, 2003. [Google Scholar]
  3. Steve Sutch, V. Understanding and Securing our Nation’s Critical Infrastructure. Available online: https://www.valentisinc.com/blog/understanding-and-securing-our-nations-critical-infrastructure (accessed on 3 October 2023).
  4. Bill Sweet, I.S. The Smart Meter Avalanche. Available online: https://spectrum.ieee.org/the-smart-meter-avalanche#toggle-gdpr (accessed on 3 October 2023).
  5. Nate Cochrane, I.N.A. US Smart Grid to Generate 1000 Petabytes of Data a Year. Available online: https://www.itnews.com.au/news/us-smart-grid-to-generate-1000-petabytes-of-data-a-year-170290 (accessed on 3 October 2023).
  6. Dynamics, D. Analyzing Energy Consumption: Unleashing the Power of Data in the Energy Industry. Available online: https://www.datadynamicsinc.com/blog-analyzing-energy-consumption-unleashing-the-power-of-data-in-the-energy-industry/ (accessed on 3 October 2023).
  7. Big Data and Transport Understanding and Assessing Options—International Transport Forum. Available online: https://www.itf-oecd.org/sites/default/files/docs/15cpb_bigdata_0.pdf (accessed on 3 October 2023).
  8. Jiang, W.; Luo, J. Big data for traffic estimation and prediction: A survey of data and tools. Appl. Syst. Innov. 2022, 5, 23. [Google Scholar] [CrossRef]
  9. Zahid, H.; Mahmood, T.; Morshed, A.; Sellis, T. Big data analytics in telecommunications: Literature review and architecture recommendations. IEEE/CAA J. Autom. Sin. 2019, 7, 18–38. [Google Scholar] [CrossRef]
  10. Marinakis, A.; Segui, M.J.; Pellicer, A.B.; Palau, C.E.; Gizelis, C.A.; Nikolakopoulos, A.; Misargopoulos, A.; Nikolopoulos-Gkamatsis, F.; Kefalogiannis, M.; Varvarigou, T.; et al. Efficient Data Management and Interoperability Middleware in Business-Oriented Smart Port Use Cases. In Proceedings of the IFIP International Conference on Artificial Intelligence Applications and Innovations, León, Spain, 14–17 June 2022; Springer: Berlin/Heidelberg, Germany, 2022; pp. 108–119. [Google Scholar]
  11. DataPorts Horizon 2020 EU Research Project. Available online: https://dataports-project.eu/ (accessed on 3 October 2023).
  12. Palau, C.E.; Fortino, G.; Montesinos, M.; Exarchakos, G.; Giménez, P.; Markarian, G.; Castay, V.; Fuart, F.; Pawłowski, W.; Mortara, M.; et al. Interoperability of Heterogeneous IoT Platforms; Springer: Berlin/Heidelberg, Germany, 2021. [Google Scholar]
  13. Transforming Transport—Presentation. Available online: https://transformingtransport.eu/sites/default/files/2017-07/TTBROCHUREWEB.pdf (accessed on 3 October 2023).
  14. European Sea Ports Organisation—Conference. Available online: https://www.espo.be/ (accessed on 3 October 2023).
  15. International Association of Ports and Harbors. Available online: https://www.iaphworldports.org (accessed on 3 October 2023).
  16. The Worldwide Network of Port Cities. Available online: http://www.aivp.org/en/ (accessed on 4 October 2023).
  17. Drougkas, A.; Sarri, A.; Kyranoudi, P.; Zisi, A. Port Cybersecurity. Good practices for cybersecurity in the maritime sector. ENSISA 2019, 10, 328515. [Google Scholar]
  18. Kim, J.; Son, J.; Yoon, K. An implementation of integrated interfaces for telecom systems and TMS in vessels. Int. J. Eng. Technol. 2018, 10, 195–199. [Google Scholar] [CrossRef]
  19. The Marketplace of the European Innovation Partnership on Smart Cities and Communities. Available online: https://eu-smartcities.eu/ (accessed on 4 October 2023).
  20. BigDataStack H2020 Project. Available online: https://www.bigdatastack.eu (accessed on 4 October 2023).
  21. SmartShip H2020 Project. Available online: https://www.smartship2020.eu/ (accessed on 4 October 2023).
  22. Baek, J.; Vu, Q.H.; Liu, J.K.; Huang, X.; Xiang, Y. A secure cloud computing based framework for big data information management of smart grid. IEEE Trans. Cloud Comput. 2014, 3, 233–244. [Google Scholar] [CrossRef]
  23. Kaur, K.; Garg, S.; Kaddoum, G.; Bou-Harb, E.; Choo, K.K.R. A big data-enabled consolidated framework for energy efficient software defined data centers in IoT setups. IEEE Trans. Ind. Inform. 2019, 16, 2687–2697. [Google Scholar] [CrossRef]
  24. Luckow, A.; Kennedy, K.; Manhardt, F.; Djerekarov, E.; Vorster, B.; Apon, A. Automotive big data: Applications, workloads and infrastructures. In Proceedings of the 2015 IEEE International Conference on Big Data (Big Data), Santa Clara, CA, USA, 30 March–2 April 2015; pp. 1201–1210. [Google Scholar]
  25. Apache Hadoop—Framework. Available online: https://hadoop.apache.org (accessed on 4 October 2023).
  26. Dinov, I.D. Methodological challenges and analytic opportunities for modeling and interpreting Big Healthcare Data. Gigascience 2016, 5, s13742-016. [Google Scholar] [CrossRef] [PubMed]
  27. Bhat, S.A.; Huang, N.F.; Sofi, I.B.; Sultan, M. Agriculture-food supply chain management based on blockchain and IoT: A narrative on enterprise blockchain interoperability. Agriculture 2021, 12, 40. [Google Scholar] [CrossRef]
  28. Donta, P.K.; Sedlak, B.; Casamayor Pujol, V.; Dustdar, S. Governance and sustainability of distributed continuum systems: A big data approach. J. Big Data 2023, 10, 53. [Google Scholar] [CrossRef]
  29. Ganzha, M.; Paprzycki, M.; Pawłowski, W.; Solarz-Niesłuchowski, B.; Szmeja, P.; Wasielewska, K. Semantic Interoperability. In Interoperability of Heterogeneous IoT Platforms: A Layered Approach; Palau, C.E., Fortino, G., Montesinos, M., Exarchakos, G., Giménez, P., Markarian, G., Castay, V., Fuart, F., Pawłowski, W., Mortara, M., et al., Eds.; Springer International Publishing: Cham, Switzerland, 2021; pp. 133–165. [Google Scholar] [CrossRef]
  30. Smart Data Models. Available online: https://github.com/smart-data-models (accessed on 4 October 2023).
  31. Bader, S.; Pullmann, J.; Mader, C.; Tramp, S.; Quix, C.; Müller, A.W.; Akyürek, H.; Böckmann, M.; Imbusch, B.T.; Lipp, J.; et al. The International Data Spaces Information Model—An Ontology for Sovereign Exchange of Digital Content. In International Semantic Web Conference; Springer International Publishing: Cham, Switzerland, 2020; pp. 176–192. [Google Scholar] [CrossRef]
  32. UN/CEFACT standards|UNECE. Available online: https://unece.org/trade/uncefact/mainstandards (accessed on 4 October 2023).
  33. BITA Standards Council (BITA)—Global Blockchain Business Council. Available online: https://gbbcouncil.org/bita-standards-council/ (accessed on 4 October 2023).
  34. Track & Trace|Container Shipping|DCSA. Available online: https://dcsa.org/standards/track-trace/ (accessed on 4 October 2023).
  35. IPSO Smart Objects—OMA SpecWorks. Available online: https://omaspecworks.org/develop-with-oma-specworks/ipso-smart-objects/ (accessed on 4 October 2023).
  36. SAREF: The Smart Applications REFerence Ontology. Available online: https://saref.etsi.org/core/v3.1.1/ (accessed on 4 October 2023).
  37. FIWARE—Open APIs for Open Minds. Available online: https://www.fiware.org/ (accessed on 4 October 2023).
  38. Privat, G.; Medvedev, A. Guidelines for Modelling with NGSI-LD. ETSI White Pap. 2021. [Google Scholar]
  39. ETSI-CIM. Available online: https://www.etsi.org/committee/cim (accessed on 4 October 2023).
  40. DataPorts Common Data Model. Available online: https://github.com/DataPortsProject/datamodel (accessed on 4 October 2023).
  41. pyngsi · PyPI. Available online: https://pypi.org/project/pyngsi/ (accessed on 4 October 2023).
  42. Fiware-Orion. Available online: https://fiware-orion.readthedocs.io/en/master/ (accessed on 4 October 2023).
  43. Fiware-Cygnus. Available online: https://fiware-cygnus.readthedocs.io/en/latest/ (accessed on 4 October 2023).
  44. Apache Flume. Available online: https://flume.apache.org/ (accessed on 4 October 2023).
  45. Apache Spark-Framework. Available online: https://spark.apache.org (accessed on 4 October 2023).
  46. García-Gil, D.; Ramírez-Gallego, S.; García, S.; Herrera, F. A comparison on scalability for batch big data processing on Apache Spark and Apache Flink. Big Data Anal. 2017, 2, 1. [Google Scholar] [CrossRef]
  47. MongoDB-Framework. Available online: https://www.mongodb.com (accessed on 4 October 2023).
  48. Kubernetes-Framework. Available online: https://kubernetes.io (accessed on 4 October 2023).
  49. Karypiadis, E.; Nikolakopoulos, A.; Marinakis, A.; Moulos, V.; Varvarigou, T. SCAL-E: An Auto Scaling Agent for Optimum Big Data Load Balancing in Kubernetes Environments. In Proceedings of the 2022 International Conference on Computer, Information and Telecommunication Systems (CITS), Piraeus, Greece, 13–15 July 2022; pp. 1–5. [Google Scholar]
  50. Apache NiFi-Framework. Available online: https://nifi.apache.org (accessed on 4 October 2023).
  51. Apache Kafka-Framework. Available online: https://kafka.apache.org (accessed on 4 October 2023).
  52. OTE Group-Telecommunications Provider. Available online: https://www.cosmote.gr/cs/otegroup/en/omilos_ote.html (accessed on 3 October 2023).
  53. Datamite European H2020 Project. Available online: https://datamite-horizon.eu (accessed on 3 October 2023).
Disclaimer/Publisher’s Note: The statements, opinions and data contained in all publications are solely those of the individual author(s) and contributor(s) and not of MDPI and/or the editor(s). MDPI and/or the editor(s) disclaim responsibility for any injury to people or property resulting from any ideas, methods, instructions or products referred to in the content.

Article Metrics

Citations

Article Access Statistics

Multiple requests from the same IP address are counted as one view.