Simple Summary
Pancreatic cancer is often detected too late, leading to very low survival rates. Screening everyone is not practical due to the disease’s rarity and high costs. This study explores a new approach: using artificial intelligence (AI) to analyze patients’ existing electronic health records—like doctor’s visit notes and lab results—to identify those at high risk of pancreatic cancer long before symptoms appear. By systematically reviewing existing research, we aimed to determine how accurate these AI tools are. Our findings show they hold significant promise for early detection, which could allow doctors to monitor high-risk patients more closely and ultimately save lives by catching the cancer at a treatable stage. However, challenges such as the potential for false-positive results and the need for further validation in diverse clinical settings must be addressed before its widespread use in clinical practice.
Abstract
Background: The persistently low 5-year survival rate for pancreatic cancer (PC) underscores the critical need for early detection. However, population-wide screening remains impractical. Artificial Intelligence (AI) models using electronic health record (EHR) data offer a promising avenue for pre-symptomatic risk stratification. Objective: To systematically review and meta-analyze the performance of AI models for PC prediction based exclusively on structured EHR data. Methods: We systematically searched PubMed, MedRxiv, BioRxiv, and Google Scholar (2010–2025). Inclusion criteria encompassed studies using EHR-derived data (excluding imaging/genomics), applying AI for PC prediction, reporting AUC, and including a non-cancer cohort. Two reviewers independently extracted data. Random-effects meta-analysis was performed for AUC, sensitivity (Se), and specificity (Sp) using R software version 4.5.1. Heterogeneity was assessed using I2 statistics and publication bias was evaluated. Results: Of 946 screened records, 19 studies met the inclusion criteria. The pooled AUC across all models was 0.785 (95% CI: 0.759–0.810), indicating good overall discriminatory ability. Neural Network (NN) models demonstrated a statistically significantly higher pooled AUC (0.826) compared to Logistic Regression (LogReg, 0.799), Random Forests (RF, 0.762), and XGBoost (XGB, 0.779) (all p < 0.001). In analyses with sufficient data, models like Light Gradient Boosting (LGB) showed superior Se and Sp (99% and 98.7%, respectively) compared to NNs and LogReg, though based on limited studies. Meta-analysis of Se and Sp revealed extreme heterogeneity (I2 ≥ 99.9%), and the positive predictive values (PPVs) reported across studies were consistently low (often < 1%), reflecting the challenge of screening a low-prevalence disease. Conclusions: AI models using EHR data show significant promise for early PC detection, with NNs achieving the highest pooled AUC. However, high heterogeneity and typically low PPV highlight the need for standardized methodologies and a targeted risk-stratification approach rather than general population screening. Future prospective validation and integration into clinical decision-support systems are essential.
1. Introduction
Despite advances in the diagnosis and treatment of malignant neoplasms, the prognosis for pancreatic cancer (PC) remains poor. The five-year survival rate persists at 3–15%, which is largely attributable to the fact that the disease is frequently diagnosed at advanced stages and current systemic treatments have limited effectiveness [1,2]. Although early detection of PC is crucial, the implementation of population-wide screening or early diagnostic programs faces several substantial obstacles [3]. Despite its high mortality, PC is a relatively rare disease. Its low prevalence, combined with the high cost and limited availability of specialized imaging modalities, makes screening of asymptomatic adults impractical [4].
To improve early detection of pancreatic cancer, researchers have increasingly turned to advanced computational approaches for risk assessment and stratification. In recent years, artificial intelligence (AI) has emerged as a powerful tool for the early detection of cancers and other diseases [5,6,7]. In several oncological fields, AI algorithms have demonstrated promising results, not only in improving screening efficacy but also in stratifying the risk of cancer development and progression, thereby identifying high-risk groups [8]. Furthermore, a number of AI-based diagnostic systems have been approved for the automated and non-invasive detection of diseases using medical data in clinical practice [9].
AI algorithms have been applied to the diagnosis of malignancies using clinical and molecular data, as well as via image analysis through radiomics-based techniques [10]. Of particular interest are AI models and algorithms constructed using textual, numerical, and binary variables extracted from electronic medical records (EMRs) [5,11]. This approach is relatively novel and highly feasible for implementation in real-world clinical practice. Unlike methods requiring specialized, non-routine tests or advanced imaging, EMR-based AI models can be seamlessly integrated into existing healthcare systems, offering a scalable and accessible tool for risk stratification and early detection. Nevertheless, the number of studies dedicated to this topic remains limited.
The objective of this study was to describe and comparatively evaluate different artificial intelligence approaches employed for the early diagnosis of pancreatic cancer using data derived from EMRs.
2. Methods
2.1. Search Strategy
We conducted a comprehensive literature search covering the last fifteen years (2010–2025) across four major online databases: PubMed, MedRxiv, BioRxiv, and Google Scholar. The primary search queries included the following terms: “application of artificial intelligence for pancreatic cancer screening based on database information,” “artificial intelligence and medical records data and pancreatic cancer and screening,” “(‘big data’ OR ‘machine learning’ OR ‘deep learning’ OR ‘artificial intelligence’ OR ‘AI’ OR ‘radiomics’) AND (‘cancer screening’ OR ‘tumor screening’ OR ‘neoplasm screening’ OR ‘oncology screening’ OR ‘early diagnosis’) AND (‘pancreatic cancer’),” “(artificial intelligence for pancreatic cancer screening); (artificial intelligence) AND (cancer screening); (((artificial intelligence) AND (screening)) AND (oncology)) AND (early diagnosis),” “AI-based early detection of pancreatic cancer,” “machine learning in pancreatic cancer screening,” “predictive analytics for pancreatic cancer.”
2.2. Inclusion and Exclusion Criteria
Studies were eligible for inclusion if they met the following criteria: utilization of EMR-derived data exclusively, without incorporating other data modalities (e.g., radiological imaging, molecular profiling); application of artificial intelligence methods as the primary analytical approach; availability of sufficient outcome data to enable performance assessment—specifically, AUC/AUROC metrics; a study objective focused on early detection of pancreatic cancer, which required inclusion of a population without pre-existing pancreatic cancer. Studies were excluded if they met any of the following criteria: published only as letters or abstracts; lacked quantitative performance metrics, used AI only for data extraction rather than prediction, included only patients with confirmed cancer, without a non-cancer comparison group. We followed the Preferred Reporting Items for Systematic Reviews and Meta-Analyses (PRISMA) guidelines [12]. This study was registered in PROSPERO, registration number is CRD420261280741.
2.3. Data Extraction
Two researchers independently screened the literature. The following information was extracted from each eligible study: country of origin; data source, including the specific databases and repositories used; type and specific architecture of the AI models; validation methods employed; target outcomes and study design; study population characteristics; type of data inputs; number of patients with pancreatic cancer; total sample size. Performance metrics extracted included: sensitivity (Se), specificity (Sp), AUROC/C-index, NPV (negative predictive value), and PPV (positive predictive value). Additionally, bibliographies of relevant reviews, articles, and monographs were screened for supplemental references. Any discrepancies were resolved through discussion and consensus.
2.4. Statistical Analysis and Quality Appraisal
Descriptive and qualitative comparisons of the extracted data were used to summarize differences across AI approaches and methodological frameworks. Meta-analysis and data visualization were conducted using R version 4.5.1 (R Foundation for Statistical Computing), employing the metafor package (version 4.8-0). Random-effects models were applied to obtain pooled estimates of predictive performance and 95% prediction intervals. Fixed-effects models were used for meta-regression analyses and for obtaining pooled estimates within predefined algorithm categories. Heterogeneity across included studies was assessed using Cochran’s Q statistic and the I2 index. For meta-analyses including five or more studies, publication bias was evaluated using funnel plots and Egger’s regression test. Given the anticipated high heterogeneity in sensitivity and specificity estimates, we initially employed univariate random-effects meta-analysis. However, we acknowledge that bivariate models (such as HSROC (Hierarchical Summary Receiver Operating Characteristic)) are more appropriate for diagnostic accuracy meta-analyses and recommend their use in future studies when sufficient data are available.
The methodological quality of the studies included in the systematic review was assessed using the Newcastle–Ottawa Scale [13]. The authors evaluated each study by applying the Newcastle–Ottawa Scale criteria across three domains: selection of participants, comparability of groups, and outcome ascertainment. A point was awarded for each criterion that was fully met, while no points were given for unmet or partially met criteria. In accordance with the Agency for Healthcare Research and Quality guidelines, the overall quality of each study was then translated into a rating of “poor”, “fair”, or “good” based on the total score.
3. Results
3.1. Characteristics of the Included Studies
A total of 946 records were identified through database searches. The study selection process is depicted in Figure 1, and detailed characteristics of the studies included in the analysis are presented in Table 1. Nineteen studies met the predefined inclusion criteria. Most of the included studies were retrospective cohort analyses employing internal validation strategies, such as train–test split of the available datasets. Across all studies, the primary outcome measure was consistent—either the diagnosis of pancreatic cancer or the time to diagnosis (Table 1). All studies relied exclusively on EMR-derived data, which included clinical documentation related to healthcare encounters; in several cases, socio-demographic survey data were also incorporated.
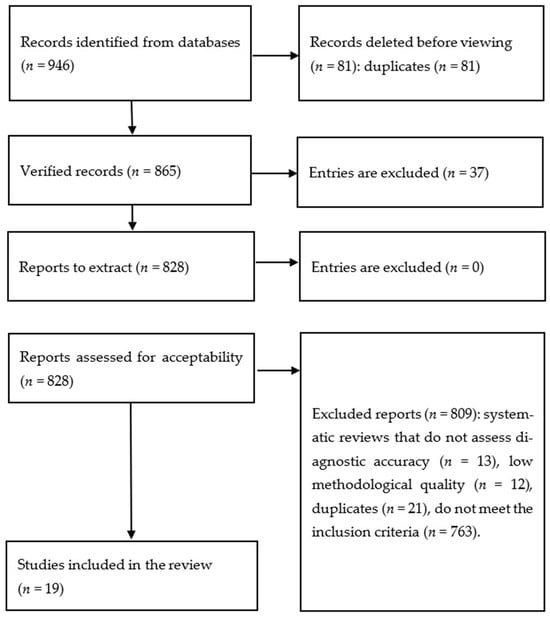
Figure 1.
Study selection methodology.
For a clearer understanding of the role and future potential of AI in early cancer detection, it is important to distinguish between two related terms—machine learning (ML) and deep learning (DL). Machine learning refers to a broad class of algorithms capable of learning from data and improving their predictive performance over time. Deep learning, by contrast, is a specialized subset of ML that utilizes complex multilayer neural networks capable of capturing intricate nonlinear relationships [14]. For clarity, Table 1 lists ML and DL as separate AI categories, although DL is technically a subset of ML. Across the included studies, a variety of AI algorithms were used, including XGBoost (XGB), Random Forests (RFs), logistic regression (LogReg), ensemble models, neural networks (NNs), and Light Gradient Boosting (LGB).

Table 1.
Summary of studies on AI-based early detection of pancreatic cancer using EMR data.
Table 1.
Summary of studies on AI-based early detection of pancreatic cancer using EMR data.
| Reference | AI Type | AI Models | Outcome Measures | Population Characteristics | PC Cases (n) | Total Sample (n) | Model Performance Metrics |
|---|---|---|---|---|---|---|---|
| Chen, Q. et al. [15] | ML | XGBoost | Diagnosis of PC; ability to distinguish early-stage PC patients from matched controls | Early-stage PC defined as surgically managed cases; controls matched by region and observation period | 3322 | 53,152 | Se = 60%, Sp = 89.8%, PPV = 0.07%, AUC = 0.84 (95% CI: 0.83–0.85) |
| Chen, W., Zhou, Y., Xie, F. et al. [16] | ML | Random Forest | Detection of PC or PC-related death within 18 months | Adults aged 50–84 years with ≥1 clinical visit during 2008–2017; continuous enrollment ≥ 12 months prior to index date | 1792 | 1,801,931 | Se = 56.6%, Sp = 79.6%, PPV = 1.1%, C-index = 0.77 |
| Matchaba, S. et al. [17] | ML | Ensemble Model | PC diagnosis predicted 1–2 years prior to clinical diagnosis | Patients with ≥3 healthcare interactions | 8438 | 18,987 | Se = 85.61%, Sp = 76.18%, PPV = 1.1%, AUC = 0.89 |
| Appelbaum, L. et al. [11] | ML | Logistic Regression, Neural Network | PC diagnosis predicted 180, 270, and 365 days prior to clinical diagnosis | Patients with ≥6 months of observation prior to diagnosis (cases) or prior to last visit (controls) | 594 | 101,381 | AUROC = 0.71 (95% CI: 0.67–0.76), PPV = 0.93% |
| Park, J. et al. [18] | DL | LogReg, NN, Random Masking, XGB, Black-box model | PC diagnosis predicted within 12 months | Patients with ≥1 documented risk factor (smoking, obesity, diabetes, chronic pancreatitis); exclusion of those undergoing treatment for chronic pancreatitis | 834 | 9057 | AUROC: LogReg 0.491; XGB 0.501; Black-box 0.644; NN (no masking) 0.649; NN + Random Masking 0.671 |
| Chen, W., Butler, R. et al. [19] | ML | Random Forest | PC diagnosis or death from PC within 3 years after elevated HbA1c | Adults aged 50–84 years with ≥1 elevated HbA1c; exclusion of diabetes patients | 319 | 109,266 | Se = 60%, Sp = 80.3%, PPV = 2.5%, AUROC = 0.812 |
| Malhotra, A. et al. [5] | ML | LogReg, RF | Binary classification: PC case vs. control with unrelated cancer | Patients aged 15–99 with primary PC; controls with other cancers | 1139 | 5695 | Se = 65%, Sp = 57%, AUC = 61%, PPV = 32.5% |
| Hsieh, M. et al. [20] | ML | LogReg, NN | PC diagnosis among patients with type 2 diabetes | Adults > 20 years with newly diagnosed type 2 diabetes; exclusion of those with prior PC | 3092 | 1,358,634 | PPV: LogReg 0.995, NN 0.996; AUROC: LogReg 0.727, NN 0.605 |
| Muhammad, W. et al. [21] | DL | Neural Network | Binary: PC diagnosis within 4 years of survey | General population; PC diagnosed < 4 years before survey | 898 | 800,114 | Se = 87.3%, Sp = 80.8%, AUROC = 0.86, NPV = 99.997%, PPV = 0.1% |
| Placido, D. et al. [22] | DL | Transformer | Risk of PC at 3, 6, 12, 36, and 60 months | General population; archival EMRs | 26,403 | 8,123,446 | AUC = 0.879, PPV = 0.32% |
| Xiaodong, Li et al. [23] | ML, DL | XGB + Deep NN | PC diagnosis within a 24-month prediction window | Adults ≥ 35 years seeking medical care | 4361 | 265,225 | Se = 54.35%, AUROC = 0.809, PPV = 67.62% |
| Zhao, D. et al. [24] | ML | Weighted Bayesian Network Inference | Binary: PC vs. non-PC | Randomly selected controls plus symptomatic non-PC patients | 98 | 15,069 | Se = 84.7%, Sp = 85.2%, AUROC = 0.910 |
| Chen, W., Zhou, B., Jeon, C. et al. [25] | ML | RF, XGB | Time-to-event: PC diagnosis or PC-related death within 18 months | Adults aged 50–84, ≥1 clinical visit, no prior PC | 1792 | 1,800,000 | RF: AUC 0.767; XGB: AUC 0.779; PPV ≈1% |
| Jia, K. et al. [26] | ML | PrismNN, LogReg | PC risk prediction 6–18 months after index date | Adults > 40 with ≥16 records over 2 years | 35,387 | 1,535,468 | PrismNN: Se = 35.9%, Sp = 95.3%, AUROC = 0.826; LogReg: AUROC = 0.800 |
| Cichosz, S. et al. [27] | ML | Random Forest | PC development within 3 years after diabetes onset | Adults > 50 with new-onset diabetes | 716 | 1432 | AUROC = 0.74; Se 21.4% at high specificity; NPV up to 99.8% |
| Shih-Min Chen et al. [28] | ML | Linear Discriminant Analysis | PC diagnosis within 4 years post anti-diabetes therapy | Type 2 diabetes patients ≥ 40 years | 89 | 66,384 | Se 86.11%, Sp 84.03%, AUROC 0.907, PPV 0.02% |
| Zhichao Yang et al. [29] | DL | NN, Transformer | Disease-/Outcome-agnostic prediction: all ICD oncology codes at next visit | General healthcare-seeking population; PC subgroup ≥ 45 years without other cancers | 4639 | 6,475,218 | AUROC = 0.82, PPV = 8.8% |
| Zhu, W. et al. [30] | ML | Elastic-Net Regularized LogReg | PC diagnosis within 2.5–3 years | Adults with ≥3 years of continuous EMR data | 1932 | 53,741 | At 1st percentile threshold: Se = 6.78%, Sp = 99.01%, NPV = 99.93%, PPV = 0.65%, AUROC = 0.742 |
| Akmeşe, Ö. et al. [31] | ML | LGBM, Bagging, CatBoost and others | Binary: PC vs. non-PC | PC-patients, non-cancerous (benign) pancreatic/hepatobiliary disease patients, healthy controls. In addition to clinical data, laboratory data were also used | 199 | 590 | LGBM (Best Model): accuracy = 98.8%, precision = 99%, recall = 99%, F1-Score = 0.99, Se = 99%, Sp = 98.7% |
3.2. Quality Assessment
The methodological quality of the included studies, assessed using the Newcastle–Ottawa Scale, was variable but generally acceptable for observational research (Table 2). The majority of the studies demonstrated an adequate design regarding participant selection and outcome assessment, receiving a rating of “good” or “fair” in terms of Methodological Quality. However, some heterogeneity was noted, particularly in the comparability of study groups and control for confounding factors.
Table 2.
Study quality appraisal outcomes using the Newcastle–Ottawa Scale.
Table 2.
Study quality appraisal outcomes using the Newcastle–Ottawa Scale.
| Study | Selection (/4) | Comparability (/2) | Outcome (/3) | Methodological Quality |
|---|---|---|---|---|
| Chen, Q. et al. [15] | 4 | 0 | 2 | 6 (Fair) |
| Chen, W., Zhou, Y., Xie, F. et al. [16] | 4 | 1 | 2 | 7 (Fair) |
| Matchaba, S. et al. [17] | 4 | 0 | 2 | 6 (Fair) |
| Appelbaum, L. et al. [11] | 4 | 1 | 2 | 7 (Fair) |
| Park, J. et al. [18] | 4 | 2 | 3 | 9 (Good) |
| Chen, W., Butler, R. et al. [19] | 4 | 2 | 3 | 9 (Good) |
| Malhotra, A. et al. [5] | 4 | 2 | 3 | 9 (Good) |
| Hsieh, M. et al. [20] | 4 | 2 | 3 | 9 (Good) |
| Muhammad, W. et al. [21] | 4 | 2 | 2 | 8 (Good) |
| Placido, D. et al. [22] | 4 | 2 | 2 | 8 (Good) |
| Xiaodong Li et al. [23] | 3 | 0 | 2 | 5 (Poor) |
| Zhao, D. et al. [24] | 4 | 2 | 3 | 9 (Good) |
| Chen, W., Zhou, B., Jeon, C. et al. [25] | 4 | 2 | 2 | 8 (Good) |
| Jia, K. et al. [26] | 4 | 2 | 2 | 8 (Good) |
| Cichosz, S. et al. [27] | 4 | 1 | 3 | 8 (Good) |
| Shih-Min Chen et al. [28] | 4 | 2 | 2 | 8 (Good) |
| Zhichao Yang et al. [29] | 4 | 2 | 2 | 8 (Good) |
| Zhu, W. et al. [30] | 3 | 1 | 3 | 7 (Fair) |
| Akmeşe, Ö. et al. [31] | 3 | 0 | 2 | 5 (Poor) |
3.3. Meta-Analytic Assessment of AUC
Not all studies provided adequate data for inclusion in the AUC meta-analysis. Table 3 and Figure 2 summarize the pooled AUC results. The overall pooled AUC using a random-effects model was 0.785 [95% CI: 0.759–0.810], with a 95% prediction interval ranging from 0.716 to 0.853. There was substantial heterogeneity across studies (I2 = 99.5%, Q(df) = 458.6, p < 0.001). No strong evidence of publication bias was identified (β = 0.82; [95% CI: 0.80–0.84]; p = 0.406).
Table 3.
Meta-analysis results for the AUC.
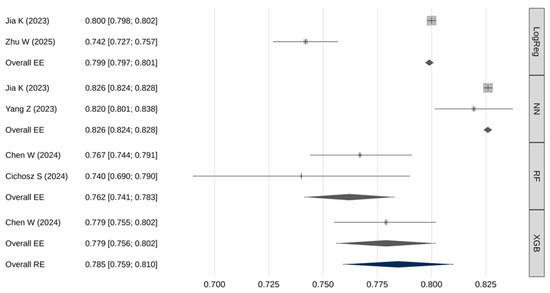
Figure 2.
Meta-analysis results for the AUC [25,26,27,29,30].
Meta-regression demonstrated a statistically significant association between model type and AUC values (Q(3) = 398, p < 0.001). Pairwise comparisons using fixed-effects models showed (Table 4): neural networks had significantly higher AUROC values compared to logistic regression, RF, and XGB models (p < 0.001); logistic regression models had significantly higher AUROC than RF models (p < 0.001).
Table 4.
Pairwise comparisons of meta-analytic AUC estimates.
3.4. Meta-Analytic Assessment of Sensitivity
Table 5 and Figure 3 summarize the pooled sensitivity results. The overall pooled sensitivity (random effects) was 62.2% [95% CI: 37.6–86.7], with a 95% prediction interval from 7.2% to 100%. Extremely high heterogeneity was observed (I2 = 99.9%, Q(df) = 3636, p < 0.001). No significant publication bias was identified (β = 0.65; [95% CI: 2.43–3.73]; p = 0.981).
Table 5.
Meta-analysis results for sensitivity.
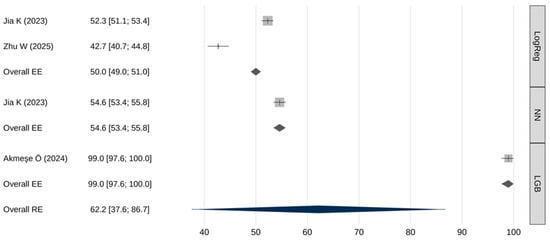
Figure 3.
Meta-analysis results for sensitivity [26,30,31].
Meta-regression indicated that sensitivity differed significantly across AI model types (Q(2) = 3569, p < 0.001). Table 6 presents the results of pairwise comparisons of meta-analytic sensitivity estimates obtained using the fixed-effects models. LGB models demonstrated the highest sensitivity—statistically superior to both neural networks and logistic regression (p < 0.001), neural networks also demonstrated a slightly higher sensitivity compared to logistic regression (p < 0.001).
Table 6.
Pairwise comparisons of meta-analytic sensitivity estimates.
3.5. Meta-Analytic Assessment of Specificity
A meta-analysis of the specificity of AI models was also performed (Table 7 and Figure 4). The overall pooled specificity (random effects) was 87.5% [95% CI: 79.8–95.3], with a 95% prediction interval from 70.2% to 100%. Again, extremely high heterogeneity was present (I2 = 100%, Q(df) = 10,695, p < 0.001), and there was a trend toward publication bias (β = 0.8; [95% CI: 0.8–0.8;] p = 0.062).
Table 7.
Meta-analysis results for specificity.
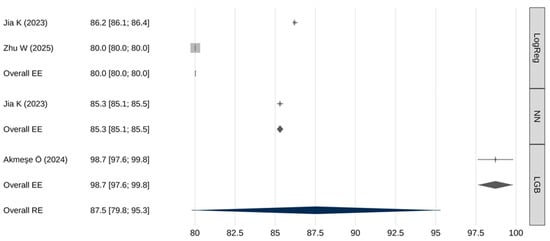
Figure 4.
Meta-analysis results for specificity [26,30,31].
The meta-analytic regression model revealed a statistically significant association between the type of predictive model and specificity estimates (Q(2) = 3913, p < 0.001). Table 8 presents the results of pairwise comparisons of meta-analytic specificity estimates obtained using fixed-effects models. LGB models demonstrated a statistically significantly higher specificity compared to both logistic regression models and neural network-based models (p < 0.001). Neural networks also showed a somewhat higher specificity than logistic regression (p < 0.001).
Table 8.
Pairwise comparisons of meta-analytic specificity estimates.
4. Discussion
This systematic review and meta-analysis demonstrate the substantial potential of artificial intelligence models trained on electronic medical record (EMR) data to address one of the most critical challenges in oncology—the early detection of pancreatic cancer (PC). The pooled AUC estimate of 0.785 [95% CI: 0.759–0.810] indicates overall good and clinically meaningful discriminatory performance of AI-based models. A notable finding of this review is the statistically significant difference in performance across AI model types. Neural network-based models consistently demonstrated the highest AUROC values, likely reflecting their ability to capture complex nonlinear relationships and temporal patterns within high-dimensional EMR data—patterns that may be undetectable by more traditional models such as logistic regression. However, while neural networks achieved the highest pooled AUC, caution is warranted in interpreting this result. Performance disparities could be influenced by study-specific factors—including sample size, feature engineering, temporal modeling, and validation design—rather than algorithmic advantage alone.
Performance comparisons across key metrics revealed additional important distinctions. In terms of sensitivity, LGB models markedly outperformed both neural networks and logistic regression (99% [97.6–100] vs. 54.6% [53.4–55.8] and 50% [49–51], respectively). Such high sensitivity makes LGB models particularly attractive for screening applications where failure to detect disease carries significant clinical risk. However, this exceptionally high sensitivity was reported in a single study, warranting cautious interpretation and the need for external validation. Similarly, LGB models demonstrated significantly higher specificity than neural networks or logistic regression (98.7% [97.6–99.8] vs. 85.3% [85.1–85.5] and 80% [80–80], respectively). Neural networks, meanwhile, exhibited intermediate—yet significantly superior—performance compared with logistic regression across both sensitivity and specificity metrics.
Despite encouraging results, the analysis revealed extremely high heterogeneity in sensitivity and specificity estimates between studies (I2 ≥ 99.9%). This could be explained by substantial differences in study design, variations in the studied populations, and the types of predictors used. Our meta-analysis is limited by the high methodological heterogeneity of the included works: they differed in design (case–control vs. cohort), outcomes (binary classification vs. time-to-event), time horizons (3–60 months), population composition (general population and at-risk cohorts), as well as classification thresholds defining sensitivity and specificity. Some studies used enriched cohorts or external data sources, which reduces comparability with models trained on ‘pure’ EMRs of the general population. Under such conditions, aggregating Se/Sp in univariate models may yield biased estimates; due to the high heterogeneity, the results for Se and Sp should be interpreted with caution. Therefore, in future analyses, once a larger number of studies on this topic become available, alternative approaches such as the bivariate HSROC model should be employed for a more accurate estimation.
Differences in prediction windows and outcome definitions are important sources of heterogeneity, but a stratified meta-analysis was not possible due to incomplete reporting. Few studies provided performance metrics for specific time horizons, and the number of comparable studies within each stratum was too low to allow robust subgroup analysis. This limitation underscores the need for standardized reporting of time-stratified results in future research on AI-based pancreatic cancer prediction.
The extremely low PPVs observed in most studies underscore a fundamental challenge in pancreatic cancer screening, driven by the disease’s low prevalence. Even a model with high specificity will generate a large number of false-positive results when applied to the general population, potentially leading to unnecessary diagnostic procedures. Consequently, an AI implementation strategy should focus not on universal screening, but on risk stratification and the identification of high-risk patient groups. Within these high-risk cohorts, more in-depth analyses using AI models should be conducted to define subgroups for targeted instrumental examination.
Our analysis highlights the critical need for AI methodologies that can effectively manage the inherent complexity, non-linearity, and temporal dynamics of longitudinal EHR-data. This imperative is echoed by contemporary methodological innovations in modeling other complex, chronic conditions. The DEPOT framework, for example, utilizes a graph-based AI approach specifically engineered to address the challenges of fragmented and heterogeneous EHR data [32]. By constructing an age-similarity graph and employing representation learning, DEPOT successfully identified distinct, high-risk progression trajectories for chronic kidney disease within a diabetic cohort. Importantly, this model’s ability to isolate a high-risk trajectory enriched with specific cancer phenotypes powerfully illustrates the principle of targeted risk stratification [33]. This aligns with our central conclusion that the early detection of pancreatic cancer will be most feasible and effective when AI models are applied to identify and monitor enriched high-risk subpopulations, rather than through untargeted general screening.
5. Conclusions
Artificial intelligence models trained on electronic medical record data represent a promising tool for improving the early detection of pancreatic cancer, demonstrating good discriminatory ability in certain studies. However, high heterogeneity, typically low positive predictive value, and the absence of further validation currently preclude their use as stand-alone screening tools. Their effective clinical implementation relies not on replacing clinicians, but on integrating AI systems as decision-support tools capable of identifying patients at elevated risk who may benefit from closer evaluation or targeted diagnostic testing.
Successful implementation of these technologies will require further prospective research, methodological standardization, and improved interpretability of AI models, as well as seamless integration into clinical workflows. By addressing these challenges, AI-driven risk stratification has the potential to transform the diagnostic landscape for pancreatic cancer and mitigate delays in detection—ultimately improving patient outcomes.
Author Contributions
G.G.M.: data collection, literature review on the article topic, analysis and systematization of obtained data, statistical analysis, manuscript writing. I.V.S.: scientific supervision, research concept rationale, study design. V.V.N.: data collection, manuscript editing, manuscript formatting. Z.R.M.: manuscript editing, manuscript formatting. A.A.T.: manuscript editing, conclusions formulation. T.G.G.: study design, manuscript editing. All authors have read and agreed to the published version of the manuscript.
Funding
This work was funded by The Ministry of Economic Development of the Russian Federation (Grant No. 139-15-2025-008) in the form of a Subsidy from the Federal Budget to the Federal State Budgetary Institution “N.N. Blokhin National Medical Research Center of Oncology” of the Ministry of Health of the Russian Federation, State Contract ID 000000C313925P3R0002 dated 16 April 2025.
Data Availability Statement
The original contributions presented in this study are included in the article. Further inquiries can be directed to the corresponding author.
Acknowledgments
The authors declare that Generative AI was used in the creation of this manuscript. The core content of this research, including research ideas, research design, data collection, analytical methods, and research conclusions, was completed independently by the author without the use of AI tools. During the writing process, ChatGPT 5.0 was used to assist with the following tasks: (1) optimization of English language expression and grammar checking; (2) compliance checking of academic writing formats; (3) standardization of reference formatting. All content generated with AI assistance has been carefully reviewed and revised by the author to ensure accuracy and appropriateness. The author takes full responsibility for all content in this article. This statement is made to maintain academic transparency and integrity.
Conflicts of Interest
The authors declare that the research was conducted in the absence of any commercial or financial relationships that could be construed as a potential conflict of interest.
Abbreviations
The following abbreviations are used in this manuscript:
| PC | Pancreatic cancer |
| AI | Artificial Intelligence |
| EHR | Electronic health record |
| Se | Sensitivity |
| Sp | Specificity |
| LogReg | Logistic Regression |
| LGB | Light Gradient Boosting |
| RF | Random Forests |
| NN | Neural Network |
| XGB | XGBoost |
| CI | Confidence interval |
| ML | Machine learning |
| DL | Deep learning |
| AUC | Area under the curve |
| AUROC | Area under the receiver operating characteristic curve |
References
- Bray, F.; Ferlay, J.; Soerjomataram, I.; Siegel, R.L.; Torre, L.A.; Jemal, A. Global cancer statistics 2018: GLOBOCAN estimates of incidence and mortality worldwide for 36 cancers in 185 countries. CA Cancer J. Clin. 2018, 68, 394–424. [Google Scholar] [CrossRef] [PubMed]
- Arnold, M.; Rutherford, M.J.; Bardot, A.; Ferlay, J.; Andersson, T.M.; Myklebust, T.Å.; Tervonen, H.; Thursfield, V.; Ransom, D.; Shack, L.; et al. Progress in cancer survival, mortality, and incidence in seven high-income countries 1995-2014 (ICBP SURVMARK-2): A population-based study. Lancet Oncol. 2019, 20, 1493–1505. [Google Scholar] [CrossRef] [PubMed]
- Strobel, O.; Neoptolemos, J.; Jäger, D.; Büchler, M.W. Optimizing the outcomes of pancreatic cancer surgery. Nat. Rev. Clin. Oncol. 2019, 16, 11–26. [Google Scholar] [CrossRef] [PubMed]
- Hart, P.A.; Chari, S.T. Is Screening for Pancreatic Cancer in High-Risk Individuals One Step Closer or a Fool’s Errand? Clin. Gastroenterol. Hepatol. 2019, 17, 36–38. [Google Scholar] [CrossRef]
- Malhotra, A.; Rachet, B.; Bonaventure, A.; Pereira, S.P.; Woods, L.M. Can we screen for pancreatic cancer? Identifying a sub-population of patients at high risk of subsequent diagnosis using machine learning techniques applied to primary care data. PLoS ONE 2021, 16, e0251876. [Google Scholar] [CrossRef]
- Estiri, H.; Strasser, Z.H.; Klann, J.G.; Naseri, P.; Wagholikar, K.B.; Murphy, S.N. Predicting COVID-19 mortality with electronic medical records. npj Digit. Med. 2021, 4, 15. [Google Scholar] [CrossRef]
- Luchini, C.; Pea, A.; Scarpa, A. Artificial intelligence in oncology: Current applications and future perspectives. Br. J. Cancer 2022, 126, 4–9. [Google Scholar] [CrossRef]
- Ramos-Casallas, A.; Cardona-Mendoza, A.; Perdomo-Lara, S.J.; Rico-Mendoza, A.; Porras-Ramírez, A. Performance Evaluation of Machine Learning Models in Cervical Cancer Diagnosis: Systematic Review and Meta-Analysis. Eur. J. Cancer 2025, 229, 115768. [Google Scholar] [CrossRef]
- Crawford, M.E.; Kamali, K.; Dorey, R.A.; Maclntyre, O.C.; Cleminson, K.; MacGillivary, M.L.; Green, P.J.; Langley, R.G.; Purdy, K.S.; DeCoste, R.C.; et al. Using Artificial Intelligence as a Melanoma Screening Tool in Self-Referred Patients. J. Cutan. Med. Surg. 2024, 28, 37–43. [Google Scholar] [CrossRef]
- Pereira, S.P.; Oldfield, L.; Ney, A.; Hart, P.A.; Keane, M.G.; Pandol, S.J.; Li, D.; Greenhalf, W.; Jeon, C.Y.; Koay, E.J.; et al. Early detection of pancreatic cancer. Lancet Gastroenterol. Hepatol. 2020, 5, 698–710. [Google Scholar] [CrossRef]
- Appelbaum, L.; Cambronero, J.P.; Stevens, J.P.; Horng, S.; Pollick, K.; Silva, G.; Haneuse, S.; Piatkowski, G.; Benhaga, N.; Duey, S.; et al. Development and validation of a pancreatic cancer risk model for the general population using electronic health records: An observational study. Eur. J. Cancer 2021, 143, 19–30. [Google Scholar] [CrossRef]
- Page, M.J.; McKenzie, J.E.; Bossuyt, P.M.; Boutron, I.; Hoffmann, T.C.; Mulrow, C.D.; Shamseer, L.; Tetzlaff, J.M.; Akl, E.A.; Brennan, S.E.; et al. The PRISMA 2020 Statement: An Updated Guideline for Reporting Systematic Reviews. BMJ 2021, 372, n71. [Google Scholar] [CrossRef]
- Wells, G.A.; Shea, B.; O’Connell, D.; Peterson, J.; Welch, V.; Losos, M.; Tugwell, P. The Newcastle-Ottawa Scale (NOS) for Assessing the Quality of Nonrandomized Studies in Meta-Analyses. Available online: http://www.ohri.ca/programs/clinical_epidemiology/oxford.asp (accessed on 16 January 2026).
- Bhinder, B.; Gilvary, C.; Madhukar, N.S.; Elemento, O. Artificial Intelligence in Cancer Research and Precision Medicine. Cancer Discov. 2021, 11, 900–915. [Google Scholar] [CrossRef] [PubMed]
- Chen, Q.; Cherry, D.R.; Nalawade, V.; Qiao, E.M.; Kumar, A.; Lowy, A.M.; Simpson, D.R.; Murphy, J.D. Clinical Data Prediction Model to Identify Patients With Early-Stage Pancreatic Cancer. JCO Clin. Cancer Inform. 2021, 5, 279–287. [Google Scholar] [CrossRef] [PubMed]
- Chen, W.; Zhou, Y.; Xie, F.; Butler, R.K.; Jeon, C.Y.; Luong, T.Q.; Zhou, B.; Lin, Y.C.; Lustigova, E.; Pisegna, J.R.; et al. Derivation and External Validation of Machine Learning-Based Model for Detection of Pancreatic Cancer. Am. J. Gastroenterol. 2023, 118, 157–167. [Google Scholar] [CrossRef] [PubMed]
- Matchaba, S.; Fellague-Chebra, R.; Purushottam, P.; Johns, A. Early Diagnosis of Pancreatic Cancer via Machine Learning Analysis of a National Electronic Medical Record Database. JCO Clin. Cancer Inform. 2023, 7, e2300076. [Google Scholar] [CrossRef]
- Park, J.; Artin, M.G.; Lee, K.E.; Pumpalova, Y.S.; Ingram, M.A.; May, B.L.; Park, M.; Hur, C.; Tatonetti, N.P. Deep learning on time series laboratory test results from electronic health records for early detection of pancreatic cancer. J. Biomed. Inform. 2022, 131, 104095. [Google Scholar] [CrossRef]
- Chen, W.; Butler, R.K.; Lustigova, E.; Chari, S.T.; Maitra, A.; Rinaudo, J.A.; Wu, B.U. Risk Prediction of Pancreatic Cancer in Patients With Recent-onset Hyperglycemia: A Machine-learning Approach. J. Clin. Gastroenterol. 2023, 57, 103–110. [Google Scholar] [CrossRef]
- Hsieh, M.H.; Sun, L.M.; Lin, C.L.; Hsieh, M.J.; Hsu, C.Y.; Kao, C.H. Development of a prediction model for pancreatic cancer in patients with type 2 diabetes using logistic regression and artificial neural network models. Cancer Manag. Res. 2018, 10, 6317–6324. [Google Scholar] [CrossRef]
- Muhammad, W.; Hart, G.R.; Nartowt, B.; Farrell, J.J.; Johung, K.; Liang, Y.; Deng, J. Pancreatic Cancer Prediction Through an Artificial Neural Network. Front. Artif. Intell. 2019, 2, 2. [Google Scholar] [CrossRef]
- Placido, D.; Yuan, B.; Hjaltelin, J.X.; Zheng, C.; Haue, A.D.; Chmura, P.J.; Yuan, C.; Kim, J.; Umeton, R.; Antell, G.; et al. A deep learning algorithm to predict risk of pancreatic cancer from disease trajectories. Nat. Med. 2023, 29, 1113–1122. [Google Scholar] [CrossRef] [PubMed]
- Li, X.; Guo, P.; Huang, C.-J.; Hao, S. A deep-learning based prediction of pancreatic adenocarcinoma with electronic health records from the state of maine. Int. Sch. Sci. Res. Innov. 2020, 14, 358–365. [Google Scholar]
- Zhao, D.; Weng, C. Combining PubMed knowledge and EHR data to develop a weighted Bayesian network for pancreatic cancer prediction. J. Biomed. Inform. 2011, 44, 859–868. [Google Scholar] [CrossRef] [PubMed]
- Chen, W.; Zhou, B.; Jeon, C.Y.; Xie, F.; Lin, Y.C.; Butler, R.K.; Zhou, Y.; Luong, T.Q.; Lustigova, E.; Pisegna, J.R.; et al. Machine learning versus regression for prediction of sporadic pancreatic cancer. Pancreatology 2023, 23, 396–402. [Google Scholar] [CrossRef]
- Jia, K.; Kundrot, S.; Palchuk, M.B.; Warnick, J.; Haapala, K.; Kaplan, I.D.; Rinard, M.; Appelbaum, L. A pancreatic cancer risk prediction model (Prism) developed and validated on large-scale US clinical data. eBioMedicine 2023, 98, 104888. [Google Scholar] [CrossRef]
- Cichosz, S.L.; Jensen, M.H.; Hejlesen, O.; Henriksen, S.D.; Drewes, A.M.; Olesen, S.S. Prediction of pancreatic cancer risk in patients with new-onset diabetes using a machine learning approach based on routine biochemical parameters. Comput. Methods Programs Biomed. 2024, 244, 107965. [Google Scholar] [CrossRef]
- Chen, S.M.; Phuc, P.T.; Nguyen, P.A.; Burton, W.; Lin, S.J.; Lin, W.C.; Lu, C.Y.; Hsu, M.H.; Cheng, C.T.; Hsu, J.C. A novel prediction model of the risk of pancreatic cancer among diabetes patients using multiple clinical data and machine learning. Cancer Med. 2023, 12, 19987–19999. [Google Scholar] [CrossRef]
- Yang, Z.; Mitra, A.; Liu, W.; Berlowitz, D.; Yu, H. TransformEHR: Transformer-based encoder-decoder generative model to enhance prediction of disease outcomes using electronic health records. Nat. Commun. 2023, 14, 7857. [Google Scholar] [CrossRef]
- Zhu, W.; Chen, L.; Aphinyanaphongs, Y.; Kastrinos, F.; Simeone, D.M.; Pochapin, M.; Stender, C.; Razavian, N.; Gonda, T.A. Identification of patients at risk for pancreatic cancer in a 3-year timeframe based on machine learning algorithms. Sci. Rep. 2025, 15, 11697. [Google Scholar] [CrossRef]
- Akmeşe, Ö.F. Data privacy-aware machine learning approach in pancreatic cancer diagnosis. BMC Med. Inform. Decis. Mak. 2024, 24, 248. [Google Scholar] [CrossRef]
- Li, Z.; Liu, X.; Tang, Z.; Jin, N.; Zhang, P.; Eadon, M.T.; Song, Q.; Chen, Y.V.; Su, J. TrajVis: A visual clinical decision support system to translate artificial intelligence trajectory models in the precision management of chronic kidney disease. J. Am. Med. Inform. Assoc. 2024, 31, 2474–2485. [Google Scholar] [CrossRef]
- Song, Q.; Liu, X.; Li, Z.; Zhang, P.; Eadon, M.; Su, J. DEPOT: Graph learning delineates the roles of cancers in the progression trajectories of chronic kidney disease using electronic medical records. medRxiv 2023. medRxiv:2023.08.13.23293968. [Google Scholar] [CrossRef]


Disclaimer/Publisher’s Note: The statements, opinions and data contained in all publications are solely those of the individual author(s) and contributor(s) and not of MDPI and/or the editor(s). MDPI and/or the editor(s) disclaim responsibility for any injury to people or property resulting from any ideas, methods, instructions or products referred to in the content. |
© 2026 by the authors. Licensee MDPI, Basel, Switzerland. This article is an open access article distributed under the terms and conditions of the Creative Commons Attribution (CC BY) license.