Simple Summary
With the aim of advancing and innovating improvements in genetic diagnosis, this work aims to compare traditional Sanger sequencing with MinION technology for detecting variants in short fragments. The routine use of this third-generation technology is expected to have a tremendous positive impact on improving the turnaround time (TAT), among other factors, directly contributing to improvements in patients’ health.
Abstract
Background: Sanger sequencing remains the gold standard for characterizing genetic variants in short DNA fragments (<700 bp). However, the increasing demand for short TATs and high sensitivities in variant detection, particularly in oncohematology, is driving the need for more efficient methods. Next-generation sequencing (NGS) has improved sensitivity and allows for the simultaneous analysis of multiple genes, but it is still costly and time-consuming. Consequently, Sanger sequencing continues to be widely used. In this study, we have compared Sanger sequencing with Oxford Nanopore technology (ONT), which offers enhanced sensitivity and faster sequencing, delivering diagnostic results within 24 h. Methods: This study involves 164 samples (for a total of 174 analyzed regions of interest) previously characterized using either Sanger sequencing or a next-generation sequencing (NGS) panel, categorized by their genetic alterations. Validation was conducted on 15 genes crucial for the diagnosis, prognosis, or identification of drug resistance in myeloproliferative neoplasms (MPN), myelodysplastic syndromes (MDS), acute myeloid leukemia (AML), and chronic myeloid leukemia (CML). The primary objective was to assess whether MinION could identify the same variants previously detected in these patients. Results and Conclusions: With a 99.43% concordance observed in our comparison, our results support the implementation of MinION technology in routine variant detection in MPN, MDS, AML, and CML cases due to its significant advantages over Sanger sequencing.
1. Introduction
Sanger sequencing remains crucial for detecting single-nucleotide variants and small insertions/deletions (INDELs) in hematological malignancies. It is routinely employed in molecular diagnostic laboratories for sequencing individual genes and small targeted genome regions. NGS has not fully replaced Sanger sequencing because, for conditions resulting from mutations in a single gene or a small group of genes, it is impractical to analyze the large number of genes included in an NGS panel. Moreover, there are cases of genes (such as FLT3, IDH1, and NPM1) that, due to treatment or inclusion in a trial, require a short TAT, which is currently not offered by NGS but is achievable with Sanger sequencing. On the other hand, MinION can offer the same or greater speed than Sanger in these cases, but also with a sensitivity like that of NGS. Hence, one of the major interests is replacing Sanger sequencing with ONT technology.
Returning to the applications that Sanger sequencing still has today in genetic diagnostics laboratories, nowadays, performing mutational analysis on a single gene or a few relevant genes using Sanger is more practical, faster, and cost-effective than with NGS. In some situations, we examine the entire coding region, such as the CEBPA gene. In other cases, we target specific exons where the main hotspots of that gene are located, such as with the KIT gene, in which, in routine diagnostics, we study exon 17 (p.D816V) and exon 8 because they contain variants that provide a definite diagnosis of mastocytosis [1,2] and are associated with an unfavorable prognosis in AML patients [3,4]. Regarding the previously mentioned example highlighting the continued importance of Sanger sequencing in cases requiring a very short turnaround time (TAT), the case of the NPM1 gene is particularly noteworthy. NPM1 is a favorable prognostic marker in newly diagnosed AML [5,6,7], and thus, timely delivery of its mutational status to the clinician is critical to support the most appropriate therapeutic decision. Obtaining such rapid results with NGS techniques is currently not feasible.
Current routine molecular gold standard methods include Sanger and NGS. In this study, we aim to validate ONT as a new approach for the molecular characterization of hematological malignancies. Specific characteristics of each method are described in the following table (Table 1).

Table 1.
A comparison between Sanger sequencing, NGS, and MinION technologies.
Since its launch in 2014 by Oxford Nanopore Technologies (ONT), nanopore technology has been widely adopted for sequencing large fragments, including viral, bacterial, and yeast genomes [10,11,12]. For instance, the MinION was used in Africa for screening Ebola and Lassa virus outbreaks [13,14]. However, it has been less commonly used for sequencing short fragments and is even rarer in oncohematological diagnosis. The most notable studies utilizing MinION in oncohematology have focused on detecting mutations in the TP53 [15] and the ABL1 [16] genes in B-cell chronic lymphocytic leukemia (B-CLL) and CML patients, respectively. Additionally, a customized MinION-based gene panel has been developed for the targeted sequencing of genes frequently mutated in B-CLL [17]. More recently, a nanopore-based assay has been introduced for the rapid sequencing of six genes frequently mutated in AML (NPM1, FLT3, CEBPA, TP53, IDH1, and IDH2) [18].
Herein, as we explore the potential of MinION technology as a new approach in the clinical routine for short-fragment sequencing, we used a substantial cohort of 164 samples, previously characterized using NGS or Sanger sequencing, targeting 15 genes with diagnostic, prognostic, or therapeutic relevance in MPN (CALR, JAK2, MPL, CSF3R, SETBP1), MDS (SF3B1), AML (NPM1, KIT, IDH2, IDH1, CEBPA, NRAS, KRAS, and TP53) and CML (ABL1). This approach seeks to evaluate MinION’s feasibility and performance in the context of oncohematological diagnostics.
2. Materials and Methods
The analysis workflow for each sample began with the receipt of human peripheral blood or bone marrow samples in our laboratories. Subsequently, peripheral blood mononuclear cells (PBMCs) were isolated using Ficoll separation (Cytiva Ficoll-Paque™ PREMIUM, Cytiva Life Sciences™, Thermo Fisher Scientific; Waltham, MA, USA). RNA or DNA, depending on the specific detection test for each marker, was extracted from the isolated cells. Marker-specific PCRs were subsequently conducted in accordance with the standard procedures established at the CIMA LAB Diagnostics laboratory (no marker-specific PCRs have been designed for these validations). Finally, the library was prepared according to the protocols provided by ONT, followed by loading the library onto the sequencer. Upon completion of sequencing, base-calling of the corresponding Fasta5 files was conducted, followed by alignment and read counting. This process is summarized in the following figure (Figure 1).
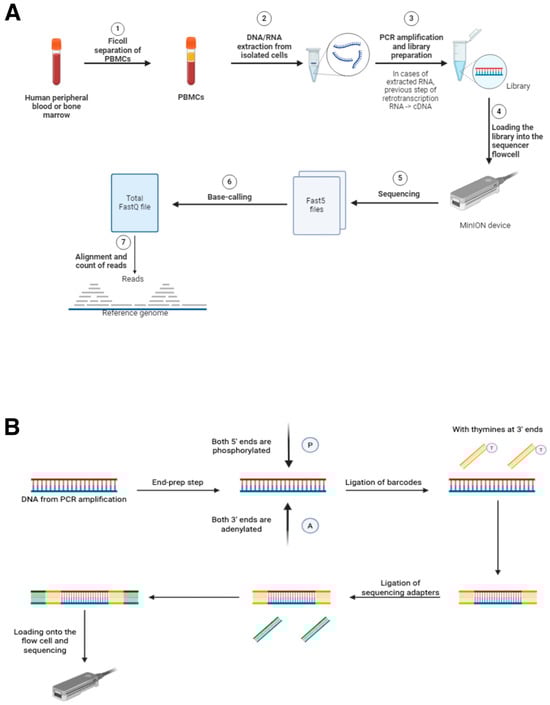
Figure 1.
(A) Workflow for the use of MinION as a diagnostic tool in oncohematology. Steps 5, 6, and 7 require the use of MinKNOW software and are necessary for sequencing analyses. (B) Schematic figure showing the library preparation process for sequencing with MinION. The use of barcodes is necessary in the case of multiplexing, where multiple samples will be sequenced at the same time in a single sequencing run. All the reagents required for these steps are provided by ONT in their sequencing kits. (Figure 1 has been created manually using the BioRender application (“https://www.biorender.com/”. Accesed date 23 May 2025).
All this experimental process will be detailed below in the corresponding subsections of the Section 2.
2.1. Patients
One hundred and sixty-four patients were included in this study, categorized based on their diagnosed pathologies as follows: 58 MPN, 12 MDS, 84 AML, 9 CML, and 1 ALL (Table S1). The ALL patient served as a non-mutated control in the ABL1 assay. Regarding the samples, a total of 101 out of 164 were bone marrow, while 63 out of 164 were peripheral blood.
The samples used for the validations were collected between 2016 and 2024. All patients provided written informed consent for genetic testing, research, and tissue banking through the Biobank of the University of Navarra. Sample processing adhered to the standard operating procedures approved by the Institutional Review Board (IRB) of the University of Navarra.
The design of each assay utilized samples that had been previously characterized in the molecular biology laboratory at CIMA LAB Diagnostics, using either Sanger sequencing or an NGS panel. Leveraging samples characterized by an NGS panel for the validation of MinION technology offers a distinct advantage, as it enables the detection of variants that may not be identified by Sanger sequencing due to its lower sensitivity (note that NGS sensitivity can be as high as 1%).
The project was structured into individual assays per gene, each corresponding to a specific pool loaded onto the sequencer. For each pool, between 11 and 13 samples of each gene were analyzed, comprising six to eight samples with known variants and four to five control samples without variants. An exception was made for the NPM1 gene, where the initial assay design included a total of 10 samples with mutations and two control samples without mutations. For cases with mutations, only the exon containing the variant(s) was amplified, whereas in non-mutated cases, all exons routinely sequenced were amplified.
2.2. Polymerase Chain Reaction
The samples selected for each assay comprised stored DNA or RNA (either in the Biobank of our center or in our laboratory) previously extracted from mononuclear cell isolates obtained by Ficoll (Cytiva Ficoll-Paque™ PREMIUM, Cytiva Life Sciences™, Thermo Fisher Scientific; Waltham, MA, USA) from the bone marrow (BM) or peripheral blood (PB) samples collected at diagnosis for variant detection. DNA extraction was performed using the QIAamp DNA Mini Kit from QIAGEN (Hilden, Germany), while RNA was extracted using the RNeasy Mini Kit (250) from QIAGEN (Hilden, Germany). Quantification was performed using the Nanodrop (ND-1000) from Thermo Fisher Scientific (Waltham, MA, USA).
As previously noted, for the mutated samples, only the exon containing the variant was amplified. In the non-mutated control samples, all exons routinely sequenced in our laboratories were amplified. The sequence of the primers used for each gene under study is detailed in the Supplementary Material (Table S2). All primers were synthesized by Invitrogen (Thermo Fisher Scientific; Waltham, MA, USA), except for those targeting ABL1, which were synthesized by Sigma-Aldrich (St. Louis, MO, USA). Primer design was based on previously published studies or generated using the Primer3Plus software (version: 3.3.0). These specifications, as mentioned, are provided in the Supplementary Material (Table S2).
The common reagents used in our PCRs included the following: Braun nuclease-free water, 25 mM MgCl2 solution from Applied Biosystems (Thermo Fisher Scientific; Waltham, MA, USA), 10x PCR Gold Buffer from Applied Biosystems (Thermo Fisher Scientific; Waltham, MA, USA), dNTPs from Invitrogen (Thermo Fisher Scientific; Waltham, MA, USA), and AmpliTaq GoldTM DNA Polymerase 250U from Applied Biosystems (Thermo Fisher Scientific; Waltham, MA, USA). For the CEBPA and ABL1 genes, the enzyme used was PlatinumTMTaq DNA Polymerase High Fidelity from Invitrogen (Thermo Fisher Scientific; Waltham, MA, USA); the 10x PCR Gold Buffer was also replaced by 10x High Fidelity PCR Buffer from Invitrogen (Thermo Fisher Scientific; Waltham, MA, USA). In addition, DMSO from Sigma-Aldrich (St. Louis, MO, USA) was included in the PCR mix to accommodate the high GC content of the CEBPA gene. Furthermore, for TP53 exon 7 and SF3B1 exons 13–14, the 10x PCR Gold Buffer was replaced by the AmpliTaq Gold DNA Polymerase Buffer II from Applied Biosystems (Thermo Fisher Scientific; Waltham, MA, USA).
The PCR results were visualized using capillary electrophoresis with the QIAxcel instrument from QIAGEN (Hilden, Germany). The PCR products were then purified with ExoSAP-IT™ PCR Product Cleanup Reagent from Thermo Fisher Scientific (Waltham, MA, USA). Before beginning library preparation, the products were quantified, and their purity was estimated using the Nanodrop ND-1000 (Thermo Fisher Scientific; Waltham, MA, USA).
2.3. Sanger Sequencing and NGS Panel
As previously mentioned, the molecular characterization of the samples used in the earlier validations was performed using Sanger sequencing or an NGS panel. The Sanger sequencing was conducted at the Madrid facility of Macrogen, INC (Seoul, Republic of Korea). The NGS panel was custom designed by CIMA LAB Diagnostics in collaboration with the University Hospital of Salamanca and manufactured by SOPHiA GENETICS (Saint-Sulpice, Switzerland): “Custom Panmyeloid Panel v2”. This panel simultaneously analyzes a total of 56 genes (complete/regions): ACD, ANKRD26, ASXL1, ATRX, BCOR, BCORL1, CALR, CBL, CEBPA, CSF3R, CSNK1A1, CUX1, DDX41, DHX34, DNMT3A, ETNK1, ETV6, EZH2, FLT3 (ex.11–20), GATA1, GATA2, IDH1, IDH2, IKZF1, JAK2, KIT, KMT2A, KRAS, MBD4, MECOM, MPL, NF1, NPM1, NRAS, PHF6, PPM1D, PTPN11, RAD21, RUNX1, SAMD9, SAMD9L, SETBP1, SF3B1, SH2B3/LNK, SMC1A, SMC3, SRP72, SRSF2, STAG2, TERC, TERT, TET2, TP53, U2AF1, WT1, and ZRSR2.
The results obtained from these sequencing efforts were stored in our company’s database (FileMaker Pro INC; Cupertino, CA, USA; version: 20.3.1.31 (10132023). It is also noteworthy that, as part of our company’s quality control assurance (QCA), we utilized a Laboratory Information Management System (LIMS) at the care level called Gestlab (Clinisys; Tucson, AZ, USA; version: 2024.2.8).
2.4. MinION Sequencing
According to the Native Barcoding Kit 24 V14 (SQK-NBD114.24) protocol by Oxford Nanopore Technologies (Oxford, UK), 200 fmol (130 ng for 1 kb amplicons) of PCR product per sample was end-prepared using the NEBNext Ultra II End Repair/dA-Tailing Module (New England Biolabs Inc; Ipswich, MA, USA). Subsequently, the Blunt/TA Ligase Master Mix (New England Biolabs Inc; Ipswich, MA, USA) was used to ligate the nanopore-specific Native Barcodes (NB01–NB24) to the DNA. Equimolar amounts of each barcoded amplicon were then pooled (using the Quick Ligation module from New England Biolabs Inc; Ipswich, MA, USA) and loaded into the MinION device (MinION Mk1B) through the Flow Cell (FLO-MIN114-R10.4.1). The sequencing parameters, device status, real-time sequencing, and other functions were managed using the ONT software MinKNOW, which was installed on a computer connected to the MinION via a USB port.
ONT also provides a protocol for washing and storing the sequencer’s Flow Cell (Flow Cell Wash Kit EXP-WSH004 & EXP-WSH004-XL).
2.5. MinION Sequencing Data Analysis
According to the manufacturer’s instructions, demultiplexing was performed during sequencing based on the nanopore-specific Native Barcodes with the automatic detection of present barcodes. The generated FASTQ files were transferred to in-house servers for downstream analysis in a High-Performance Computing cluster (HPC).
In summary, the NextFlow nanoseq [19] pipeline was used for downstream analysis. Alignment was conducted using minimap2 against the hg19 reference genome from demultiplexed FASTQ files, and only SNV detection was activated with a pepper-margin-deep variant caller. The resulting VCF file was processed to obtain only variants above the 5% threshold (selecting only positions with at least a 10,000X sequencing depth). Selected variants were annotated using the VEP Web Interface [20].
For the sensitivity analysis, only the samples specifically selected for this purpose were included. The analysis was conducted following the same procedure, but the final selection step was omitted to allow the annotation of the complete list of detected variants.
For further information, scripts used for MinION data analysis are published on GitHub (https://github.com/bariceta/MinAMP. Accessed date: 23 May 2025).
2.6. Statistical Analysis
To obtain the final statistical results, R (version 4.2.1) was utilized. The analysis was divided into a comparison of continuous data (NGS panel vs. ONT) and discrete results (Sanger vs. ONT). For discrete results, a confusion matrix was generated to calculate key performance metrics, and a binomial test was used for a p-value determination. For continuous VAF values, a correlation plot was created to compare the VAF values: the ground truth (VAF from the NGS panel) and the VAF obtained from the interrogated technology. Pearson’s correlation (R2) was calculated to evaluate the correlation between the two methods. The R packages used for the data analysis and graphical representation were yardstick, smplot2, caret, openxlsx, and ggplot2.
3. Results
On average, each sequencing run generated 3.23 million reads, yielding a mean of 1.83 Gb of estimated bases (1 Gb = one billion base pairs). Additionally, an average of 89% of the bases successfully passed the base-calling process, demonstrating efficient read quality. The N50 statistic, a key metric for sequencing quality, was confirmed to be accurate across all validations. This ensured that the sequencing quality was aligned with the average length of the amplicons sequenced in each run. The N50 values consistently met the required standards, confirming the reliability of the sequencing data.
Figure 2 highlighted the strong correlation observed between the results obtained using MinION and those generated by Sanger-NGS. This demonstrates the high level of agreement between the two technologies in our analysis, underscoring the reliability and accuracy of MinION in comparison with the established methods. Out of the 174 analyzed sites (comprising the total regions of interest across the 164 samples under study), only one discordant result was observed, reflecting a concordance rate of 99.43% (173/174) between the gold standard technique and the proposed method. When comparing the presence or absence of specific variants between Sanger and MinION-ONT, the statistical analysis demonstrated high accuracy, sensitivity, and specificity, all supported by a significant p-value (Figure 2A). In the comparison of VAF values, a strong correlation was observed between the different approaches, demonstrating that the differences between short-reads and long-reads are not significant in VAF detection (Figure 2B).
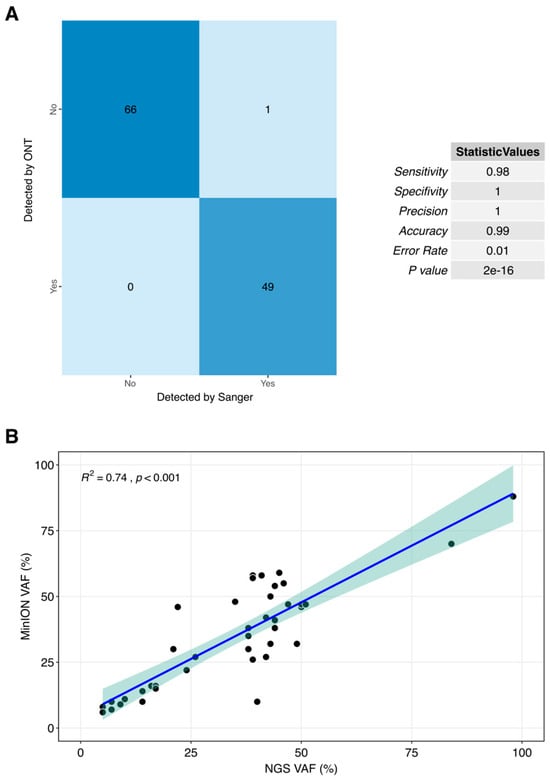
Figure 2.
Correlation plots between current gold standard techniques, Sanger (A) and NGS targeted panel (B) and our proposed method for clinical routine. Each point refering to a unique sample with VAF values using both technologies with a 5% of deviance shadow.
To present the results of the detected variants reported in Figure 2, the genes have been grouped based on their diagnostic and prognostic significance within specific pathologies. Consequently, a total of five tables (including one summarizing the sensitivity test results) correspond to the following pathologies: MPN, MDS, AML, and CML. Each of the five tables specifies the patient identifier, denoted by the hash symbol.
3.1. MPN
The MPN cases analyzed include samples from the following genes: CALR, JAK2, MPL, CSF3R, and SETBP1. In summary, among a total of 59 MPN regions of interest (ROI), the ONT demonstrated a 100% concordance. Detailed information for the MPN cases is presented in Table 2.
Table 2.
Comparison of variants detected by the Sanger/NGS method vs. MinION. The genes included in this table have clinical significance in the diagnosis, prognosis, or development of MPN.
3.2. MDS
The MDS cases analyzed include samples from the SF3B1 gene. In summary, among a total of 10 MDS ROI, a concordance with the ONT of 100% was seen. This information corresponding to the MDS cases is presented in Table 3.
Table 3.
Comparison of variants detected by the Sanger/NGS method vs. MinION. The genes included in this table have clinical significance in the diagnosis, prognosis, or development of MDS.
3.3. AML
The AML cases analyzed include samples from the following genes: NPM1, KIT, IDH2, IDH1, CEBPA, NRAS, and KRAS. Among a total of 79 AML ROI, the ONT achieved a concordance of 98.73%, with only one discordant result identified among the 79 interrogated regions. The discordant case corresponds to a region of the CEBPA gene. It is important to note that this gene contains regions highly enriched in GC content, which makes it challenging to sequence and increases the likelihood of sequencing errors. It should also be considered that it was a variant validated by Sanger sequencing, and so the result of the sequencing could have been incorrect, falsely detecting a sequence alteration, whereas the ONT sequencing may, in fact, be accurate. The limitations of Sanger sequencing, particularly in GC-rich regions, must also be taken into consideration. This information corresponding to the AML cases is presented in Table 4.
Table 4.
Comparison of variants detected by the Sanger/NGS method vs. MinION. The genes included in this table have clinical significance in the diagnosis, prognosis, or development of AML.
3.4. CML
The CML cases analyzed include nine CML patients and one ALL patient as a negative control (non-mutated). These CML/ALL cases include samples from the gene ABL1. In summary, out of a total of 10 CML-ALL ROI, a concordance with the ONT of 100% was seen. This information is presented in Table 5.
Table 5.
Comparison of variants detected by the Sanger/NGS method vs. MinION. The genes included in this table have clinical significance in the diagnosis, prognosis, or development of CML.
3.5. Sensitivity Testing
Having demonstrated the efficacy of ONT for variant detection in hematological diagnosis and follow-up, showing that at VAFs > 5%, MinION can detect the same variants observed with the current gold standard (Sanger) or NGS technology, we aimed to further explore that nanopore sequencing not only matches the depth of NGS but also significantly surpasses the depth achievable with Sanger sequencing. To this end, we selected samples that had variants detected by NGS and whose VAFs were less than 5%. From a technical standpoint, achieving this level of depth required modifying the aforementioned analysis filter that retained only variants with a VAF greater than 5%. By making a simple adjustment to the analysis workflow, we were able to detect subclonal variants. These samples (13 in total, comprising 16 variants) are detailed in Table 6. As shown, all variants were successfully detected using both methods, further demonstrating the sensitivity and specificity of the proposed assay.
Table 6.
Sensitivity test to check the high detection sensitivity of the MinION technology in variants with VAFs < 5%.
4. Discussion
Third-generation genomic nanopore technology (MinION) has revolutionized DNA sequencing and, consequently, the genetic diagnosis of hematological malignancies [21,22]. Although the advent of NGS represented a significant paradigm shift in genetic screening [23,24,25,26,27,28], nanopore sequencing developed by ONT is rapidly closing the gap. With its rapid sequencing speed, versatility (enabling the sequencing of both short fragments and entire genomes), compact design, and competitive price, nanopore technology stands at the forefront of innovation in DNA sequencing [29,30,31,32].
In the field of oncohematological diagnosis, nanopore sequencing represents a major paradigm shift. With the increasing focus on precision medicine, TAT has become a critical factor [33]. Rapidly identifying and administering the appropriate treatment is paramount for improving patient outcomes. MinION technology can deliver molecular results within 24 h [34] due to its real-time sequencing capabilities, offering a sensitivity comparable to NGS (<1%) and significantly surpassing Sanger sequencing (15%). This advancement not only enhances the TAT of Sanger sequencing (3–4 days in our laboratories at CIMA LAB Diagnostics) but also dramatically improves the TAT of NGS (approximately 14 days in our laboratories). This is arguably one of the strongest arguments in favor of implementing MinION technology, as the growing availability of personalized treatments makes rapid clinical decision-making increasingly critical, especially in acute diseases, where early and accurate therapeutic guidance can significantly influence patient prognosis.
Another significant advantage highlighted in this study is the remarkable efficiency of nanopore technology in detecting variants with allele frequencies below 5%. This capability represents a substantial improvement over Sanger sequencing. The ability to identify somatic variants in subpopulations of tumor cells, thus present in a low proportion in the tumor sample, is critically important in addressing relapse or treatment resistance in certain hematological tumors. This enhanced sensitivity can play a pivotal role in tailoring therapies and improving patient outcomes in oncohematology.
On a separate note, while MinION technology, as demonstrated in this study, excels in detecting variants in complex sequences such as those of the CEBPA gene, surpassing NGS in this specific aspect, it is not feasible to consider nanopore sequencing as a replacement for NGS. The capacity of next-generation sequencing to simultaneously analyze a broad spectrum of genes remains unmatched by MinION at this stage. However, as demonstrated in this study, it is both practical and advantageous to begin phasing out Sanger sequencing in favor of MinION for routine diagnostic applications. Therefore, MinION is affordable, efficient, and can be seamlessly integrated into molecular biology laboratories, enabling faster and more precise diagnostics.
Indeed, this pioneering approach is already being implemented in our molecular biology laboratory at CIMA LAB Diagnostics. We have initiated the routine use of MinION technology for detecting variants in the following 15 genes tested in this study: CALR, JAK2, MPL, CSF3R, SETBP1, SF3B1, NPM1, KIT, IDH1, IDH2, CEBPA, NRAS, KRAS, TP53, and ABL1.
The strong concordance observed in our analysis (99.43% (173/174)), which included a substantial cohort of patients and genes, strongly underscores the promising potential of nanopore sequencing for routine diagnostic use. Additionally, the exceptional sensitivity demonstrated by MinION in detecting variants (Table 6) highlights the significant utility and reliability of this technology in advancing the molecular diagnosis of hematological malignancies.
Beyond its demonstrated utility in oncohematology, nanopore sequencing technology showcases remarkable versatility due to its suitability for long-read sequencing, positioning it for numerous applications in genetic diagnostic laboratories. For instance, it has the potential to enhance classical cytogenetic techniques by accurately detecting translocations that are difficult to identify through conventional karyotyping, such as cryptic translocations or undescribed rearrangements. Such features represent a significant advantage of ONT, even over NGS. Long-read sequencing might lead to substantial improvements in the detection of copy number alterations (CNA) as well as gene fusions. This further highlights the remarkable potential impact that, beyond the findings demonstrated in this study, the implementation of ONT could have in genetic diagnostic laboratories.
5. Conclusions
This study highlights the effectiveness of MinION technology in detecting 174 regions of interest across 15 genes in a cohort of 164 samples. By validating the results against the current gold standards, both Sanger sequencing and NGS, this research confirms the applicability of MinION for molecular characterization in hematological diseases, including MPN, MDS, AML, and CML. These findings underscore the potential of MinION technology in comparison with Sanger sequencing for identifying genetic variants in short DNA fragments, offering a reliable, efficient, and cost-effective alternative. Moreover, MinION’s ability to deliver rapid results, even in real time, presents a significant advancement in diagnostic workflows, expediting critical clinical decisions. Its adoption could greatly benefit hematological patients and clinicians by facilitating timely and precise treatment selection, marking a crucial step forward in personalized medicine.
Supplementary Materials
The following supporting information can be downloaded at: https://www.mdpi.com/article/10.3390/cancers17111811/s1, Table S1: Samples information and organization along the manuscript. Main information about the samples is presented in the following table. Moreover, the tables in the main text in which these samples are analyzed are specified. Samples #1 to #58 correspond to myeloproliferative neoplasms (MPN). Samples #59 to #68 (plus samples #155 and #156) correspond to myelodysplastic syndromes (MDS). Samples #69 to #144 and #157 to #164, correspond to acute myeloid leukemia (AML). Samples #145 to #153 correspond to chronic myeloid leukemia (CML). Finnaly, sample #154 correspond to acute lymphoblastic leukemia (ALL). Table S2: Primers and conditions used for PCRs. The sequence of primers used was specified for each gene. All primers are based on the hg19 version of the human reference genome.
Author Contributions
Conceptualization, M.J.L., B.A. and M.J.C.; methodology, M.J.L. and B.A.; software, B.A.; validation, P.L.-M., M.J.L. and B.A.; formal analysis, P.L.-M. and B.A.; investigation, P.L.-M., M.J.L. and A.M.; resources, P.L.-M., A.M., O.C., N.G., I.E., A.E.-F., C.d.M., D.R., M.G.-F., A.A.-P., J.R.R. and F.P.; data curation, P.L.-M. and B.A.; writing—original draft preparation, P.L.-M.; writing—review and editing, P.L.-M., M.J.L., A.A.-P., F.P., B.A., and M.J.C.; visualization, P.L.-M., M.J.L., and B.A.; supervision, M.J.L., B.A. and M.J.C.; funding acquisition, M.J.C.; project administration, M.J.C. All authors have read and agreed to the published version of the manuscript.
Funding
This research received no external funding.
Institutional Review Board Statement
The study was conducted in accordance with the Declaration of Helsinki, and the protocol was approved by the Institutional Review Board (IRB) of the University of Navarra (2023.060, 28 April 2023).
Informed Consent Statement
Informed consent was obtained from all subjects involved in the study.
Data Availability Statement
The data presented in this study are available on request from the corresponding author.
Acknowledgments
The authors thank the molecular biology group at CIMA LAB Diagnostics for their dedication and enthusiastic work. And finally, we are particularly grateful to the patients who have participated in this study, and to the Biobank of the University of Navarra for its collaboration.
Conflicts of Interest
The authors declare no actual or potential conflicts of interest in the work reported in this manuscript.
References
- Pardanani, A. Systemic mastocytosis in adults: 2021 Update on diagnosis, risk stratification and management. Am. J. Hematol. 2021, 96, 508–525. [Google Scholar] [CrossRef] [PubMed]
- Farmer, I.; Radia, D.H. Systemic Mastocytosis: State of the Art. Curr. Hematol. Malig. Rep. 2024, 19, 197–207. [Google Scholar] [CrossRef] [PubMed]
- Reiter, A.; George, T.I.; Gotlib, J. New developments in diagnosis, prognostication, and treatment of advanced systemic mastocytosis. Blood 2020, 135, 1365–1376. [Google Scholar] [CrossRef] [PubMed]
- Fazio, M.; Vetro, C.; Markovic, U.; Duminuco, A.; Parisi, M.; Maugeri, C.; Mauro, E.; Parrinello, N.L.; Stagno, F.; Villari, L.; et al. A case of high-risk AML in a patient with advanced systemic mastocytosis. Clin. Case Rep. 2023, 11, e7134. [Google Scholar] [CrossRef]
- Wang, R.; Xu, P.; Chang, L.L.; Zhang, S.Z.; Zhu, H.H. Targeted therapy in NPM1-mutated AML: Knowns and unknowns. Front. Oncol. 2022, 12, 972606. [Google Scholar] [CrossRef]
- Falini, B. NPM1-mutated acute myeloid leukemia: New pathogenetic and therapeutic insights and open questions. Am. J. Hematol. 2023, 98, 1452–1464. [Google Scholar] [CrossRef] [PubMed]
- Khan, I.; Kaempf, A.; Raghuwanshi, S.; Chesnokov, M.; Zhang, X.; Wang, Z.; Domling, A.; Tyner, J.W.; Camacho, C.; Gartel, A.L. Favorable outcomes of NPM1mut AML patients are due to transcriptional inactivation of FOXM1, presenting a new target to overcome chemoresistance. Blood Cancer J. 2023, 13, 128. [Google Scholar] [CrossRef]
- Minervini, C.F.; Cumbo, C.; Orsini, P.; Anelli, L.; Zagaria, A.; Specchia, G.; Albano, F. Nanopore Sequencing in Blood Diseases: A Wide Range of Opportunities. Front. Genet. 2020, 11, 76. [Google Scholar] [CrossRef]
- Bartalucci, N.; Romagnoli, S.; Vannucchi, A.M. A blood drop through the pore: Nanopore sequencing in hematology. Trends Genet. 2022, 38, 572–586. [Google Scholar] [CrossRef]
- Grünberger, F.; Ferreira-Cerca, S.; Grohmann, D. Nanopore sequencing of RNA and cDNA molecules in Escherichia coli. RNA 2022, 28, 400–417. [Google Scholar] [CrossRef]
- Sheka, D.; Alabi, N.; Gordon, P.M.K. Oxford nanopore sequencing in clinical microbiology and infection diagnostics. Brief. Bioinform. 2021, 22, bbaa403. [Google Scholar] [CrossRef] [PubMed]
- He, M.; Chi, X.; Ren, J. Applications of Oxford Nanopore Sequencing in Schizosaccharomyces pombe. Methods Mol. Biol. 2021, 2196, 97–116. [Google Scholar] [CrossRef] [PubMed]
- Kafetzopoulou, L.E.; Pullan, S.T.; Lemey, P.; Suchard, M.A.; Ehichioya, D.U.; Pahlmann, M.; Thielebein, A.; Hinzmann, J.; Oestereich, L.; Wozniak, D.M.; et al. Metagenomic sequencing at the epicenter of the Nigeria 2018 Lassa fever outbreak. Science 2019, 363, 74–77. [Google Scholar] [CrossRef]
- Hoenen, T.; Groseth, A.; Rosenke, K.; Fischer, R.J.; Hoenen, A.; Judson, S.D.; Martellaro, C.; Falzarano, D.; Marzi, A.; Squires, R.B.; et al. Nanopore Sequencing as a Rapidly Deployable Ebola Outbreak Tool. Emerg. Infect. Dis. 2016, 22, 331–334. [Google Scholar] [CrossRef] [PubMed]
- Minervini, C.F.; Cumbo, C.; Orsini, P.; Brunetti, C.; Anelli, L.; Zagaria, A.; Minervini, A.; Casieri, P.; Coccaro, N.; Tota, G.; et al. TP53 gene mutation analysis in chronic lymphocytic leukemia by nanopore MinION sequencing. Diagn. Pathol. 2016, 11, 96. [Google Scholar] [CrossRef]
- Minervini, C.F.; Cumbo, C.; Orsini, P.; Anelli, L.; Zagaria, A.; Impera, L.; Coccaro, N.; Brunetti, C.; Minervini, A.; Casieri, P.; et al. Mutational analysis in BCR-ABL1 positive leukemia by deep sequencing based on nanopore MinION technology. Exp. Mol. Pathol. 2017, 103, 33–37. [Google Scholar] [CrossRef]
- Orsini, P.; Minervini, C.F.; Cumbo, C.; Anelli, L.; Zagaria, A.; Minervini, A.; Coccaro, N.; Tota, G.; Casieri, P.; Impera, L.; et al. Design and MinION testing of a nanopore targeted gene sequencing panel for chronic lymphocytic leukemia. Sci. Rep. 2018, 8, 11798. [Google Scholar] [CrossRef]
- Cumbo, C.; Minervini, C.F.; Orsini, P.; Anelli, L.; Zagaria, A.; Minervini, A.; Coccaro, N.; Impera, L.; Tota, G.; Parciante, E.; et al. Nanopore Targeted Sequencing for Rapid Gene Mutations Detection in Acute Myeloid Leukemia. Genes 2019, 10, 1026. [Google Scholar] [CrossRef]
- Ewels, P.A.; Peltzer, A.; Fillinger, S.; Patel, H.; Alneberg, J.; Wilm, A.; Ulysse-Garcia, M.; Di Tommaso, P. The nf-core framework for community-curated bioinformatics pipelines. Nat. Biotechnol. 2020, 38, 276–278. [Google Scholar] [CrossRef]
- McLaren, W.; Gil, L.; Hunt, S.E.; Riat, H.S.; Ritchie, G.R.; Thormann, A.; Flicek, P.; Cunningham, F. The Ensembl Variant Effect Predictor. Genome Biol. 2016, 17, 122. [Google Scholar] [CrossRef]
- Xiao, T.; Zhou, W. The third generation sequencing: The advanced approach to genetic diseases. Transl. Pediatr. 2020, 9, 163–173. [Google Scholar] [CrossRef] [PubMed]
- Mantere, T.; Kersten, S.; Hoischen, A. Long-Read Sequencing Emerging in Medical Genetics. Front. Genet. 2019, 10, 426. [Google Scholar] [CrossRef] [PubMed]
- Koboldt, D.C.; Steinberg, K.M.; Larson, D.E.; Wilson, R.K.; Mardis, E.R. The next-generation sequencing revolution and its impact on genomics. Cell 2013, 155, 27–38. [Google Scholar] [CrossRef]
- Lohmann, K.; Klein, C. Next generation sequencing and the future of genetic diagnosis. Neurotherapeutics 2014, 11, 699–707. [Google Scholar] [CrossRef]
- Kamps, R.; Brandão, R.D.; Bosch, B.J.; Paulussen, A.D.; Xanthoulea, S.; Blok, M.J.; Romano, A. Next-Generation Sequencing in Oncology: Genetic Diagnosis, Risk Prediction and Cancer Classification. Int. J. Mol. Sci. 2017, 18, 308. [Google Scholar] [CrossRef]
- Sabour, L.; Sabour, M.; Ghorbian, S. Clinical Applications of Next-Generation Sequencing in Cancer Diagnosis. Pathol. Oncol. Res. 2017, 23, 225–234. [Google Scholar] [CrossRef]
- Coccaro, N.; Anelli, L.; Zagaria, A.; Specchia, G.; Albano, F. Next-Generation Sequencing in Acute Lymphoblastic Leukemia. Int. J. Mol. Sci. 2019, 20, 2929. [Google Scholar] [CrossRef]
- Lionetti, M.; Neri, A. Utilizing next-generation sequencing in the management of multiple myeloma. Expert. Rev. Mol. Diagn. 2017, 17, 653–663. [Google Scholar] [CrossRef] [PubMed]
- van Dijk, E.L.; Jaszczyszyn, Y.; Naquin, D.; Thermes, C. The Third Revolution in Sequencing Technology. Trends Genet. 2018, 34, 666–681. [Google Scholar] [CrossRef]
- Arboleda, V.A.; Xian, R.R. An Overview of DNA Analytical Methods. Methods Mol. Biol. 2019, 1897, 385–402. [Google Scholar] [CrossRef]
- Kumar, K.R.; Cowley, M.J.; Davis, R.L. Next-Generation Sequencing and Emerging Technologies. Semin. Thromb. Hemost. 2019, 45, 661–673. [Google Scholar] [CrossRef] [PubMed]
- Hu, T.; Chitnis, N.; Monos, D.; Dinh, A. Next-generation sequencing technologies: An overview. Hum. Immunol. 2021, 82, 801–811. [Google Scholar] [CrossRef] [PubMed]
- Flach, J.; Shumilov, E.; Joncourt, R.; Porret, N.; Novak, U.; Pabst, T.; Bacher, U. Current concepts and future directions for hemato-oncologic diagnostics. Crit. Rev. Oncol. Hematol. 2020, 151, 102977. [Google Scholar] [CrossRef]
- Patel, A.; Belykh, E.; Miller, E.J.; George, L.L.; Martirosyan, N.L.; Byvaltsev, V.A.; Preul, M.C. MinION rapid sequencing: Review of potential applications in neurosurgery. Surg. Neurol. Int. 2018, 9, 157. [Google Scholar] [CrossRef] [PubMed]
Disclaimer/Publisher’s Note: The statements, opinions and data contained in all publications are solely those of the individual author(s) and contributor(s) and not of MDPI and/or the editor(s). MDPI and/or the editor(s) disclaim responsibility for any injury to people or property resulting from any ideas, methods, instructions or products referred to in the content. |
© 2025 by the authors. Licensee MDPI, Basel, Switzerland. This article is an open access article distributed under the terms and conditions of the Creative Commons Attribution (CC BY) license (https://creativecommons.org/licenses/by/4.0/).