Simple Summary
Molecular imaging of patients with prostate cancer is widely utilized. We aimed to determine whether changes in post-processing parameters, such as maximum intensity thresholds, can significantly alter results. We investigated 623 lesions that were positive on a molecular imaging scan and could not find any relevant impact on results when certain parameters were changed, in particular in lesions indicative for metastases of prostate cancer.
Abstract
Prostate-specific membrane antigen (PSMA)-directed positron emission tomography/computed tomography (PET/CT) is increasingly utilized for staging of men with prostate cancer (PC). To increase interpretive certainty, the standardized PSMA reporting and data system (RADS) has been proposed. Using PSMA-RADS, we characterized lesions in 18 patients imaged with 18F-PSMA-1007 PET/CT for primary staging and determined the stability of semi-quantitative parameters. Six hundred twenty-three lesions were categorized according to PSMA-RADS and manually segmented. In this context, PSMA-RADS-3A (soft-tissue) or -3B (bone) lesions are defined as being indeterminate for the presence of PC. For PMSA-RADS-4 and -5 lesions; however, PC is highly likely or almost certainly present [with further distinction based on absence (PSMA-RADS-4) or presence (PSMA-RADS-5) of correlative findings on CT]. Standardized uptake values (SUVmax, SUVpeak, SUVmean) were recorded, and volumetric parameters [PSMA-derived tumor volume (PSMA-TV); total lesion PSMA (TL-PSMA)] were determined using different maximum intensity thresholds (MIT) (40 vs. 45 vs. 50%). SUVmax was significantly higher in PSMA-RADS-5 lesions compared to all other PSMA-RADS categories (p ≤ 0.0322). In particular, the clinically challenging PSMA-RADS-3A lesions showed significantly lower SUVmax and SUVpeak compared to the entire PSMA-RADS-4 or -5 cohort (p < 0.0001), while for PSMA-RADS-3B this only applies when compared to the entire PSMA-RADS-5 cohort (p < 0.0001), but not to the PSMA-RADS-4 cohort (SUVmax, p = 0.07; SUVpeak, p = 0.08). SUVmean (p = 0.30) and TL-PSMA (p = 0.16) in PSMA-RADS-5 lesions were not influenced by changing the MIT, while PSMA-TV showed significant differences when comparing 40 vs. 50% MIT (p = 0.0066), which was driven by lymph nodes (p = 0.0239), but not bone lesions (p = 0.15). SUVmax was significantly higher in PSMA-RADS-5 lesions compared to all other PSMA-RADS categories in 18F-PSMA-1007 PET/CT. As such, the latter parameter may assist the interpreting molecular imaging specialist in assigning the correct PSMA-RADS score to sites of disease, thereby increasing diagnostic certainty. In addition, changes of the MIT in PSMA-RADS-5 lesions had no significant impact on SUVmean and TL-PSMA in contrast to PSMA-TV.
1. Introduction
Prostate cancer (PC) is the second most frequent cancer in men, with more than 1.4 million new cases worldwide in 2020 [1]. The introduction of imaging agents targeting prostate-specific membrane antigen (PSMA), a type II transmembrane glycoprotein that is overexpressed on PC cells [2,3], has further improved the ability to detect and ascertain the presence of metastatic disease compared to conventional imaging [4], showing high diagnostic accuracy for primary staging and restaging during biochemical recurrence [5,6,7]. Several PSMA-targeted positron emission tomography (PET) radioligands, especially 68Ga-labeled compounds, have been established for clinical use [8]. 18F-labeled radiotracers, such as 18F-PSMA-1007, offer several key advantages when compared to their 68Ga-labeled counterparts, most notably a longer half-life (110 min vs. 68 min), improved spatial resolution, and decreased imaging noise (due to lower positron energy) as well as potential cost savings due to centralized cyclotron-production with dispatch to remote PET centers [5,8,9].
To standardize interpretation in patients imaged with PSMA-directed radiotracers, we proposed a structured reporting and data system (PSMA-RADS version 1.0) [10]. Based on a 5-point scale, this framework categorizes lesions based on their likelihood of PC involvement, with PSMA-RADS-1 being certainly benign, whereas PC is almost certainly present in a PSMA-RADS-5 lesion [10,11,12], thereby allowing for lesion-level characterization that may be helpful in planning focal therapy for limited volume disease and defining work-up strategies for indeterminate findings.
To date, PSMA-RADS has been validated in various contexts using the 18F-labeled PSMA imaging agent 18F-DCFPyL as well as 68Ga-PSMA-11 [12,13,14], but has not been valudated for [18F]PSMA-1007 positron emission tomography/computed tomography (PET/CT) scans. Given substantial differences in the lesion detection rate and normal biodistribution of those radiotracers [8,15,16], we aimed to examine the use of PSMA-RADS for 18F-PSMA-1007. In addition, we aimed to determine the stability of PSMA-RADS-based semi-quantification when different maximum intensity thresholds (MIT) were applied, in particular for PSMA-RADS-5 lesions (i.e., PC almost certainly present).
2. Materials and Methods
2.1. Patient Population
This observational retrospective study was approved by the local Institutional Review Board (IRB-Nr.: 20210204 03; date of approval: 23 March 2021) and conducted in accordance with the ethical standards of the institutional and/or national research committee as well as with the 1964 Declaration of Helsinki and its later amendments. An institutional database search for the time period from December 2018 to January 2021 identified 31 patients with newly diagnosed PC who underwent 18F-PSMA-1007 PET/CT imaging for primary staging. Patients with concomitant malignancies (n = 1), unavailability of histopathology (n = 3) and/or prior initiation of a systemic treatment, such as androgen deprivation therapy (ADT; n = 9) were excluded in order to exclude potential influences, e.g., of medication, on the level of PSMA expression. Hence, a total of 18 patients with histologically proven and treatment-naïve PC at date of scan were eligible for this study (Table 1).

Table 1.
Characteristics of the study population.
2.2. Preparation of 18F-PSMA-1007
Radiosynthesis of 18F-PSMA-1007 (radiochemical purity: ≥95%) was carried out using a GE TRACERlab MX synthesis module (GE Medical Systems, Uppsala, Sweden) as described in [17].
2.3. Image Acquisition and Reconstruction
18F-PSMA-1007 PET/CTs were performed within 28 ± 14 days after initial histopathological diagnosis. As per usual practice at our institution, patients were asked to be nil per os (excluding water and medications) for a minimum of 4 h prior to the examination. Patients received an i.v. injection of the radiotracer 18F-PSMA-1007 with a mean activity of 301 ± 15 MBq, followed by oral ingestion of an iodine-based contrast agent (30 mL Peritrast® in 1 L of water). Directly prior to the scan, patients were asked to void their urinary bladders. Furosemide was not administered. After a mean radiotracer uptake period of 91 ± 10 min, whole body imaging (from mid-thighs to skull base, in a supine position) was performed with either a 64-detector PET/CT scanner (Siemens Biograph mCT 64, Siemens Healthineers AG, Erlangen, Germany) or a 128-detector PET/CT scanner (Siemens Biograph mCT Flow 128 Edge, Siemens Healthineers AG, Knoxville, TN, USA). All PET emission data were acquired in three-dimensional mode using 6–8 bed positions (depending on the patient’s height) with a scan duration of 2 min per bed position [18]. Subsequently, after i.v. injection of an iodine-based contrast agent (1 mL/kg body weight of Imeron® 350), a monophasic full-dose CT scan (100–120 kV, mA modulated) was performed for anatomic correlation and attenuation correction [18,19]. Iterative image reconstruction was achieved using an ordered subset expectation maximization (OSEM) algorithm either with 3 iterations and 24 subsets followed by post-reconstruction Gaussian filter smoothing (full width at half maximum (FWHM): 2 mm; Siemens TrueX; Siemens Biograph mCT 64) or with 3 iterations and 21 subsets followed by post-reconstruction Gaussian filter smoothing (FWHM: 2 mm; Siemens TrueX + TOF ultraHD; Siemens Biograph mCT Flow 128 Edge) [19]. Reconstructed PET images had a spatial resolution with an FWHM of 4.7 mm (Siemens Biograph mCT Flow 128 Edge) or 5.7 mm (Siemens Biograph mCT 64) [19].
2.4. Image Analysis
PET, CT, and hybrid PET/CT overlay images were assessed using a dedicated workstation equipped with syngo.via imaging software, version VB50B_HF02 (Siemens Healthineers AG, Erlangen, Germany). Scans were evaluated by a reader with 3 years’ experience in reading PSMA-targeted PET/CTs (P.W.M.) who previously underwent a training session for the standardized reporting system PSMA-RADS version 1.0 [10]. In ambiguous cases, PSMA-RADS categories were assigned in a consensus read with two experienced readers, including a board-certified radiologist and nuclear medicine physician (M.B., R.A.W.).
All measurable lesions were noted along with their location (bone, lymph node, liver, lung, soft tissue, primary) and were assigned to a PSMA-RADS category [14] (with soft tissue lesions defined as lesions not being assigned to one of the other five compartments). In total, four patients (4/18, 22.2%) with disseminated skeletal metastatic disease were encountered, in whom up to ten separate bone lesions were recorded. In brief, PSMA-RADS-1A and -1B represent definitely benign lesions, while likely benign lesions are categorized as PSMA-RADS-2. By contrast, lesions in which the presence of PC is highly likely or almost certainly present are classified as PSMA-RADS-4 or PSMA-RADS-5, with further distinction based on absence (PSMA-RADS-4) or presence (PSMA-RADS-5) of correlative findings on computed tomography (CT) [10,11]. PSMA-RADS-3, however, is the most complex category, and is divided into four subcategories [10]. PSMA-RADS-3A and PSMA-RADS-3B define lesions that would be typical for PC, but having only subtle radiotracer uptake in soft tissue or bone lesions, respectively, rendering those findings equivocal. PSMA-RADS-3C and PSMA-RADS-3D lesions, however, are unlikely to represent PC and require further work-up [10].
By using a 3-dimensional segmentation method, an isocontour volume of interest (VOI) was created separately for all lesions before the maximum and peak standardized uptake value corrected to body weight (SUVmax and SUVpeak) were recorded for each lesion [20,21]. While keeping the VOI for each lesion identical, different MITs were then applied (40, 45, and 50%), i.e., a pre-specified percentage VOI which only includes all voxels equal to or above the chosen percentage of SUVmax [22]. In addition, the mean standardized uptake value (SUVmean) and volumetric parameters were measured for each lesion, yielding a PSMA-derived tumor volume (PSMA-TV, cm3) and total lesion PSMA (TL-PSMA, cm3). As SUVmean, PSMA-TV and TL-PSMA are influenced by changes of the MIT, all lesions were measured applying a MIT of 40, 45, and 50% in the identical VOI, as described for 68Ga-labeled PSMA PET in [20]. TL-PSMA was calculated as follows [20]:
PSMA-TV × SUVmean
As such, for those three parameters, values for MIT of 40, 45, and 50% were recorded.
2.5. Statistical Analysis
Statistical analyses were performed with GraphPad Prism software, version 9.2.0.332 (GraphPad Software, Inc., San Diego, CA, USA) and Microsoft Excel 2016 (Microsoft Corporation, Redmond, WA, USA). All continuous data are expressed as either mean or median value ± standard deviation (SD) and range in parentheses. Categorical variables are presented as frequency and percentage in parentheses. Comparisons between subgroups were made using the Kruskal-Wallis test. p values < 0.05 were considered statistically significant (*, p < 0.05; **, p < 0.01; ***, p < 0.001; ****, p < 0.0001).
3. Results
3.1. Prevalence of PSMA-RADS-4 and -5 Lesions Was High
Across all patients, a total of 623 lesions were analyzed on 18F-PSMA-1007 PET/CT, with the vast majority of lesions either located in lymph nodes (449/623, 72.1%) or in the skeleton (105/623, 16.8%). Moreover, the following compartments were also assessed: lung (28/623, 4.5%), soft tissue (20/623, 3.2%), primary (18/623, 2.9%), and liver lesions (3/623, 0.5%).
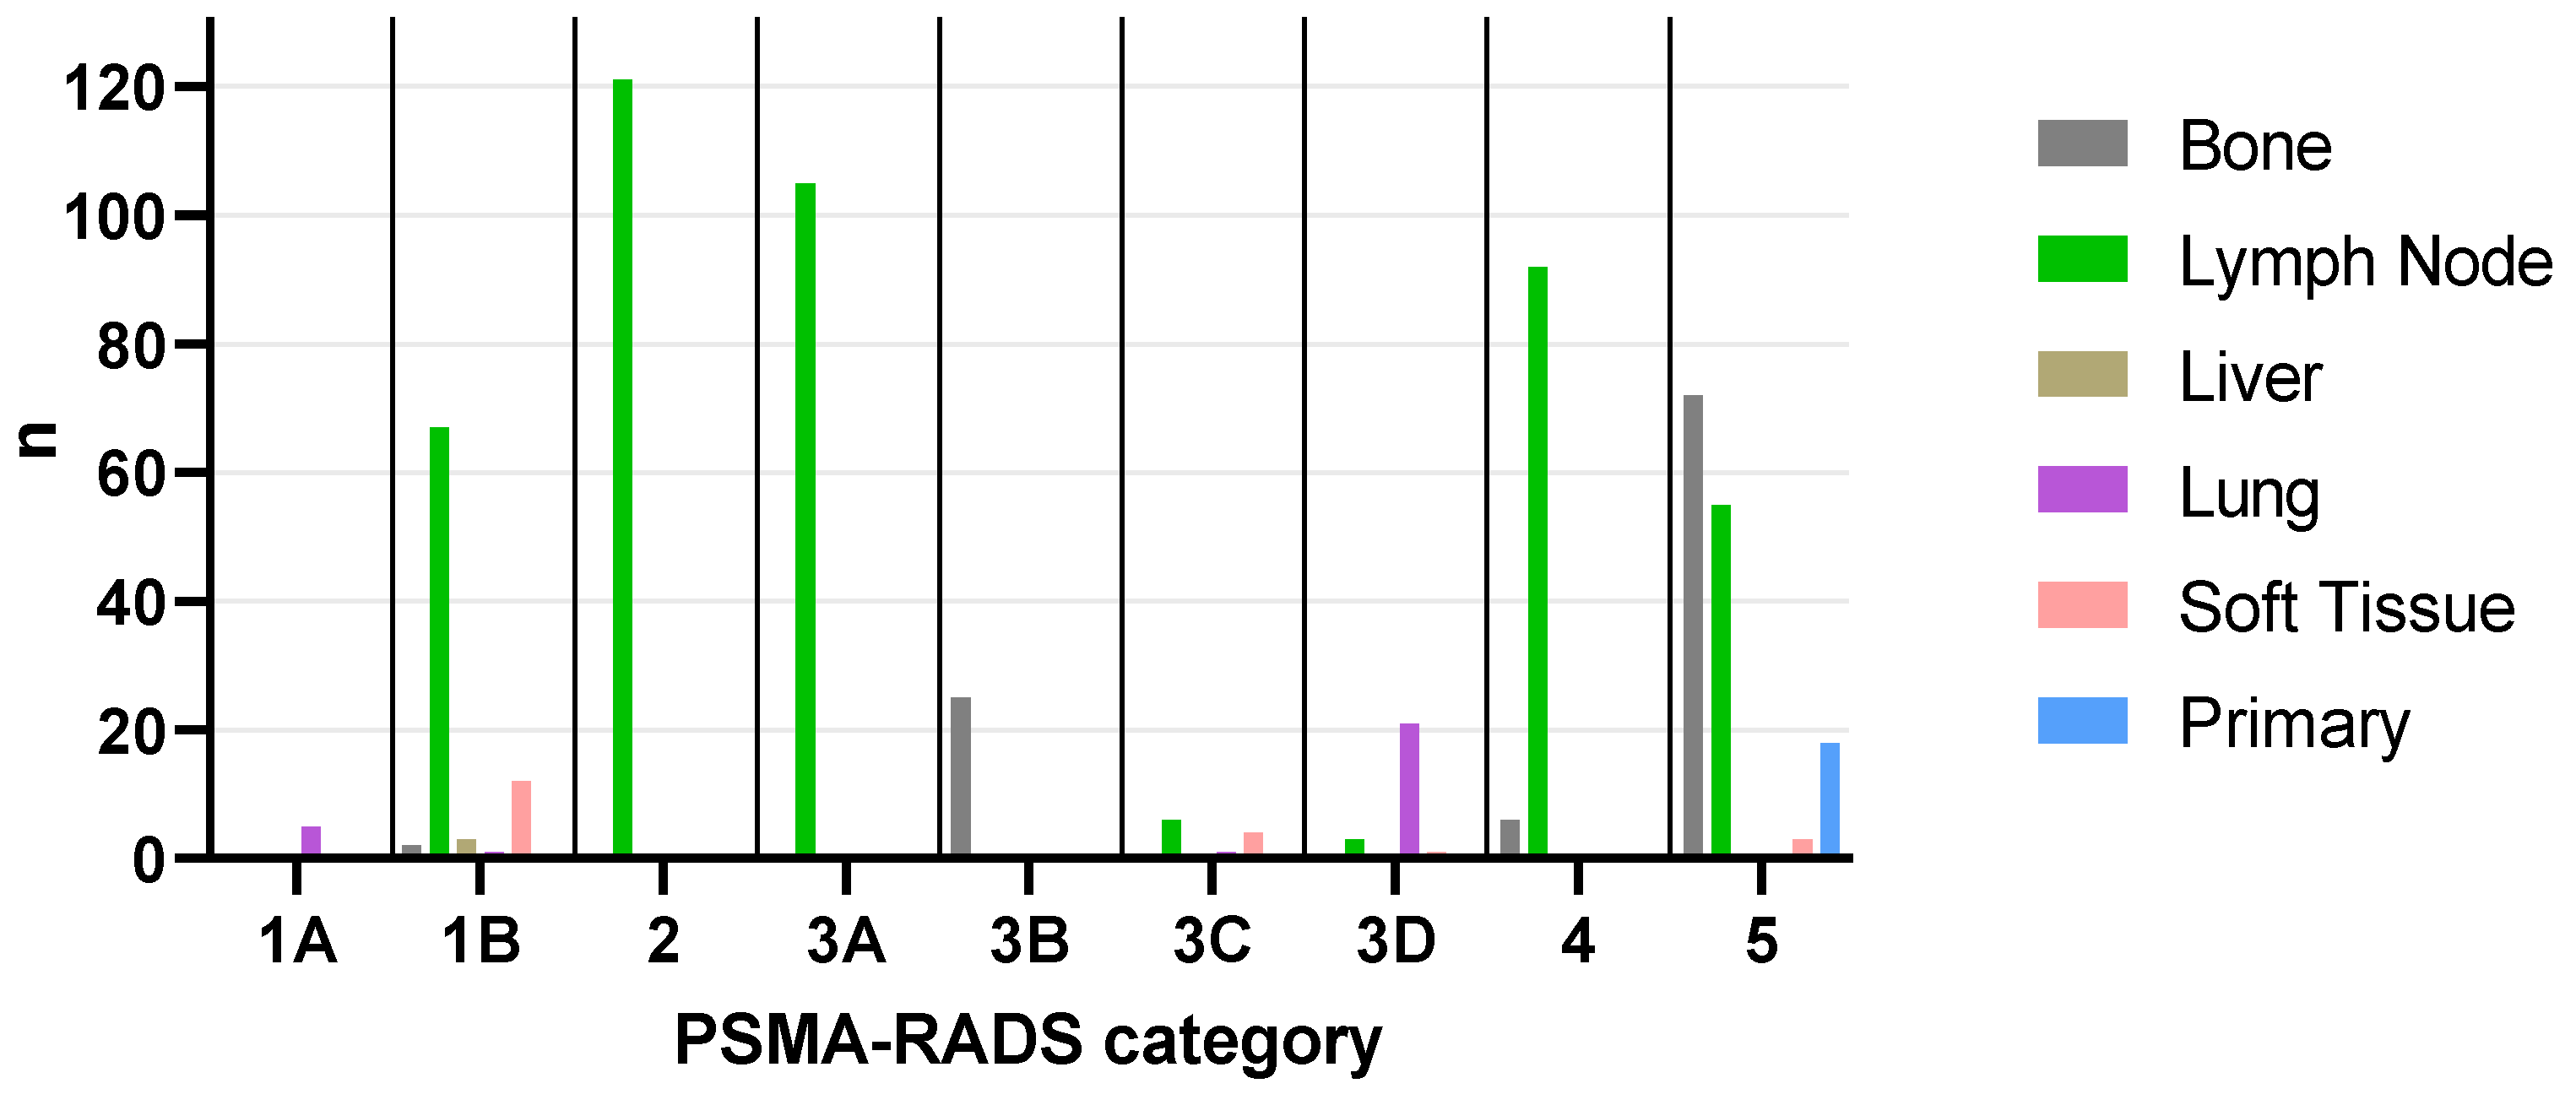
A plurality of lesions were categorized as PSMA-RADS-5 (148/623, 23.8%), followed by PSMA-RADS-2 (121/623, 19.4%), PSMA-RADS-3A (105/623, 16.9%), PSMA-RADS-4 (98/623, 15.7%), PSMA-RADS-1B (85/623, 13.6%), PSMA-RADS-3B (25/623, 4.0%), PSMA-RADS-3D (25/623, 4.0%), PSMA-RADS-3C (11/623, 1.8%), and PSMA-RADS-1A (5/623, 0.8%). Sorted by PSMA-RADS categories, the distribution among organ compartments can be found in Table A1, while an overview for each patient is given in Table A2. The distribution of all lesions (n = 623) across all compartments and PSMA-RADS categories is shown in Figure 1.
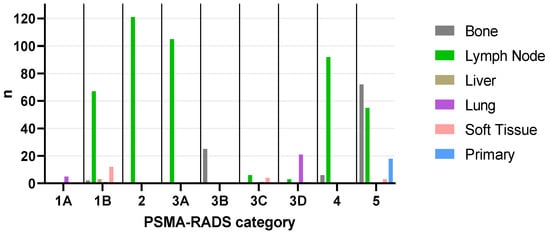
Figure 1.
Bar graph showing the distribution of total lesions (n = 623) across all compartments and PSMA-RADS categories. Bone: 1B (n = 2), 3B (n = 25), 4 (n = 6), 5 (n = 72), total (n = 105); Lymph Node: 1B (n = 67), 2 (n = 121), 3A (n = 105), 3C (n = 6), 3D (n = 3), 4 (n = 92), 5 (n = 55), total (n = 449); Liver: 1B (n = 3), total (n = 3); Lung: 1A (n = 5), 1B (n = 1), 3C (n = 1), 3D (n = 21), total (n = 28); Soft Tissue: 1B (n = 12), 3C (n = 4), 3D (n = 1), 5 (n = 3), total (n = 20); Primary: 5 (n = 18), total (n = 18). PSMA-RADS = prostate-specific membrane antigen reporting and data system.
3.2. SUVmax of PSMA-RADS-5 Lesions Differed Significantly When Compared to All Other PSMA-RADS Categories
Including all lesions (independent of organ compartments), lesions classified as PSMA-RADS-1A, -1B, -2, and -3D each demonstrated a significantly lower SUVmax and SUVpeak when compared to PSMA-RADS-4 (SUVmax, p < 0.0001; SUVpeak, p ≤ 0.0002) or PSMA-RADS-5 (SUVmax, p < 0.0001; SUVpeak, p < 0.0001). Interestingly, lesions classified as PSMA-RADS-3A also showed a significantly lower SUVmax and SUVpeak compared to PSMA-RADS-4 or -5 (p < 0.0001). For all lesions categorized as PSMA-RADS-3C, SUVmax was significantly lower compared to PSMA-RADS-5 (p = 0.0322); however, no significant difference was noted for SUVmax compared to PSMA-RADS-4 (p > 0.99) as well as for SUVpeak compared to both PSMA-RADS-4 (p > 0.99) and -5 (p = 0.08). Lesions categorized as PSMA-RADS-4 also showed a significantly lower SUVmax (p = 0.0027) and SUVpeak (p < 0.0001) compared to PSMA-RADS-5.
Lymph nodes categorized as PSMA-RADS-1B, -2, and -3A showed a significantly lower SUVmax (p < 0.0001) and SUVpeak (p < 0.0001) compared to the entire PSMA-RADS-4 or -5 cohort. Lymph nodes in category PSMA-RADS-3D (n = 3) also showed a significantly lower SUVmax compared to PSMA-RADS-5 (p = 0.0131), but not -4 (p = 0.28), while SUVpeak did not significantly differ (p ≥ 0.16). For PSMA-RADS-3C (n = 6), SUVmax and SUVpeak did not significantly differ compared to PSMA-RADS-4 (p > 0.99) or -5 (SUVmax, p = 0.17; SUVpeak, p = 0.29). Lymph nodes classified as PSMA-RADS-4 showed a significantly lower SUVmax (p = 0.0007) and SUVpeak (p < 0.0001) compared to the entire PSMA-RADS-5 cohort.
For bone lesions, significantly lower SUVmax and SUVpeak for PSMA-RADS-3B lesions were noted when compared to the entire PSMA-RADS-5 cohort (p < 0.0001), but not compared to the PSMA-RADS-4 cohort (SUVmax, p = 0.07; SUVpeak, p = 0.08). SUVmax and SUVpeak of PSMA-RADS-4 bone lesions did not significantly differ from the entire PSMA-RADS-5 cohort (p ≥ 0.62).
Figure 2 displays SUVmax and SUVpeak among the different PSMA-RADS categories and organ compartments.
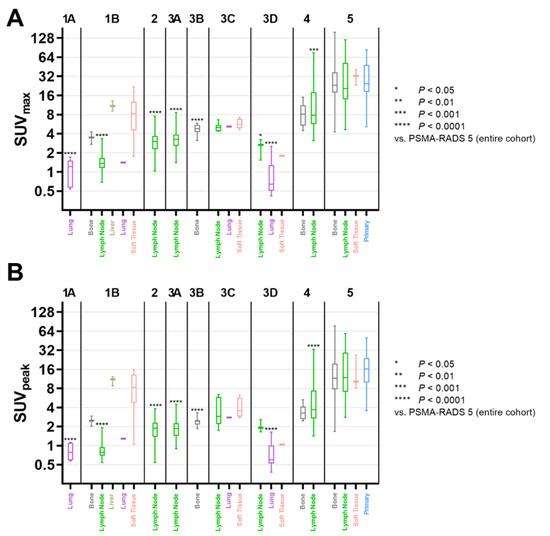
Figure 2.
Box-and-whisker charts showing the maximum (SUVmax, (A)) and peak standardized uptake value (SUVpeak, (B)) among compartments and different PSMA-RADS categories. For each subgroup of PSMA-RADS categories 1-4, mean values were compared to PSMA-RADS-5. Both SUVmax and SUVpeak of lymph nodes in PSMA-RADS categories 1B, 2, 3A, and 4 differed significantly compared to PSMA-RADS-5 lesions (SUVmax, p ≤ 0.0007; SUVpeak, p < 0.0001); lymph nodes in PSMA-RADS-3D also showed a significantly lower SUVmax (p = 0.0131). Regarding bone lesions, compared to the entire PSMA-RADS-5 category SUVmax and SUVpeak were significantly lower only for PSMA-RADS-3B (p < 0.0001), but not for PSMA-RADS categories 1B (p ≥ 0.49) and 4 (p ≥ 0.62). Data are shown on a logarithmic scale. PSMA-RADS = prostate-specific membrane antigen reporting and data system.
3.3. SUVmean and Volumetric Parameters of PSMA-RADS-5 Lesions Were Susceptible to MIT Changes of 40 to 50%, But Not 40 to 45% or 45 to 50%
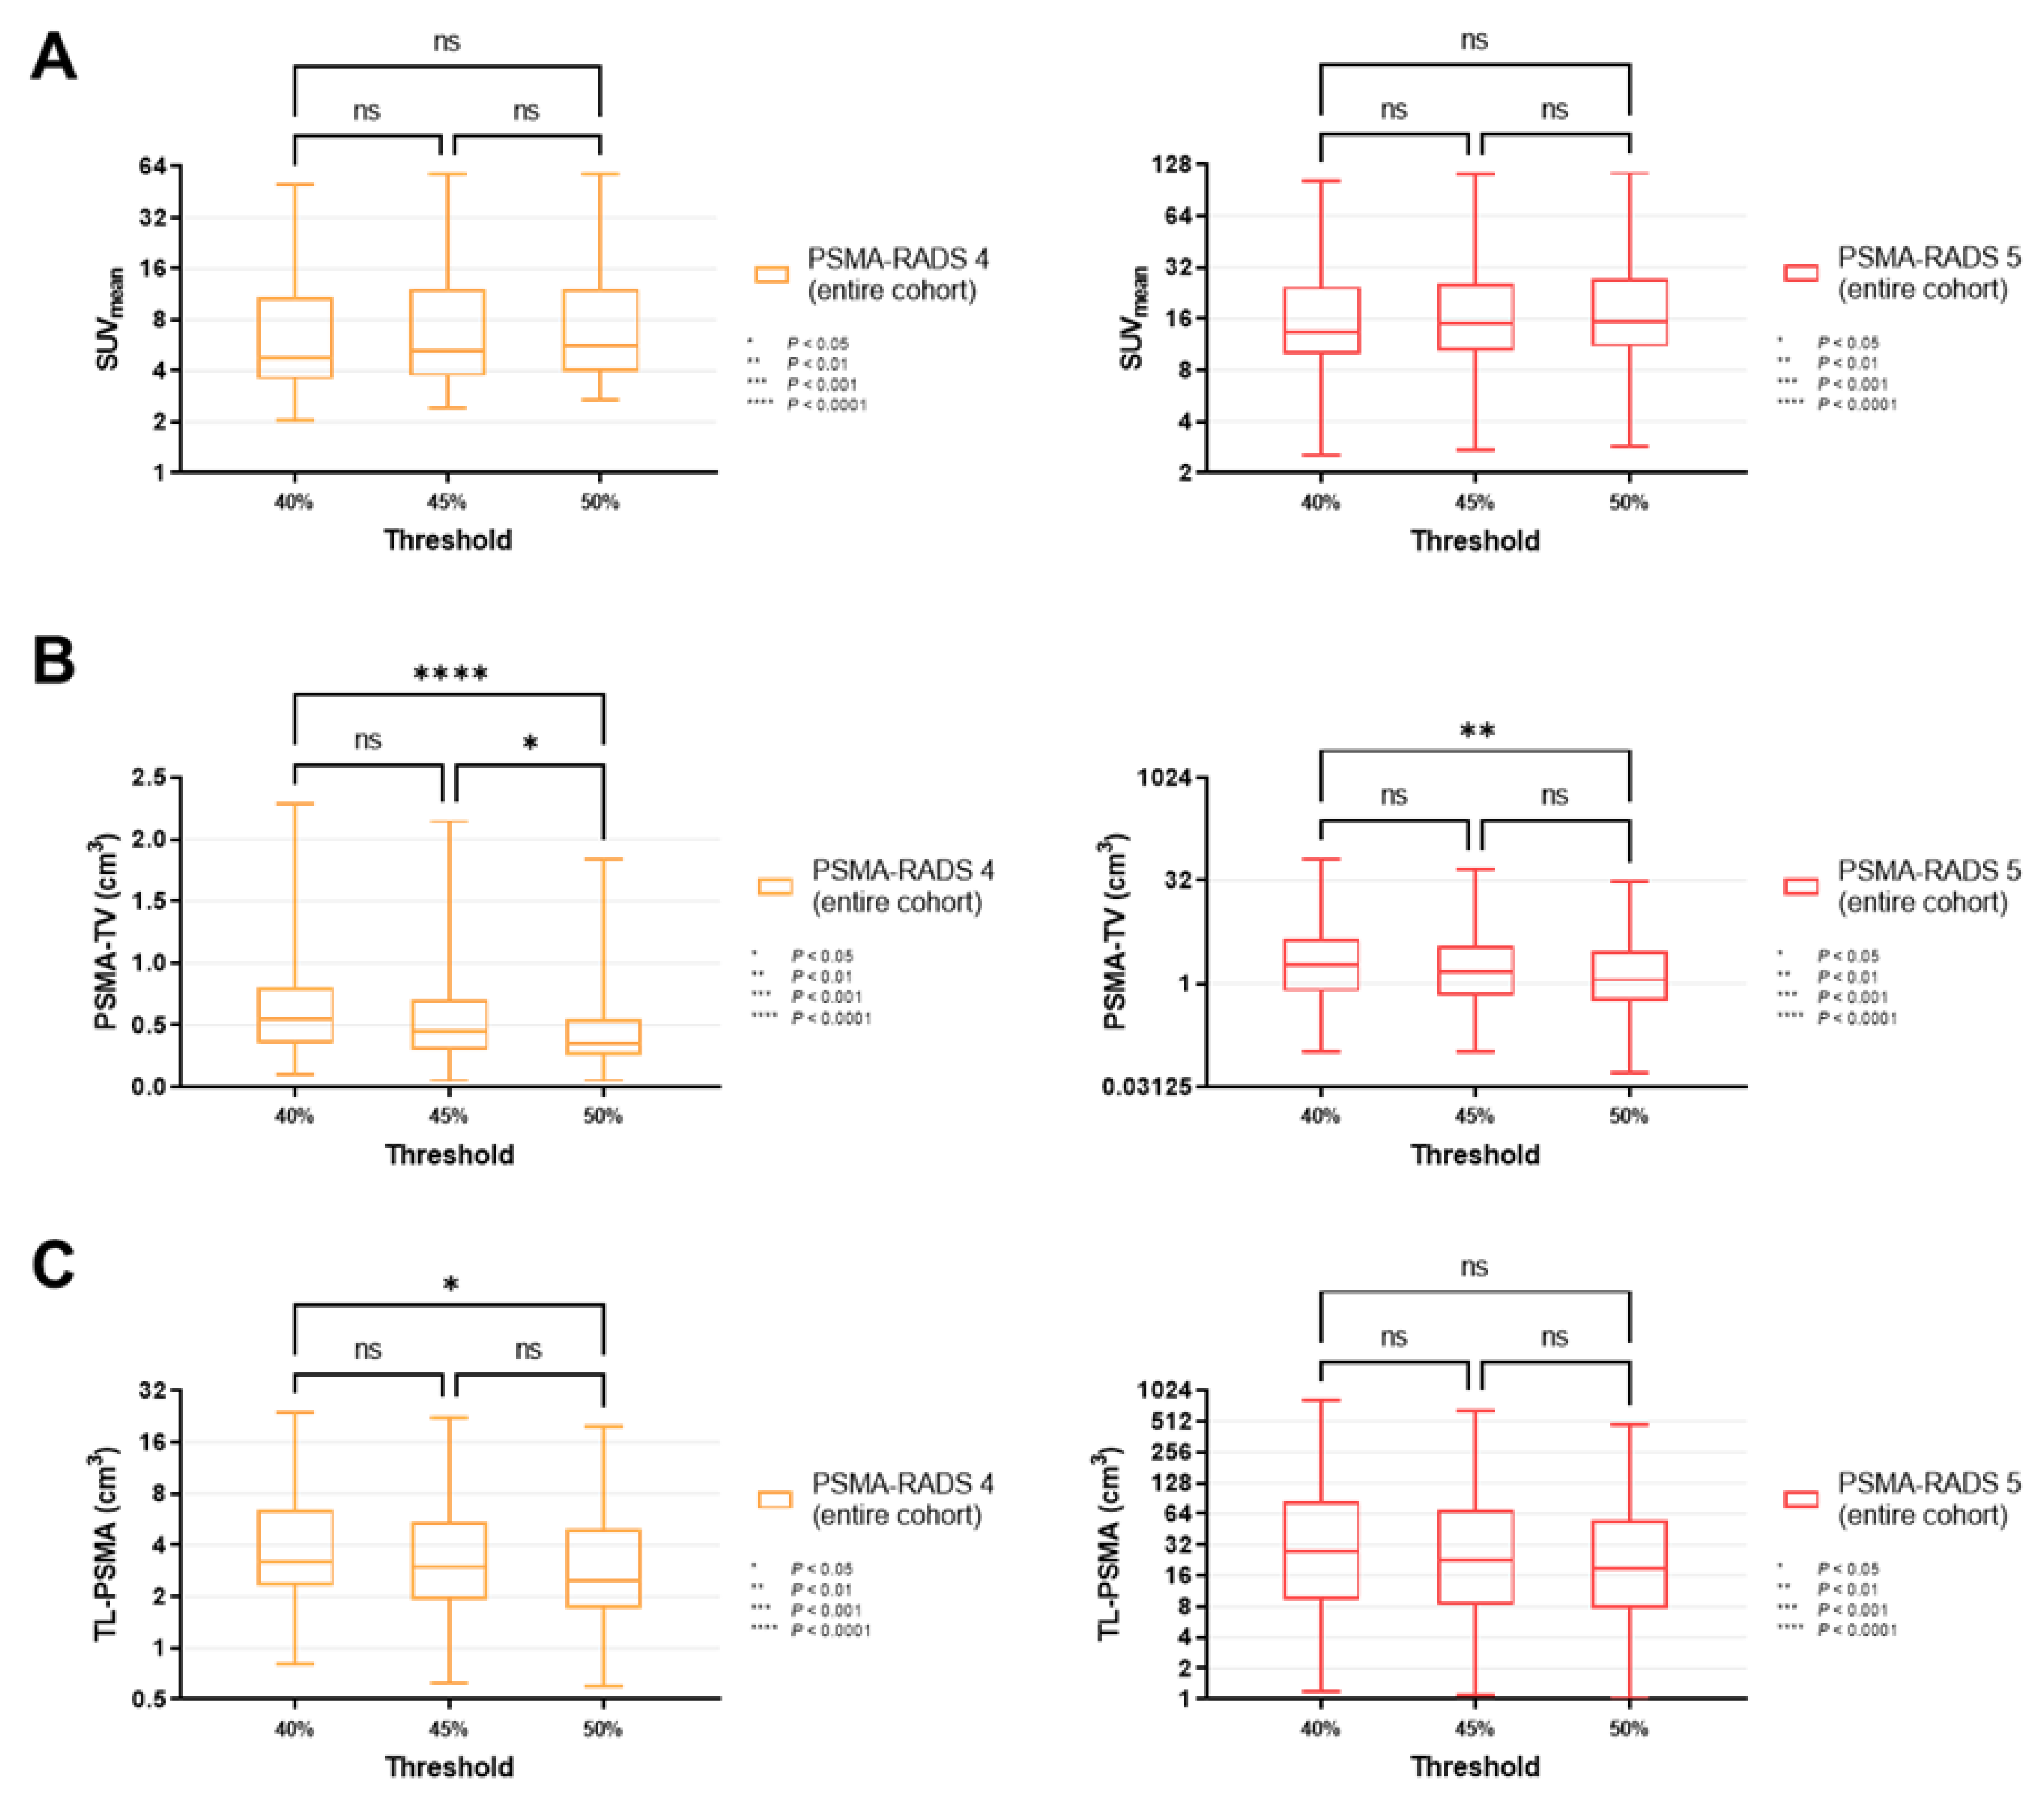
For all lesions classified as PSMA-RADS-4 (p ≥ 0.34) and -5 (p ≥ 0.30), SUVmean did not change significantly when different MITs were applied (40 vs. 45 vs. 50%, Figure 3A). Similar results were recorded for PSMA-RADS-4/-5 lesions in the lymph nodes and skeleton (lymph nodes, p ≥ 0.40; skeleton, p ≥ 0.31, Figure 4A and Figure 5A).
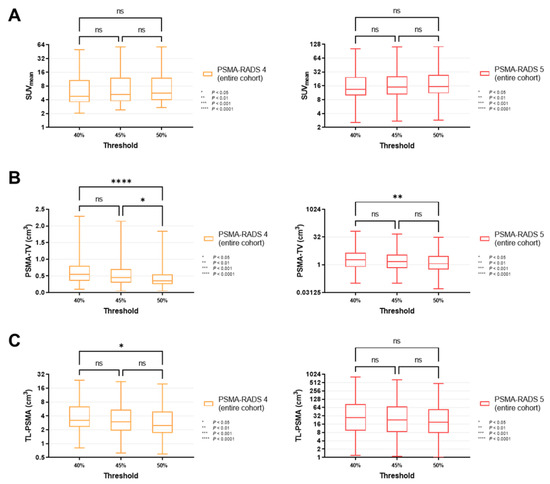
Figure 3.
Box-and-whisker charts showing the mean standardized uptake values (SUVmean, (A)) and volumetric parameters [PSMA-avid tumor volume (PSMA-TV, (B)), and total lesion (TL-PSMA, (C))], depending on the chosen intensity threshold (40 vs. 45 vs. 50%), for all lesions classified as PSMA-RADS-4 or -5 (overall lesion level). (A) SUVmean did not differ significantly between different intensity thresholds, for both PSMA-RADS-4 (p ≥ 0.34) and -5 lesions (p ≥ 0.30). (B) PSMA-TV changed significantly when changing the intensity threshold from 40 to 50% (PSMA-RADS-4, p < 0.0001; PSMA-RADS-5, p = 0.0066). When changing the intensity threshold in a smaller increment to 45%, the differences became largely insignificant (except for PSMA-RADS-4, p = 0.0450) (C) While changing the intensity threshold from 40 to 50% led to a significant difference in TL-PSMA of PSMA-RADS-4 lesions (p = 0.0272), TL-PSMA did not change significantly when smaller increments of 5% were applied (p ≥ 0.54). For PSMA-RADS-5 lesions, there was no statistical difference between the individual subgroups (p ≥ 0.16). Data are shown on a logarithmic scale (exception: linear scale for PSMA-TV in the PSMA-RADS-4 cohort). PSMA-RADS = prostate-specific membrane antigen reporting and data system.
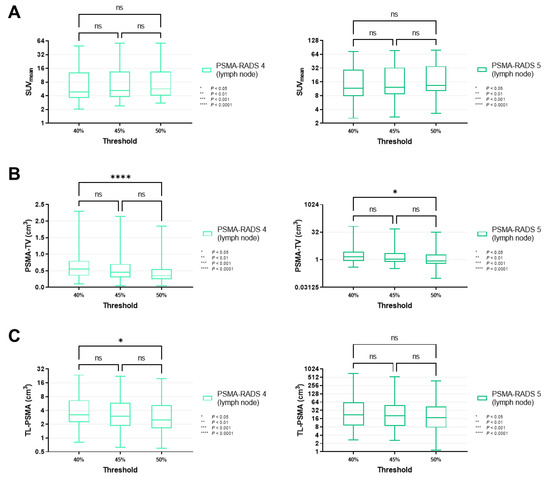
Figure 4.
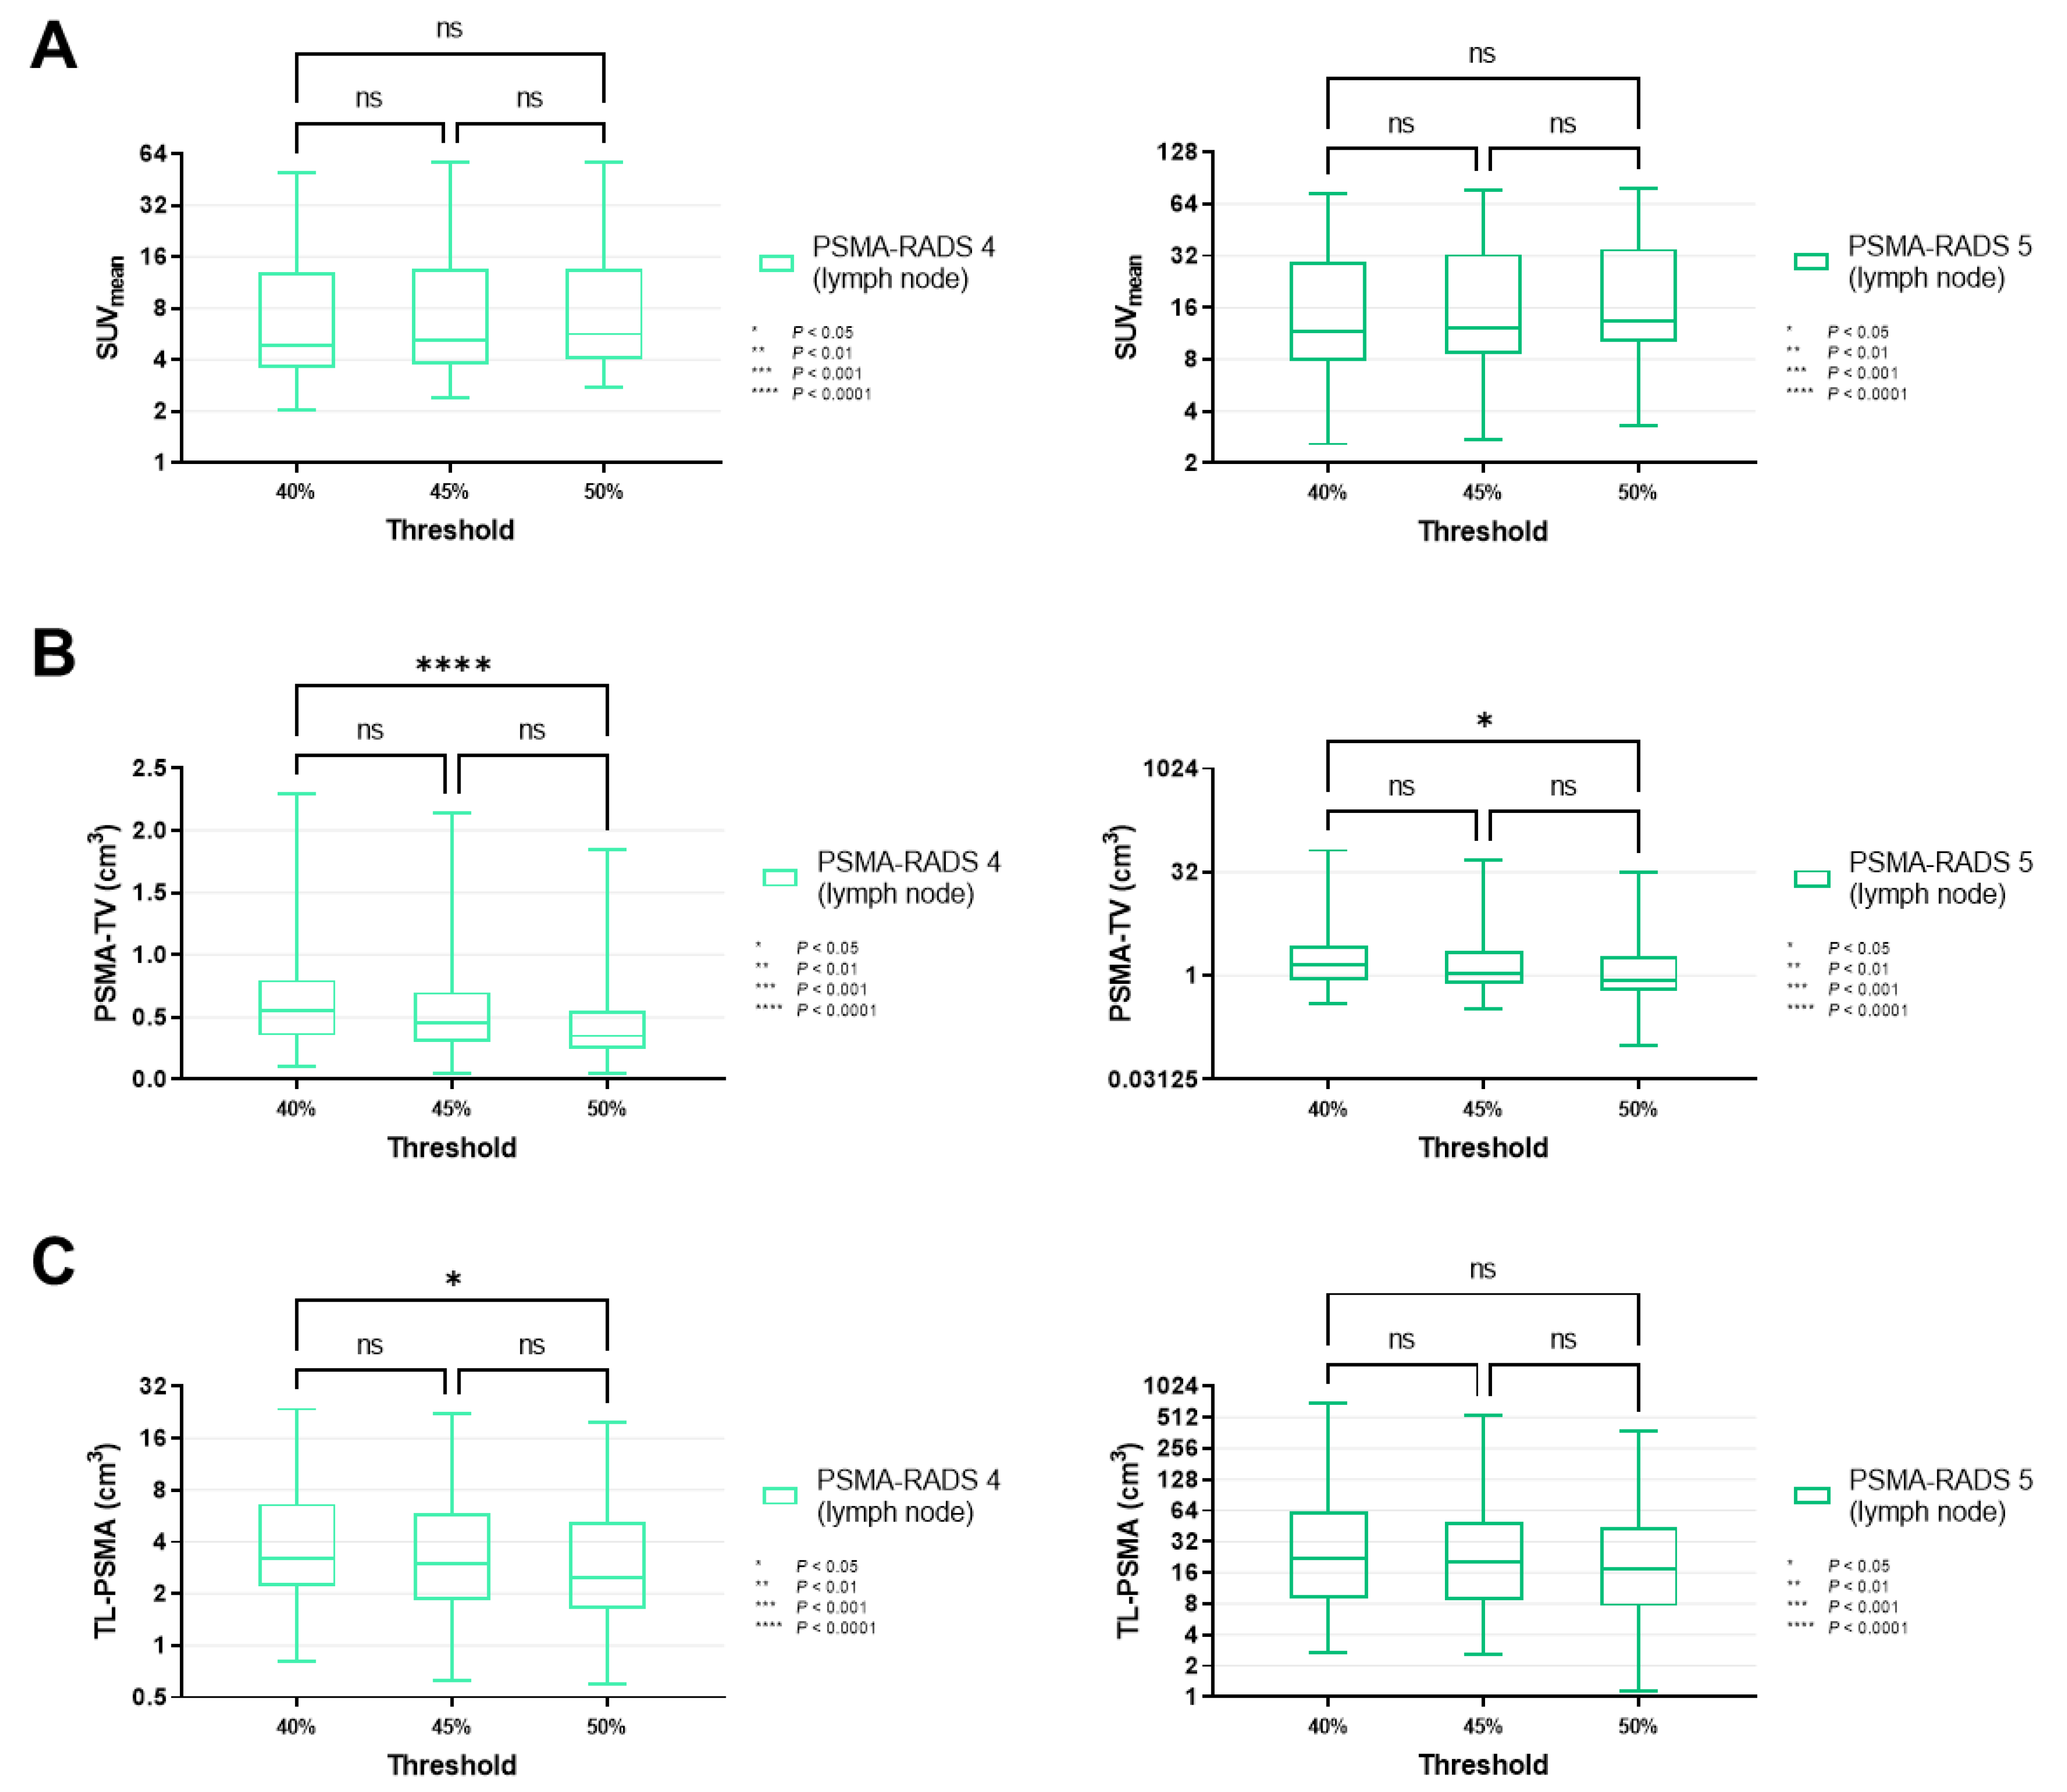
Box-and-whisker charts showing the mean standardized uptake values (SUVmean, (A)) and volumetric parameters [PSMA-avid tumor volume (PSMA-TV, (B)), and total lesion (TL-PSMA, (C))], depending on the chosen intensity threshold (40 vs. 45 vs. 50%), for lymph node lesions classified as PSMA-RADS-4 or -5. (A) Similar to SUVmean on an overall lesion level (Figure 3A), values of lymph nodes categorized as PSMA-RADS-4 (p ≥ 0.40) and -5 (p ≥ 0.87) did not differ significantly between different intensity thresholds. (B,C) PSMA-TV reached significance in a comparison of intensity thresholds of 40 vs. 50% (p = 0.0239), in a manner similar to an overall lesion level (Figure 3B), thereby suggesting that these findings are primarily driven by lymph node lesions. The same applies to TL-PSMA (Figure 3C), which only showed a significant difference when comparing 40 and 50% in PSMA-RADS-4 lymph node lesions (p = 0.0453), but not for the skeleton (p ≥ 0.33, Figure 5). Data are shown on a logarithmic scale (exception: linear scale for PSMA-TV in the PSMA-RADS-4 cohort). PSMA-RADS = prostate-specific membrane antigen reporting and data system.

Figure 5.
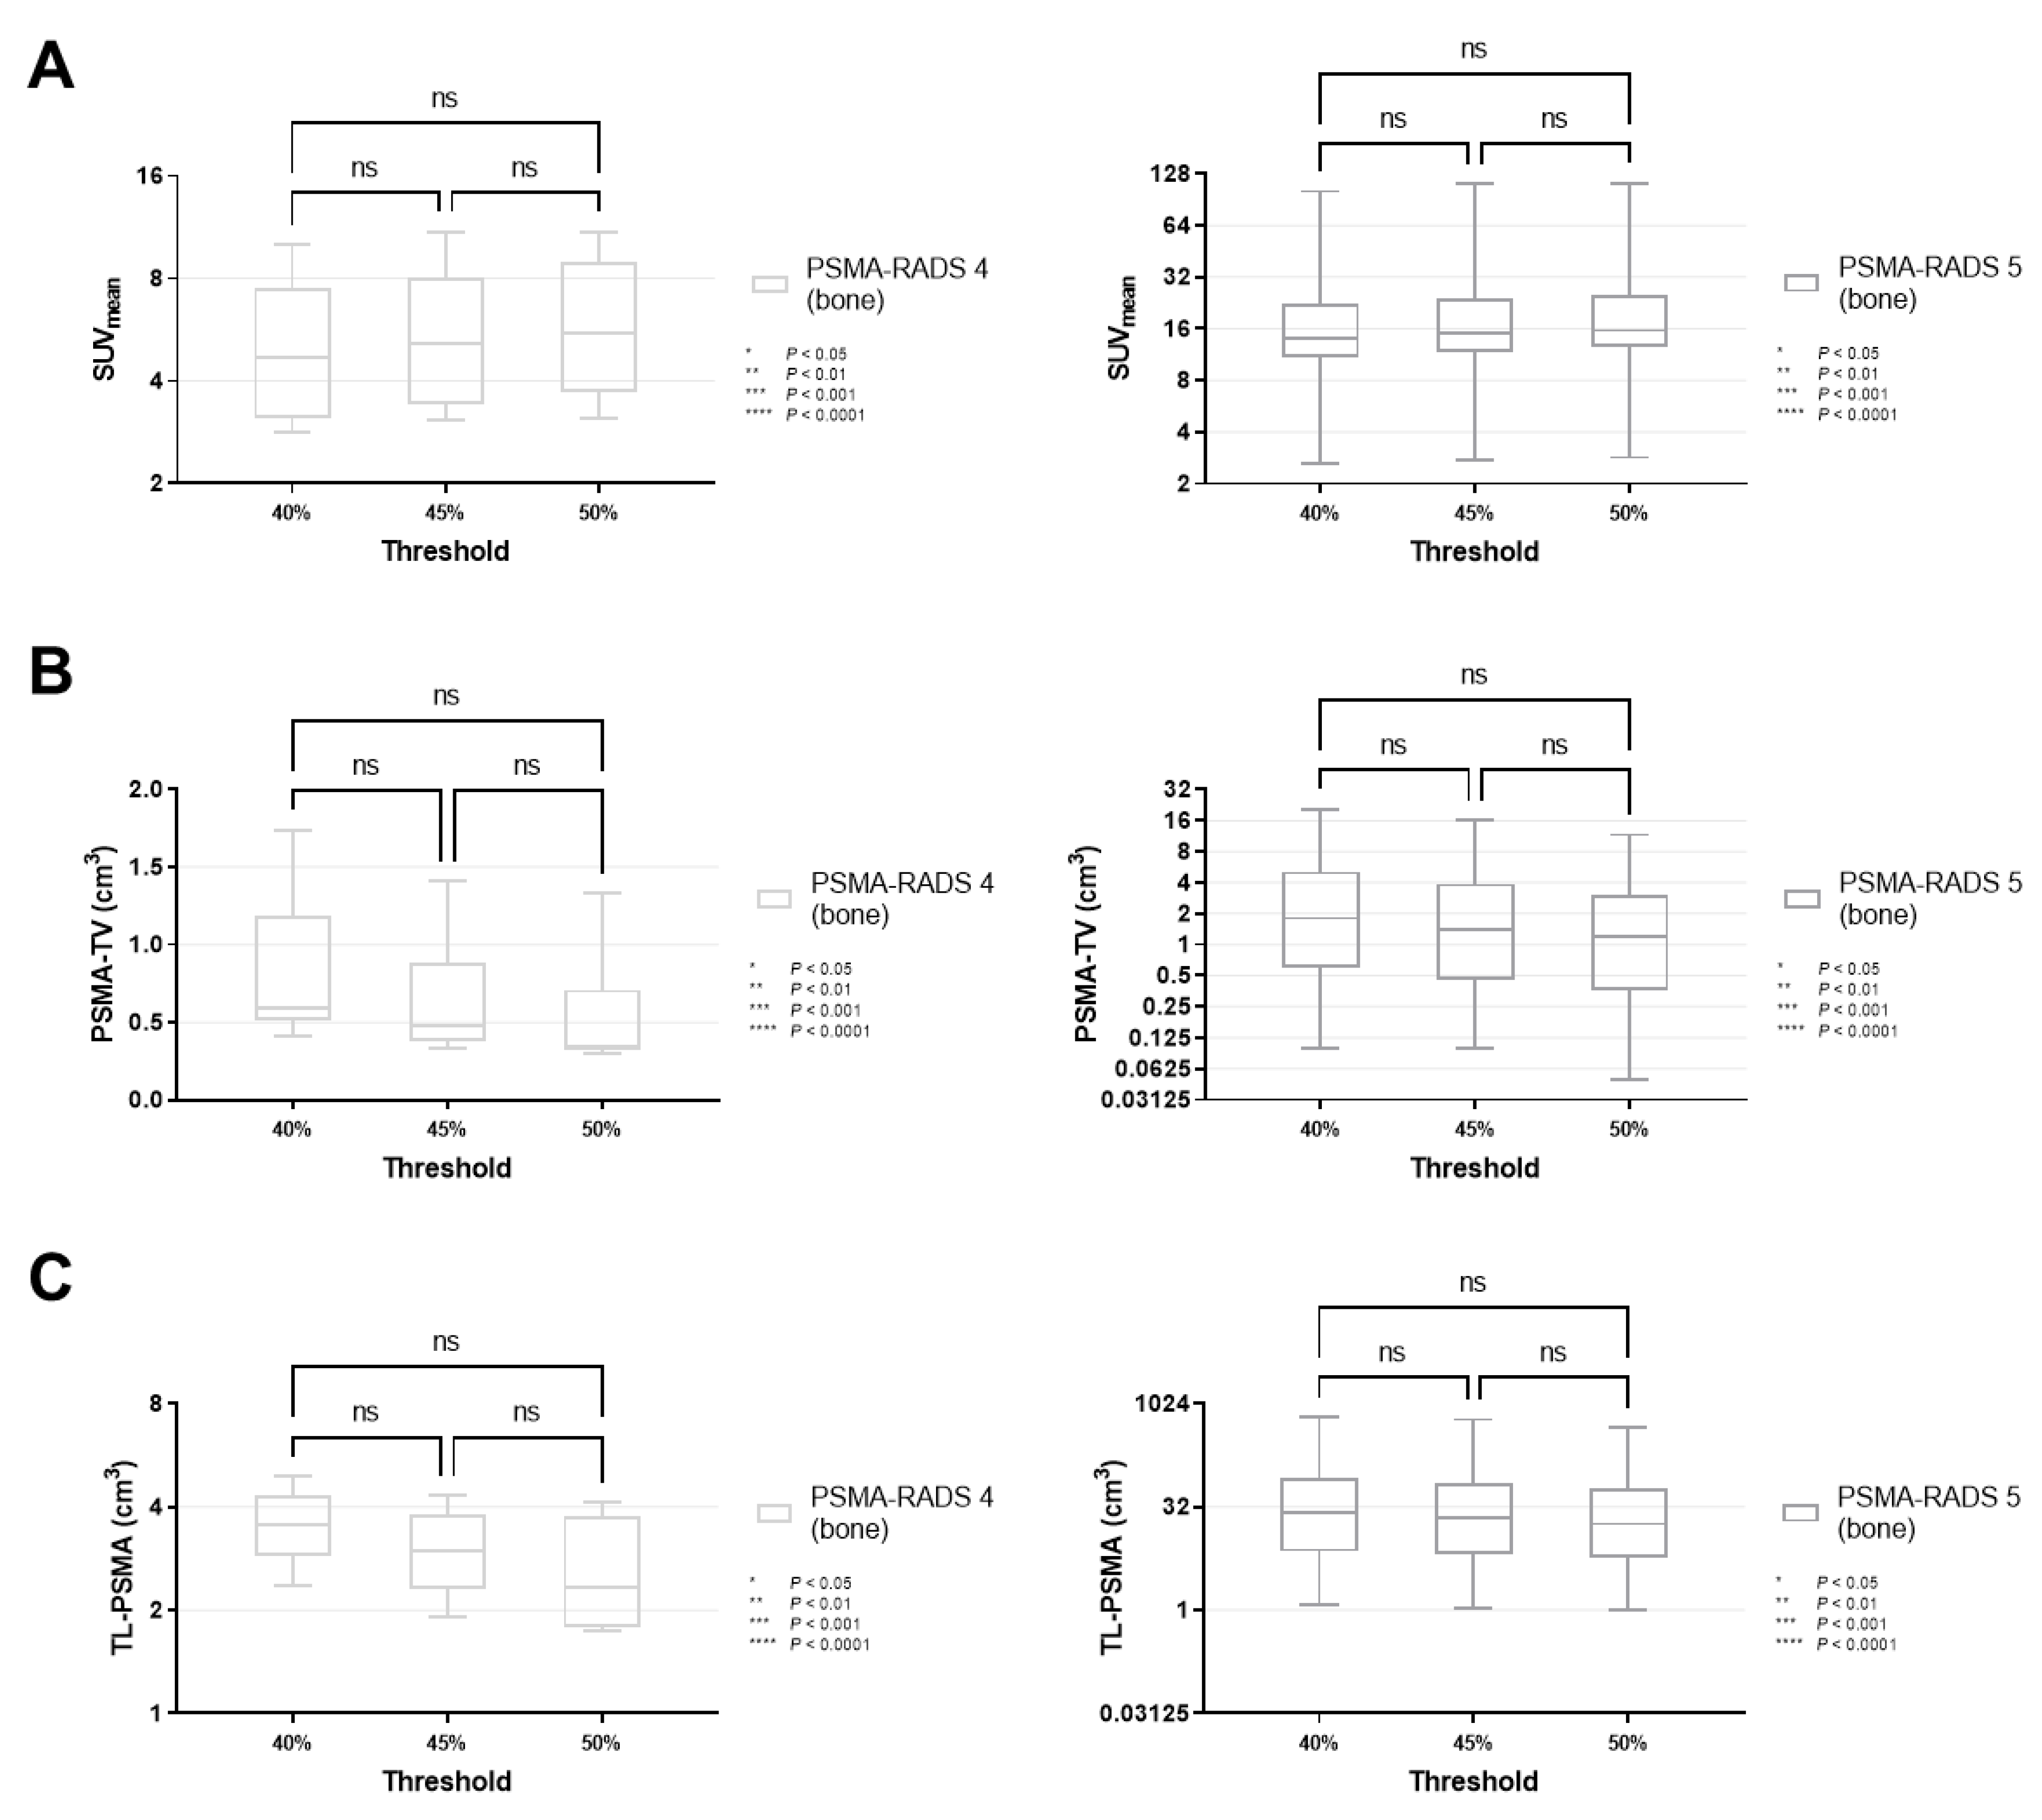
Box-and-whisker charts showing the mean standardized uptake values (SUVmean, (A)) and volumetric parameters [PSMA-avid tumor volume (PSMA-TV, (B)), and total lesion (TL-PSMA, (C))], depending on the chosen intensity threshold (40 vs. 45 vs. 50%), for bone lesions classified as PSMA-RADS-4 or -5. SUVmean (p ≥ 0.31), PSMA-TV (p ≥ 0.11) and TL-PSMA (p ≥ 0.33) did not differ significantly when changing the intensity threshold. Data are shown on a logarithmic scale (exception: linear scale for PSMA-TV in the PSMA-RADS-4 cohort). PSMA-RADS = prostate-specific membrane antigen reporting and data system.
By contrast, PSMA-TV differed significantly in both cohorts when comparing a MIT of 40 vs. 50% (PSMA-RADS-4, p < 0.0001; PSMA-RADS-5, p = 0.0066). When smaller increments of 5% were applied, there was still a significant difference in the PSMA-RADS-4 cohort for MIT of 45 vs. 50% (p = 0.0450). However, no significant level of difference was reached for MIT of 45 vs. 50% in the PSMA-RADS-5 cohort (p = 0.44) as well as for MIT of 40 vs. 45% in both cohorts (PSMA-RADS-4, p = 0.07; PSMA-RADS-5, p = 0.32, Figure 3B). On an organ-compartment level, those findings were primarily driven by lymph nodes (40 vs. 50% for PSMA-RADS-4, p < 0.0001; 40 vs. 50% for PSMA-RADS-5, p = 0.0239, Figure 4B), while PSMA-TV did not differ significantly in bone lesions (40 vs. 50% for PSMA-RADS-4, p = 0.11; 40 vs. 50% for PSMA-RADS-5, p = 0.15, Figure 5B). Again, when comparing smaller MIT differences, no significant difference of PSMA-TV was seen for lymph nodes (40 vs. 45% for PSMA-RADS-4, p = 0.10; 45 vs. 50% for PSMA-RADS-4, p = 0.07; 40 vs. 45% for PSMA-RADS-5, p = 0.72; 45 vs. 50% for PSMA-RADS-5, p = 0.42, Figure 4B).
For TL-PSMA, a significant difference was observed between MIT of 40 vs. 50% for PSMA-RADS-4 on an overall lesion level (p = 0.0272), whereas significance was not reached when changing the MIT to 45% (40 vs. 45% for PSMA-RADS-4, p = 0.61; 45 vs. 50% for PSMA-RADS-4, p = 0.54, Figure 3C). This was also driven by lymph nodes (40 vs. 45% for PSMA-RADS-4, p = 0.0453, Figure 4C). Regardless which MIT was applied, there were no significant differences of TL-PSMA in the PSMA-RADS-5 category, neither for all lesions (p ≥ 0.16, Figure 3C), nor for lymph node (p ≥ 0.67, Figure 4C) or bone lesions (p ≥ 0.56, Figure 5C).
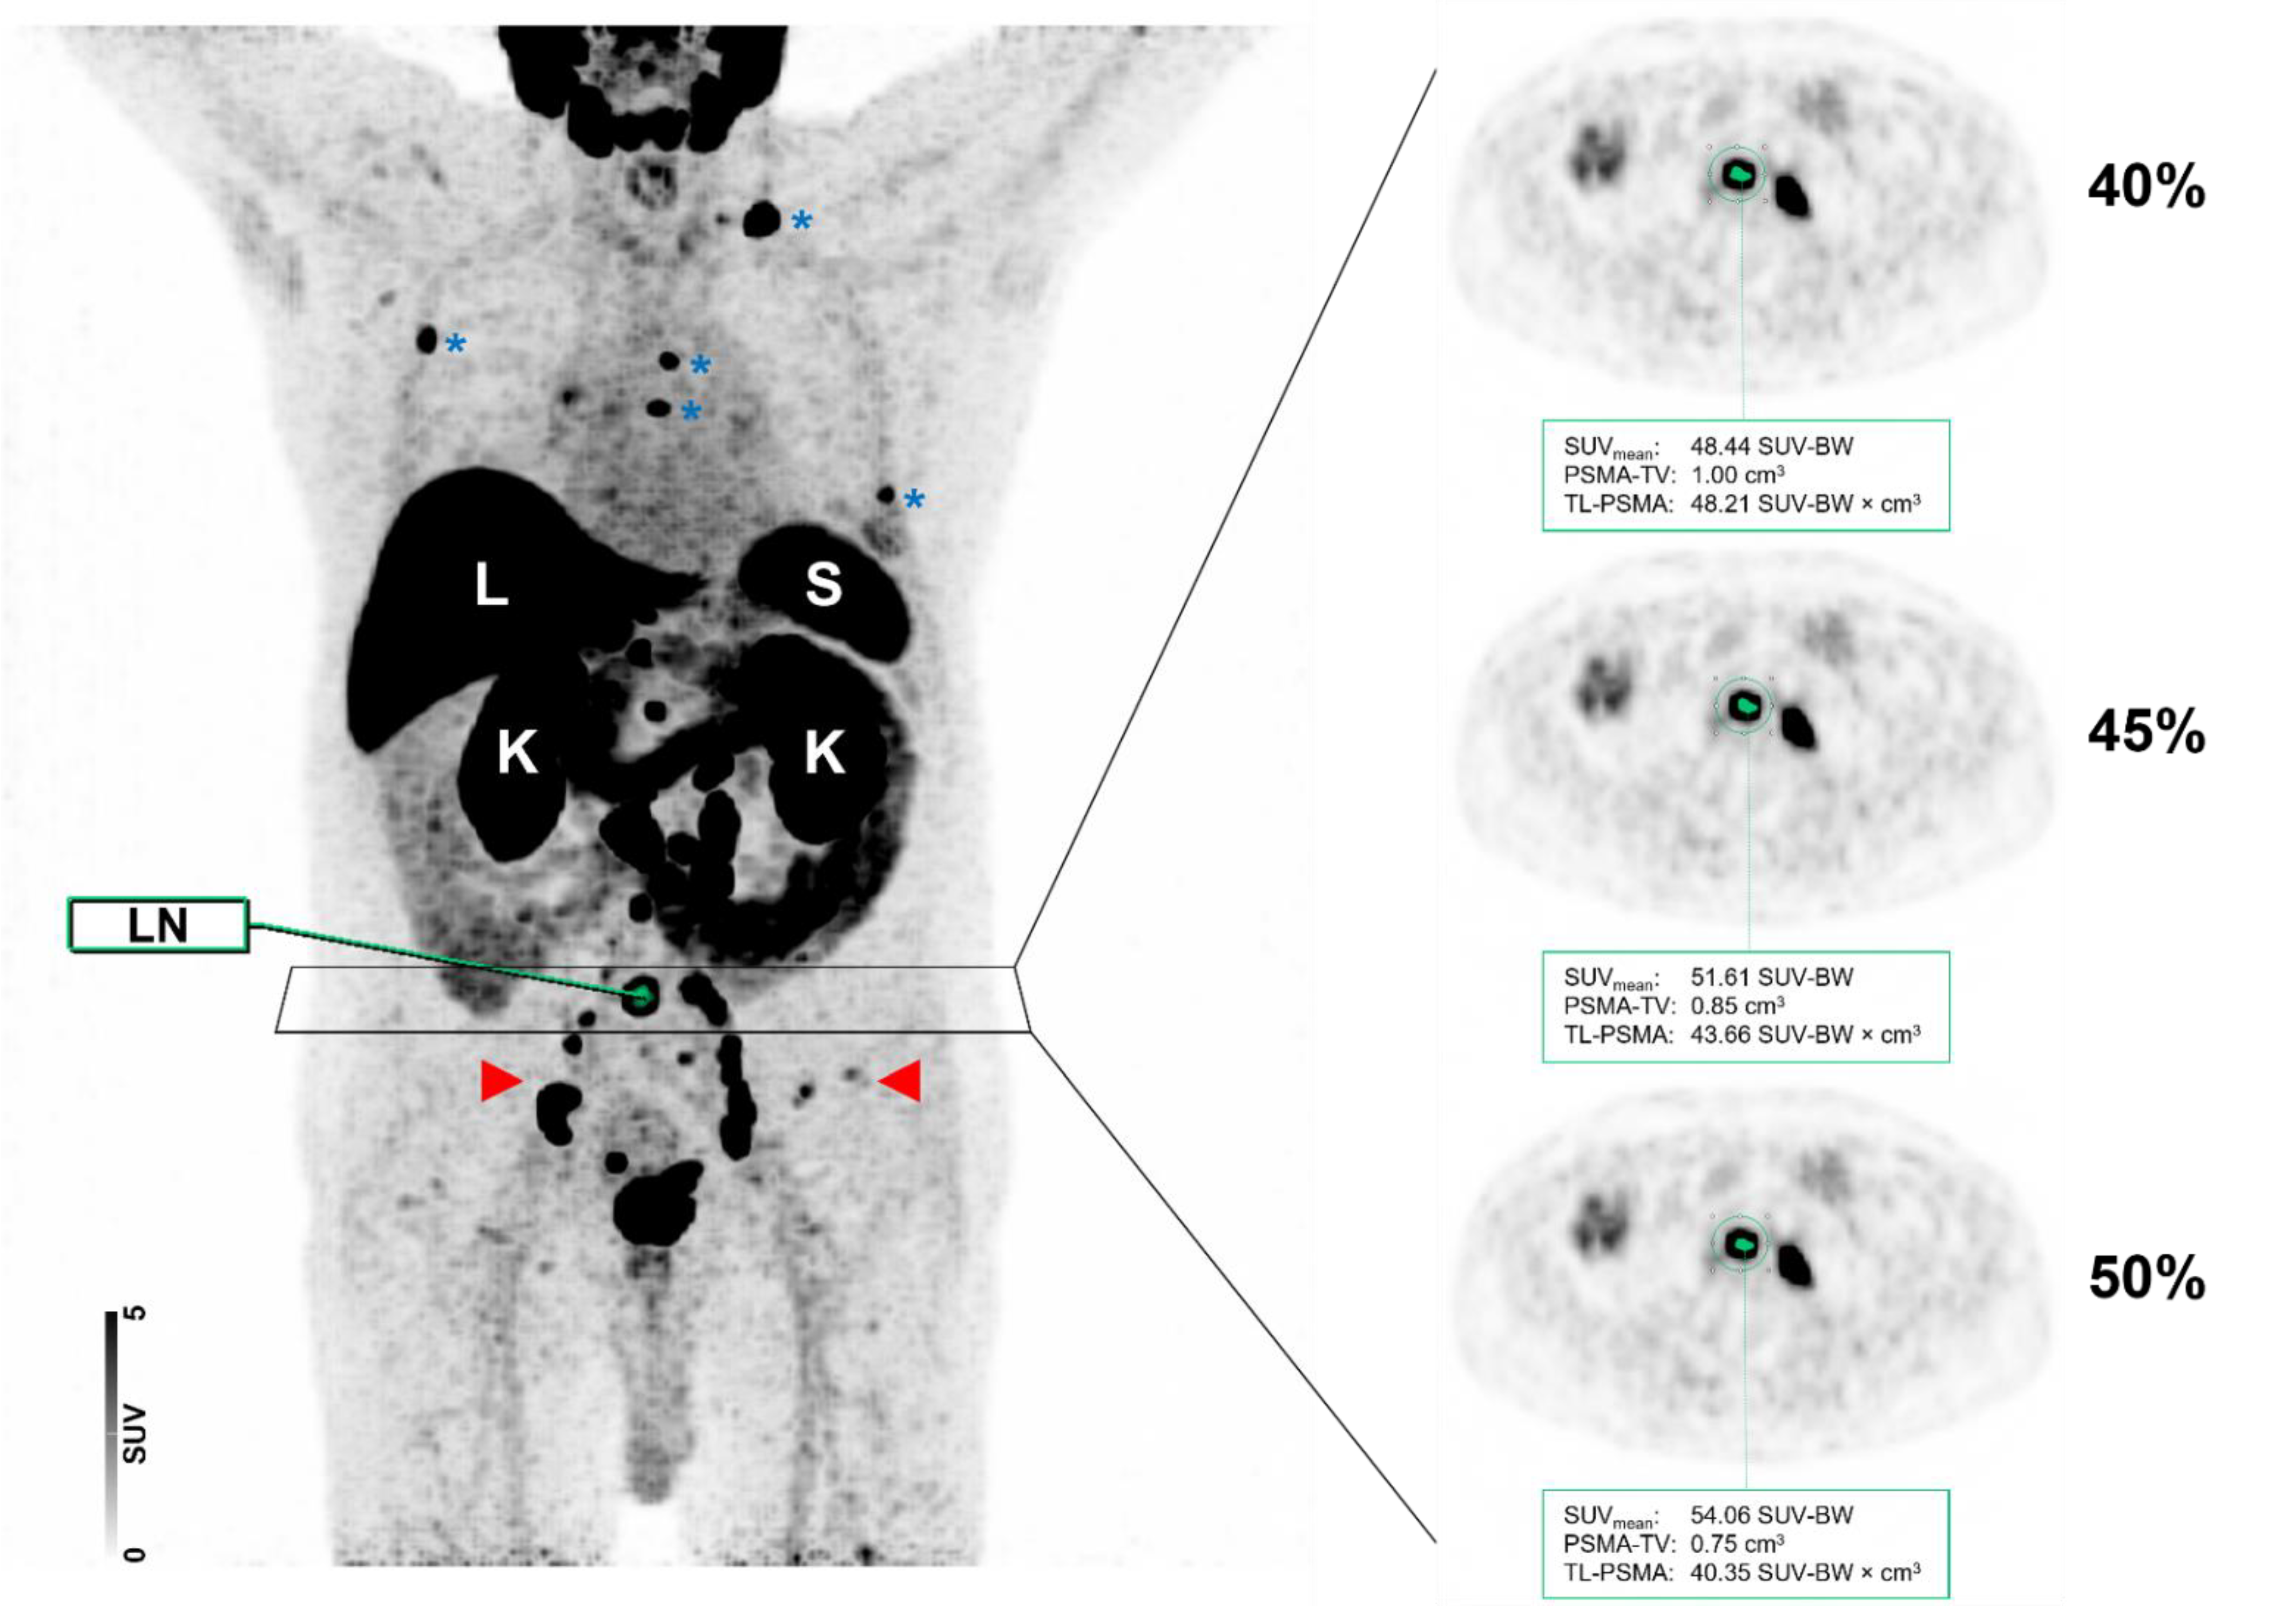
Figure 6 displays a case of lymph node and bone involvement with different MIT, demonstrating no significant differences in the segmentation of a lymph node metastasis attributable to PC.

Figure 6.
Maximum intensity projection (MIP) and axial positron emission tomography (PET) images of the same patient with different intensity thresholds (40 vs. 45 vs. 50%). Normal organ uptake in the liver (L), spleen (S), and kidneys (K) are indicated. The patient showed a relatively high tumor burden with multiple metastases involving both lymph nodes (red arrows) and the skeleton (blue asterisks). As shown for a PSMA-RADS-5 classified common iliac lymph node (LN), the segmentation did not differ visually when different maximum intensity thresholds of 40, 45, or 50% were applied.
4. Discussion
In the present study, we aimed to evaluate semiquantitative parameters based on the PSMA-RADS scoring scheme by using the 18F-labeled PSMA-targeted imaging agent 18F-PSMA-1007. First, investigating PSMA-RADS-5 lesions, we revealed a significant difference of SUVpeak relative to PSMA-RADS-1A, -1B, -2, -3A, -3B, -3D, and -4, but not for -3C lesions. Of note, SUVmax demonstrated significant difference among all PSMA-RADS categories when compared to PSMA-RADS-5, and as such, both SUV parameters may be used in the context of a RADS-based scoring scheme [10,11].
Recent years have provided an increasing body of evidence of multiple pitfalls in the context of PSMA-targeted scan interpretation [23]. Nonetheless, given its high accuracy for staging of patients with PC, the number of conducted PET/CTs is expected to further grow, emphasizing the need for harmonized interpretation criteria that will allow the reader to identify lesions that are most likely attributable to PC. In this regard, several groups have made proposals for a structured interpretation system of PSMA-ligand PET/CT, including PROMISE, E-PSMA, and PSMA-RADS [10,11,24,25]. The latter system has already been applied to 68Ga-PSMA-11 and other 18F-labeled compounds, such as DCFPyL [14,26]. A comprehensive evaluation of PSMA-RADS for 18F-PSMA-1007 PET/CT, however, is still lacking. As such, in this study investigating patients with newly diagnosed, histologically proven and treatment-naïve PC at time of scan, we observed a high prevalence of lesions with intense uptake (PSMA-RADS-4 and -5, 39.5%) as well as of lesions with equivocal uptake (PSMA-RADS-3A or -3B, 20.9%) [27]. Relative to 18F-DCFPyL, the number of equivocal findings seems to be higher for 18F-PSMA-1007, in particular for the skeleton, which may partially explain the increased number of indeterminate PSMA-RADS-3A and PSMA-RADS-3B lesions observed in the present study [16]. Similar to 18F-DCFPyL [27], lymph nodes accounted for 449 of the 623 investigated lesions (72.1%), with the largest portion being either categorized as PSMA-RADS-2 or PSMA-RADS-3A. For 18F-DCFPyL, longitudinal studies have already been conducted to determine the true nature of such lesions, and PSMA-RADS-3A lesions (defined as equivocal uptake in soft tissue lesions) are more likely than RADS-3B (equivocal uptake in the bone) to represent true disease involvement [12].
In this study, we could prove that all benign lesions according to the PSMA-RADS system (categories PSMA-RADS-1A, -1B and -2) and lesions without relevant uptake (category PSMA-RADS-3D) had lower SUVmax and SUVpeak when compared with PSMA-RADS-5. For suspicious lesions of nonprostatic origin with high uptake (category PSMA-RADS-3C) we were also able to show a significant difference of SUVmax compared to PSMA-RADS-5.
The clinical most challenging lesions, i.e., equivocal lesions in categories PSMA-RADS-3A and -3B, had lower SUVmax and SUVpeak when compared with PSMA-RADS-5. Therefore, we are convinced that an analysis of SUV based on PSMA-RADS may be helpful for stratifying the risk of PC involvement, in particular for lymph nodes and for the discrimination of equivocal PSMA-RADS-3B lesions in the bone. Lesions in category PSMA-RADS-3A, moreover, had a significantly lower SUVmax and SUVpeak compared to PSMA-RADS-4 lesions, while PSMA-RADS-3B lesions did not. This might be due to the small number of PSMA-RADS-4 lesions in the bone, and we believe that this may become significant in a larger cohort. SUVmax and SUVpeak of PSMA-RADS-4 bone lesions did not significantly differ from the entire PSMA-RADS-5 cohort, which proves the concept of the PSMA-RADS scoring scheme. Of note, findings of lesion distribution among different PSMA-RADS categories and SUVs are in line with a recent observation of Ashrafinia et al. using 18F-DCFPyL, supporting the notion that semi-quantification based on the PSMA-RADS scoring scheme can be applied to a broad spectrum of 18F-labeled PSMA agents [27].
In addition, the SUVs may also be helpful for the interpreting molecular imaging specialist by assigning the appropriate PSMA-RADS score to a suspicious lesion, thereby increasing diagnostic certainty. Identifying patients with low-volume disease, i.e., with less than four bone metastases, is of high therapeutic relevance because these patients benefit from multimodal therapy, as the CHAARTED (Chemohormonal Therapy Versus Androgen Ablation Randomized Trial for Extensive Disease in Prostate Cancer) trial has shown [28]. Furthermore, the results on SUV may be of importance in the context of response assessment. For instance, using the 18F-labeled radiotracer DCFPyL, Zukotynski et al. investigated men with castration-resistant PC prior to abiraterone or enzalutamide treatment. All patients were imaged prior to therapy and 2 to 4 months during follow-up. The authors used delta percent (DPSM) and delta absolute SUVmax (DASM), which represent the changes in radiotracer accumulation between both scans. Increased DPSM/DASM was linked with poorer overall survival [29]. Given significant differences of SUVmax in PSMA-RADS-5 lesions relative to other lesions along with the herein presented SUVmax values for this category, the reader may have certainty that relevant lesions for such response assessments will not be missed. Such considerations on SUVmax may also be relevant to identify treatment responders in patients scheduled for PSMA-directed radioligand therapy, as baseline SUVmax has been advocated to identify high-risk individuals [30,31,32]. Those studies, however, have been conducted using 68Ga-labeled radiotracers, whereas for 18F-PSMA-1007, such investigations are still needed, which may further refine the prognostic value of SUVmax for treatment failure [30,33].
SUVmean and volumetric parameters, i.e., PSMA-TV and TL-PSMA, can be influenced by different MITs, and as such, different thresholds (40 vs. 45 vs. 50%) have been applied to conduct a semi-quantitative analysis of the PSMA-avid tumor burden at baseline. The size of the VOI, however, was not changed for a given lesion. For all PSMA-RADS-5 classified lesions, SUVmean and TL-PSMA were not influenced by changing the MIT from 40 to 45 or 50%. For PSMA-TV, significance was reached when comparing 40 vs. 50% MIT, but not when incremental steps of 5% were used. The same phenomenon applied for lymph nodes, while PSMA-TV of bone lesions was not affected by changes of the MIT, suggesting lymph nodes are more prone to threshold alterations. Of note, level of significance regarding TL-PSMA was only reached for 10% changes of the intensity threshold in PSMA-RADS-4 lesions (overall lesion and lymph node level). For SUVmean and bone lesions in general, no significant differences were observed for varying the MIT between 40, 45 and 50% in PSMA-RADS-4/-5 lesions. Again, such findings may be of importance for response assessments. The recently proposed PSMA PET Progression Criteria suggested an increase in tracer uptake by ≥30% to be indicative for progressive disease. The authors did not recommend a certain semiquantitative parameter for this approach, but findings of the present study may indicate that a MIT of 40–50% might be suitable, regardless of whether volumetric parameters or SUVmean will be used for this purpose [34]. Taken together, in particular for lymph nodes a threshold of 45% may be considered as safe to provide reliable results.
This study has several limitations. Our retrospective cohort includes a small number of subjects and thus, our preliminary results warrant further confirmation in a prospective study. Second, histopathological confirmation of lesions would be desirable in the context of PSMA-RADS, but is not feasible. Given the high prevalence of PSMA-RADS-3A lesions in the present study, longitudinal studies in the context of 18F-PSMA-1007 would also be needed, as information on the true nature of those findings may guide therapy [13]. Third, the herein presented findings may primarily apply to patients referred for initial staging. As such, semiquantitative values, along with lesion distribution across different PSMA-RADS scores, may differ in other cohorts, e.g., in patients scheduled for PSMA-directed radioligand therapy [35]. Furthermore, even though the reconstruction algorithm was conducted as implemented by the manufacturer, the results on scanning parameters for lymph nodes are also susceptible to different scanning protocols, which makes inter-institutional comparisons difficult. Although our results seem to be comparable to other 18F-labeled radiotracers [27], further studies investigating existing and novel PSMA-directed compounds are needed, including 68Ga-PSMA-11.
5. Conclusions
Semiquantitative characterization of the structured reporting system PSMA-RADS in patients imaged with 18F-PSMA-1007 PET/CT revealed that SUVmax was significantly higher in PSMA-RADS-5 classified lesions compared to all other PSMA-RADS categories. As such, the latter parameter may assist the interpreting molecular imaging specialist to assign the correct PSMA-RADS score to sites of disease, thereby increasing diagnostic certainty. In addition, changes of the MIT in PSMA-RADS-5 lesions had no significant impact on SUVmean and TL-PSMA in contrast to PSMA-TV.
Author Contributions
Conceptualization, P.W.M., M.B., T.A.B., A.K.B., S.E.S., P.E.H. and R.A.W.; methodology, P.W.M., M.B., P.E.H. and R.A.W.; software, P.W.M.; validation, P.W.M., M.B., P.E.H. and R.A.W.; formal analysis, P.W.M. and R.A.W.; investigation, P.W.M., M.B., P.E.H. and R.A.W.; resources, T.A.B. and A.K.B.; data curation, P.W.M.; writing—original draft preparation, P.W.M.; writing—review and editing, P.W.M., M.B., M.G.P., T.A.B., A.K.S., H.K., A.K.B., S.P.R., S.E.S., P.E.H. and R.A.W.; visualization, P.W.M. and R.A.W.; supervision, M.B. and R.A.W.; project administration, P.W.M., M.B., P.E.H. and R.A.W.; funding acquisition, T.A.B., A.K.B. and P.E.H. All authors have read and agreed to the published version of the manuscript.
Funding
This publication was supported by the IZKF Würzburg (grant Z-02/85 to P.E.H.) and by the Open Access Publication Fund of the University of Würzburg.
Institutional Review Board Statement
The study was conducted according to the guidelines of the Declaration of Helsinki and approved by the Institutional Review Board of the University of Würzburg, Germany (IRB-Nr.: 20210204 03; date of approval: 23 March 2021).
Informed Consent Statement
Informed consent for diagnostic procedures was obtained. For research purposes, we acted in accordance with Bavarian Hospital Law [Art. 27 Abs. 4 Bayerisches Krankenhausgesetz (BayKrG)], which waives the need for additional informed consent in terms of retrospective studies.
Data Availability Statement
The data presented in this study are available in the article and in Appendix A.
Acknowledgments
The authors would like to thank A. Weich, Department of Internal Medicine II, Gastroenterology, University Hospital of Würzburg, Würzburg, Germany, for his support with statistical analysis and T. Higuchi, Department of Nuclear Medicine, University Hospital of Würzburg, Würzburg, Germany, for his input in the review and editing process.
Conflicts of Interest
The authors declare no conflict of interest.
Appendix A
Table A1.
Descriptive statistics of intensity of tracer uptake and volumetric 18F-PSMA PET/CT parameters of all lesions separated by PSMA-RADS category and compartment.
Table A1.
Descriptive statistics of intensity of tracer uptake and volumetric 18F-PSMA PET/CT parameters of all lesions separated by PSMA-RADS category and compartment.
| PSMA-RADS Category & Compartment | Parameter | Threshold | Mean ± SD | Range |
|---|---|---|---|---|
| 1A—Lung | SUVmax | 1.07 ± 0.50 | 0.54–1.72 | |
| SUVpeak | 0.83 ± 0.26 | 0.57–1.13 | ||
| SUVmean | 40% | 0.80 ± 0.29 | 0.49–1.18 | |
| 45% | 0.80 ± 0.29 | 0.49–1.19 | ||
| 50% | 0.83 ± 0.32 | 0.49–1.24 | ||
| PSMA-TV | 40% | 0.51 ± 0.46 | 0.15–1.34 | |
| 45% | 0.50 ± 0.44 | 0.15–1.29 | ||
| 50% | 0.45 ± 0.39 | 0.15–1.14 | ||
| TL-PSMA | 40% | 0.50 ± 0.61 | 0.08–1.58 | |
| 45% | 0.49 ± 0.59 | 0.08–1.54 | ||
| 50% | 0.45 ± 0.54 | 0.08–1.42 | ||
| 1B—Bone | SUVmax | 3.49 ± 1.08 | 2.73–4.26 | |
| SUVpeak | 2.47 ± 0.64 | 2.02–2.93 | ||
| SUVmean | 40% | 2.20 ± 0.77 | 1.66–2.75 | |
| 45% | 2.40 ± 0.82 | 1.82–2.98 | ||
| 50% | 2.49 ± 0.82 | 1.91–3.08 | ||
| PSMA-TV | 40% | 2.16 ± 0.53 | 1.79–2.54 | |
| 45% | 1.69 ± 0.35 | 1.44–1.94 | ||
| 50% | 1.46 ± 0.24 | 1.29–1.64 | ||
| TL-PSMA | 40% | 4.57 ± 0.50 | 4.22–4.93 | |
| 45% | 3.90 ± 0.54 | 3.52–4.29 | ||
| 50% | 3.56 ± 0.60 | 3.14–3.99 | ||
| 1B—Lymph Node | SUVmax | 1.46 ± 0.50 | 0.69–3.33 | |
| SUVpeak | 0.87 ± 0.27 | 0.54–1.93 | ||
| SUVmean | 40% | 1.02 ± 0.36 | 0.48–2.16 | |
| 45% | 1.05 ± 0.37 | 0.48–2.25 | ||
| 50% | 1.09 ± 0.39 | 0.48–2.47 | ||
| PSMA-TV | 40% | 0.67 ± 0.57 | 0.10–3.09 | |
| 45% | 0.61 ± 0.48 | 0.10–2.41 | ||
| 50% | 0.53 ± 0.39 | 0.10–2.07 | ||
| TL-PSMA | 40% | 0.64 ± 0.53 | 0.10–2.84 | |
| 45% | 0.60 ± 0.48 | 0.10–2.67 | ||
| 50% | 0.55 ± 0.43 | 0.10–2.36 | ||
| 1B—Liver | SUVmax | 11.05 ± 1.96 | 9.13–13.06 | |
| SUVpeak | 10.62 ± 1.70 | 8.73–12.05 | ||
| SUVmean | 40% | 10.42 ± 1.76 | 8.93–12.37 | |
| 45% | 10.42 ± 1.76 | 8.93–12.37 | ||
| 50% | 10.42 ± 1.76 | 8.93–12.37 | ||
| PSMA-TV | 40% | 0.20 ± 0.04 | 0.17–0.25 | |
| 45% | 0.20 ± 0.04 | 0.17–0.25 | ||
| 50% | 0.20 ± 0.04 | 0.17–0.25 | ||
| TL-PSMA | 40% | 2.14 ± 0.57 | 1.48–2.48 | |
| 45% | 2.14 ± 0.57 | 1.48–2.48 | ||
| 50% | 2.14 ± 0.57 | 1.48–2.48 | ||
| 1B—Lung | SUVmax | 1.40 ± 0.00 | 1.40–1.40 | |
| SUVpeak | 1.29 ± 0.00 | 1.29–1.29 | ||
| SUVmean | 40% | 1.25 ± 0.00 | 1.25–1.25 | |
| 45% | 1.25 ± 0.00 | 1.25–1.25 | ||
| 50% | 1.25 ± 0.00 | 1.25–1.25 | ||
| PSMA-TV | 40% | 0.33 ± 0.00 | 0.33–0.33 | |
| 45% | 0.33 ± 0.00 | 0.33–0.33 | ||
| 50% | 0.33 ± 0.00 | 0.33–0.33 | ||
| TL-PSMA | 40% | 0.42 ± 0.00 | 0.42–0.42 | |
| 45% | 0.42 ± 0.00 | 0.42–0.42 | ||
| 50% | 0.42 ± 0.00 | 0.42–0.42 | ||
| 1B—Soft Tissue | SUVmax | 9.14 ± 5.63 | 1.76–21.67 | |
| SUVpeak | 8.54 ± 4.80 | 1.05–15.86 | ||
| SUVmean | 40% | 6.30 ± 4.36 | 1.01–15.87 | |
| 45% | 6.63 ± 4.34 | 1.08–15.87 | ||
| 50% | 7.07 ± 4.62 | 1.16–17.04 | ||
| PSMA-TV | 40% | 2.26 ± 2.96 | 0.10–7.96 | |
| 45% | 1.73 ± 2.22 | 0.10–6.39 | ||
| 50% | 1.33 ± 1.66 | 0.10–4.81 | ||
| TL-PSMA | 40% | 6.11 ± 4.01 | 1.05–16.14 | |
| 45% | 5.14 ± 3.01 | 1.05–11.96 | ||
| 50% | 4.36 ± 2.31 | 0.76–9.09 | ||
| 2—Lymph Node | SUVmax | 3.13 ± 1.18 | 1.03–7.52 | |
| SUVpeak | 1.88 ± 0.70 | 0.54–3.83 | ||
| SUVmean | 40% | 2.09 ± 0.72 | 0.69–4.12 | |
| 45% | 2.17 ± 0.75 | 0.71–4.42 | ||
| 50% | 2.27 ± 0.81 | 0.74–5.03 | ||
| PSMA-TV | 40% | 0.89 ± 0.69 | 0.15–3.68 | |
| 45% | 0.78 ± 0.59 | 0.15–3.28 | ||
| 50% | 0.67 ± 0.49 | 0.08–2.44 | ||
| TL-PSMA | 40% | 1.90 ± 1.83 | 0.26–9.45 | |
| 45% | 1.74 ± 1.63 | 0.26–8.73 | ||
| 50% | 1.55 ± 1.41 | 0.21–7.05 | ||
| 3A—Lymph Node | SUVmax | 3.28 ± 0.97 | 1.40–8.58 | |
| SUVpeak | 1.90 ± 0.62 | 0.89–4.47 | ||
| SUVmean | 40% | 2.09 ± 0.60 | 0.97–5.03 | |
| 45% | 2.22 ± 0.64 | 1.04–5.41 | ||
| 50% | 2.33 ± 0.66 | 1.05–5.62 | ||
| PSMA-TV | 40% | 1.03 ± 0.72 | 0.17–4.73 | |
| 45% | 0.85 ± 0.61 | 0.15–4.13 | ||
| 50% | 0.72 ± 0.50 | 0.15–3.48 | ||
| TL-PSMA | 40% | 2.11 ± 1.53 | 0.35–10.79 | |
| 45% | 1.85 ± 1.36 | 0.31–9.81 | ||
| 50% | 1.63 ± 1.18 | 0.31–8.65 | ||
| 3B—Bone | SUVmax | 4.78 ± 0.78 | 3.11–5.88 | |
| SUVpeak | 2.37 ± 0.31 | 1.86–3.29 | ||
| SUVmean | 40% | 2.85 ± 0.51 | 1.73–3.67 | |
| 45% | 3.08 ± 0.53 | 2.06–4.00 | ||
| 50% | 3.29 ± 0.55 | 2.20–4.20 | ||
| PSMA-TV | 40% | 1.38 ± 1.13 | 0.41–5.62 | |
| 45% | 1.03 ± 0.73 | 0.33–3.73 | ||
| 50% | 0.80 ± 0.57 | 0.25–3.04 | ||
| TL-PSMA | 40% | 3.61 ± 2.42 | 1.41–12.94 | |
| 45% | 2.97 ± 1.77 | 1.05–9.54 | ||
| 50% | 2.48 ± 1.50 | 0.86–8.13 | ||
| 3C—Lymph Node | SUVmax | 5.09 ± 0.82 | 4.37–6.63 | |
| SUVpeak | 3.66 ± 1.89 | 1.76–6.39 | ||
| SUVmean | 40% | 3.11 ± 0.52 | 2.69–3.95 | |
| 45% | 3.36 ± 0.52 | 2.94–4.31 | ||
| 50% | 3.59 ± 0.64 | 3.05–4.75 | ||
| PSMA-TV | 40% | 1.46 ± 0.80 | 0.35–2.59 | |
| 45% | 1.18 ± 0.70 | 0.25–2.19 | ||
| 50% | 0.95 ± 0.56 | 0.25–1.69 | ||
| TL-PSMA | 40% | 4.61 ± 2.64 | 0.97–7.46 | |
| 45% | 4.01 ± 2.37 | 0.79–6.45 | ||
| 50% | 3.42 ± 1.99 | 0.79–5.30 | ||
| 3C—Lung | SUVmax | 5.15 ± 0.00 | 5.15–5.15 | |
| SUVpeak | 2.79 ± 0.00 | 2.79–2.79 | ||
| SUVmean | 40% | 3.27 ± 0.00 | 3.27–3.27 | |
| 45% | 3.44 ± 0.00 | 3.44–3.44 | ||
| 50% | 3.51 ± 0.00 | 3.51–3.51 | ||
| PSMA-TV | 40% | 0.75 ± 0.00 | 0.75–0.75 | |
| 45% | 0.65 ± 0.00 | 0.65–0.65 | ||
| 50% | 0.60 ± 0.00 | 0.60–0.60 | ||
| TL-PSMA | 40% | 2.44 ± 0.00 | 2.44–2.44 | |
| 45% | 2.22 ± 0.00 | 2.22–2.22 | ||
| 50% | 2.10 ± 0.00 | 2.10–2.10 | ||
| 3C—Soft Tissue | SUVmax | 5.78 ± 1.05 | 4.65–7.19 | |
| SUVpeak | 4.02 ± 1.54 | 2.75–6.25 | ||
| SUVmean | 40% | 3.62 ± 1.37 | 2.65–5.66 | |
| 45% | 3.87 ± 1.46 | 2.84–6.04 | ||
| 50% | 4.07 ± 1.32 | 3.18–6.04 | ||
| PSMA-TV | 40% | 4.73 ± 4.10 | 0.40–9.21 | |
| 45% | 3.60 ± 3.03 | 0.35–6.62 | ||
| 50% | 2.61 ± 2.18 | 0.35–4.53 | ||
| TL-PSMA | 40% | 14.54 ± 12.28 | 2.25–27.06 | |
| 45% | 11.92 ± 9.77 | 2.11–20.96 | ||
| 50% | 9.33 ± 7.49 | 2.11–16.12 | ||
| 3D—Lymph Node | SUVmax | 2.48 ± 0.86 | 1.54–3.24 | |
| SUVpeak | 2.04 ± 0.47 | 1.65–2.57 | ||
| SUVmean | 40% | 1.56 ± 0.39 | 1.11–1.81 | |
| 45% | 1.61 ± 0.45 | 1.11–1.97 | ||
| 50% | 1.70 ± 0.53 | 1.11–2.14 | ||
| PSMA-TV | 40% | 1.69 ± 1.55 | 0.66–3.48 | |
| 45% | 1.38 ± 1.01 | 0.66–2.54 | ||
| 50% | 1.12 ± 0.64 | 0.58–1.84 | ||
| TL-PSMA | 40% | 2.84 ± 3.00 | 1.05–6.31 | |
| 45% | 2.41 ± 2.25 | 1.05–5.01 | ||
| 50% | 2.02 ± 1.66 | 1.05–3.94 | ||
| 3D—Lung | SUVmax | 0.89 ± 0.55 | 0.42–2.54 | |
| SUVpeak | 0.79 ± 0.38 | 0.38–1.63 | ||
| SUVmean | 40% | 0.74 ± 0.39 | 0.39–1.76 | |
| 45% | 0.76 ± 0.44 | 0.39–2.11 | ||
| 50% | 0.76 ± 0.44 | 0.39–2.11 | ||
| PSMA-TV | 40% | 0.26 ± 0.14 | 0.08–0.60 | |
| 45% | 0.26 ± 0.14 | 0.08–0.60 | ||
| 50% | 0.25 ± 0.13 | 0.08–0.55 | ||
| TL-PSMA | 40% | 0.20 ± 0.16 | 0.04–0.68 | |
| 45% | 0.20 ± 0.16 | 0.04–0.68 | ||
| 50% | 0.20 ± 0.16 | 0.04–0.64 | ||
| 3D—Soft Tissue | SUVmax | 1.79 ± 0.00 | 1.79–1.79 | |
| SUVpeak | 1.04 ± 0.00 | 1.04–1.04 | ||
| SUVmean | 40% | 1.15 ± 0.00 | 1.15–1.15 | |
| 45% | 1.23 ± 0.00 | 1.23–1.23 | ||
| 50% | 1.32 ± 0.00 | 1.32–1.32 | ||
| PSMA-TV | 40% | 0.60 ± 0.00 | 0.60–0.60 | |
| 45% | 0.50 ± 0.00 | 0.50–0.50 | ||
| 50% | 0.40 ± 0.00 | 0.40–0.40 | ||
| TL-PSMA | 40% | 0.69 ± 0.00 | 0.69–0.69 | |
| 45% | 0.61 ± 0.00 | 0.61–0.61 | ||
| 50% | 0.53 ± 0.00 | 0.53–0.53 | ||
| 4—Bone | SUVmax | 8.55 ± 3.76 | 4.49–14.98 | |
| SUVpeak | 3.44 ± 1.02 | 2.47–5.27 | ||
| SUVmean | 40% | 5.35 ± 2.67 | 2.83–10.02 | |
| 45% | 5.82 ± 2.90 | 3.06–10.99 | ||
| 50% | 6.22 ± 2.94 | 3.11–10.99 | ||
| PSMA-TV | 40% | 0.81 ± 0.49 | 0.41–1.74 | |
| 45% | 0.63 ± 0.40 | 0.33–1.41 | ||
| 50% | 0.52 ± 0.40 | 0.30–1.33 | ||
| TL-PSMA | 40% | 3.59 ± 0.91 | 2.36–4.93 | |
| 45% | 3.05 ± 0.91 | 1.91–4.31 | ||
| 50% | 2.66 ± 1.02 | 1.74–4.13 | ||
| 4—Lymph Node | SUVmax | 15.64 ± 15.98 | 3.13–74.57 | |
| SUVpeak | 6.08 ± 5.72 | 1.43–33.17 | ||
| SUVmean | 40% | 10.24 ± 10.83 | 2.04–49.97 | |
| 45% | 11.09 ± 11.81 | 2.40–57.06 | ||
| 50% | 11.77 ± 12.60 | 2.72–57.33 | ||
| PSMA-TV | 40% | 0.64 ± 0.42 | 0.10–2.29 | |
| 45% | 0.53 ± 0.35 | 0.05–2.14 | ||
| 50% | 0.42 ± 0.27 | 0.05–1.84 | ||
| TL-PSMA | 40% | 4.89 ± 4.06 | 0.81–23.55 | |
| 45% | 4.30 ± 3.69 | 0.62–22.35 | ||
| 50% | 3.73 ± 3.19 | 0.59–19.59 | ||
| 5—Bone | SUVmax | 30.27 ± 25.79 | 4.28–157.80 | |
| SUVpeak | 15.26 ± 12.58 | 1.67–77.70 | ||
| SUVmean | 40% | 18.84 ± 16.47 | 2.63–101.10 | |
| 45% | 20.25 ± 17.55 | 2.73–112.90 | ||
| 50% | 21.70 ± 19.52 | 2.84–113.10 | ||
| PSMA-TV | 40% | 3.55 ± 4.52 | 0.10–20.60 | |
| 45% | 2.83 ± 3.55 | 0.10–16.12 | ||
| 50% | 2.28 ± 2.79 | 0.05–11.59 | ||
| TL-PSMA | 40% | 69.29 ± 106.80 | 1.18–662.10 | |
| 45% | 59.66 ± 93.39 | 1.09–598.00 | ||
| 50% | 50.35 ± 76.10 | 0.99–463.60 | ||
| 5—Lymph Node | SUVmax | 34.12 ± 28.88 | 4.63–120.30 | |
| SUVpeak | 18.05 ± 14.82 | 2.81–58.54 | ||
| SUVmean | 40% | 21.00 ± 18.13 | 2.57–73.98 | |
| 45% | 22.35 ± 19.15 | 2.73–76.67 | ||
| 50% | 23.73 ± 20.05 | 3.28–79.29 | ||
| PSMA-TV | 40% | 4.13 ± 11.00 | 0.40–66.09 | |
| 45% | 3.11 ± 7.62 | 0.33–46.88 | ||
| 50% | 2.26 ± 4.99 | 0.10–31.15 | ||
| TL-PSMA | 40% | 65.12 ± 127.00 | 2.72–695.90 | |
| 45% | 53.78 ± 96.57 | 2.57–529.60 | ||
| 50% | 43.32 ± 70.85 | 1.13–377.30 | ||
| 5—Soft Tissue | SUVmax | 32.32 ± 8.81 | 23.32–40.93 | |
| SUVpeak | 15.12 ± 10.32 | 8.15–26.98 | ||
| SUVmean | 40% | 20.15 ± 3.57 | 16.65–23.79 | |
| 45% | 21.27 ± 4.13 | 16.65–24.63 | ||
| 50% | 20.20 ± 16.31 | 5.95–37.99 | ||
| PSMA-TV | 40% | 0.95 ± 1.06 | 0.33–2.19 | |
| 45% | 0.84 ± 0.95 | 0.25–1.94 | ||
| 50% | 1.50 ± 1.20 | 0.33–2.74 | ||
| TL-PSMA | 40% | 21.52 ± 26.47 | 5.52–52.08 | |
| 45% | 19.64 ± 24.38 | 5.52–47.79 | ||
| 50% | 25.54 ± 25.92 | 5.52–54.82 | ||
| 5—Primary | SUVmax | 32.66 ± 21.91 | 5.15–82.80 | |
| SUVpeak | 18.85 ± 12.52 | 3.58–50.20 | ||
| SUVmean | 40% | 18.13 ± 13.27 | 2.89–49.96 | |
| 45% | 20.01 ± 14.69 | 3.10–53.51 | ||
| 50% | 21.37 ± 15.21 | 3.33–56.03 | ||
| PSMA-TV | 40% | 9.16 ± 8.38 | 0.25–28.96 | |
| 45% | 6.36 ± 6.09 | 0.17–20.70 | ||
| 50% | 4.32 ± 4.20 | 0.17–14.68 | ||
| TL-PSMA | 40% | 145.90 ± 192.80 | 10.59–806.90 | |
| 45% | 111.50 ± 154.00 | 8.22–652.00 | ||
| 50% | 82.76 ± 112.60 | 5.36–472.30 |
SD = standard deviation, SUVmax = maximum standardized uptake value corrected to body weight, SUVpeak = peak standardized uptake value corrected to body weight, SUVmean = mean standardized uptake value corrected to body weight, PSMA-TV = PSMA-derived tumor volume (cm3), TL-PSMA = total lesion PSMA (cm3).
Table A2.
Descriptive statistics of number of lesions per PSMA-RADS category and total lesions for each of the 18 patients.
Table A2.
Descriptive statistics of number of lesions per PSMA-RADS category and total lesions for each of the 18 patients.
| PSMA-RADS Category | Pat. #1 | Pat. #2 | Pat. #3 | Pat. #4 | Pat. #5 | Pat. #6 | Pat. #7 | Pat. #8 | Pat. #9 |
|---|---|---|---|---|---|---|---|---|---|
| 1A | 0 | 1 | 0 | 0 | 1 | 0 | 1 | 0 | 0 |
| 1B | 3 | 0 | 1 | 3 | 7 | 3 | 4 | 1 | 0 |
| 2 | 4 | 8 | 3 | 10 | 9 | 7 | 22 | 1 | 13 |
| 3A | 0 | 13 | 1 | 7 | 14 | 14 | 6 | 3 | 1 |
| 3B | 0 | 9 | 0 | 2 | 1 | 2 | 0 | 0 | 1 |
| 3C | 0 | 3 | 0 | 0 | 0 | 0 | 0 | 0 | 0 |
| 3D | 0 | 0 | 0 | 0 | 0 | 1 | 0 | 1 | 5 |
| 4 | 10 | 12 | 2 | 1 | 4 | 3 | 3 | 1 | 0 |
| 5 | 25 | 9 | 1 | 1 | 1 | 8 | 5 | 1 | 2 |
| Total | 42 | 55 | 8 | 24 | 37 | 38 | 41 | 8 | 22 |
| PSMA-RADS Category | Pat. #10 | Pat. #11 | Pat. #12 | Pat. #13 | Pat. #14 | Pat. #15 | Pat. #16 | Pat. #17 | Pat. #18 |
| 1A | 1 | 0 | 0 | 0 | 0 | 0 | 0 | 0 | 1 |
| 1B | 6 | 12 | 11 | 22 | 2 | 6 | 1 | 2 | 1 |
| 2 | 13 | 6 | 7 | 6 | 2 | 6 | 0 | 1 | 3 |
| 3A | 7 | 9 | 1 | 7 | 1 | 2 | 0 | 3 | 16 |
| 3B | 3 | 0 | 0 | 0 | 3 | 2 | 0 | 0 | 2 |
| 3C | 0 | 2 | 0 | 0 | 0 | 0 | 0 | 0 | 6 |
| 3D | 1 | 1 | 0 | 1 | 9 | 0 | 1 | 1 | 4 |
| 4 | 9 | 4 | 3 | 19 | 3 | 14 | 0 | 3 | 7 |
| 5 | 2 | 15 | 15 | 15 | 23 | 21 | 2 | 1 | 1 |
| Total | 42 | 49 | 37 | 70 | 43 | 51 | 4 | 11 | 41 |
Pat. = patient.
References
- Sung, H.; Ferlay, J.; Siegel, R.L.; Laversanne, M.; Soerjomataram, I.; Jemal, A.; Bray, F. Global Cancer Statistics 2020: GLOBOCAN Estimates of Incidence and Mortality Worldwide for 36 Cancers in 185 Countries. CA Cancer J. Clin. 2021, 71, 209–249. [Google Scholar] [CrossRef] [PubMed]
- Sweat, S.D.; Pacelli, A.; Murphy, G.P.; Bostwick, D.G. Prostate-specific membrane antigen expression is greatest in prostate adenocarcinoma and lymph node metastases. Urology 1998, 52, 637–640. [Google Scholar] [CrossRef]
- Mannweiler, S.; Amersdorfer, P.; Trajanoski, S.; Terrett, J.A.; King, D.; Mehes, G. Heterogeneity of Prostate-Specific Membrane Antigen (PSMA) Expression in Prostate Carcinoma with Distant Metastasis. Pathol. Oncol. Res. 2009, 15, 167–172. [Google Scholar] [CrossRef] [PubMed]
- Rowe, S.P.; Macura, K.J.; Mena, E.; Blackford, A.L.; Nadal, R.; Antonarakis, E.S.; Eisenberger, M.; Carducci, M.; Fan, H.; Dannals, R.F.; et al. PSMA-Based [18F]DCFPyL PET/CT Is Superior to Conventional Imaging for Lesion Detection in Patients with Metastatic Prostate Cancer. Mol. Imaging Biol. 2016, 18, 411–419. [Google Scholar] [CrossRef] [Green Version]
- Rauscher, I.; Kroenke, M.; König, M.; Gafita, A.; Maurer, T.; Horn, T.; Schiller, K.; Weber, W.; Eiber, M. Matched-Pair Comparison of 68Ga-PSMA-11 PET/CT and 18F-PSMA-1007 PET/CT: Frequency of Pitfalls and Detection Efficacy in Biochemical Recurrence After Radical Prostatectomy. J. Nucl. Med. 2020, 61, 51–57. [Google Scholar] [CrossRef]
- Giesel, F.L.; Knorr, K.; Spohn, F.; Will, L.; Maurer, T.; Flechsig, P.; Neels, O.; Schiller, K.; Amaral, H.; Weber, W.A.; et al. Detection Efficacy of 18F-PSMA-1007 PET/CT in 251 Patients with Biochemical Recurrence of Prostate Cancer After Radical Prostatectomy. J. Nucl. Med. 2019, 60, 362–368. [Google Scholar] [CrossRef] [Green Version]
- Sprute, K.; Kramer, V.; Koerber, S.A.; Meneses, M.; Fernandez, R.; Soza-Ried, C.; Eiber, M.; Weber, W.A.; Rauscher, I.; Rahbar, K.; et al. Diagnostic Accuracy of 18F-PSMA-1007 PET/CT Imaging for Lymph Node Staging of Prostate Carcinoma in Primary and Biochemical Recurrence. J. Nucl. Med. 2021, 62, 208–213. [Google Scholar] [CrossRef]
- Werner, R.A.; Derlin, T.; Lapa, C.; Sheikbahaei, S.; Higuchi, T.; Giesel, F.L.; Behr, S.; Drzezga, A.; Kimura, H.; Buck, A.K.; et al. 18F-Labeled, PSMA-Targeted Radiotracers: Leveraging the Advantages of Radiofluorination for Prostate Cancer Molecular Imaging. Theranostics 2020, 10, 1–16. [Google Scholar] [CrossRef]
- Szabo, Z.; Mena, E.; Rowe, S.P.; Plyku, D.; Nidal, R.; Eisenberger, M.A.; Antonarakis, E.S.; Fan, H.; Dannals, R.F.; Chen, Y.; et al. Initial Evaluation of [18F]DCFPyL for Prostate-Specific Membrane Antigen (PSMA)-Targeted PET Imaging of Prostate Cancer. Mol. Imaging Biol. 2015, 17, 565–574. [Google Scholar] [CrossRef]
- Rowe, S.P.; Pienta, K.J.; Pomper, M.G.; Gorin, M.A. Proposal for a Structured Reporting System for Prostate-Specific Membrane Antigen-Targeted PET Imaging: PSMA-RADS Version 1.0. J. Nucl. Med. 2017, 59, 479–485. [Google Scholar] [CrossRef] [Green Version]
- Rowe, S.P.; Pienta, K.J.; Pomper, M.G.; Gorin, M.A. PSMA-RADS Version 1.0: A Step Towards Standardizing the Interpretation and Reporting of PSMA–targeted PET Imaging Studies. Eur. Urol. 2018, 73, 485–487. [Google Scholar] [CrossRef]
- Yin, Y.; Werner, R.A.; Higuchi, T.; Lapa, C.; Pienta, K.J.; Pomper, M.G.; Gorin, M.A.; Rowe, S.P. Follow-up of Lesions with Equivocal Radiotracer Uptake on PSMA-Targeted PET in Patients with Prostate Cancer: Predictive Values of the PSMA-RADS-3A and PSMA-RADS-3B Categories. J. Nucl. Med. 2018, 60, 511–516. [Google Scholar] [CrossRef]
- Reyes, D.K.; Demehri, S.; Werner, R.A.; Pomper, M.G.; Gorin, M.A.; Rowe, S.P.; Pienta, K.J. PSMA-targeted [18F]DCFPyL PET/CT-avid lesions in a patient with prostate cancer: Clinical decision-making informed by the PSMA-RADS interpretive framework. Urol. Case Rep. 2019, 23, 72–74. [Google Scholar] [CrossRef]
- Werner, R.A.; Bundschuh, R.A.; Bundschuh, L.; Javadi, M.S.; Leal, J.P.; Higuchi, T.; Pienta, K.J.; Buck, A.K.; Pomper, M.G.; Gorin, M.A.; et al. Interobserver Agreement for the Standardized Reporting System PSMA-RADS 1.0 on 18F-DCFPyL PET/CT Imaging. J. Nucl. Med. 2018, 59, 1857–1864. [Google Scholar] [CrossRef] [Green Version]
- Giesel, F.L.; Will, L.; Lawal, I.; Lengana, T.; Kratochwil, C.; Vorster, M.; Neels, O.; Reyneke, F.; Haberkon, U.; Kopka, K.; et al. Intraindividual Comparison of 18F-PSMA-1007 and 18F-DCFPyL PET/CT in the Prospective Evaluation of Patients with Newly Diagnosed Prostate Carcinoma: A Pilot Study. J. Nucl. Med. 2018, 59, 1076–1080. [Google Scholar] [CrossRef] [Green Version]
- Wondergem, M.; van der Zant, F.M.; Broos, W.A.; Knol, R.J. Matched-Pair Comparison of 18F-DCFPyL PET/CT and 18F-PSMA-1007 PET/CT in 240 Prostate Cancer Patients: Interreader Agreement and Lesion Detection Rate of Suspected Lesions. J. Nucl. Med. 2021, 62, 1422–1429. [Google Scholar] [CrossRef]
- Cardinale, J.; Martin, S.; Remde, Y.; Schäfer, M.; Hienzsch, A.; Hübner, S.; Zerges, A.-M.; Marx, H.; Hesse, R.; Weber, K.; et al. Procedures for the GMP-Compliant Production and Quality Control of [18F]PSMA-1007: A Next Generation Radiofluorinated Tracer for the Detection of Prostate Cancer. Pharmaceuticals 2017, 10, 77. [Google Scholar] [CrossRef] [Green Version]
- Cytawa, W.; Seitz, A.K.; Kircher, S.; Fukushima, K.; Tran-Gia, J.; Schirbel, A.; Bandurski, T.; Lass, P.; Krebs, M.; Połom, W.; et al. 68Ga-PSMA I&T PET/CT for primary staging of prostate cancer. Eur. J. Nucl. Med. Mol. Imaging 2020, 47, 168–177. [Google Scholar] [CrossRef]
- Michalski, K.; Ruf, J.; Goetz, C.; Seitz, A.K.; Buck, A.K.; Lapa, C.; Hartrampf, P.E. Prognostic implications of dual tracer PET/CT: PSMA ligand and [18F]FDG PET/CT in patients undergoing [177Lu]PSMA radioligand therapy. Eur. J. Nucl. Med. Mol. Imaging 2021, 48, 2024–2030. [Google Scholar] [CrossRef]
- Schmuck, S.; von Klot, C.A.; Henkenberens, C.; Sohns, J.M.; Christiansen, H.; Wester, H.-J.; Ross, T.L.; Bengel, F.M.; Derlin, T. Initial Experience with Volumetric 68Ga-PSMA I&T PET/CT for Assessment of Whole-Body Tumor Burden as a Quantitative Imaging Biomarker in Patients with Prostate Cancer. J. Nucl. Med. 2017, 58, 1962–1968. [Google Scholar] [CrossRef] [Green Version]
- Rauscher, I.; Maurer, T.; Beer, A.J.; Graner, F.-P.; Haller, B.; Weirich, G.; Doherty, A.; Gschwend, J.E.; Schwaiger, M.; Eiber, M. Value of 68Ga-PSMA HBED-CC PET for the Assessment of Lymph Node Metastases in Prostate Cancer Patients with Biochemical Recurrence: Comparison with Histopathology After Salvage Lymphadenectomy. J. Nucl. Med. 2016, 57, 1713–1719. [Google Scholar] [CrossRef] [PubMed] [Green Version]
- Bai, B.; Bading, J.; Conti, P.S. Tumor Quantification in Clinical Positron Emission Tomography. Theranostics 2013, 3, 787–801. [Google Scholar] [CrossRef] [PubMed] [Green Version]
- Sheikhbahaei, S.; Werner, R.A.; Solnes, L.B.; Pienta, K.J.; Pomper, M.G.; Gorin, M.A.; Rowe, S.P. Prostate-Specific Membrane Antigen (PSMA)-Targeted PET Imaging of Prostate Cancer: An Update on Important Pitfalls. Semin. Nucl. Med. 2019, 49, 255–270. [Google Scholar] [CrossRef]
- Eiber, M.; Herrmann, K.; Calais, J.; Hadaschik, B.; Giesel, F.L.; Hartenbach, M.; Hope, T.A.; Reiter, R.; Maurer, T.; Weber, W.A.; et al. Prostate Cancer Molecular Imaging Standardized Evaluation (PROMISE): Proposed miTNM Classification for the Interpretation of PSMA-Ligand PET/CT. J. Nucl. Med. 2018, 59, 469–478. [Google Scholar] [CrossRef] [PubMed] [Green Version]
- Ceci, F.; Oprea-Lager, D.E.; Emmett, L.; Adam, J.A.; Bomanji, J.; Czernin, J.; Eiber, M.; Haberkorn, U.; Hofman, M.S.; Hope, T.A.; et al. E-PSMA: The EANM standardized reporting guidelines v1.0 for PSMA-PET. Eur. J. Nucl. Med. Mol. Imaging 2021, 48, 1626–1638. [Google Scholar] [CrossRef]
- Derwael, C.; Lavergne, O.; Lovinfosse, P.; Nechifor, V.; Salvé, M.; Waltregny, D.; Hustinx, R.; Withofs, N. Interobserver agreement of [68Ga]Ga-PSMA-11 PET/CT images interpretation in men with newly diagnosed prostate cancer. EJNMMI Res. 2020, 10, 1–10. [Google Scholar] [CrossRef] [PubMed]
- Ashrafinia, S.; Salehi Sadaghiani, M.; Dalaie, P.; Tulbah, R.; Yin, Y.; Leung, K.; VanDenBerg, R.; Leal, J.; Gorin, M.; Pomper, M.; et al. Characterization of Segmented 18F-DCFPyL PET/CT Lesions in the Context of PSMA-RADS Structured Reporting. J. Nucl. Med. 2019, 60, 1565. [Google Scholar]
- Kyriakopoulos, C.E.; Chen, Y.-H.; Carducci, M.A.; Liu, G.; Jarrard, D.F.; Hahn, N.M.; Shevrin, D.H.; Dreicer, R.; Hussain, M.; Eisenberger, M.; et al. Chemohormonal Therapy in Metastatic Hormone-Sensitive Prostate Cancer: Long-Term Survival Analysis of the Randomized Phase III E3805 CHAARTED Trial. J. Clin. Oncol. 2018, 36, 1080–1087. [Google Scholar] [CrossRef] [Green Version]
- Zukotynski, K.A.; Emmenegger, U.; Hotte, S.; Kapoor, A.; Fu, W.; Blackford, A.L.; Valliant, J.; Bénard, F.; Kim, C.K.; Markowski, M.C.; et al. Prospective, Single-Arm Trial Evaluating Changes in Uptake Patterns on Prostate-Specific Membrane Antigen–Targeted 18F-DCFPyL PET/CT in Patients with Castration-Resistant Prostate Cancer Starting Abiraterone or Enzalutamide. J. Nucl. Med. 2021, 62, 1430–1437. [Google Scholar] [CrossRef]
- Widjaja, L.; Werner, R.; Ross, T.; Bengel, F.; Derlin, T. PSMA Expression Predicts Early Biochemical Response in Patients with Metastatic Castration-Resistant Prostate Cancer under 177Lu-PSMA-617 Radioligand Therapy. Cancers 2021, 13, 2938. [Google Scholar] [CrossRef]
- Seifert, R.; Seitzer, K.; Herrmann, K.; Kessel, K.; Schäfers, M.; Kleesiek, J.; Weckesser, M.; Boegemann, M.; Rahbar, K. Analysis of PSMA expression and outcome in patients with advanced Prostate Cancer receiving 177Lu-PSMA-617 Radioligand Therapy. Theranostics 2020, 10, 7812–7820. [Google Scholar] [CrossRef]
- Seifert, R.; Kessel, K.; Schlack, K.; Weckesser, M.; Kersting, D.; Seitzer, K.E.; Weber, M.; Bögemann, M.; Rahbar, K. Total tumor volume reduction and low PSMA expression in patients receiving Lu-PSMA therapy. Theranostics 2021, 11, 8143–8151. [Google Scholar] [CrossRef]
- Sadaghiani, M.S.; Sheikhbahaei, S.; Werner, R.A.; Pienta, K.J.; Pomper, M.G.; Solnes, L.B.; Gorin, M.A.; Wang, N.-Y.; Rowe, S.P. A Systematic Review and Meta-analysis of the Effectiveness and Toxicities of Lutetium-177–labeled Prostate-specific Membrane Antigen–targeted Radioligand Therapy in Metastatic Castration-Resistant Prostate Cancer. Eur. Urol. 2021, 80, 82–94. [Google Scholar] [CrossRef]
- Fanti, S.; Hadaschik, B.; Herrmann, K. Proposal for Systemic-Therapy Response-Assessment Criteria at the Time of PSMA PET/CT Imaging: The PSMA PET Progression Criteria. J. Nucl. Med. 2019, 61, 678–682. [Google Scholar] [CrossRef]
- Widjaja, L.; Derlin, T.; Rowe, S.; Pomper, M.; Bengel, F.; Werner, R. Strukturierte Quantifizierung von PSMA PET/CTs mit Hilfe des PSMA-RAD-Systems zur Vorhersage des Therapieansprechens auf eine PSMA-Radioligandentherapie. Nuklearmedizin 2021, 60, 140. [Google Scholar] [CrossRef]

Publisher’s Note: MDPI stays neutral with regard to jurisdictional claims in published maps and institutional affiliations. |
© 2022 by the authors. Licensee MDPI, Basel, Switzerland. This article is an open access article distributed under the terms and conditions of the Creative Commons Attribution (CC BY) license (https://creativecommons.org/licenses/by/4.0/).