
Pseudocontinuous Arterial Spin Labeling: Clinical Applications and Usefulness in Head and Neck Entities

 , , ,
, , ,
Simple Summary
Abstract
1. Introduction
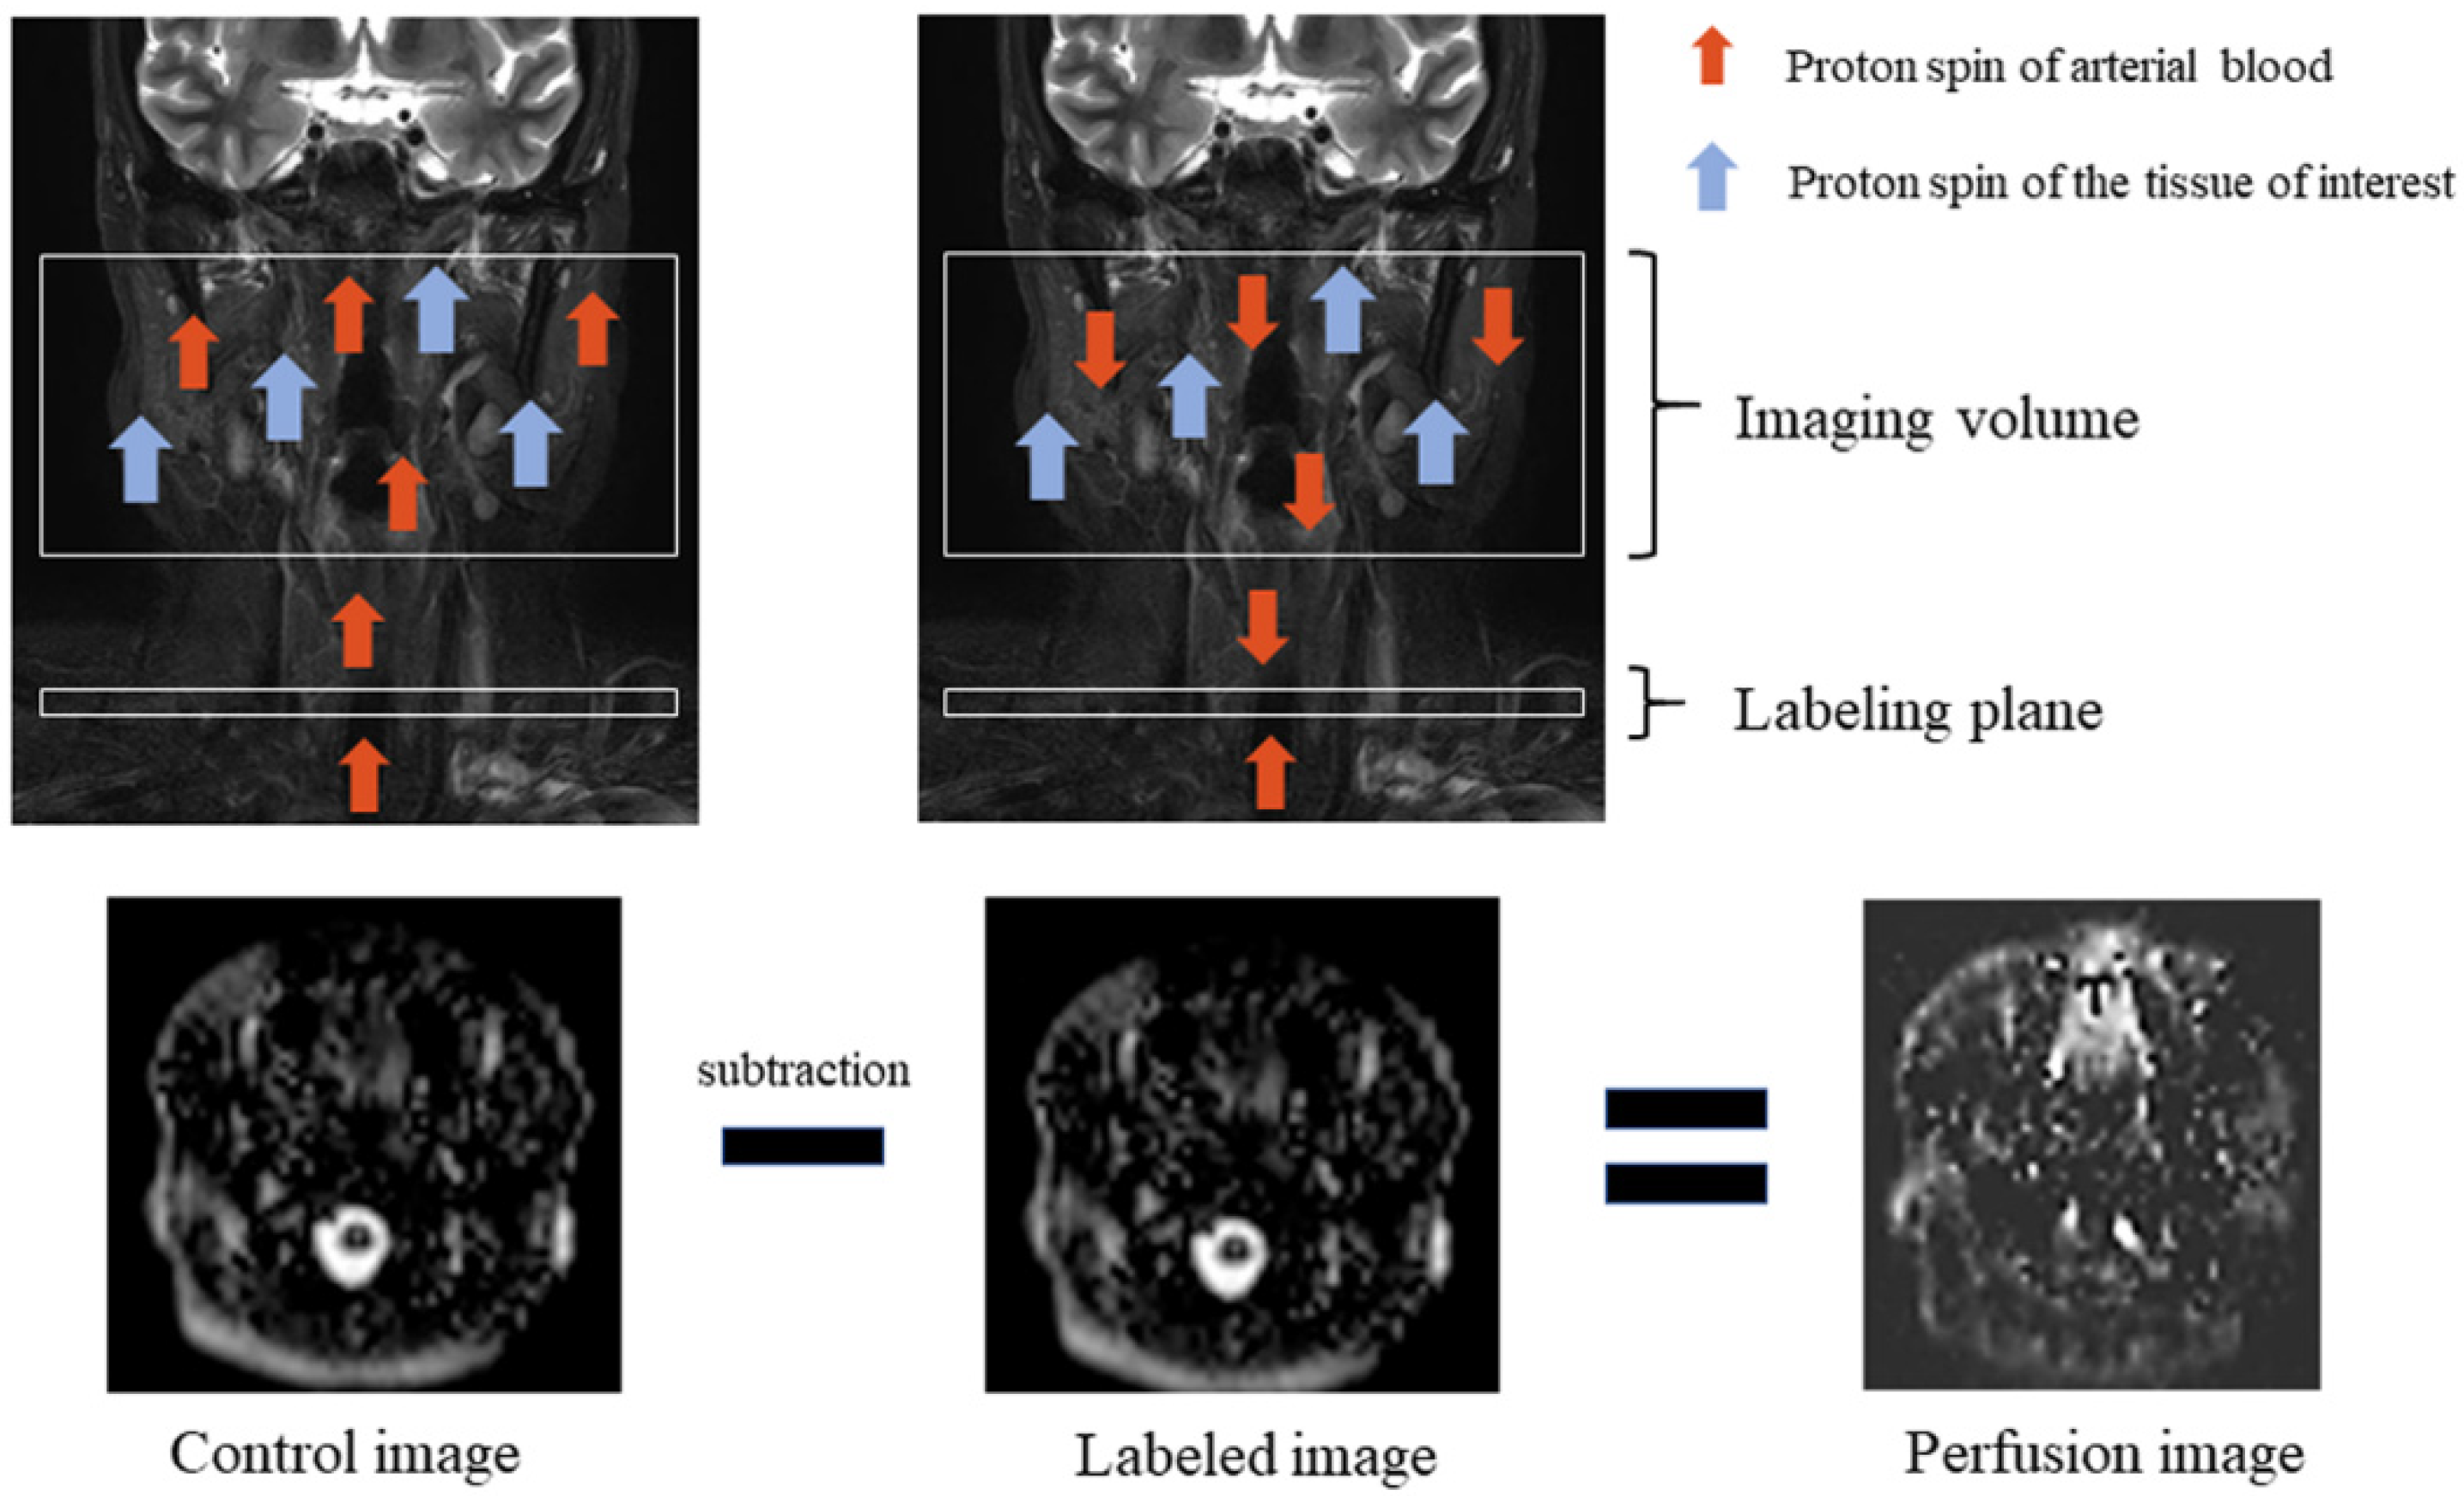
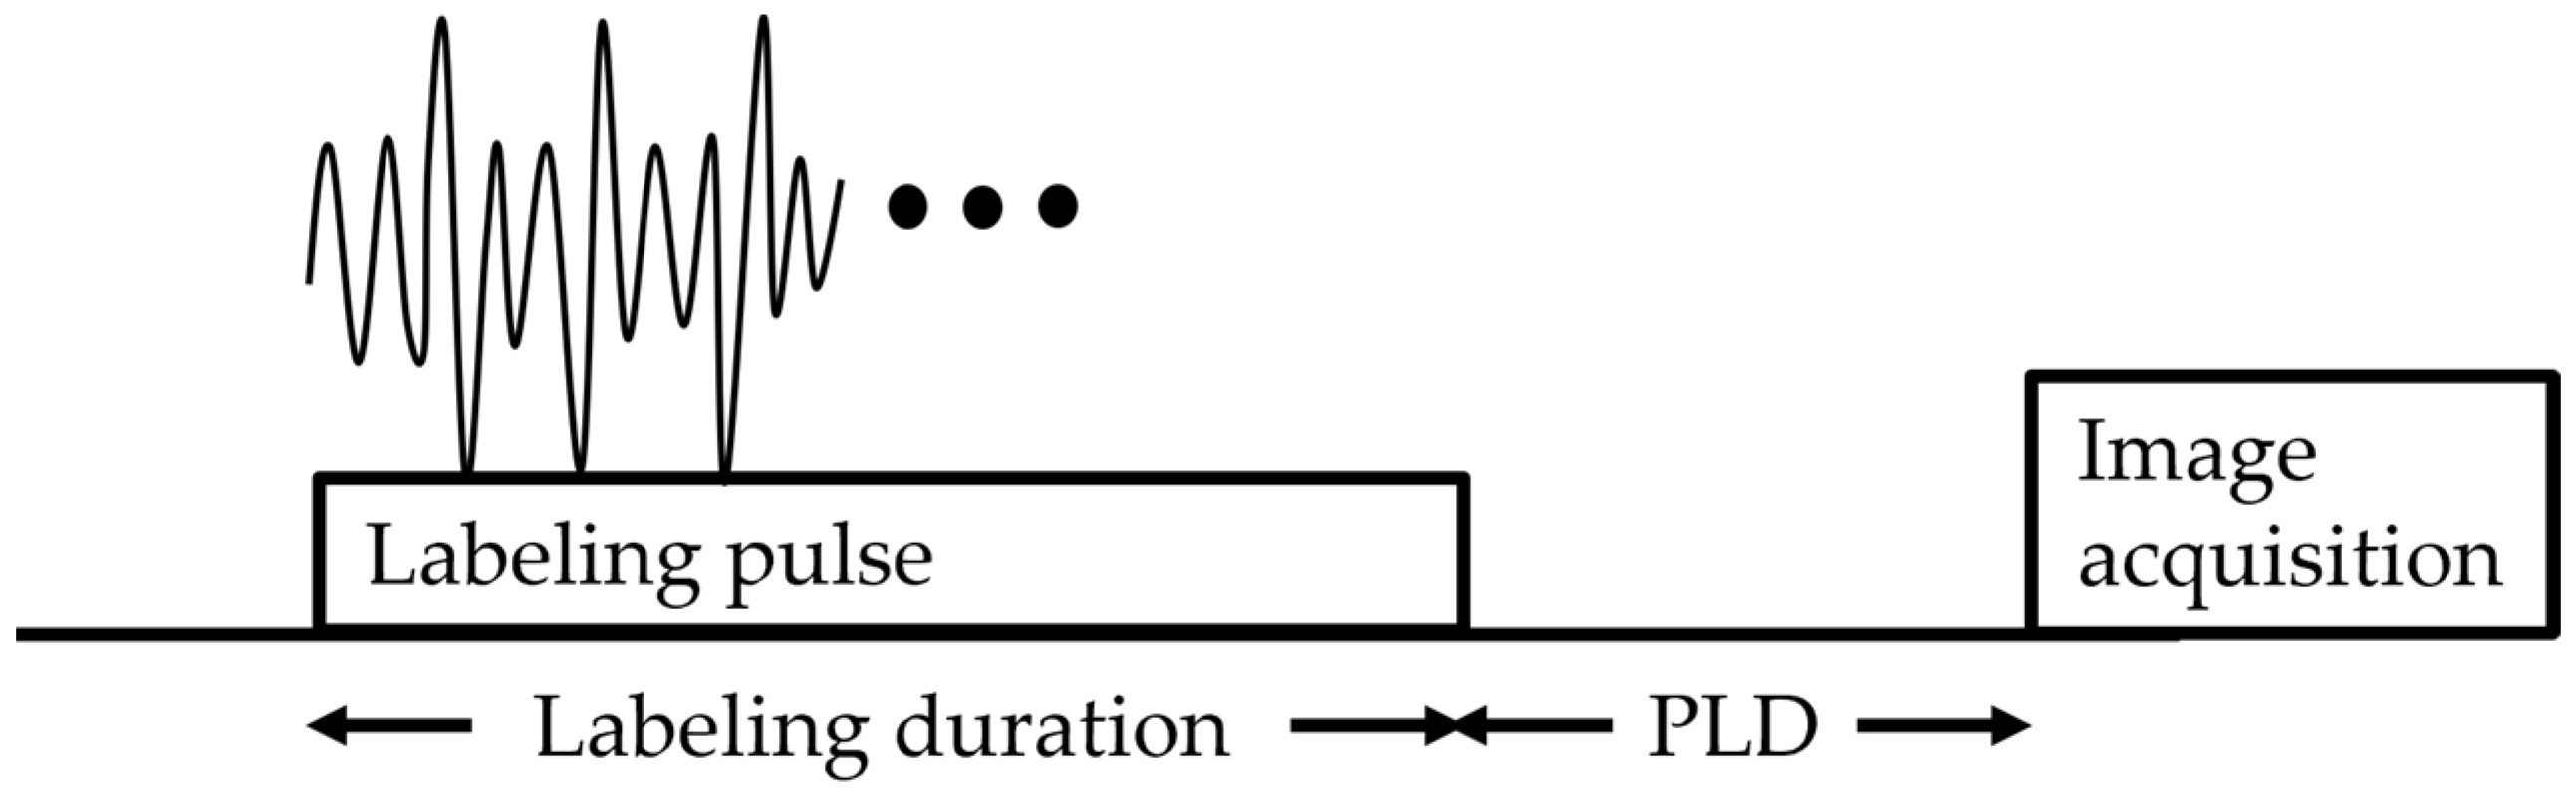
2. Principle of ASL
3. Timeline of the Clinical Use of ASL in the Head and Neck
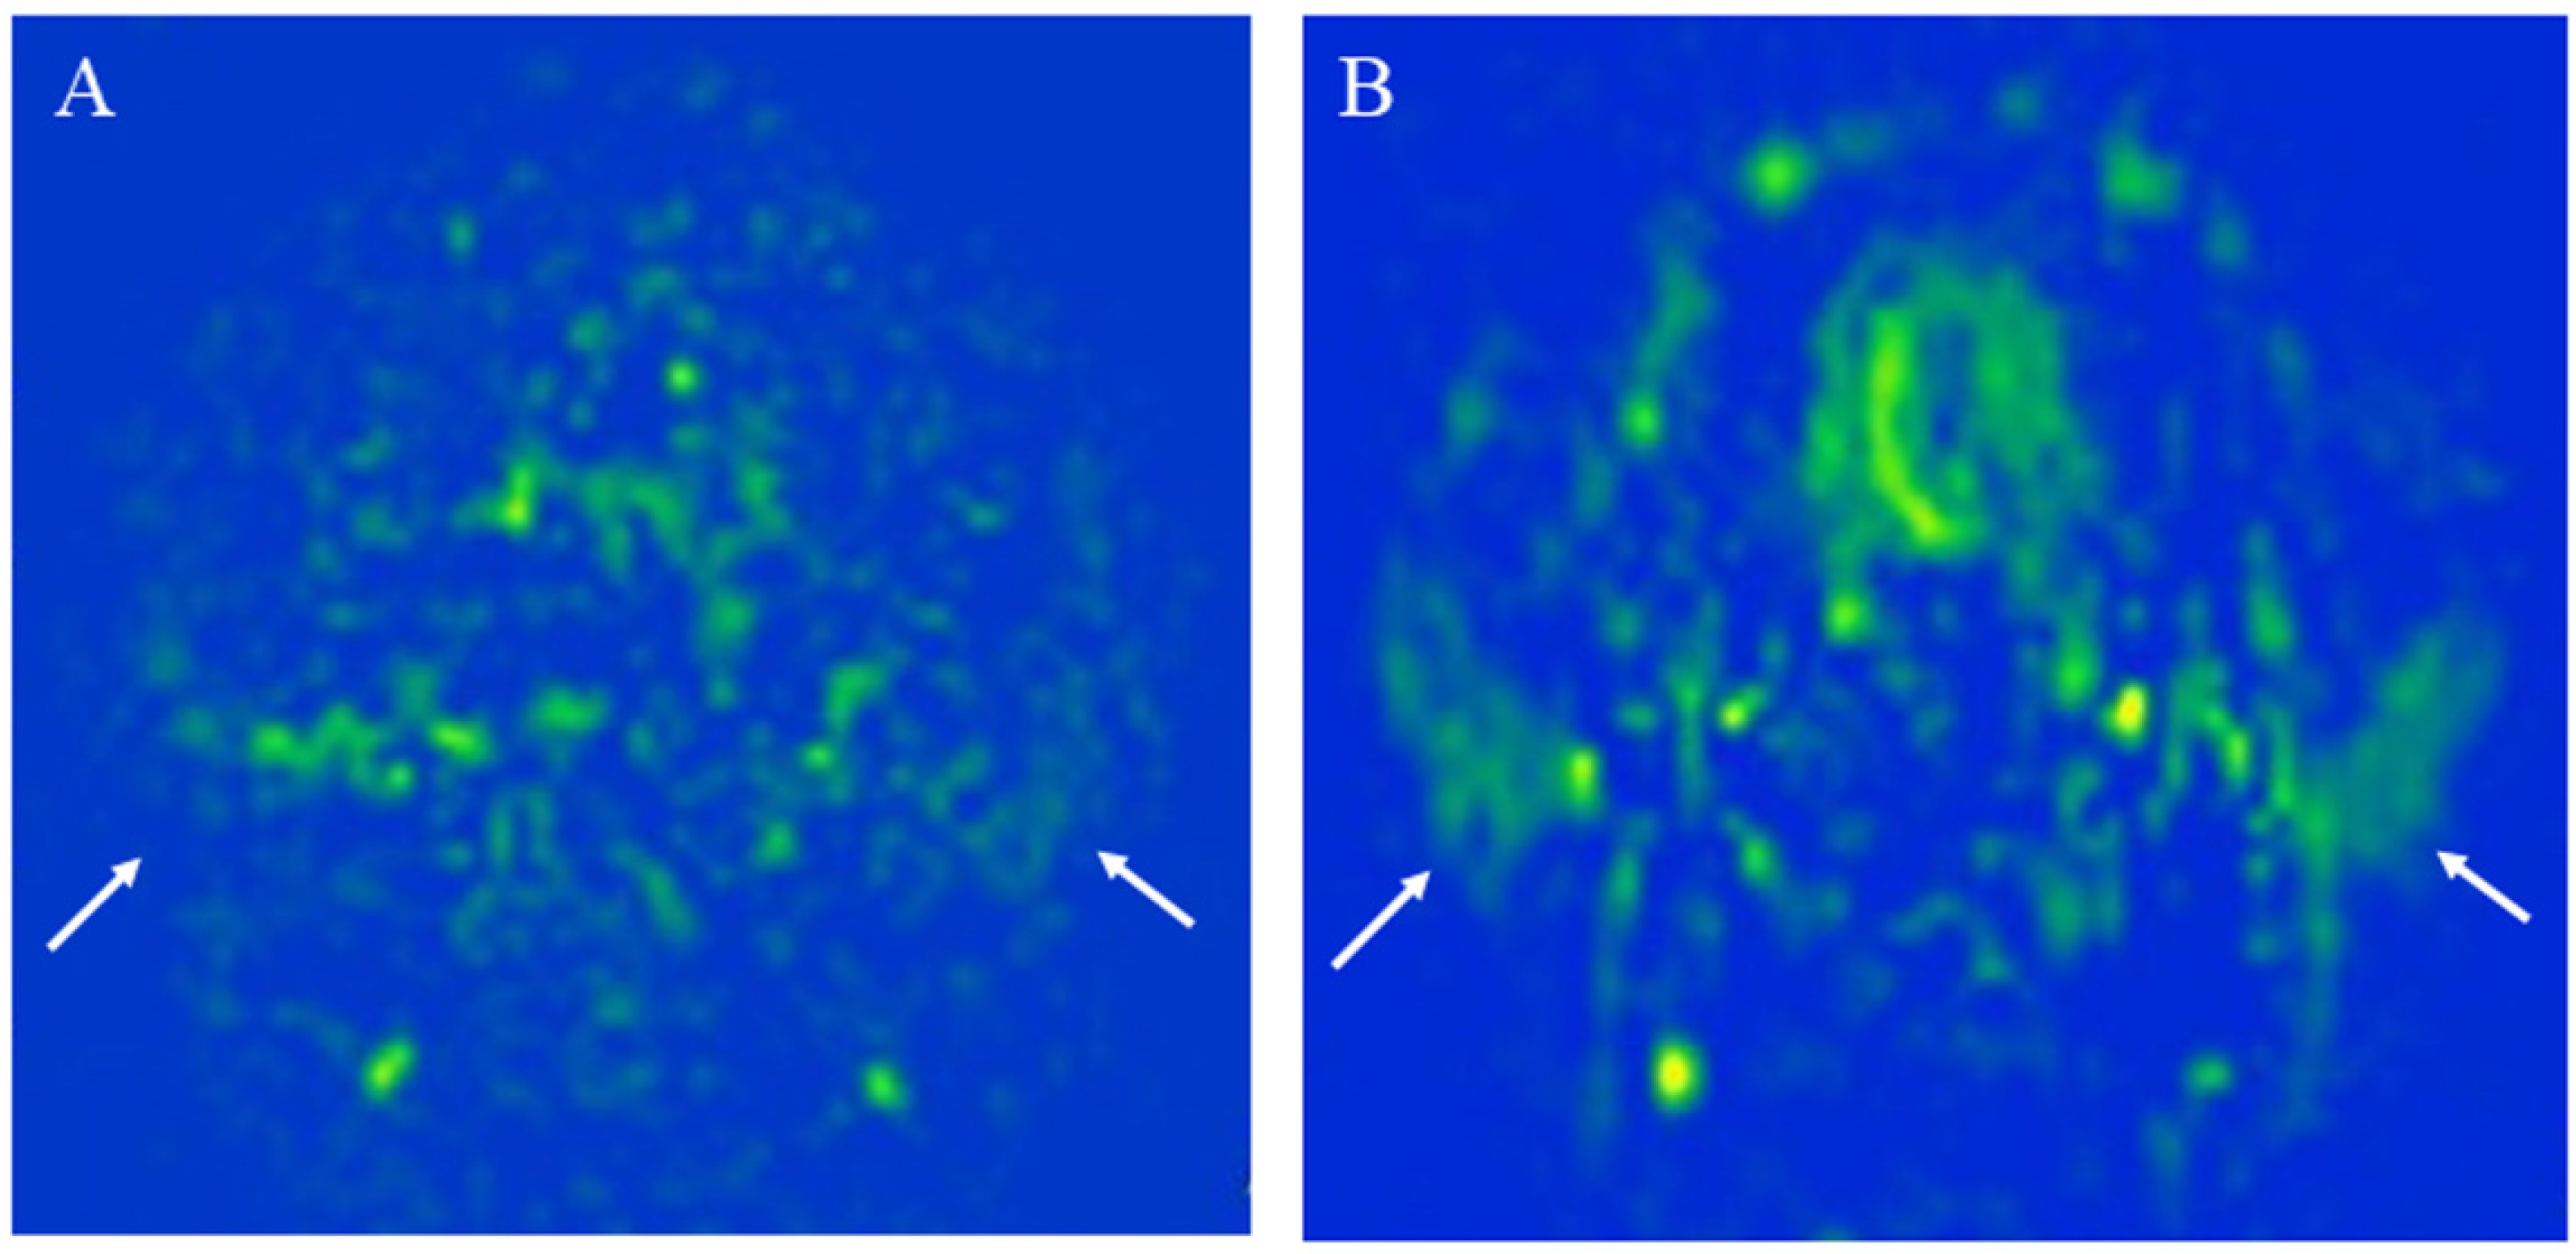
4. 3D TSE pCASL vs. 2D EP pCASL: Measurement of Blood Flow in Normal Parotid Glands
5. Clinical Applications of 3D TSE pCASL in the Head and Neck
5.1. Clinical Application for Diagnosis
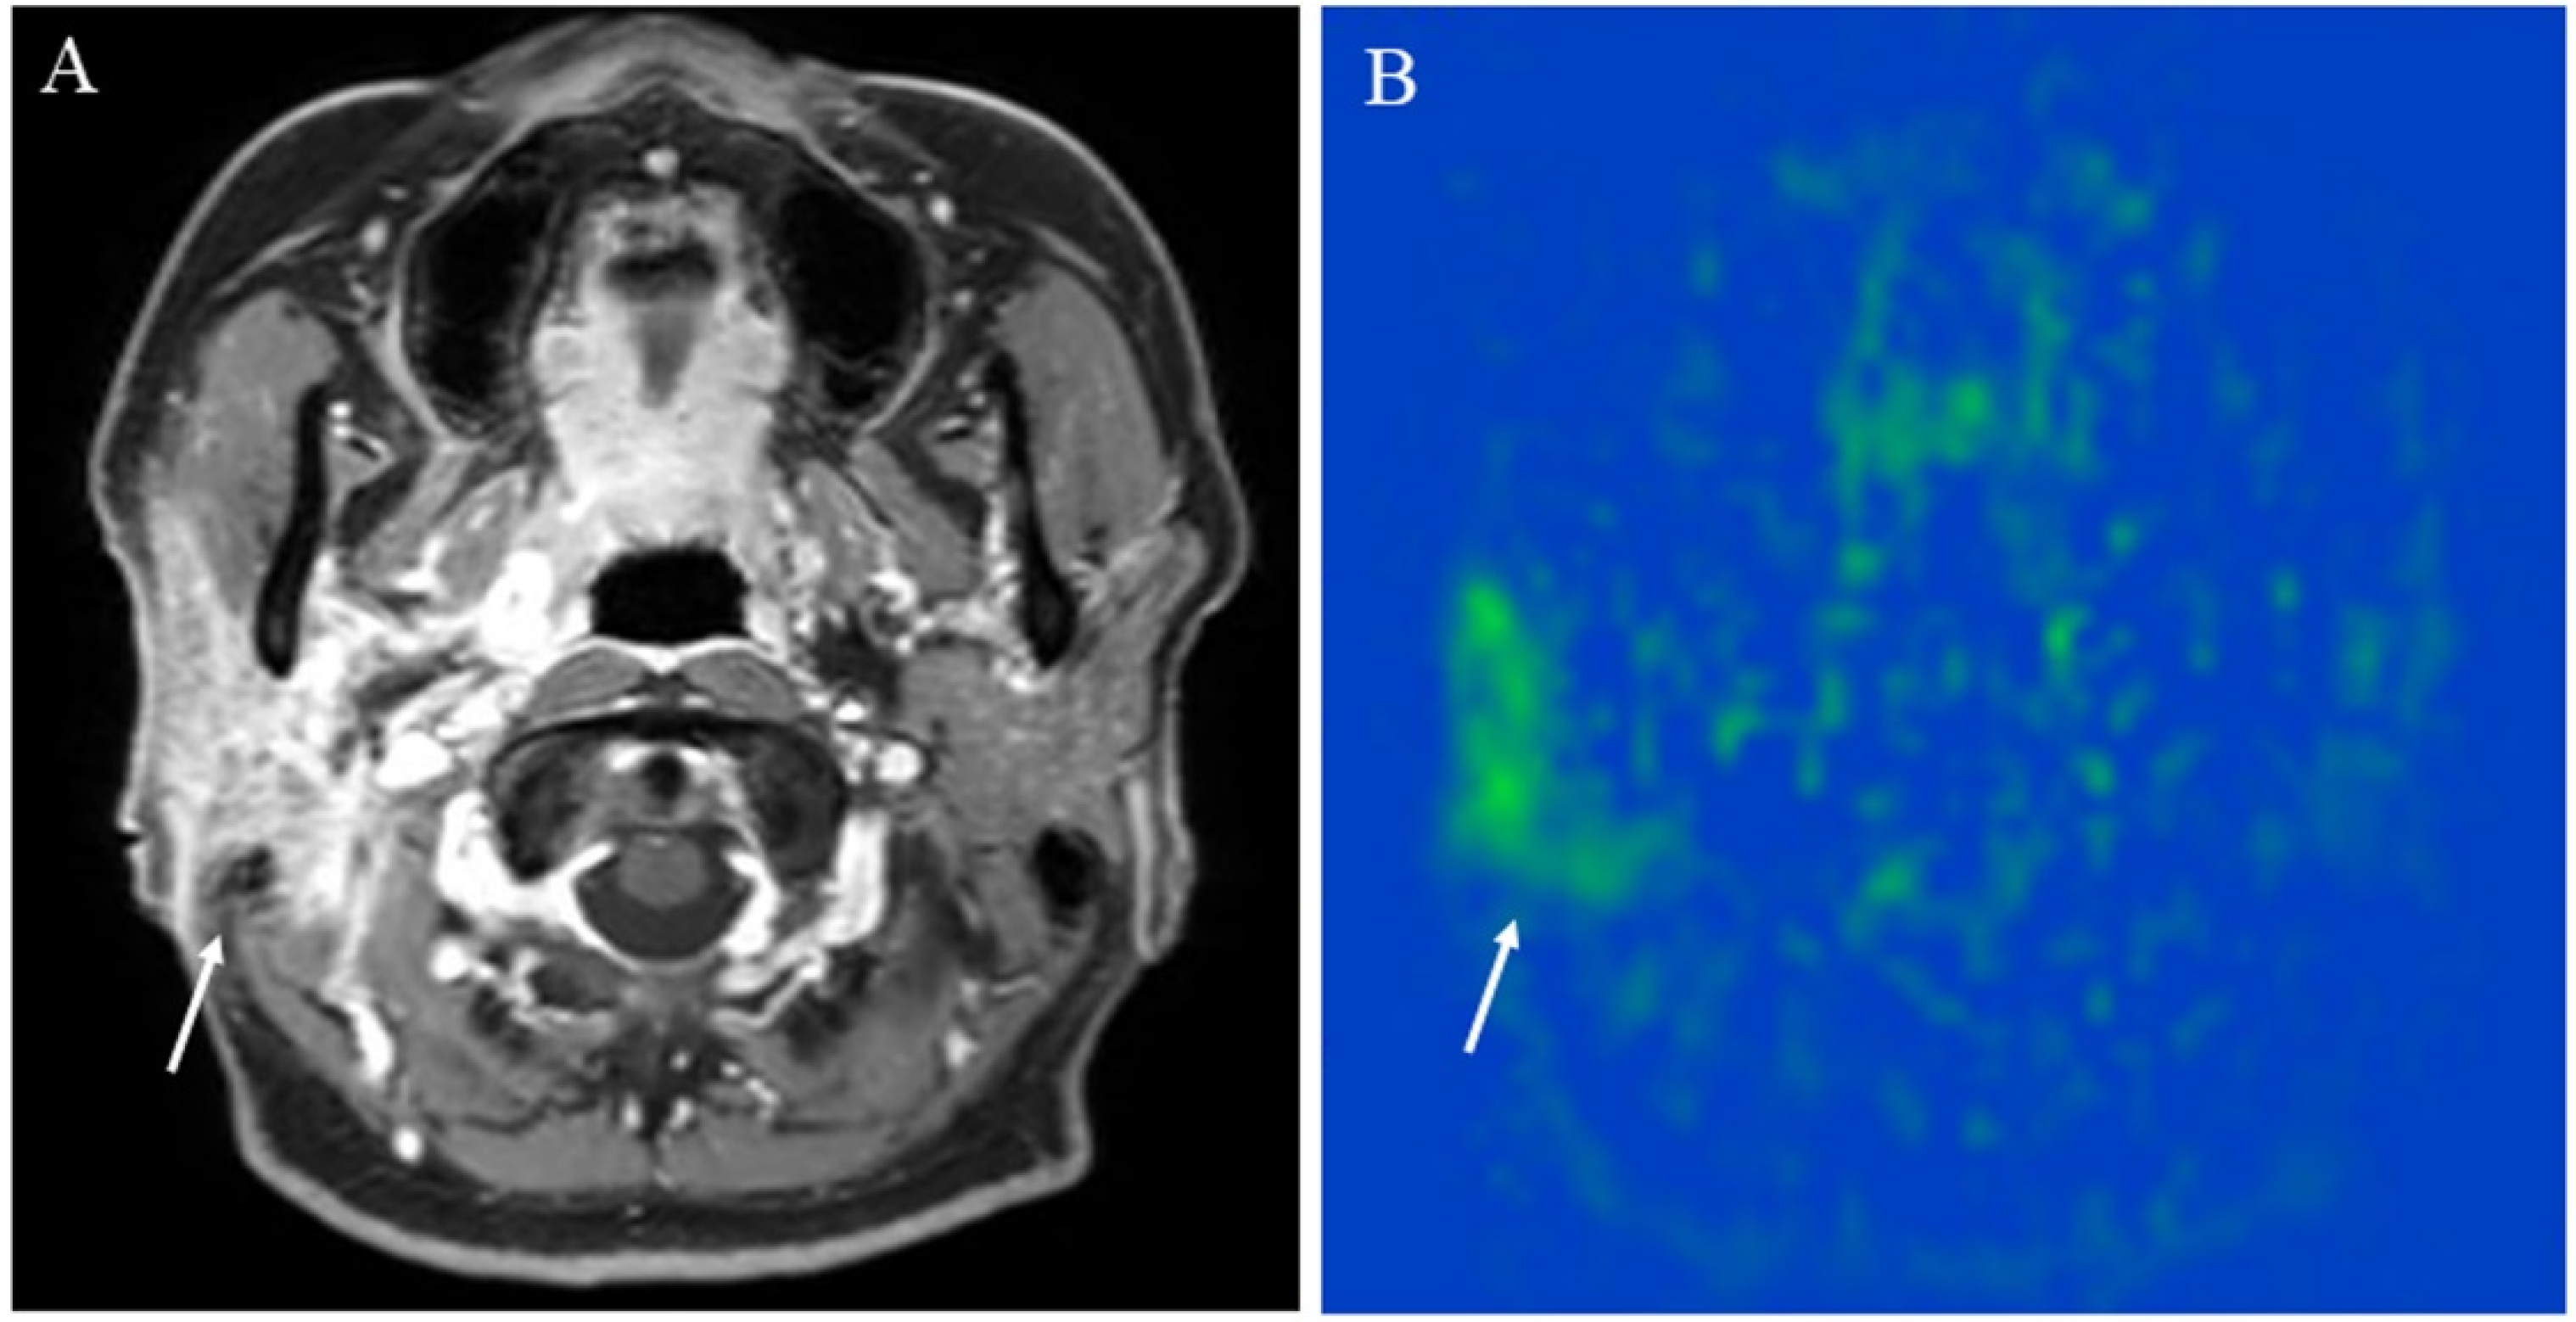
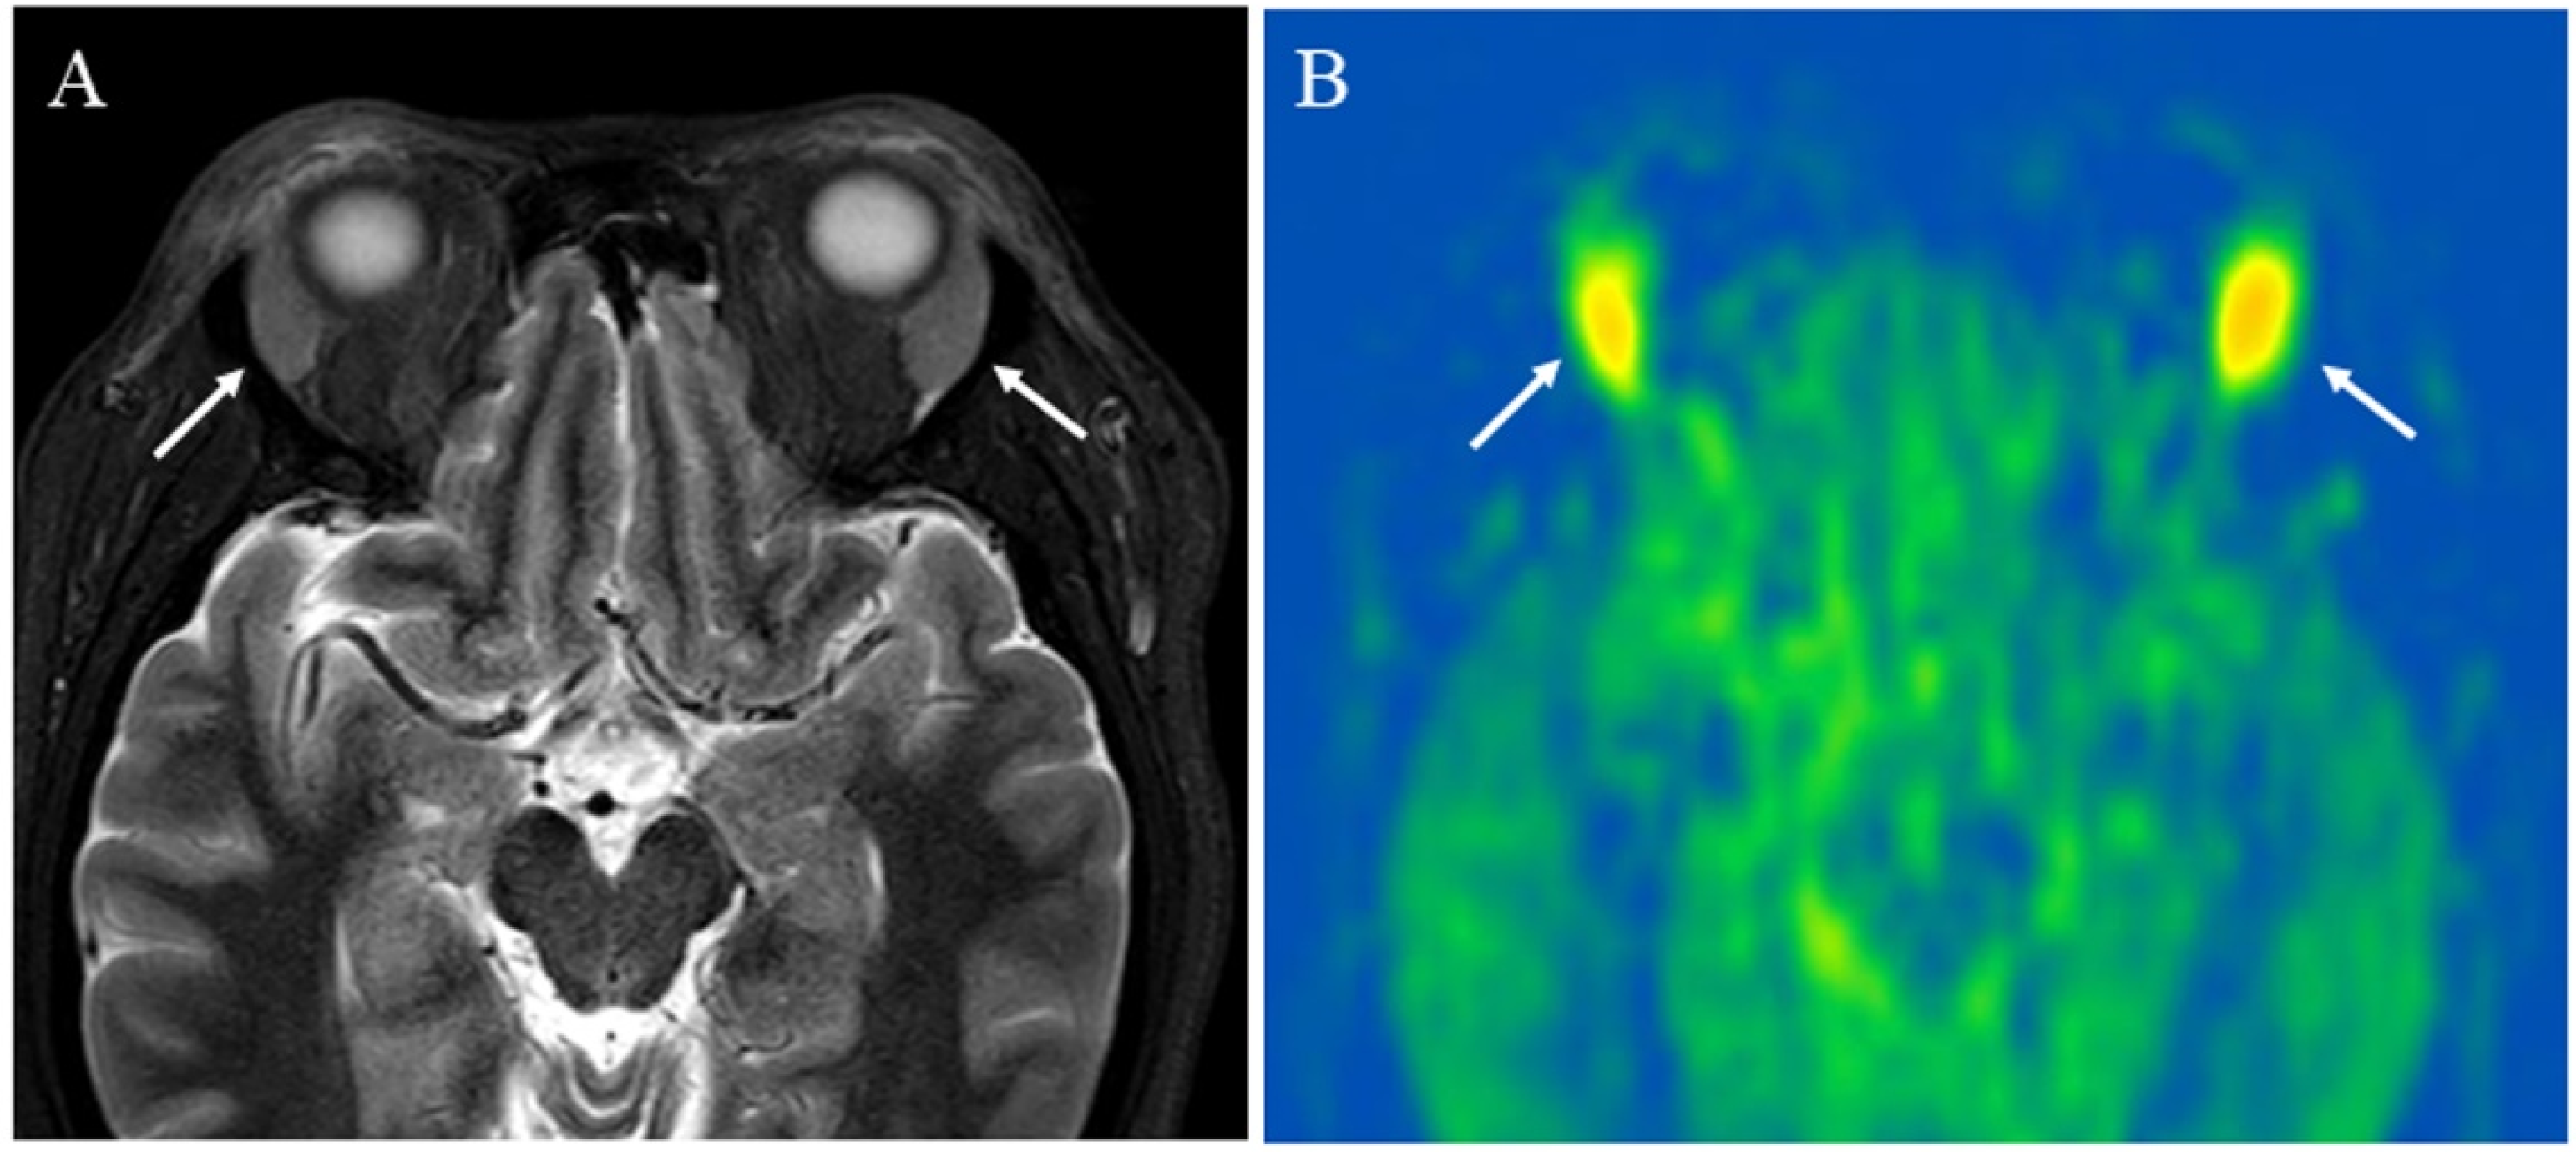
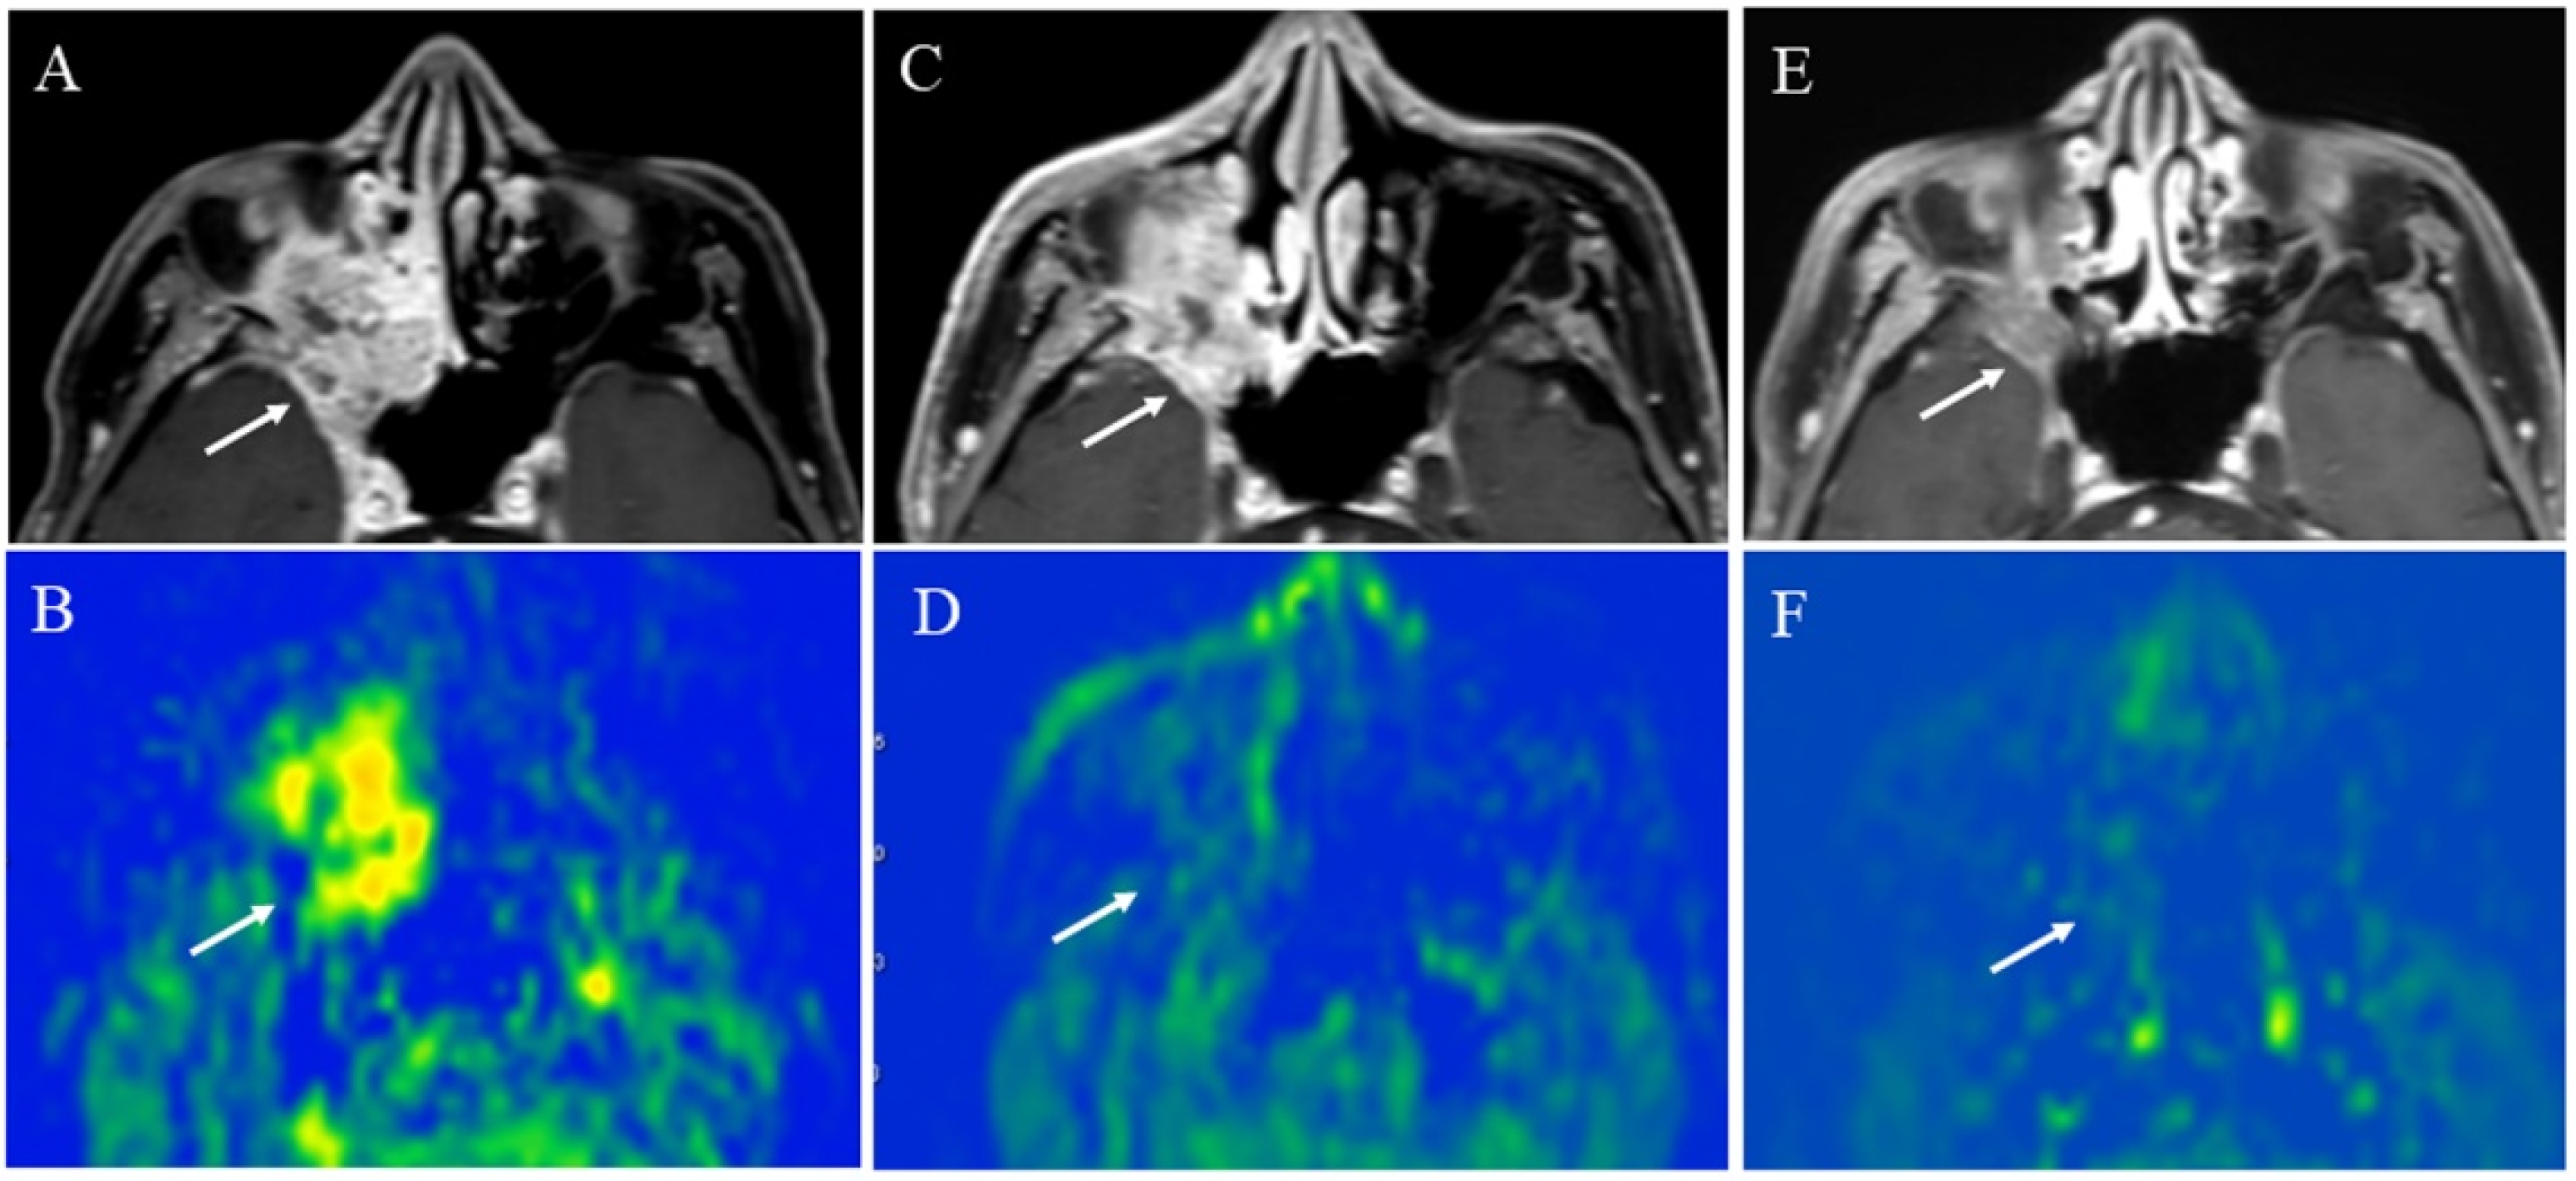
5.1.1. Inflammatory Lesions: Sialadenitis and Dacryoadenitis
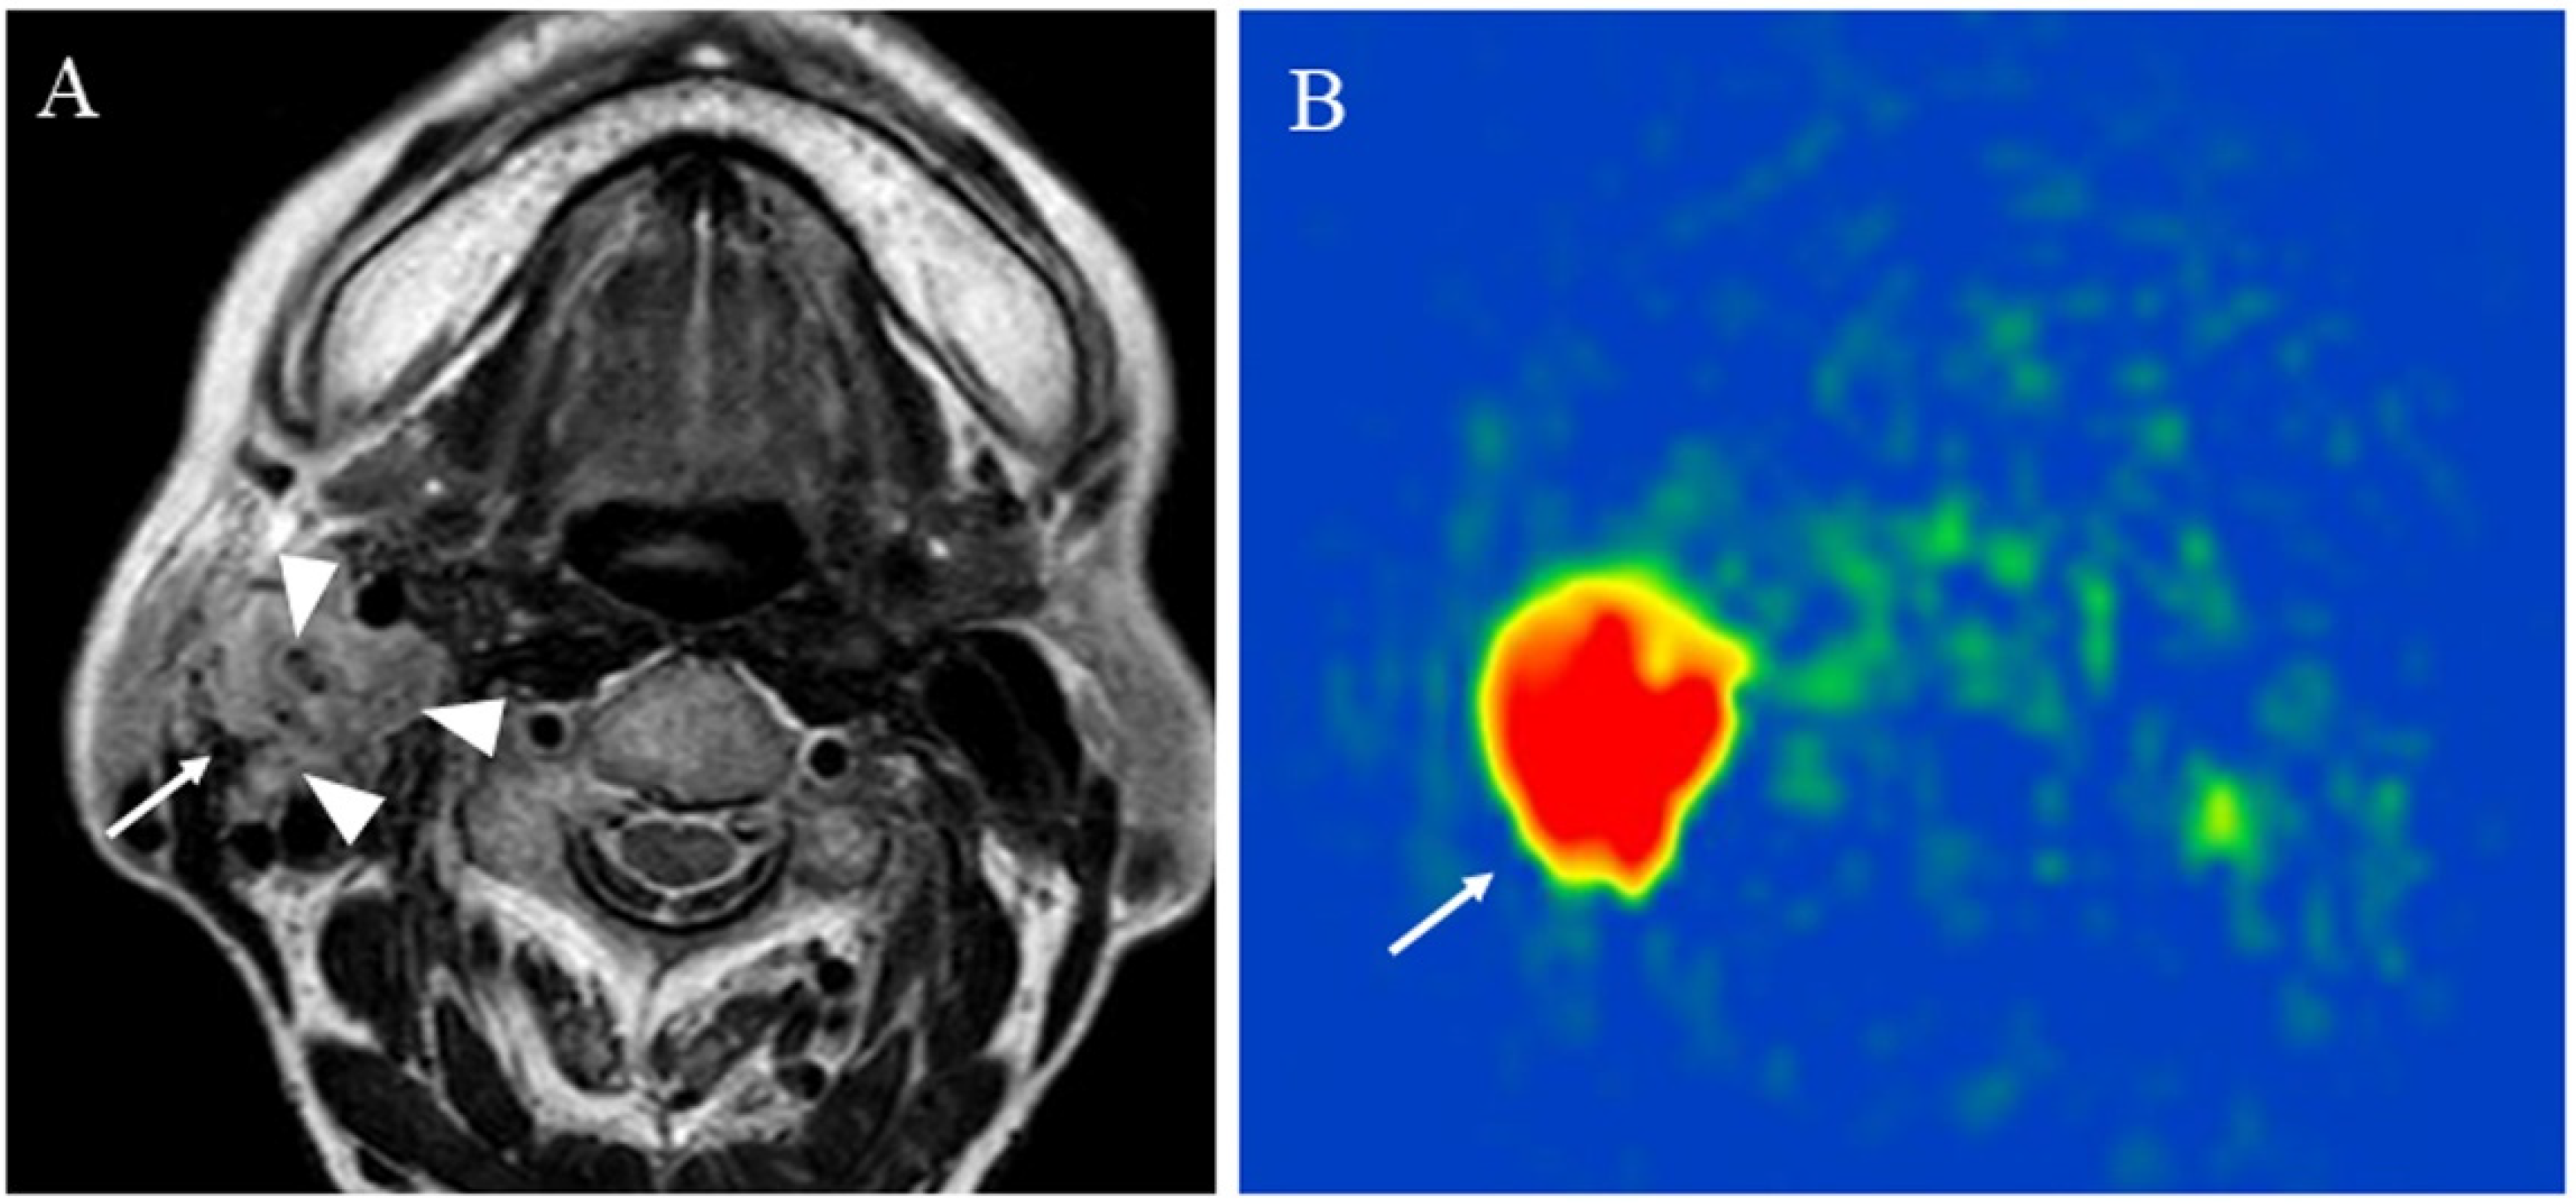
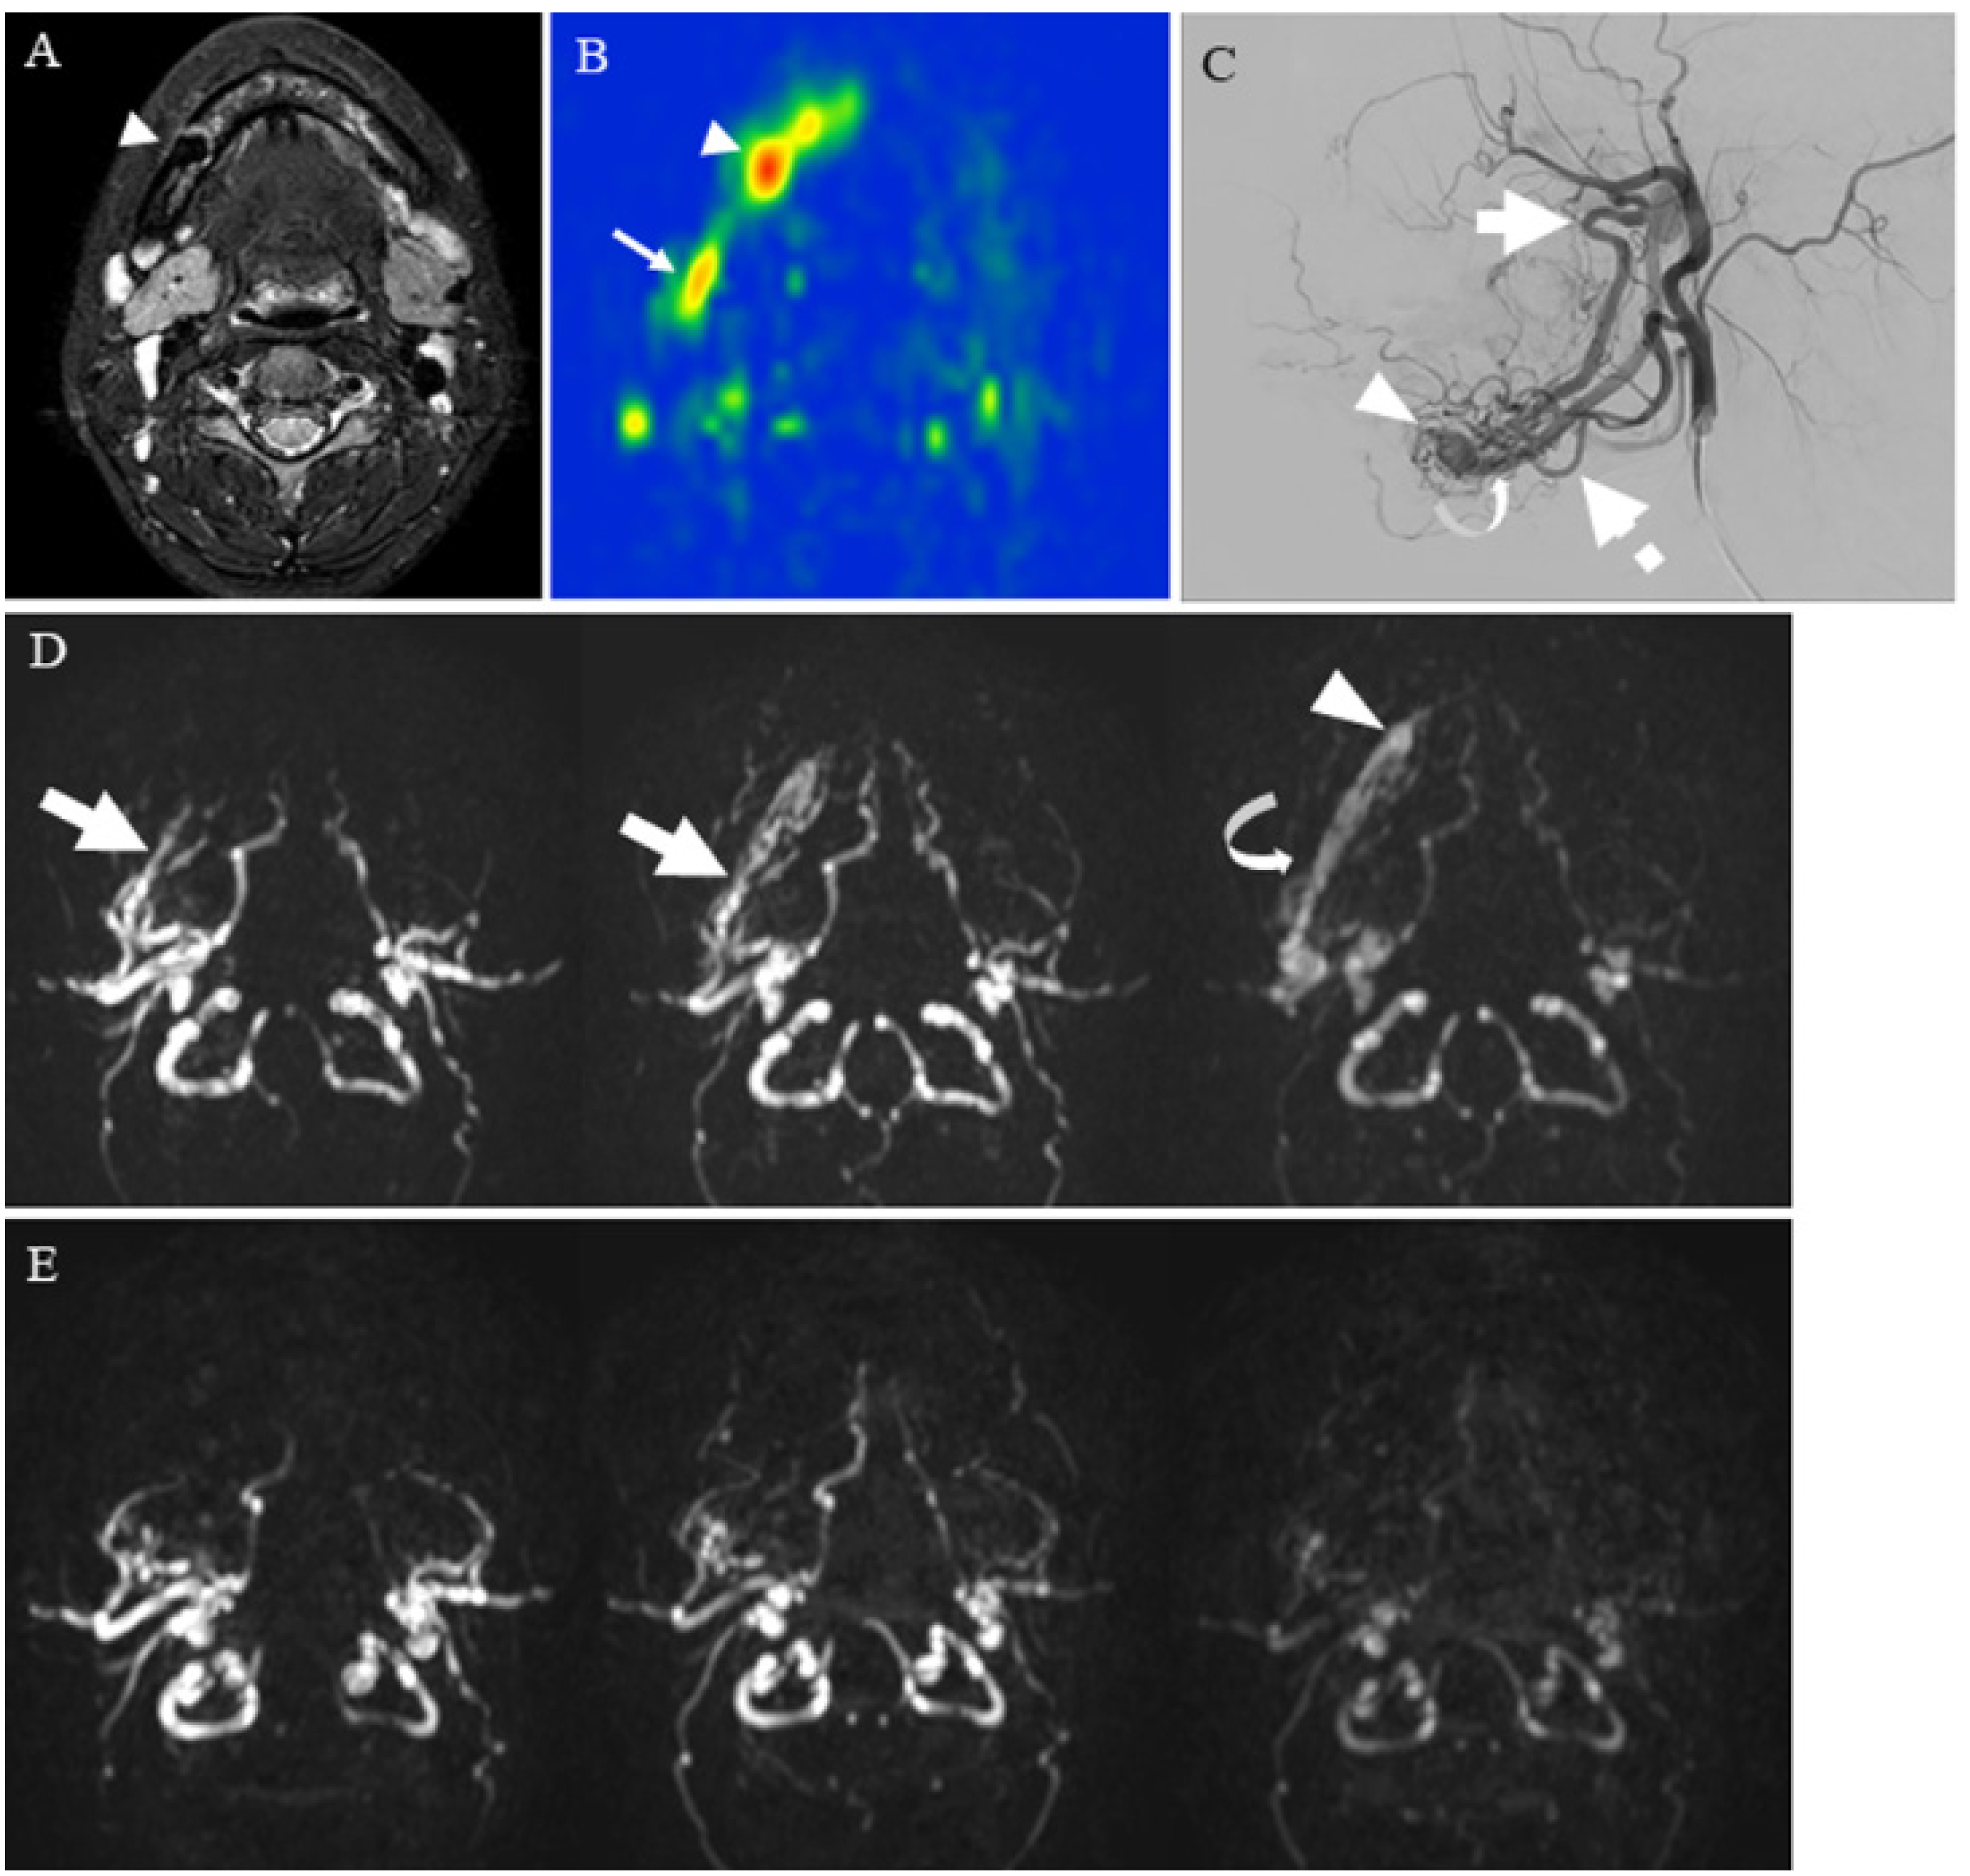
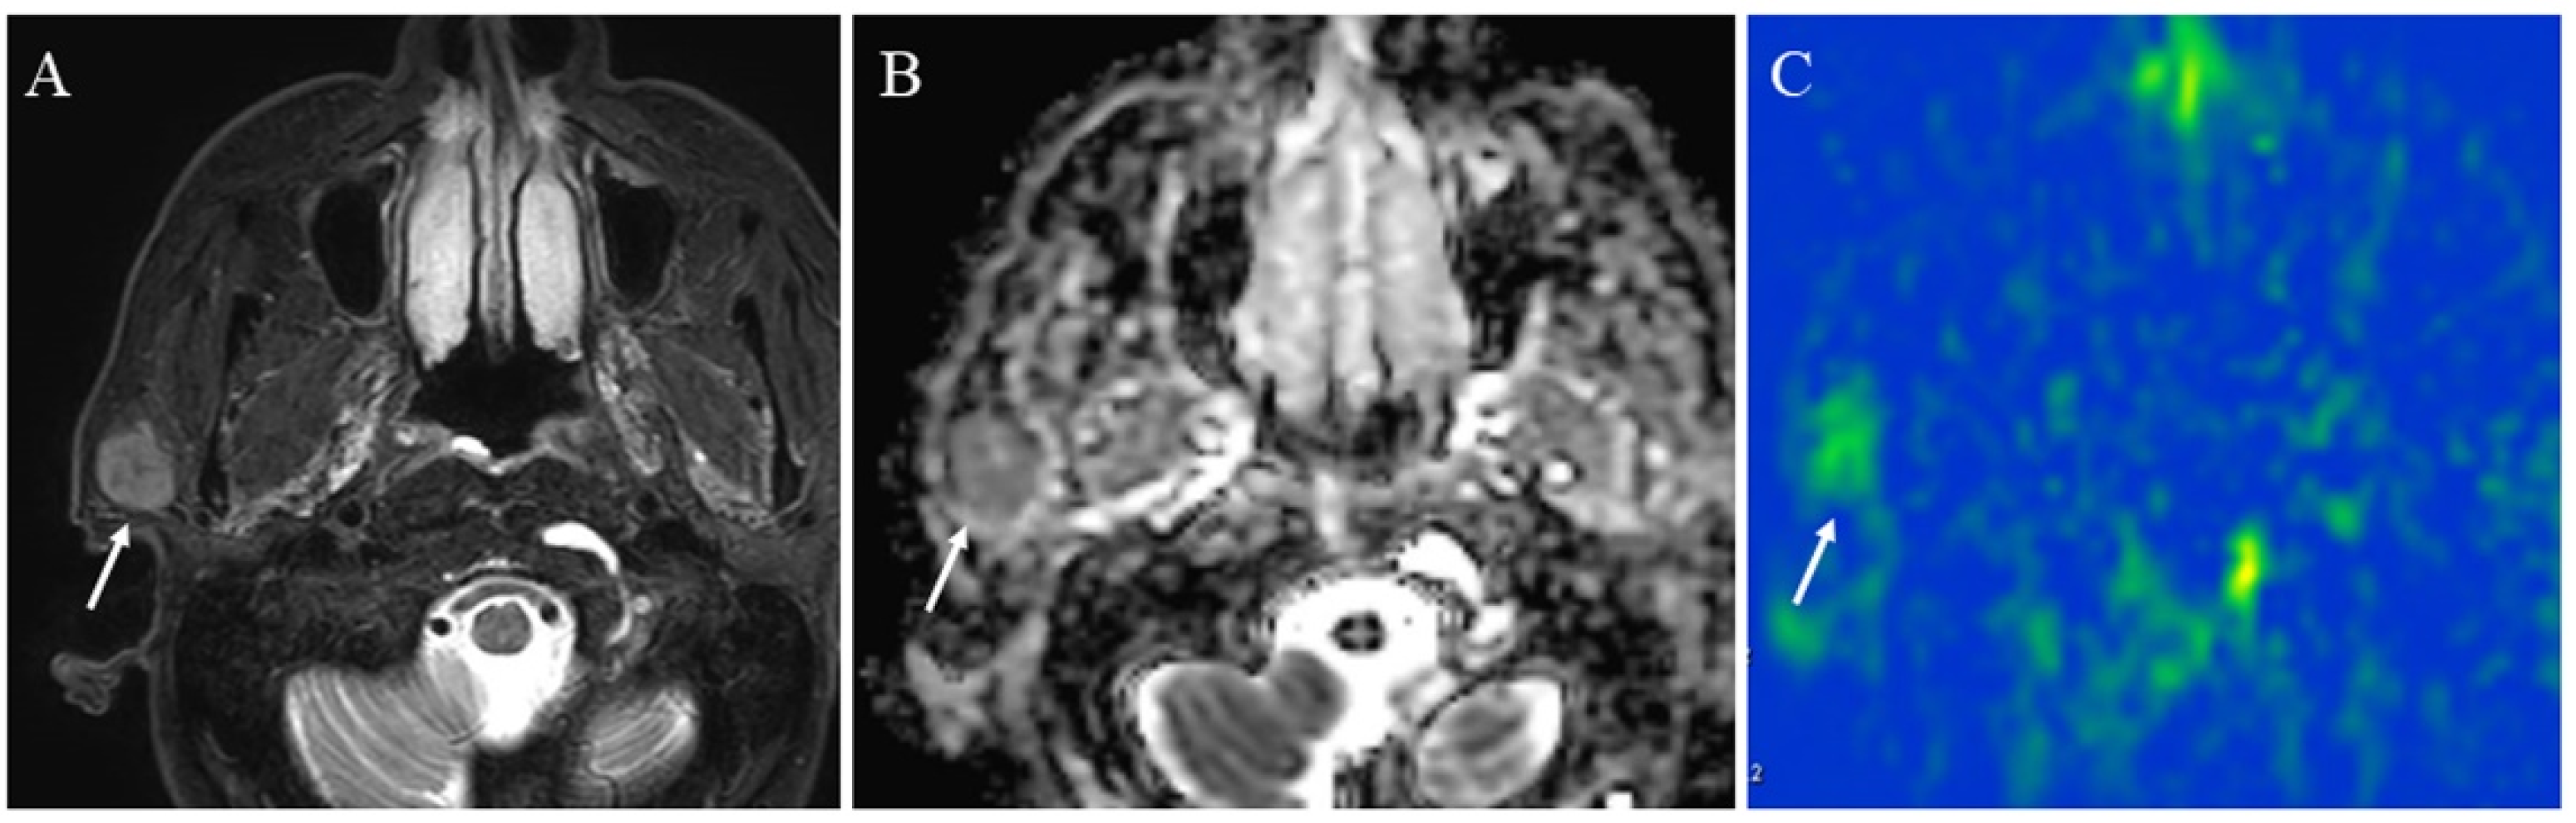
5.1.2. Hypervascular Lesions
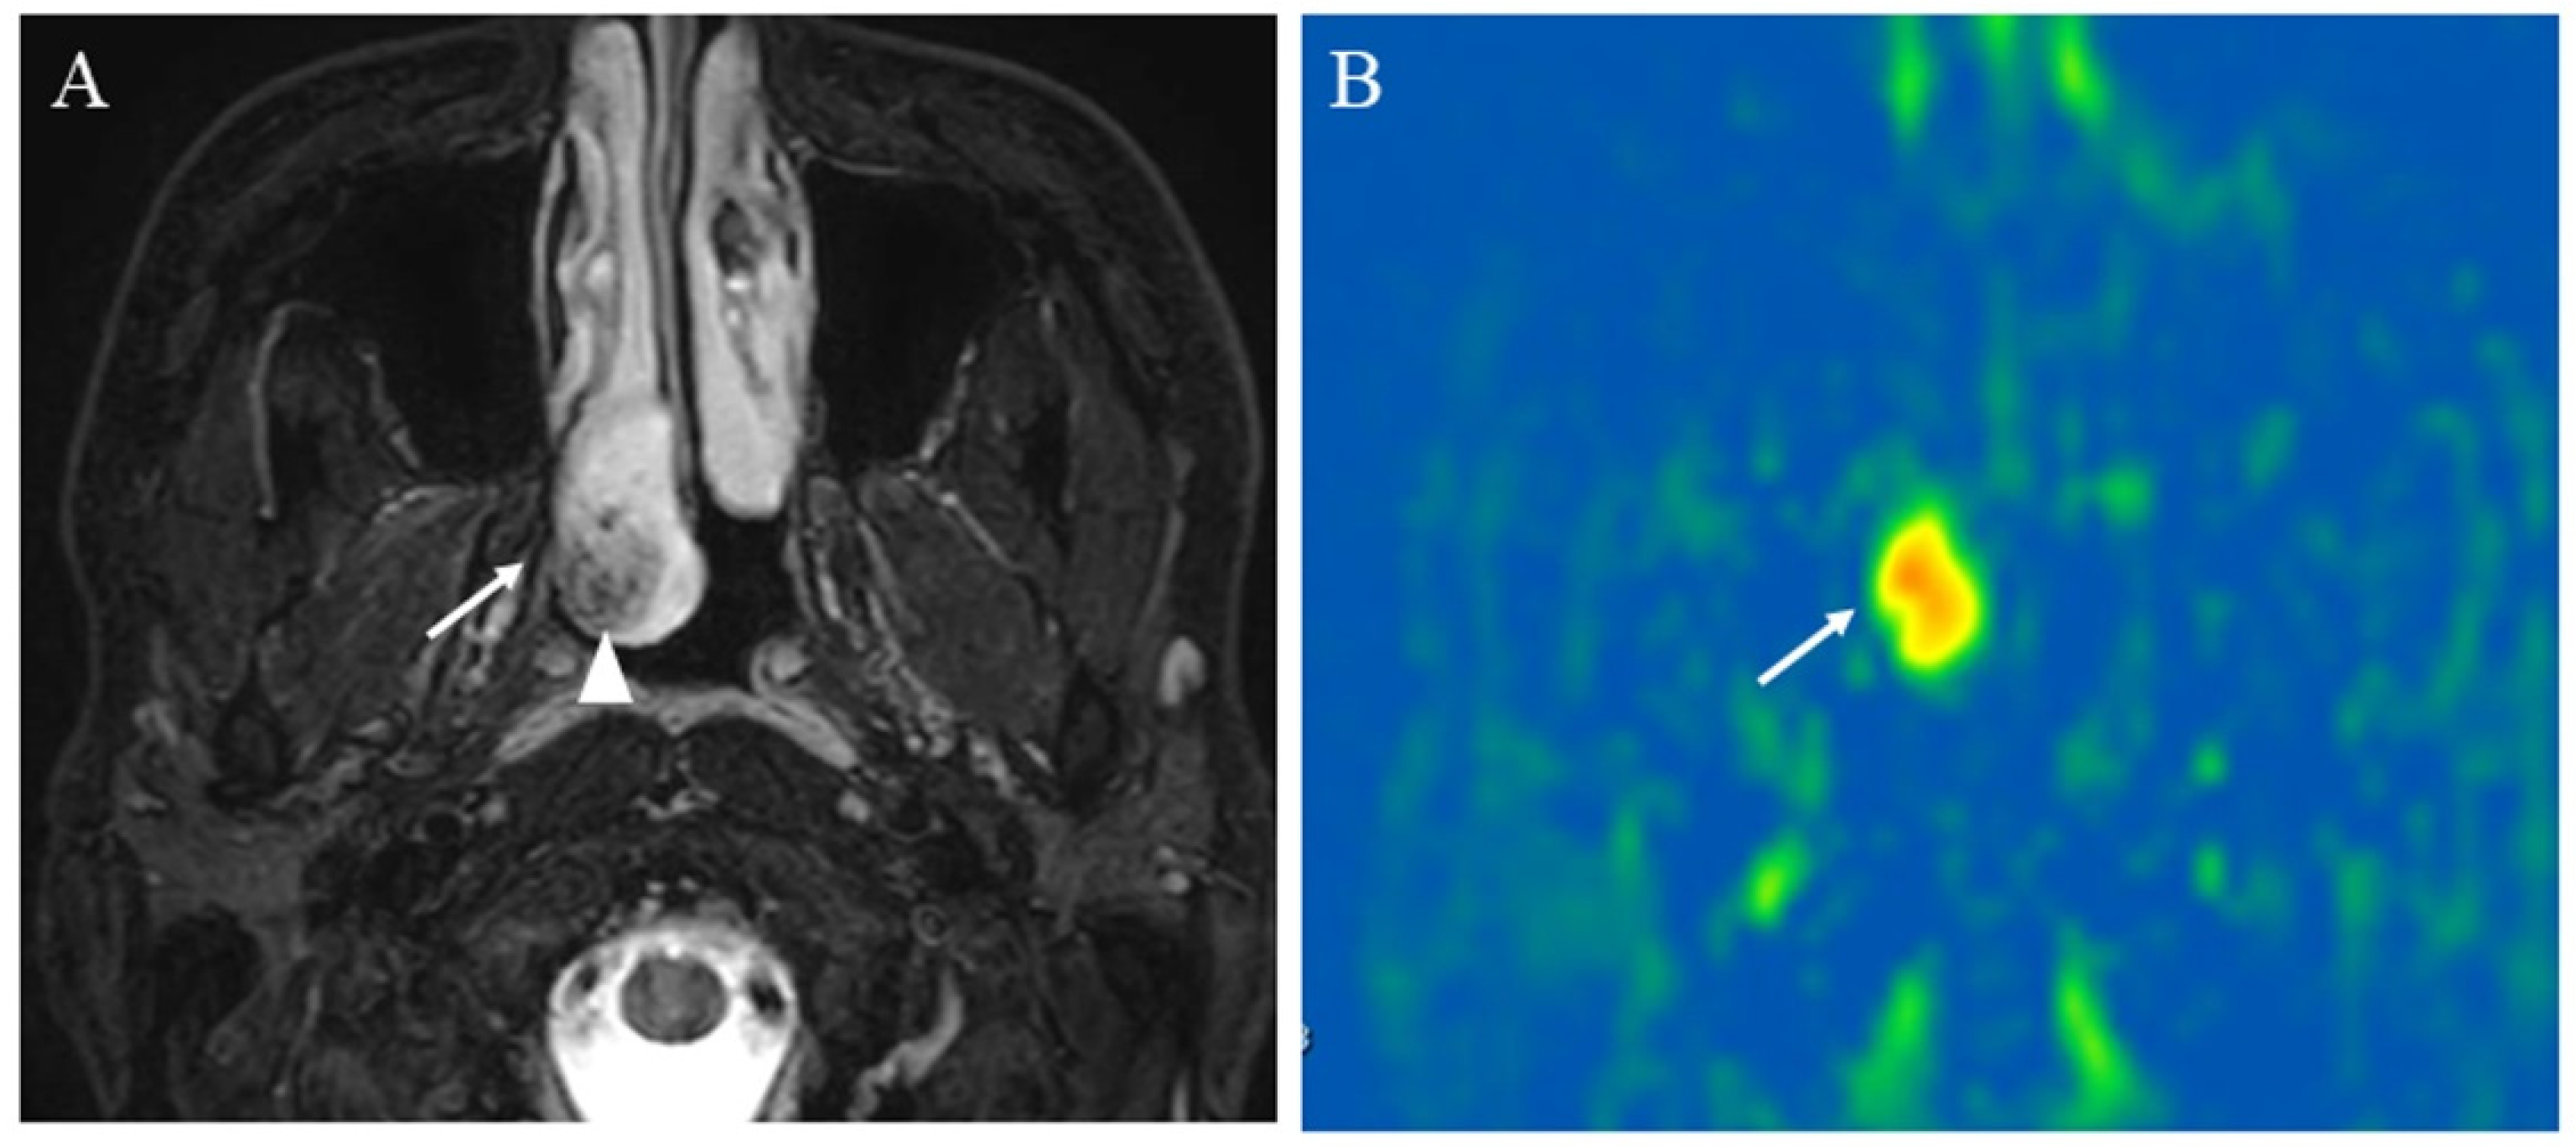
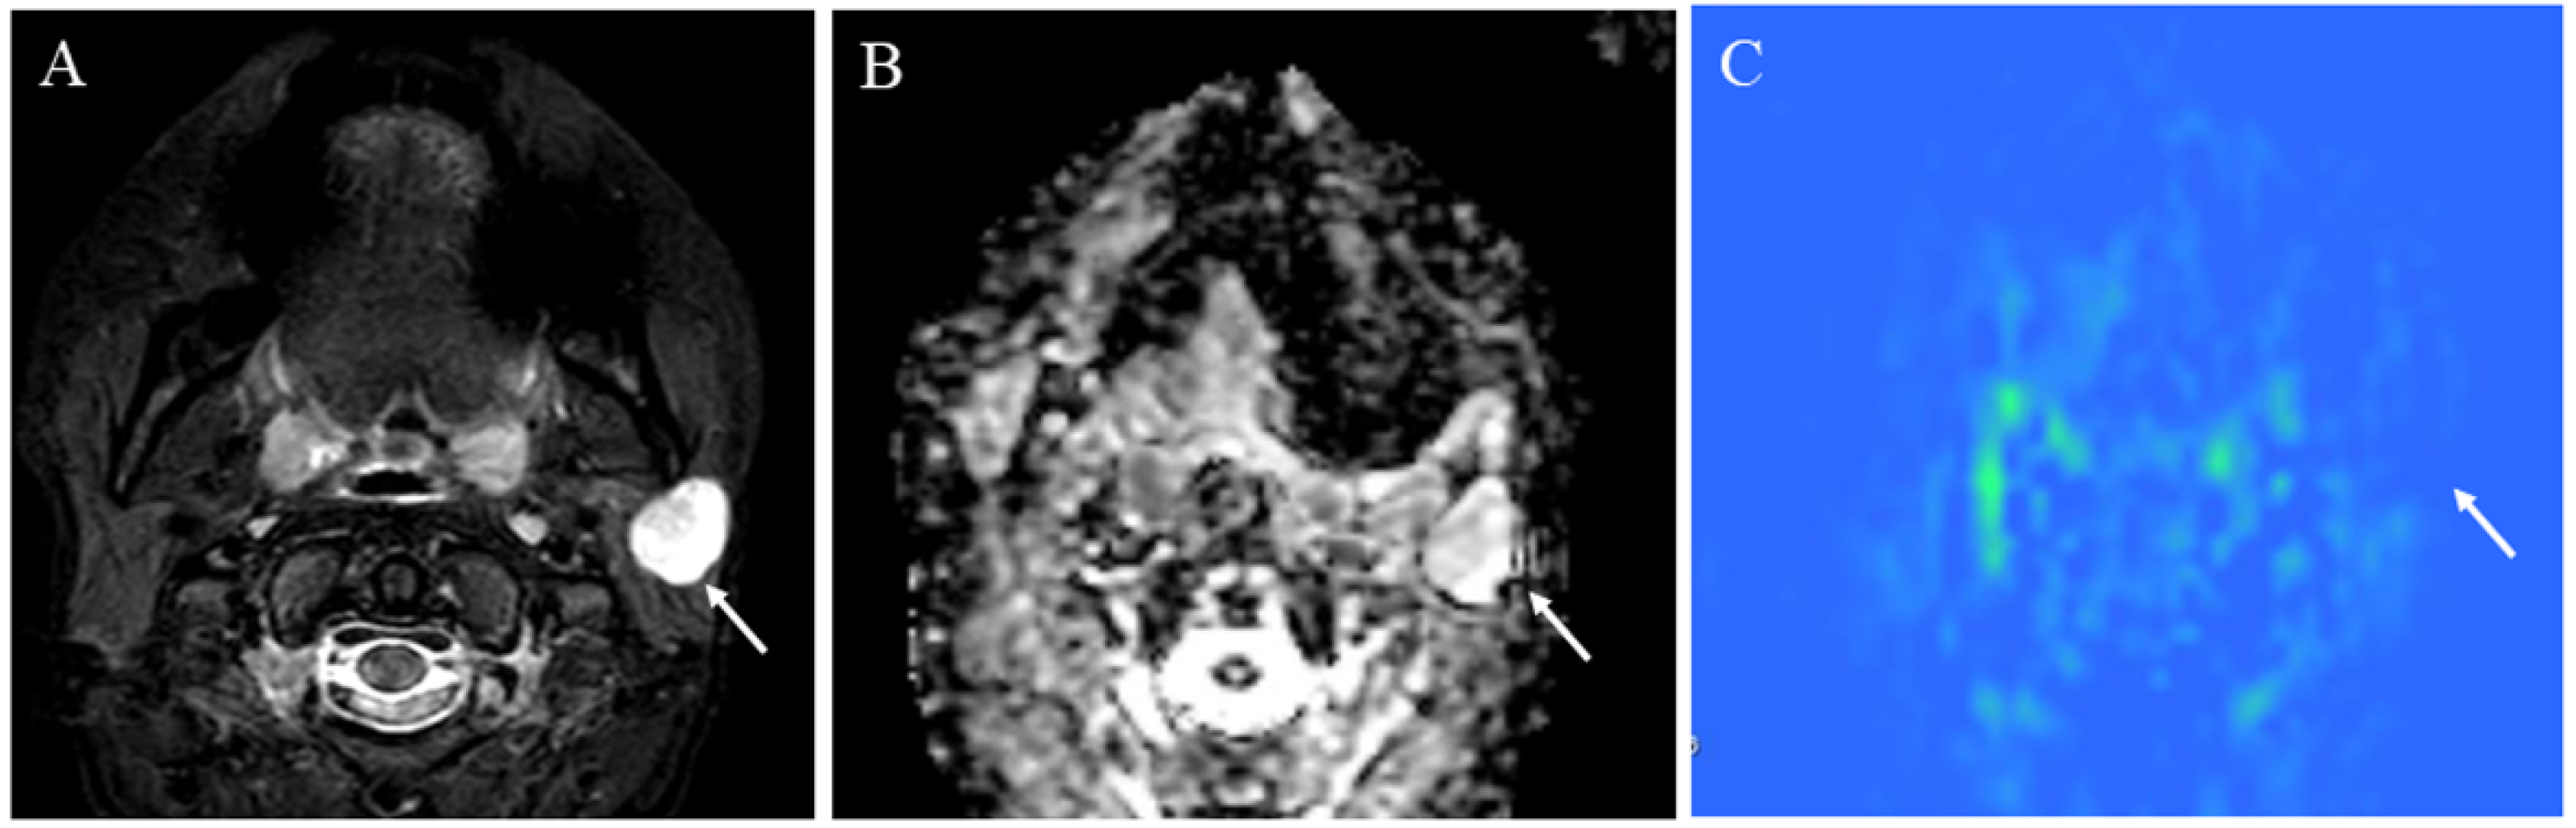
5.1.3. Salivary Gland Tumor Differentiation: Malignant Salivary Tumors, Pleomorphic Adenomas, and Warthin’s Tumors
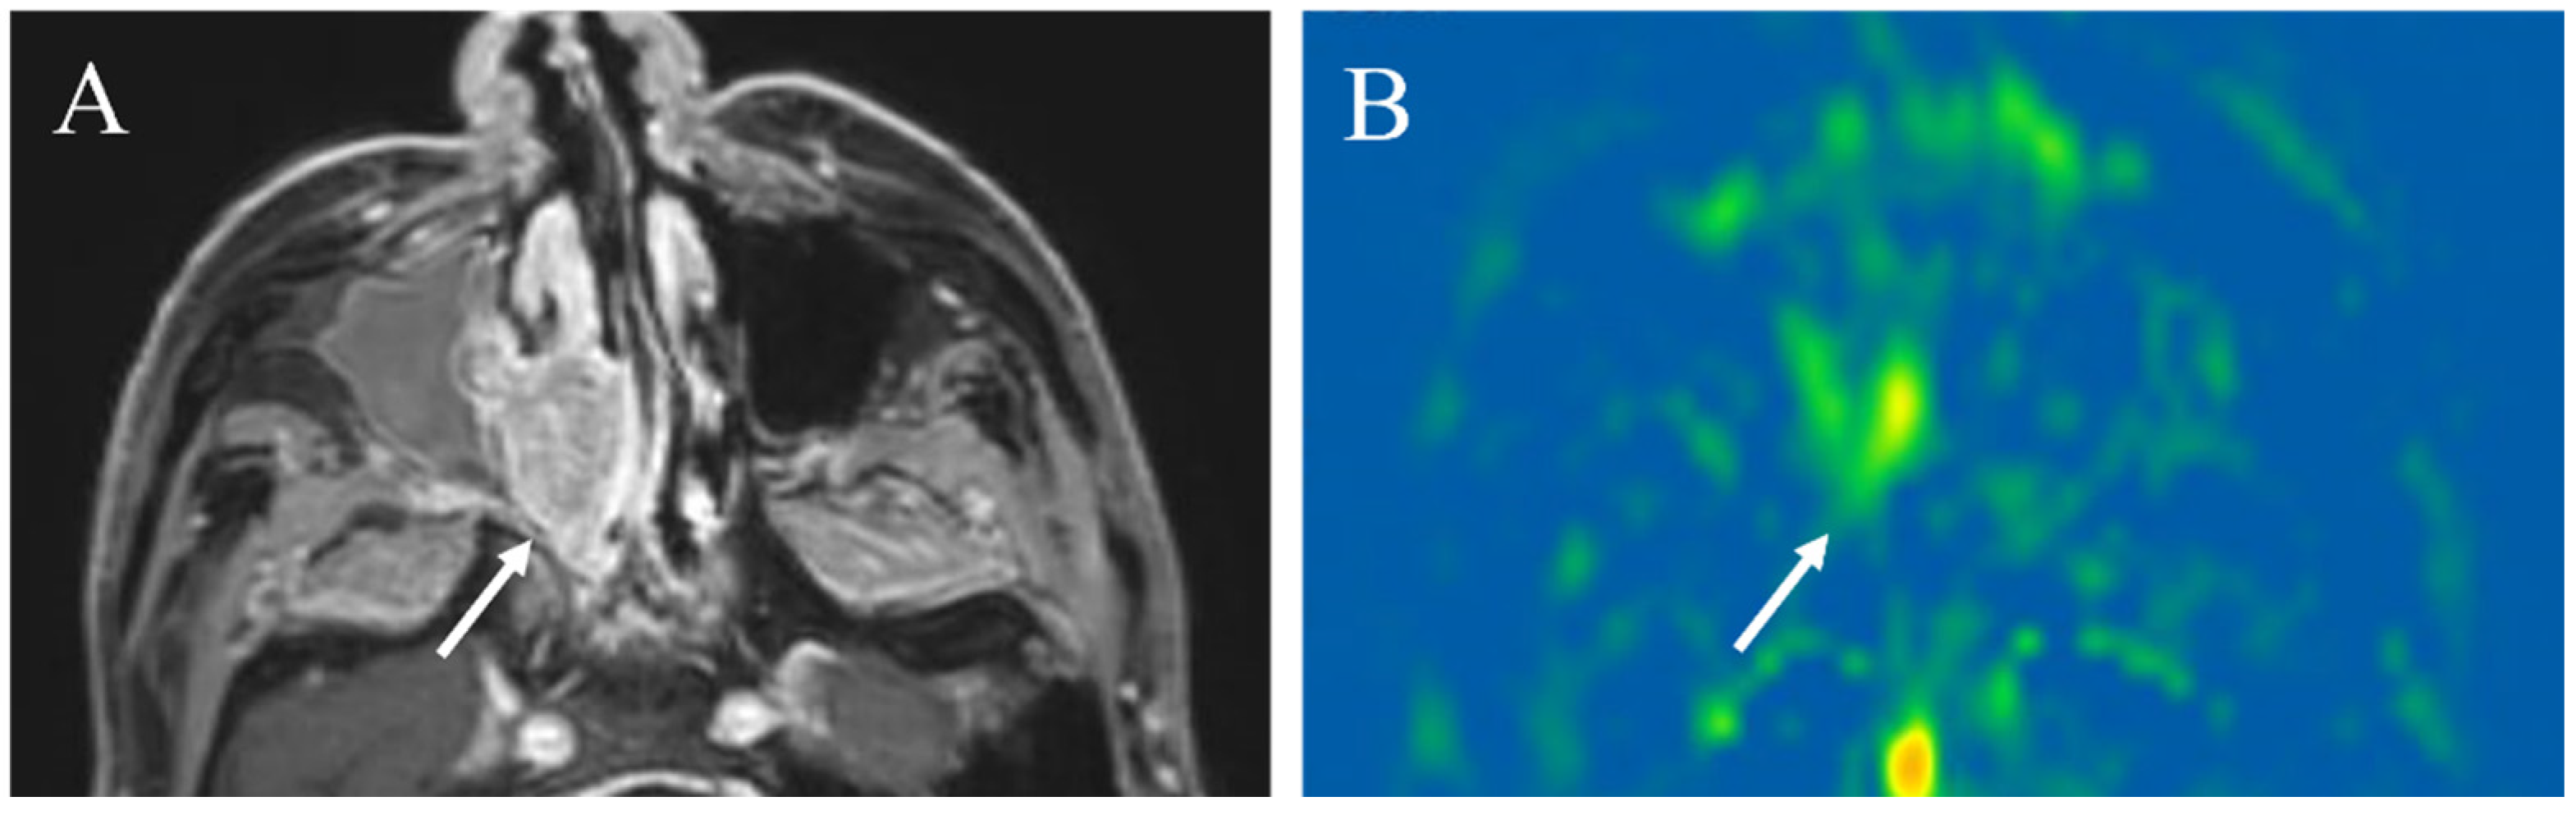
5.1.4. Other Head and Neck Tumors
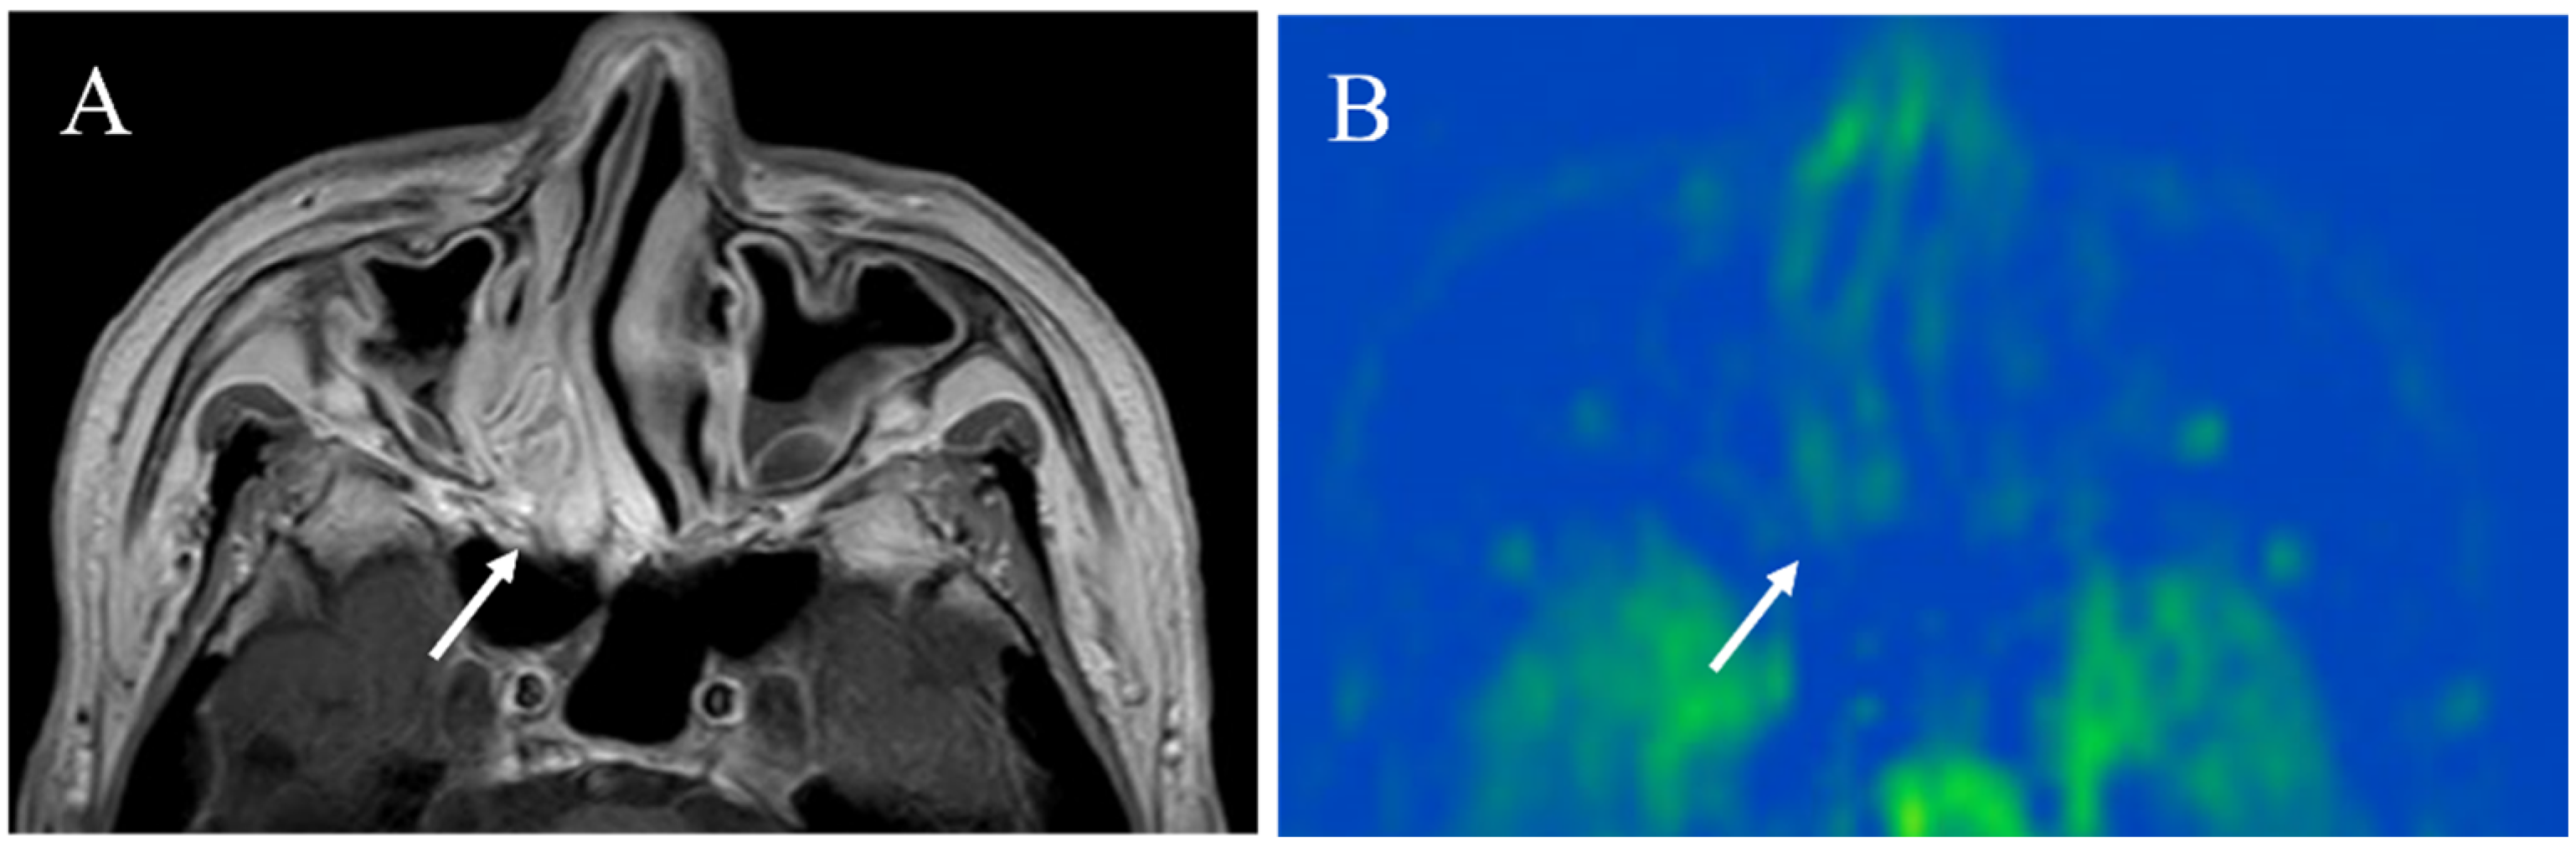
5.2. Evaluation of Squamous Cell Carcinomas Treatment Response
5.3. Prediction of Squamous Cell Carcinomas Prognosis
6. Conclusions and Future Perspectives
Author Contributions
Funding
Conflicts of Interest
References
- Szymanska, A.; Szymanski, M.; Golabek, W.; Drelich-Zbroja, A.; Jargiello, T. Doppler ultrasound appearance of neck tumors. J. Ultrason. 2018, 18, 96–102. [Google Scholar] [CrossRef]
- Wintermark, M.; Sesay, M.; Barbier, E.; Borbely, K.; Dillon, W.P.; Eastwood, J.D.; Glenn, T.C.; Grandin, C.B.; Pedraza, S.; Soustiel, J.F.; et al. Comparative overview of brain perfusion imaging techniques. Stroke 2005, 36, e83–e99. [Google Scholar] [CrossRef] [PubMed]
- Faggioni, L.; Neri, E.; Bartolozzi, C. CT perfusion of head and neck tumors: How we do it. AJR Am. J. Roentgenol. 2010, 194, 62–69. [Google Scholar] [CrossRef] [PubMed]
- Gaddikeri, S.; Gaddikeri, R.S.; Tailor, T.; Anzai, Y. Dynamic Contrast-Enhanced MR Imaging in Head and Neck Cancer: Techniques and Clinical Applications. AJNR Am. J. Neuroradiol. 2016, 37, 588–595. [Google Scholar] [CrossRef]
- Razek, A.A.; Elsorogy, L.G.; Soliman, N.Y.; Nada, N. Dynamic susceptibility contrast perfusion MR imaging in distinguishing malignant from benign head and neck tumors: A pilot study. Eur. J. Radiol. 2011, 77, 73–79. [Google Scholar] [CrossRef]
- Beckett, K.R.; Moriarity, A.K.; Langer, J.M. Safe Use of Contrast Media: What the Radiologist Needs to Know. Radiographics 2015, 35, 1738–1750. [Google Scholar] [CrossRef]
- Marckmann, P.; Skov, L.; Rossen, K.; Dupont, A.; Damholt, M.B.; Heaf, J.G.; Thomsen, H.S. Nephrogenic systemic fibrosis: Suspected causative role of gadodiamide used for contrast-enhanced magnetic resonance imaging. J. Am. Soc. Nephrol. 2006, 17, 2359–2362. [Google Scholar] [CrossRef]
- Stanescu, A.L.; Shaw, D.W.; Murata, N.; Murata, K.; Rutledge, J.C.; Maloney, E.; Maravilla, K.R. Brain tissue gadolinium retention in pediatric patients after contrast-enhanced magnetic resonance exams: Pathological confirmation. Pediatr. Radiol. 2020, 50, 388–396. [Google Scholar] [CrossRef]
- Kobayashi, M.; Levendovszky, S.R.; Hippe, D.S.; Hasegawa, M.; Murata, N.; Murata, K.; Marshall, D.A.; Gonzalez-Cuyar, L.F.; Maravilla, K.R. Comparison of Human Tissue Gadolinium Retention and Elimination between Gadoteridol and Gadobenate. Radiology 2021, 300, 559–569. [Google Scholar] [CrossRef]
- Fujima, N.; Kudo, K.; Yoshida, D.; Homma, A.; Sakashita, T.; Tsukahara, A.; Tha, K.K.; Zaitsu, Y.; Terae, S.; Shirato, H. Arterial spin labeling to determine tumor viability in head and neck cancer before and after treatment. J. Magn. Reason. Imaging 2014, 40, 920–928. [Google Scholar] [CrossRef]
- Wolf, R.L.; Wang, J.; Wang, S.; Melhem, E.R.; O’Rourke, D.M.; Judy, K.D.; Detre, J.A. Grading of CNS neoplasms using continuous arterial spin labeled perfusion MR imaging at 3 Tesla. J. Magn. Reason. Imaging 2005, 22, 475–482. [Google Scholar] [CrossRef] [PubMed]
- Wolf, R.L.; Alsop, D.C.; Levy-Reis, I.; Meyer, P.T.; Maldjian, J.A.; Gonzalez-Atavales, J.; French, J.A.; Alavi, A.; Detre, J.A. Detection of mesial temporal lobe hypoperfusion in patients with temporal lobe epilepsy by use of arterial spin labeled perfusion MR imaging. AJNR Am. J. Neuroradiol. 2001, 22, 1334–1341. [Google Scholar] [PubMed]
- Johnson, N.A.; Jahng, G.H.; Weiner, M.W.; Miller, B.L.; Chui, H.C.; Jagust, W.J.; Gorno-Tempini, M.L.; Schuff, N. Pattern of cerebral hypoperfusion in Alzheimer disease and mild cognitive impairment measured with arterial spin-labeling MR imaging: Initial experience. Radiology 2005, 234, 851–859. [Google Scholar] [CrossRef] [PubMed]
- Kimura, H.; Takeuchi, H.; Koshimoto, Y.; Arishima, H.; Uematsu, H.; Kawamura, Y.; Kubota, T.; Itoh, H. Perfusion imaging of meningioma by using continuous arterial spin-labeling: Comparison with dynamic susceptibility-weighted contrast-enhanced MR images and histopathologic features. AJNR Am. J. Neuroradiol. 2006, 27, 85–93. [Google Scholar]
- Noguchi, T.; Yoshiura, T.; Hiwatashi, A.; Togao, O.; Yamashita, K.; Nagao, E.; Shono, T.; Mizoguchi, M.; Nagata, S.; Sasaki, T.; et al. Perfusion imaging of brain tumors using arterial spin-labeling: Correlation with histopathologic vascular density. AJNR Am. J. Neuroradiol. 2008, 29, 688–693. [Google Scholar] [CrossRef]
- Le, T.T.; Fischbein, N.J.; André, J.B.; Wijman, C.; Rosenberg, J.; Zaharchuk, G. Identification of venous signal on arterial spin labeling improves diagnosis of dural arteriovenous fistulas and small arteriovenous malformations. AJNR Am. J. Neuroradiol. 2012, 33, 61–68. [Google Scholar] [CrossRef]
- Ota, M.; Sato, N.; Nakata, Y.; Ito, K.; Kamiya, K.; Maikusa, N.; Ogawa, M.; Okamoto, T.; Obu, S.; Noda, T.; et al. Abnormalities of cerebral blood flow in multiple sclerosis: A pseudocontinuous arterial spin labeling MRI study. Magn. Reason. Imaging 2013, 31, 990–995. [Google Scholar] [CrossRef]
- Yeom, K.W.; Mitchell, L.A.; Lober, R.M.; Barnes, P.D.; Vogel, H.; Fisher, P.G.; Edwards, M.S. Arterial spin-labeled perfusion of pediatric brain tumors. AJNR Am. J. Neuroradiol. 2014, 35, 395–401. [Google Scholar] [CrossRef]
- Mirasol, R.V.; Bokkers, R.P.; Hernandez, D.A.; Merino, J.G.; Luby, M.; Warach, S.; Latour, L.L. Assessing reperfusion with whole-brain arterial spin labeling: A noninvasive alternative to gadolinium. Stroke 2014, 45, 456–461. [Google Scholar] [CrossRef]
- Lai, G.; Mahadevan, A.; Hackney, D.; Warnke, P.C.; Nigim, F.; Kasper, E.; Wong, E.T.; Carter, B.S.; Chen, C.C. Diagnostic Accuracy of PET, SPECT, and Arterial Spin-Labeling in Differentiating Tumor Recurrence from Necrosis in Cerebral Metastasis after Stereotactic Radiosurgery. AJNR Am. J. Neuroradiol. 2015, 36, 2250–2255. [Google Scholar] [CrossRef]
- Kohno, N.; Okada, K.; Yamagata, S.; Takayoshi, H.; Yamaguchi, S. Distinctive Patterns of Three-Dimensional Arterial Spin-Labeled Perfusion Magnetic Resonance Imaging in Subtypes of Acute Ischemic Stroke. J. Stroke Cerebrovasc. Dis. 2016, 25, 1807–1812. [Google Scholar] [CrossRef] [PubMed]
- Lin, C.M.; Tseng, Y.C.; Hsu, H.L.; Chen, C.J.; Chen, D.Y.; Yan, F.X.; Chiu, W.T. Arterial Spin Labeling Perfusion Study in the Patients with Subacute Mild Traumatic Brain Injury. PLoS ONE 2016, 11, e0149109. [Google Scholar] [CrossRef] [PubMed]
- Wakisaka, K.; Morioka, T.; Shimogawa, T.; Murao, K.; Kanazawa, Y.; Hagiwara, N.; Arakawa, S. Epileptic Ictal Hyperperfusion on Arterial Spin Labeling Perfusion and Diffusion-Weighted Magnetic Resonance Images in Posterior Reversible Encephalopathy Syndrome. J. Stroke Cerebrovasc. Dis. 2016, 25, 228–237. [Google Scholar] [CrossRef] [PubMed]
- Noguchi, T.; Yakushiji, Y.; Nishihara, M.; Togao, O.; Yamashita, K.; Kikuchi, K.; Matsuo, M.; Azama, S.; Irie, H. Arterial Spin-labeling in Central Nervous System Infection. Magn. Reason. Med. Sci. 2016, 15, 386–394. [Google Scholar] [CrossRef] [PubMed]
- Kim, B.S.; Lee, S.T.; Yun, T.J.; Lee, S.K.; Paeng, J.C.; Jun, J.; Kang, K.M.; Choi, S.H.; Kim, J.H.; Sohn, C.H. Capability of arterial spin labeling MR imaging in localizing seizure focus in clinical seizure activity. Eur. J. Radiol. 2016, 85, 1295–1303. [Google Scholar] [CrossRef]
- Wong, A.M.; Yeh, C.H.; Liu, H.L.; Wu, T.W.; Lin, K.L.; Wang, H.S.; Toh, C.H. Arterial spin-labeling perfusion imaging of children with subdural hemorrhage: Perfusion abnormalities in abusive head trauma. J. Neuroradiol. 2017, 44, 281–287. [Google Scholar] [CrossRef]
- Geerts, B.; Leclercq, D.; Tezenas du Montcel, S.; Law-Ye, B.; Gerber, S.; Bernardeschi, D.; Galanaud, D.; Dormont, D.; Pyatigorskaya, N. Characterization of Skull Base Lesions Using Pseudo-Continuous Arterial Spin Labeling. Clin. Neuroradiol. 2019, 29, 75–86. [Google Scholar] [CrossRef]
- Heit, J.J.; Thakur, N.H.; Iv, M.; Fischbein, N.J.; Wintermark, M.; Dodd, R.L.; Steinberg, G.K.; Chang, S.D.; Kapadia, K.B.; Zaharchuk, G. Arterial-spin labeling MRI identifies residual cerebral arteriovenous malformation following stereotactic radiosurgery treatment. J. Neuroradiol. 2020, 47, 13–19. [Google Scholar] [CrossRef]
- Kishi, S.; Maeda, M.; Kogue, R.; Umino, M.; Matsubara, T.; Sakuma, H. Hemangioblastoma of the Cerebellopontine Angle Evaluated with Pseudocontinuous Arterial Spin Labeling. Magn. Reason. Med. Sci. 2021, 20, 18–19. [Google Scholar] [CrossRef]
- Schraml, C.; Müssig, K.; Martirosian, P.; Schwenzer, N.F.; Claussen, C.D.; Häring, H.U.; Balletshofer, B.M.; Schick, F. Autoimmune thyroid disease: Arterial spin-labeling perfusion MR imaging. Radiology 2009, 253, 435–442. [Google Scholar] [CrossRef]
- Kato, H.; Kanematsu, M.; Watanabe, H.; Kajita, K.; Mizuta, K.; Aoki, M.; Okuaki, T. Perfusion imaging of parotid gland tumours: Usefulness of arterial spin labeling for differentiating Warthin’s tumours. Eur. Radiol. 2015, 25, 3247–3254. [Google Scholar] [CrossRef] [PubMed]
- Fujima, N.; Kudo, K.; Tsukahara, A.; Yoshida, D.; Sakashita, T.; Homma, A.; Tha, K.K.; Shirato, H. Measurement of tumor blood flow in head and neck squamous cell carcinoma by pseudo-continuous arterial spin labeling: Comparison with dynamic contrast-enhanced MRI. J. Magn. Reason. Imaging 2015, 41, 983–991. [Google Scholar] [CrossRef] [PubMed]
- Fujima, N.; Yoshida, D.; Sakashita, T.; Homma, A.; Tsukahara, A.; Tha, K.K.; Kudo, K.; Shirato, H. Usefulness of Pseudocontinuous Arterial Spin-Labeling for the Assessment of Patients with Head and Neck Squamous Cell Carcinoma by Measuring Tumor Blood Flow in the Pretreatment and Early Treatment Period. AJNR Am. J. Neuroradiol. 2016, 37, 342–348. [Google Scholar] [CrossRef] [PubMed]
- Kami, Y.N.; Sumi, M.; Takagi, Y.; Sasaki, M.; Uetani, M.; Nakamura, T. Arterial Spin Labeling Imaging for the Parotid Glands of Patients with Sjögren’s Syndrome. PLoS ONE 2016, 11, e0150680. [Google Scholar] [CrossRef]
- Boulouis, G.; Dangouloff-Ros, V.; Boccara, O.; Garabedian, N.; Soupre, V.; Picard, A.; Couloigner, V.; Boddaert, N.; Naggara, O.; Brunelle, F. Arterial Spin-Labeling to Discriminate Pediatric Cervicofacial Soft-Tissue Vascular Anomalies. AJNR Am. J. Neuroradiol. 2017, 38, 633–638. [Google Scholar] [CrossRef]
- Fujima, N.; Shimizu, Y.; Yoshida, D.; Kano, S.; Mizumachi, T.; Homma, A.; Yasuda, K.; Onimaru, R.; Sakai, O.; Kudo, K.; et al. Machine-Learning-Based Prediction of Treatment Outcomes Using MR Imaging-Derived Quantitative Tumor Information in Patients with Sinonasal Squamous Cell Carcinomas: A Preliminary Study. Cancers 2019, 11, 800. [Google Scholar] [CrossRef]
- Tanaka, F.; Umino, M.; Maeda, M.; Nakayama, R.; Inoue, K.; Kogue, R.; Obara, M.; Sakuma, H. Tumor blood flow and apparent diffusion coefficient histogram analysis for differentiating malignant salivary tumors from pleomorphic adenomas and Warthin’s tumors. Sci. Rep. 2022, 12, 5947. [Google Scholar] [CrossRef]
- Alsop, D.C.; Detre, J.A.; Golay, X.; Gunther, M.; Hendrikse, J.; Hernandez-Garcia, L.; Lu, H.; MacIntosh, B.J.; Parkes, L.M.; Smits, M.; et al. Recommended implementation of arterial spin-labeled perfusion MRI for clinical applications: A consensus of the ISMRM perfusion study group and the European consortium for ASL in dementia. Magn. Reason. Med. 2015, 73, 102–116. [Google Scholar] [CrossRef]
- Williams, D.S.; Detre, J.A.; Leigh, J.S.; Koretsky, A.P. Magnetic resonance imaging of perfusion using spin inversion of arterial water. Proc. Natl. Acad. Sci. USA 1992, 89, 212–216. [Google Scholar] [CrossRef]
- Alsop, D.C.; Detre, J.A. Reduced transit-time sensitivity in noninvasive magnetic resonance imaging of human cerebral blood flow. J. Cereb. Blood Flow Metab. 1996, 16, 1236–1249. [Google Scholar] [CrossRef]
- Schraml, C.; Schwenzer, N.F.; Claussen, C.D.; Martirosian, P. Examination of Tissue Perfusion by Arterial Spin Labeling (ASL). Curr. Radiol. Rep. 2013, 1, 93–101. [Google Scholar] [CrossRef][Green Version]
- Martirosian, P.; Boss, A.; Schraml, C.; Schwenzer, N.F.; Graf, H.; Claussen, C.D.; Schick, F. Magnetic resonance perfusion imaging without contrast media. Eur. J. Nucl. Med. Mol. Imaging 2010, 37 (Suppl. S1), S52–S64. [Google Scholar] [CrossRef] [PubMed]
- Buxton, R.B.; Frank, L.R.; Wong, E.C.; Siewert, B.; Warach, S.; Edelman, R.R. A general kinetic model for quantitative perfusion imaging with arterial spin labeling. Magn. Reason. Med. 1998, 40, 383–396. [Google Scholar] [CrossRef]
- Edelman, R.R.; Siewert, B.; Darby, D.G.; Thangaraj, V.; Nobre, A.C.; Mesulam, M.M.; Warach, S. Qualitative mapping of cerebral blood flow and functional localization with echo-planar MR imaging and signal targeting with alternating radio frequency. Radiology 1994, 192, 513–520. [Google Scholar] [CrossRef] [PubMed]
- Petcharunpaisan, S.; Ramalho, J.; Castillo, M. Arterial spin labeling in neuroimaging. World J. Radiol. 2010, 2, 384–398. [Google Scholar] [CrossRef] [PubMed]
- Wong, E.C. An introduction to ASL labeling techniques. J. Magn. Reason. Imaging 2014, 40, 1–10. [Google Scholar] [CrossRef]
- Haller, S.; Zaharchuk, G.; Thomas, D.L.; Lovblad, K.O.; Barkhof, F.; Golay, X. Arterial Spin Labeling Perfusion of the Brain: Emerging Clinical Applications. Radiology 2016, 281, 337–356. [Google Scholar] [CrossRef]
- Dai, W.; Garcia, D.; de Bazelaire, C.; Alsop, D.C. Continuous flow-driven inversion for arterial spin labeling using pulsed radio frequency and gradient fields. Magn. Reason. Med. 2008, 60, 1488–1497. [Google Scholar] [CrossRef]
- Yamamoto, T.; Kimura, H.; Hayashi, K.; Imamura, Y.; Mori, M. Pseudo-continuous arterial spin labeling MR images in Warthin tumors and pleomorphic adenomas of the parotid gland: Qualitative and quantitative analyses and their correlation with histopathologic and DWI and dynamic contrast enhanced MRI findings. Neuroradiology 2018, 60, 803–812. [Google Scholar] [CrossRef]
- Vidorreta, M.; Wang, Z.; Rodriguez, I.; Pastor, M.A.; Detre, J.A.; Fernandez-Seara, M.A. Comparison of 2D and 3D single-shot ASL perfusion fMRI sequences. Neuroimage 2013, 66, 662–671. [Google Scholar] [CrossRef]
- Garcia, D.M.; Duhamel, G.; Alsop, D.C. Efficiency of inversion pulses for background suppressed arterial spin labeling. Magn. Reason. Med. 2005, 54, 366–372. [Google Scholar] [CrossRef]
- Li, Z.; Schär, M.; Wang, D.; Zwart, N.R.; Madhuranthakam, A.J.; Karis, J.P.; Pipe, J.G. Arterial spin labeled perfusion imaging using three-dimensional turbo spin echo with a distributed spiral-in/out trajectory. Magn. Reason. Med. 2016, 75, 266–273. [Google Scholar] [CrossRef] [PubMed]
- Aoike, S.; Sugimori, H.; Fujima, N.; Suzuki, Y.; Shimizu, Y.; Suwa, A.; Ishizaka, K.; Kudo, K. Three-dimensional Pseudo-continuous Arterial Spin-labeling Using Turbo-spin Echo with Pseudo-steady State Readout: A Comparison with Other Major Readout Methods. Magn. Reason. Med. Sci. 2019, 18, 170–177. [Google Scholar] [CrossRef]
- Schakel, T.; Hoogduin, J.M.; Terhaard, C.H.J.; Philippens, M.E.P. Technical Note: Diffusion-weighted MRI with minimal distortion in head-and-neck radiotherapy using a turbo spin echo acquisition method. Med. Phys. 2017, 44, 4188–4193. [Google Scholar] [CrossRef] [PubMed]
- Juan, C.J.; Chang, H.C.; Hsueh, C.J.; Liu, H.S.; Huang, Y.C.; Chung, H.W.; Chen, C.Y.; Kao, H.W.; Huang, G.S. Salivary glands: Echo-planar versus PROPELLER Diffusion-weighted MR imaging for assessment of ADCs. Radiology 2009, 253, 144–152. [Google Scholar] [CrossRef]
- Umino, M.; Maeda, M.; Inoue, K.; Nakayama, R.; Nomoto, Y.; Sakuma, H. Pseudocontinuous Arterial Spin Labeling: Clinical Applications and Usefulness in Head and Neck Entities. In Proceedings of the 104th Radiological Society of North America Annual Meeting, McCormick Place, Chicago, IL, USA, 25–30 November 2018. [Google Scholar]
- Orlandi, M.A.; Pistorio, V.; Guerra, P.A. Ultrasound in sialadenitis. J. Ultrasound 2013, 16, 3–9. [Google Scholar] [CrossRef]
- Koch, M.; Sievert, M.; Iro, H.; Mantsopoulos, K.; Schapher, M. Ultrasound in Inflammatory and Obstructive Salivary Gland Diseases: Own Experiences and a Review of the Literature. J. Clin. Med. 2021, 10, 3547. [Google Scholar] [CrossRef]
- Liu, Y.; Xue, M.; Wang, Z.; Zeng, Q.; Ren, L.; Zhang, Y.; Zhang, S.; Wang, Y.; Shen, D.; Xia, C.; et al. Salivary gland involvement disparities in clinical characteristics of IgG4-related disease: A retrospective study of 428 patients. Rheumatology 2020, 59, 634–640. [Google Scholar] [CrossRef]
- Takahashi, H.; Yamashita, H.; Morooka, M.; Kubota, K.; Takahashi, Y.; Kaneko, H.; Kano, T.; Mimori, A. The utility of FDG-PET/CT and other imaging techniques in the evaluation of IgG4-related disease. Jt. Bone Spine 2014, 81, 331–336. [Google Scholar] [CrossRef] [PubMed]
- Tsuji, S.; Iwamoto, N.; Horai, Y.; Fujikawa, K.; Fujita, Y.; Fukui, S.; Ideguchi, R.; Michitsuji, T.; Nishihata, S.; Okamoto, M.; et al. Comparison of the quantitative measurement of 18F-FDG PET/CT and histopathological findings in IgG4-related disease. Clin. Exp. Rheumatol. 2021, 39, 1338–1344. [Google Scholar] [CrossRef]
- Puxeddu, I.; Capecchi, R.; Carta, F.; Tavoni, A.G.; Migliorini, P.; Puxeddu, R. Salivary Gland Pathology in IgG4-Related Disease: A Comprehensive Review. J. Immunol. Res. 2018, 2018, 6936727. [Google Scholar] [CrossRef] [PubMed]
- Afzelius, P.; Nielsen, M.Y.; Ewertsen, C.; Bloch, K.P. Imaging of the major salivary glands. Clin. Physiol. Funct. Imaging 2016, 36, 1–10. [Google Scholar] [CrossRef] [PubMed]
- van den Berg, R. Imaging and management of head and neck paragangliomas. Eur. Radiol. 2005, 15, 1310–1318. [Google Scholar] [CrossRef] [PubMed]
- Alimli, A.G.; Ucar, M.; Oztunali, C.; Akkan, K.; Boyunaga, O.; Damar, C.; Derinkuyu, B.; Tokgöz, N. Juvenile Nasopharyngeal Angiofibroma: Magnetic Resonance Imaging Findings. J. Belg. Soc. Radiol. 2016, 100, 63. [Google Scholar] [CrossRef]
- Nakamura, M.; Yoneyama, M.; Tabuchi, T.; Takemura, A.; Obara, M.; Sawano, S. Non-contrast time-resolved magnetic resonance angiography combining high resolution multiple phase echo planar imaging based signal targeting and alternating radiofrequency contrast inherent inflow enhanced multi phase angiography combining spatial resolution echo planar imaging based signal targeting and alternating radiofrequency in intracranial arteries. Nihon Hoshasen Gijutsu Gakkai Zasshi 2012, 68, 1525–1532. [Google Scholar] [CrossRef] [PubMed]
- Nakamura, M.; Yoneyama, M.; Tabuchi, T.; Takemura, A.; Obara, M.; Tatsuno, S.; Sawano, S. Vessel-selective, non-contrast enhanced, time-resolved MR angiography with vessel-selective arterial spin labeling technique (CINEMA-SELECT) in intracranial arteries. Radiol. Phys. Technol. 2013, 6, 327–334. [Google Scholar] [CrossRef] [PubMed]
- Hu, H.H.; Pokorney, A.L.; Stefani, N.; Chia, J.M.; Miller, J.H. Non-gadolinium dynamic angiography of the neurovasculature using arterial spin labeling MRI: Preliminary experience in children. MAGMA 2017, 30, 107–112. [Google Scholar] [CrossRef]
- Obara, M.; Togao, O.; Beck, G.M.; Shibukawa, S.; Okuaki, T.; Yoneyama, M.; Nakamura, M.; Honda, H.; Van Cauteren, M. Non-contrast enhanced 4D intracranial MR angiography based on pseudo-continuous arterial spin labeling with the keyhole and view-sharing technique. Magn. Reason. Med. 2018, 80, 719–725. [Google Scholar] [CrossRef] [PubMed]
- Iryo, Y.; Hirai, T.; Kai, Y.; Nakamura, M.; Shigematsu, Y.; Kitajima, M.; Azuma, M.; Komi, M.; Morita, K.; Yamashita, Y. Intracranial dural arteriovenous fistulas: Evaluation with 3-T four-dimensional MR angiography using arterial spin labeling. Radiology 2014, 271, 193–199. [Google Scholar] [CrossRef]
- Obara, M.; Togao, O.; Helle, M.; Murazaki, H.; Wada, T.; Yoneyama, M.; Hamano, H.; Nakamura, M.; Van Cauteren, M. Improved selective visualization of internal and external carotid artery in 4D-MR angiography based on super-selective pseudo-continuous arterial spin labeling combined with CENTRA-keyhole and view-sharing (4D-S-PACK). Magn. Reason. Imaging 2020, 73, 15–22. [Google Scholar] [CrossRef]
- Togao, O.; Hiwatashi, A.; Obara, M.; Yamashita, K.; Momosaka, D.; Nishimura, A.; Arimura, K.; Hata, N.; Yoshimoto, K.; Iihara, K.; et al. 4D ASL-based MR angiography for visualization of distal arteries and leptomeningeal collateral vessels in moyamoya disease: A comparison of techniques. Eur. Radiol. 2018, 28, 4871–4881. [Google Scholar] [CrossRef]
- Togao, O.; Obara, M.; Helle, M.; Yamashita, K.; Kikuchi, K.; Momosaka, D.; Kikuchi, Y.; Nishimura, A.; Arimura, K.; Wada, T.; et al. Vessel-selective 4D-MR angiography using super-selective pseudo-continuous arterial spin labeling may be a useful tool for assessing brain AVM hemodynamics. Eur. Radiol. 2020, 30, 6452–6463. [Google Scholar] [CrossRef]
- Togao, O.; Obara, M.; Kikuchi, K.; Helle, M.; Arimura, K.; Nishimura, A.; Wada, T.; Murazaki, H.; Van Cauteren, M.; Hiwatashi, A.; et al. Vessel-Selective 4D-MRA Using Superselective Pseudocontinuous Arterial Spin-Labeling with Keyhole and View-Sharing for Visualizing Intracranial Dural AVFs. AJNR Am. J. Neuroradiol. 2022, 43, 368–375. [Google Scholar] [CrossRef]
- Takumi, K.; Nagano, H.; Kikuno, H.; Kumagae, Y.; Fukukura, Y.; Yoshiura, T. Differentiating malignant from benign salivary gland lesions: A multiparametric non-contrast MR imaging approach. Sci. Rep. 2021, 11, 2780. [Google Scholar] [CrossRef]
- Just, N. Improving tumour heterogeneity MRI assessment with histograms. Br. J. Cancer 2014, 111, 2205–2213. [Google Scholar] [CrossRef]
- Fujima, N.; Nakamaru, Y.; Sakashita, T.; Homma, A.; Tsukahara, A.; Kudo, K.; Shirato, H. Differentiation of squamous cell carcinoma and inverted papilloma using non-invasive MR perfusion imaging. Dentomaxillofac. Radiol. 2015, 44, 20150074. [Google Scholar] [CrossRef]
- Fujima, N.; Kameda, H.; Tsukahara, A.; Yoshida, D.; Sakashita, T.; Homma, A.; Tha, K.K.; Kudo, K.; Shirato, H. Diagnostic value of tumor blood flow and its histogram analysis obtained with pCASL to differentiate sinonasal malignant lymphoma from squamous cell carcinoma. Eur. J. Radiol. 2015, 84, 2187–2193. [Google Scholar] [CrossRef][Green Version]
- Ahn, Y.; Choi, Y.J.; Sung, Y.S.; Pfeuffer, J.; Suh, C.H.; Chung, S.R.; Baek, J.H.; Lee, J.H. Histogram analysis of arterial spin labeling perfusion data to determine the human papillomavirus status of oropharyngeal squamous cell carcinomas. Neuroradiology 2021, 63, 1345–1352. [Google Scholar] [CrossRef]
- Cao, X.; Song, J.; Xu, J.; Gong, G.; Yang, X.; Su, Y.; Wang, L.; Bai, X.; Hu, M.; Yin, Y. Tumor blood flow is a predictor of radiotherapy response in patients with nasopharyngeal carcinoma. Front. Oncol. 2021, 11, 567954. [Google Scholar] [CrossRef]
- Truong, M.T.; Saito, N.; Ozonoff, A.; Wang, J.; Lee, R.; Qureshi, M.M.; Jalisi, S.; Sakai, O. Prediction of locoregional control in head and neck squamous cell carcinoma with serial CT perfusion during radiotherapy. AJNR Am. J. Neuroradiol. 2011, 32, 1195–1201. [Google Scholar] [CrossRef]


| 2D EP | 3D TSE | |
|---|---|---|
| Repetition time/echo time | 4500/14 | 6000/40 |
| Number of excitations | 36 | 3 |
| Dynamic scan time | 0:09 | 1:48 |
| EPI factor | 35 | 100 |
| Flip angle (°) | 70 | 90 |
| Matrix | 80 × 80 | 80 × 80 |
| Field of view (mm) | 240 | 240 |
| Label gap (mm) | 73.36 | 73.36 |
| Labeling duration (ms) | 1650 | 1650 |
| Post-labeling delay (ms) | 1800 | 1800 |
| Scan time | 5:33 for 22 slices | 5:36 for 44 slices |
| Main Findings | First Author |
|---|---|
| PASL for evaluating thyroid perfusion in autoimmune thyroid disease | Schraml, C. et al. Radiology 2009 [30] |
| PASL for evaluating H&N tumor viability before and after treatment | Fujima, N. et al. J. Magn. Reson. Imaging 2014 [10] |
| TBF in H&N SCC by pCASL as compared with DCE perfusion | Fujima, N. et al. J. Magn. Reson. Imaging 2015 [32] |
| pCASL for assessing the treatment response in H&N SCC | Fujima, N. et al. AJNR Am. J. Neuroradiol. 2016 [33] |
| pCASL for evaluating parotid gland of Sjögren’s syndrome | Kami, Y.N. et al. PLoS ONE 2016 [34] |
| PASL for differentiating WT from PA and MT in parotid gland | Kato, H. et al. Eur. Radiol. 2015 [31] |
| pCASL for differentiating H&N SCC from inverted papilloma | Fujima, N. et al. Dentomaxillofac. Radiol. 2015 [78] |
| pCASL for differentiating H&N SCC from malignant lymphoma | Fujima, N. et al. Eur. J. Radiol. 2015 [79] |
| pCASL for differentiating WT from PA, evaluating correlation between TBF and microvessel density | Yamamoto, T. et al. Neuroradiology 2018 [49] |
| Machine learning using pCASL for prediction of treatment outcome in SCC | Fujima, N. et al. Cancers 2019 [36] |
| pCASL for differentiating HPV status using histogram analysis | Ahn, Y. et al. Neuroradiology 2021 [80] |
| pCASL for assessing the treatment response in H&N SCC | Cao, X. et al. Front. Oncol. 2021 [81] |
| pCASL for differentiating MT from PA and WT using histogram analysis | Tanaka, F. et al. Sci. Rep. 2022 [37] |
Publisher’s Note: MDPI stays neutral with regard to jurisdictional claims in published maps and institutional affiliations. |
© 2022 by the authors. Licensee MDPI, Basel, Switzerland. This article is an open access article distributed under the terms and conditions of the Creative Commons Attribution (CC BY) license (https://creativecommons.org/licenses/by/4.0/).
Share and Cite
Tanaka, F.; Umino, M.; Maeda, M.; Nakayama, R.; Inoue, K.; Kogue, R.; Obara, M.; Sakuma, H. Pseudocontinuous Arterial Spin Labeling: Clinical Applications and Usefulness in Head and Neck Entities. Cancers 2022, 14, 3872. https://doi.org/10.3390/cancers14163872
Tanaka F, Umino M, Maeda M, Nakayama R, Inoue K, Kogue R, Obara M, Sakuma H. Pseudocontinuous Arterial Spin Labeling: Clinical Applications and Usefulness in Head and Neck Entities. Cancers. 2022; 14(16):3872. https://doi.org/10.3390/cancers14163872
Chicago/Turabian StyleTanaka, Fumine, Maki Umino, Masayuki Maeda, Ryohei Nakayama, Katsuhiro Inoue, Ryota Kogue, Makoto Obara, and Hajime Sakuma. 2022. "Pseudocontinuous Arterial Spin Labeling: Clinical Applications and Usefulness in Head and Neck Entities" Cancers 14, no. 16: 3872. https://doi.org/10.3390/cancers14163872
APA StyleTanaka, F., Umino, M., Maeda, M., Nakayama, R., Inoue, K., Kogue, R., Obara, M., & Sakuma, H. (2022). Pseudocontinuous Arterial Spin Labeling: Clinical Applications and Usefulness in Head and Neck Entities. Cancers, 14(16), 3872. https://doi.org/10.3390/cancers14163872